analysis of damping characteristics of a cable …
TRANSCRIPT

181
Structural Eng./Earthquake Eng. Vol. 7. No. 1, 169 s-178 s. April 1990 Japan Society of Civil Engineers (Proc. of JSCE No. 416/1-13)
ANALYSIS OF DAMPING CHARACTERISTICS OF A CABLE
STAYED BRIDGE BASED ON STRONG MOTION RECORDS
By Kazuhiko KA WASHIMA*, Shigeki UNJOH** and Youichi AZUTA***
Damping characteristics are significant factors for seismic design of a cable stayed
bridge. It is general in seismic design to assume a damping ratio of approximately 2-5%
of critical for superstructure. However, damping ratio which has so far been estimated
from field observation such as forced vibration test is generally much smaller than those
values. This study presents an analysis on the damping characteristics of a cable stayed
bridge where strong motion records have been accumulated. Damping characteristics are
analyzed through analytical simulation for the measured response by varying the damping
ratio assumed in the analysis. It is concluded from the analysis that the damping ratio
which gives the best correlation in response analysis simulation is 2% and p-1% of cri-
tical in longitudinal and transverse direction, respectively, for the tower, and 5% in
both directions for the deck.
Keywords: cable stayed bridge, damping characteristics, strong motion records, seismic
design
1. INTRODUCTION
Although cable stayed bridges have been constructed at various countries, little is known about the
seismic behavior subjected to a significant earthquake. Special interests are extended to damping
characteristics of cable stayed bridges. It is often claimed that the damping ratio assumed in seismic design
is much larger than that assumed in wind resistant design. It is general in seismic design to assume a
damping ratio of approximately 2-5% of critical for superstructure. However, damping ratio which has so
far been estimated from field observation such as forced vibration test is generally much smaller than those
values. Damping ratio of superstructure in vertical direction often takes a value far less than 1% of
critical1),2). Reflecting those evidences, the damping ratio assumed in wind resistant design is considerably
smaller than the value assumed in seismic design. Because the structural response of a cable stayed bridge
significantly depends on the damping ratio, correct estimation of the damping ratio is of critical importance
in seismic design of a cable stayed bridge.
Because evaluation of the damping characteristics of a cable stayed bridge by analytical procedure is
limited, field observations such as forced vibration test have been made. However, structural response
developed by such forced vibration test is generally smaller in amplitude than that developed during a
significant earthquake. Therefore it is often claimed that the damping ratio evaluated from the forced
vibration test only gives the damping characteristics associated with small structural response. Evaluation
of the damping characteristics which is actually developed during an earthquake is therefore of
considerable interest.
* Member of JSCE, Dr. Eng., Head of Earthquake Engineering Division, Earthquake Disaster Prevention Department, Public
Works Research Institute, Ministry of Construction (Tsukuba Science City, Ibaraki-ken, Japan) ** Member of JSCE, Research Engineer, ditto.
*** Member of JSCE, Assistant Research Engineer, ditto.
169s

182 K, KAWASHIMA, S, UNJOH and Y. AZUTA
This study presents an analysis of the damping characteristics of a cable stayed bridge where strong
motion records have been accumulated in the past three and a half years.
2. SUIGO BRIDGE AND ITS DYNAMIC PROPERTIES
Suigo Bridge is located at the border between Chiba-ken and Ibaraki-ken on National Road No. 51.
Suigo Bridge consists of a two-span continuous cable stayed bridge as shown in Fig. 1 and steel plate
girders which are placed on both sides of the cable stayed bridge. Total length of Suigo Bridge is 1 040m. Because the cable stayed bridge is isolated from the adjacent steel plate girders, considered in this study is
only the cable stayed bridge, and this is refered as the Suigo Bridge hereinafter.
The deck of the Suigo Bridge is of steel box girder with the length of 290.45m3)-5). The deck is rigidly
connected with a single steel tower with the height of 47.2m. The superstructure is supported by three
substructures, i.e., two caisson foundations and a pile foundation. Fixed bearings are provided on the
midsubstructure to connect and prevent the deck movement in both longitudinal and transverse directions.
On the both end foundations, provided are movable bearings which prevent the deck movement in only
transverse direction.
A series of forced vibration tests was conducted at Suigo Bridge soon after the completion to study the
frequency and damping characteristics from the view point of aerodynamic stability analysis4). Two electric
excitors, which produce sinusoidal force in vertical direction by rotating a set of unbalanced masses, were
placed on the deck, and forced excitation for either vertical or torsional mode was made by synchronizing and anti-synchronizing the two excitors. Because the test was made to study aerodynamic stability,
excitation in longitudinal and transverse directions, which are of significant importance for seismic
design, was not made.
Natural modes and natural frequencies were accurately estimated for some of the lower significant modes
from the steady-state oscillation of the superstructure. As an example of the test results, Fig. 2 shows
resonant curves of response acceleration excited in vertical direction. They are normalized by the
excitation force. Resonance corresponding to first through fourth vertical bending modes can be clearly
observed. Mode shape was obtained by plotting the measured response acceleration at various locations
along the deck. Fig. 3 shows the comparison between the observed and the computed mode shape for the
first through fourth vertical bending modes. Predicted mode shape was computed with use of a discrete
analytical model which will be described later, The measured mode shape of the deck is accurately
predicted by the analytical model4).
Damping ratio was estimated from logarithmic decay of the free oscillation from the steady-state
vibration. Damping ratio of critical, which is estimated from the logarithmic damping ratio, is presented in
Fig. 1 Suigo Bridge.
(a) SIDE VIEW
(b) CROSS SECTION OF DECK (c) CROSS SECTION OF TOWER
170s

Analysis of Damping Characteristics of a Cable Stayed Bridge Based on Strong Motion Records 183
Table 1. It varies depending on mode. The damping ratio averaged over the modes for which the damping ratio was estimated is 0.99% of critical for vertical bending mode and 1.1% for torsional mode.
3. STRONG MOTION OBSERVATION AND STRONG MOTION RECORDS
Strong motion observation has been made at the bridge since March 1986. Two horizontal-components
force-balanced accelerometers are placed at six points as shown in Fig. 1, i.e., tower top (designated
hereinafter as A 1 point), mid-height of the tower (A 2 point), bottom of the tower (A 3 point), center of
the girder (A 4 and A 5 points), and 15m below ground surface 50 m apart from the tower (A 6 point). A
digital data acquisition system with a delay memory of 10 second is used so that acceleration records with
equal time interval of 1/100 second can be obtained.
Thirty five records have been so far obtained. Although most of them were developed by small
earthquakes in magnitude, three records with sufficiently large accelerations were obtained by the
earthquakes as shown in Table 2. Table 3 represents the peak acceleration thus obtained. The EQ-33 in
Table 2 is the East Chiba-ken Earthquake which caused a large shaking with JMA Intensity of V at the
Tokyo Metropolitan area on December 17, 1987.
As an example of the records, Fig. 4 shows the accelerations by the East Chiba-ken Earthquake
(EQ-33). Of particular importance is the large response at the tower top (A 1 point) in transverse direction. Peak acceleration at A 1 point reached to 999. 8 gal. Because the peak acceleration at the
mid-height (A 2 point) and the bottom (A 3 point) of the tower is 471 gal and 173 gal, respectively, it is
Fig. 2 Resonant Curve Obtained from Forced Excitation Test (4) .
Table 1 Damping Ratio of Critical (%) Estimated from Free Oscillation Test (4).
Fig. 3 Measured and Computed Mode
Shapes (4).
LEGEND
● FORCED EXCITATION TEST
- ANALYSIS
IST VERTICAL BENDING
MODE (f=0.454Hz)
2ND VERTICAL BENDING
MODE (f=0.852Hz)
3RD VERTICAL BENDING MODE (f=1.26Hz)
4TH VERTICAL BENDING MODE (f=2.03Hz)
Table 2 Magnitude and Location of Major Earthquakes.
171s

184 K, KAWASHIMA, S, UNJOH and Y. AZUTA
obvious that the tower vibrated in accordance with a cantilevered mode shape. In longitudinal direction,
the peak acceleration is 446 gal at tower top (A 1 point), 297 gal at the mid-height (A 2 point) and 216 gal
at the bottom of the tower (A 3 point), respectively. They are approximately 50% smaller than those
values in transverse direction.
4. RESPONSE CHARACTERISTICS THROUGH ANALYSIS OF STRONG MOTION RECORDS
Fig. 5 shows the Fourier spectra of the acceleration records presented in Fig. 4. Frequency of 1. 51 Hz
in longitudinal direction and 0. 72 Hz, 0. 87 Hz and 1. 22 Hz in transverse direction is predominantly
observed in the response of the deck and tower. Ground response recorded by the down-hole accelerometer
has a predominant frequency of 0. 87 Hz in both longitudinal and transverse directions. One can also note
by carefully observing Fig. 5 that the frequency of 4. 60 Hz in longitudinal direction and 5. 26 Hz in
transverse direction is also predominant in the response of the tower top (A 1 point).
To evaluate the vibration mode of the bridge, the acceleration records were processed with a band-pass
filter, in which the center frequency was so adjusted that it matches with the predominant frequency
observed in the Fourier spectra. Then, the acceleration amplitudes at the same instance after processed
with the band-pass filter were plotted to obtain the vibration mode. Few variation of such vibration mode
was observed even if the time instance for which the acceleration amplitudes are plotted is changed.
Fig. 6 shows the vibration mode thus evaluated from the acceleration records. Translational mode with the
Table 3 Peak Accelerations at Suigo Bridge.
1) LG and TR represent peak acceleration in longitudinal and transverse direction, respectively.
2) Records in transverse direction at A4 point were not obtained due to malfunction of the accelerometer.
Fig. 4 Acceleration Records during East Chiba-ken Earthquake (EQ-33).
(a) LONGITUDINAL DIRECTION
TOP OF TOWER(A1)
MID POINT OF TOWER(A2)
BOTTOM OF TOWER(A3)
CENTER OF GIRDER(A4)
CENTER OF GIRDER(A5)
DOWN-HOLE (A6)
(b) TRANSVERSE DIRECTION
TOP OF TOWER(A1)
MID POINT OF TOWER(A2)
BOTTOM OF TOWER(A3)
CENTER OF GIRDER(A5)
DOWN-HOLE(A6)
172s

Analysis of Damping Characteristics of a Cable Stayed Bridge Based on Strong Motion Records 185
predominant frequency of 1. 51 Hz and first flexural mode of the tower with the predominant frequency of 4. 60 Hz are observed in the vibration mode in longitudinal direction. On the other hand, first and second
flexural mode of the tower with the predominant frequency of 0. 72 Hz, 1. 22 Hz and 5. 26 Hz are observed
in the vibration mode in transverse direction.
To analyze the natural frequency and natural mode, Suigo Bridge was idealized by a linear discrete
analytical model as shown in Fig. 7. The cross section and material properties were evaluated from the
design calculation sheets. The cables are idealized as elastic beams with axial stiffness assuming zero
stiffness for flexure. Because in the response in transverse direction the cable motion is decoupled with
Fig. 5 Fourier Spectra of Strong Motion Record.
(a) LONGITUDINAL DiRECTION (b) TRANSVERSE DIRECTION
Fig. 6 Vibration Modes Obtained from
Strong Motion Data.
(a) LONGITUDINAL
1.51Hz
4.60Hz
(b) TRANSVERSE
0.72Nz
1.22Hz
5.26Hz
Fig. 7 Analytical Idealization.
Ai11=1.2...5) OBSERVATION POINTS
NUMBER OF NODAL POINTS 61NUMBER OF ELEMENTS 66
173s

1 86 K, KAWASHIMA, S, UNJOH and Y. AZUTA
the deck and tower motion, mass of the cable was disregarded, for simplicity, for analyzing the tower and
deck response. Both ends of the deck, which are supported by the movable supports, are assumed free to
move in longitudinal direction and fixed in transverse direction. Friction developed associated with
relative movement of the deck at the movable supports was disregarded in the analytical idealization.
Although the friction at the movable supports results in damping6), its effect for the computed natural mode
and natural frequency is generally less significant for large bridges like Suigo Bridge.
Fig. 8 shows the mode shapes and natural frequencies computed for typical modes. It should be reminded
here that the first through fourth vertical bending modes presented in Fig. 3, which were estimated from
the forced vibration test, would correspond to 1st, 6th, 9th and 10th predicted mode, respectively.
Computed natural frequencies and mode shapes for those vertical bending modes agree well with the
measured values.
On the other hand, by comparing Fig. 8 with Fig. 6, one can see how the computed modes agree with the
measured vibration modes from the strong motion records. It is seen that the measured vibration mode in
longitudinal direction with the predominant frequency of 4. 60 Hz in Fig. 6 would correspond to the
predicted 23 rd natural mode, because of the close agreement in both the frequency and mode shape. It is also seen that the measured vibration mode in transverse direction with the predominant frequency
of 0. 72 Hz, 1. 22 Hz and 5. 26 Hz in Fig. 6 would correspond to the predicted 1st, 2nd and 10th modes,
respectively. However, it should be noted here that there is not a predicted mode which corresponds to the
measured vibration mode in longitudinal derection with the predominant frequency of 1. 51 Hz. This is
considered to be attributed to the assumption that the only superstructure of Suigo Bridge is idealized in
the analytical prediction disregarding the substructure. Therefore, the mode shape was again computed by
including the substructure into the analytical model, and a mode with a natural frequency of 1. 52 Hz, which
has a mode with the translational motion of the tower, was obtained. Rocking motion of the foundation is
predominantly developed in this mode. This results in the translation of the tower and the deck. Therefore, it is obviously understood that the vibration mode in longitudinal direction with the
predominant frequency of 1. 51 Hz is likely to correspond to the rocking motion of the substructure which supports the tower. It should be noted however that the inclusion of the substructure into the analytical
idealization develops few differences in the predicted mode shape and natural frequency in the low
frequency range, with the exception of the new inclusion of the predicted mode with the natural frequency
of 1. 52Hz.
Fig. 8 Computed Mode Shapes.
(a) LONGITUDINAL
IST (0.42Hz)
6TH (0.81Hz)
9TH (1.24Hz)
IOTH (1.97Hz)
23RD (4.58Hz)
(b) TRANSVERSE
IST (0.74Hz)
2ND (1.27Hz)
IOTH (5.09Hz)
174s
Analysis of Damping Characteristics of a Cable Stayed Bridge Based on Strong Motion Records 187
5. DYNAMIC RESPONSE ANALYSIS OF SUIGO BRIDGE
Damping characteristics of Suigo Bridge are analyzed through analytical simulations for the measured
response by varying the damping ratio assumed in the analysis. The analysis is made by a standard modal
analysis method assuming modal damping ratio7). Because the response acceleration at the bottom of the
tower (A 3 point) was recorded, it is prescribed to the A 3 point of the analytical model as an input motion,
and the response of the superstructure is computed. Analytical idealization presented in Fig. 7 is used for
the simulation.
The analysis is made separately for the response in longitudinal and transverse directions. In the
response analysis in longitudinal direction, because the deck is supported by means of the movable supports
at the both ends, the response acceleration measured at A 3 point is prescribed as an input motion only to
this point, and the effect of friction at the movable bearings was disregarded. On the other hand, in the
response analysis in transverse direction the analytical model is subjected to the same input acceleration
measured at A 3 point at the three supports, assuming that the deck response at both ends is identical with the response at A 3 point.
It should be reminded here that the analytical model presented in Fig, 7 does not include the substructure. Inclusion of the substructure develops the mode with the natural frequency of 1. 52 Hz which
. is predominantly observed in the measured acceleration. However as was described in the proceeding
section because this mode is of rocking motion of the substructure, only rigid translation of the deck and
tower occures. Because the measured response at the bottom of the tower (A 3 point) includes such
movement as a result of the rocking motion of the substructure, disregard of this mode does not cause
significant error to compute the response of the superstructure.
Damping ratio assumed in the analysis was varied as 0%, 1%, 2% and 5 % of critical as a parameter to
be studied. Although it is anticipated that the damping ratio varies depending on mode, it is assumed here
the same for all modes because the dependence of the damping ratio on each mode is not known.
Analysis was made for the three records presented in Table 2. As an example, Fig. 9 shows comparative
plots of acceleration time history between the measured and the predicted results at the tower top
(A 1 point) and the center of the girder (A 5 point) for the East Chiba-ken Earthquake of December 1987
(EQ-33). It is obvious that the damping ratio of 0% gives larger response of the tower in longitudinal direction than the measured acceleration and that 5 % damping ratio would be appropriate to develop a close
correlation between the predicted and the measured accelerations. Overall predicted response accelera-
tions assuming the 5% damping ratio agree well with the measured accelerations. However, for the
response at the tower top (A 1 point) in transverse direction, the damping ratio of 5 % is an
overestimation, and 0% damping ratio would be appropriate. It is interesting to note such a clear difference in the damping ratio, which give the best correlation between the predicted and the measured
responses at the tower, depending on the direction. On the other hand, for the deck response, 5 % damping
ratio gives a nice agreement in both longitudinal and transverse directions. Although the comparative plots
for other measuring points (A 2 and A 4) and for two other earthquakes are not presented here, agreement
of the predicted response at those points with the measured acceleration is more or less the same with
Fig. 9.
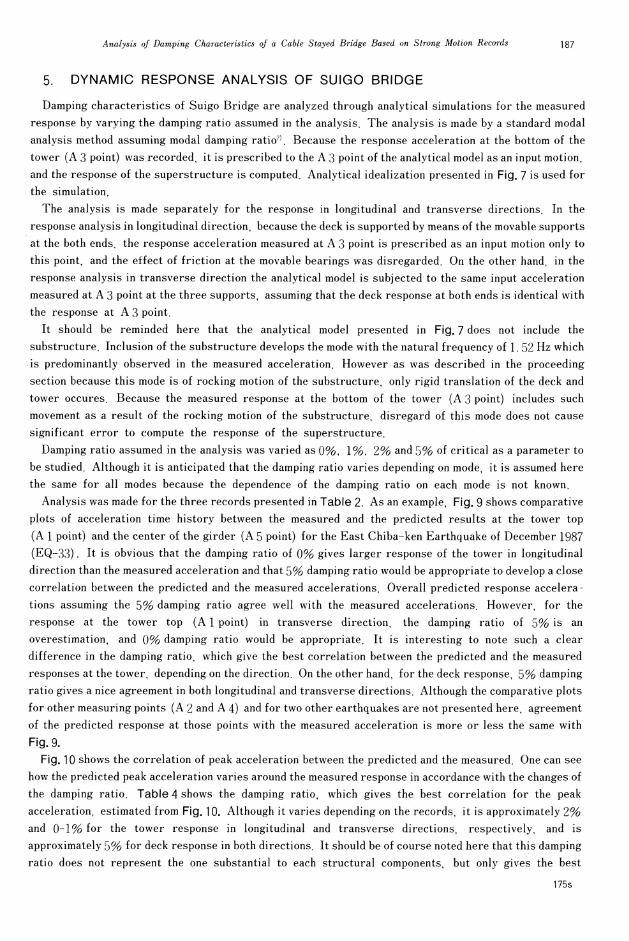
Fig. 10 shows the correlation of peak acceleration between the predicted and the measured. One can see
how the predicted peak acceleration varies around the measured response in accordance with the changes of
the damping ratio. Table 4 shows the damping ratio, which gives the best correlation for the peak
acceleration, estimated from Fig. 10. Although it varies depending on the records, it is approximately 2 %
and 0-1% for the tower response in longitudinal and transverse directions, respectively, and is
approximately 5 % for deck response in both directions. It should be of course noted here that this damping
ratio does not represent the one substantial to each structural components, but only gives the best
175s

188 K, KAWASHIMA, S, UNJOH and Y. AZUTA
correlation at each recording point provided this value is assumed for all modes in the analysis. However,
when the effect of mode coupling between the tower and the deck is less significant, the damping ratio
presented in Table 4 may be approximately considered as the damping ratio associated with the tower and the deck.
It is interesting to compare the damping ratio presented in Table 4 with the one estimated from the
forced vibration test. The forced vibration test gives the damping ratio of 0.99% and 1. 1% of critical for
Fig. 9 Comparative Plot of Acceleration Response between Measured and Computed (East Chiba-ken Earthquake
of December 17, 1987 (EQ-33)).
(1) Tower Top (A 1 Point)
(a) LONGITUDINAL
LEGEND- OBSERVED
--- COMPUTEDh=0%
h=1%
h=2%
h=5%
(b) TRANSVERSE
LEGEND
- OBSERVED--- CMPUTED
h=0%
h=1%
h=2%
h=5%
(2) Center of Deck (A5 Point)(a) LONGITUDINAL
LEGEND- OBSERVED
--- COMPUTED
h=0%
h=1%
h=2%
h=5%
(b) TRANSVERSE
LEGEND
- OBSERVED--- COMPUTED
h=0%
h=1%
h=2%
h=5%
176s
Analysis of Damping Characteristics of a Cable Stayed Bridge Based on Strong Motion Records 189
the vertical bending and the torsional modes, respectively. These values are rather close with the ones
presented in Table 4 for the tower, but are considerably smaller for the deck. The reason for such large discrepancy of the damping ratio may be attributed to the difference of mode shape and difference of
amplitude of vibration, etc. Although this requires further analysis, it is of great importance to point out
in this analysis that the damping ratio estimated for the response in longitudinal and transverse direction
from the strong motion record is different from the one estimated for vertical and torsional modes from the
forced vibration test.
It is also interesting to note the difference of the damping ratio of the tower depending on direction; the
damping ratio of the tower in transverse direction is smaller than that in longitudinal direction. This may
be due to the effect of cables. Because flexural rigidity of the cables is negligibly small, the tower is
almost free to move from cables in transverse direction. Therefore the tower may be considered as a free
standing column. Damping ratio of free standing column which is of steel box section is, generally,
substantially small, and it seems reasonable to take a damping ratio of 0-1%. On the other hand, in
longitudinal direction, the tower is no more free standing column but is coupled with the deck by means of
the cables. Therefore it is reasonable that the tower takes larger damping ratio in longitudinal direction
than in transverse direction.
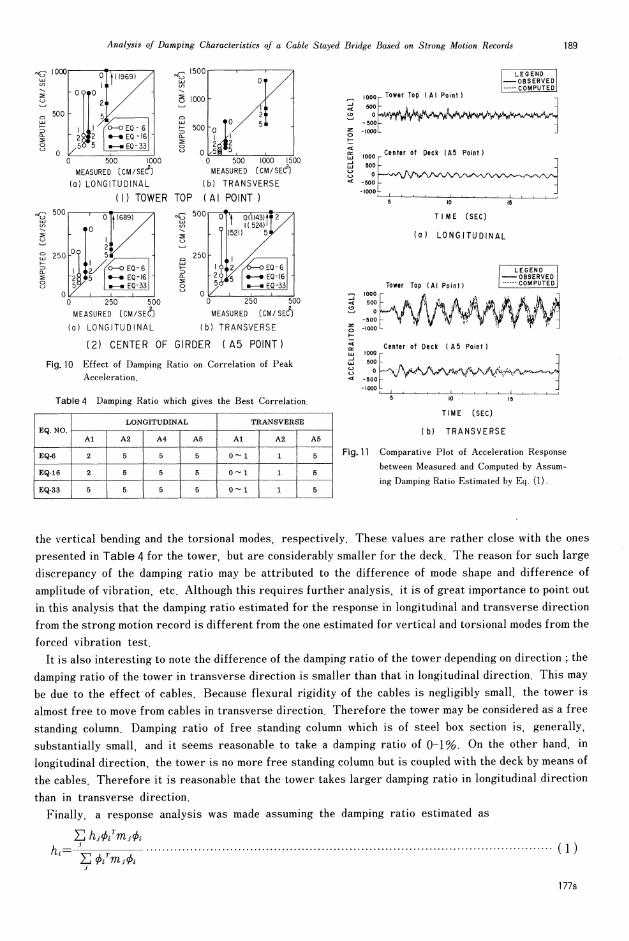
Finally, a response analysis was made assuming the damping ratio estimated as
(1)
Fig. 10 Effect of Damping Ratio on Correlation of Peak
Acceleration
(I) TOWER TOP (AI POINT)
(a) LONGITUDINAL (b) TRANSVERSE
(2) CENTER OF GIRDER (A5 POINT)
(a) LONGITUDINAL (b) TRANSVERSE
Table 4 Damping Ratio which gives the Best Correlation.
Fig. 11 Comparative Plot of Acceleration Response
between Measured and Computed by Assum-
ing Damping Ratio Estimated by Eq. (1).
(a) LONGITUDINAL
LEGEND
- OBSERVED--- COMPUTED
Tower Top (AI Point)
Center of Deck (A5 Point)
(b) TRANSVERSE
LEGEND- OBSERVED
--- COMPUTEDTower Top (A) Point)
Center of Deck (A5 Point)
177s

190 K, KAWASHIMA, S, UNJOH and Y, AZUTA
in which hi: damping ratio for i-th mode, hj: damping ratio assumed for j-th element, ci: mode vector for i-th mode, mj: mass matrix for j-th element. Damping ratio of the tower is assumed from Table 4 as
2% in longitudinal direction and 0% in transverse direction. Damping ratio of the deck is assumed as 5% in
both directions. Fig. 11 shows the comparison of acceleration response thus computed. Good agreement can be seen for
both the tower and the deck.
6. CONCLUSIONS
For studying damping characteristics of Suigo Bridge, which is of two span continuous steel cable stayed
bridge, an analysis was made for the strong motion records obtained at the bridge. Dynamic response
analysis simulation was also made. From the results presented herein, the following conclusions may be
deduced;
(1) Damping ratio which gives best correlation in response analysis simulation for peak response acceleration is 2 % and 0-1% of critical in longitudinal and transverse direction, respectively, for the
tower, and 5 % in both directions for the deck.
(2) Damping ratio estimated from a forced excitation test is approximately 0. 99% for vertical bending mode and 1. 1 % for torsional mode. The damping ratio estimated for the response in longitudinal and transverse direction from the strong motion records is substantially different from the one estimated
for vertical bending and torsional modes from the forced excitation test.
(3) The fact that the mode shape for which the damping ratio is estimated is different seems the most favorable reason for such large discrepancy in the damping ratio described in (2).
ACKNOWLEDGEMENT
The authors express their sincere appreciation to Chiba Road Construction Office, Kanto Regional
Construction Bureau of the Ministry of Construction, for their supports for strong motion observation at
Suigo Bridge.
REFERENCES1) Ito, M.: Damping Characteristics of Bridge Superstructure, KABSE, 1986 (in Japanese).
2) Kawashima, K., Unjoh, S, and Azuta, Y.: Seismic Design Procedure of Cable Stayed Bridge Part 1 Dynamic Characteristics
of Cable Stayed Bridge Based on Field Vibration Test Results-, Technical Note of the Public Works Research Institute,
No. 2388, 1986 (in Japanese).
3) Shimizu, H., Ohta, Y. and Koyama, S.: Design and Construction of Suigo Bridge, Bridges and Foundations, Vol. 78, No. 4,
1978 (in Japanese).
4) Narita, N.: Forced Vibration Test of Suigo Bridge, Technical Note of the Public Works Research Institute, No. 1349, 1978 (in
Japanese).
5) Kawashima, K., Unjoh, S, and Azuta, Y.: Seismic Design Procedure of Cable-Stayed Bridges Part 6 Dynamic Characteris-
tics of Suigoh Bridge Based on Strong Motion Records Technical Note of the Public Works Research Institute, No. 2673, 1988
(in Japanese).
6) Kawashima, K. and Unjoh, S.: Damping Characteristics of Cable Stayed Bridges associated with Energy Dissipation at Movable
Supports, Structural Eng. /Earthquake Eng., Vol. 6, No. 1, 1989.
7) Clough, R. W. and Penzien, J.: Dynamics of Structures, McGraw-Hill, 1975.
(Received September 1989)
178s