analysis of cycling potential - transport for london · · 2016-04-11the goal of this analysis is...
TRANSCRIPT


Analysis of Cycling Potential
Policy Analysis Research Report
December 2010
© Transport for London 2010
All rights reserved. Reproduction permitted for research, private study and internal circulation within an
organisation. Extracts may be reproduced provided the source is acknowledged.
Disclaimer
This publication is intended to provide accurate information. However, TfL and the authors accept no liability
or responsibility for any errors or omissions or for any damage or loss arising from use of the information
provided.
Analysis of Cycling Potential
1
Contents
Introduction 2
Executive Summary 4
Chapter 1 Identifying the potential for growth in cycle travel amongst Londoners
Identifying potentially cyclable trips
Potentially cyclable trips by current mode
Potentially cyclable trips by purpose
Potentially cyclable trips by day and time
Current and potential cycle trips by distance and time taken
8
8
10
12
13
13
Chapter 2 Where is the greatest potential for growth in cycle travel?
Location of potentially cyclable trips
Areas with high density cycling potential
Inner London beyond the Cycle Hire Zone
Olympic area
Inner south London and Croydon
16
16
19
20
20
21
Chapter 3 Cycling potential by sub-region and borough
Introducing the London sub-regions
Cycling potential by sub-region
Cycling potential by borough of residence
23
23
24
26
Chapter 4 Who is making potentially cyclable trips?
Current and potential cyclists by age and sex
Current and potential cyclists by ethnicity
Current and potential cyclists by income
Potentially cyclable trips by whether currently cycle
28
28
29
30
31
Chapter 5 Identifying the cycling market
Introducing TfL‟s Cycle Market Segmentation
Segmenting the population
Potentially cyclable trips by market segment
Spotlight on the „Urban Living‟ – Potentially cyclable trips
Spotlight on the „Young Couples and Families‟ – Potentially cyclable trips
32
32
33
36
37
40
Chapter 6 Potential policy implications – moving from analysis to policy 43
Appendices 50
Analysis of Cycling Potential
2
Introduction
This document presents the results of analysis carried out to understand the potential for growth in
cycle travel. The goal of this analysis is to better understand the nature of this potential, in terms
of what type of trips, people and places offer the best opportunity for growth. The analysis aims to
make the best use of available data to inform policy development – it has been carried out at TfL
using existing data sources. This report does not seek to present a complete picture of all aspects
of the potential for growth; in particular, there is potential beyond that identified by this analysis to
increase cycling as a leisure activity, as a method of accessing other public transport modes, and
for those visiting London. Nevertheless, the data provides a unique and fascinating insight into
cycling potential, and can help the Mayor, TfL and London‟s boroughs to plan policy interventions
that provide good value for money whilst meeting the needs of London residents.
Policy Context
The Mayor has declared his aim of delivering a „cycling revolution‟ in London by 2026; delivering a
400 per cent increase (from 2001) in the number of cycling trips and a 5 per cent mode share for
cycling. In „Cycling Revolution London‟, the Mayor sets out his vision for London to become a
cyclised city: one where people can ride their bikes safely, enjoyably and easily in an environment
that embraces cycling. Making this a reality requires that physical and cultural changes are made in
the city, demanding further investment, strong partnership working across the Capital and
continued political leadership.
2010 is the Year of Cycling and has seen the launch of two Cycle Superhighways to Barking and
Merton and the Central London Cycle Hire scheme, alongside numerous events and initiatives.
Thirteen outer London boroughs have chosen to become Biking Boroughs and are developing
strategic plans to deliver real change for cycling in their local areas. In the medium-term, the Mayor
has declared his intention to launch 10 more Cycle Superhighways and to explore options for
expanding the Cycle Hire scheme. Significant investment is also planned for cycle parking, smarter
travel and Greenways. In the longer term, TfL must develop policies which can deliver substantial
mode shift; current barriers, in terms of infrastructure, information and attitudes, will need to be
overcome to achieve this.
Introducing the analysis
Researchers across TfL have been working together to gather evidence on how TfL and the
boroughs can deliver the Mayor‟s target. Two new tools have been developed, presented here, to
support the development of cycling policy. Separately and in combination, these new analytical
tools provide TfL with an insight into where the greatest potential to increase cycling can be found.
The first, an Analysis of Cycling Potential, is derived from TfL‟s London Travel Demand Survey
(LTDS, 2005/06 to 2007/08), and seeks to identify current trips which could reasonably be cycled
all the way but are not cycled at present. The Survey provides an insight into how Londoners travel
and includes 19,000 households and 42,000 residents. The analysis of cycling potential seeks to
quantify the nature and extent of the potential for cycling in London, by identifying trips made at
present by other modes, and assessing whether they could potentially be cycled, based on a set of
criteria about the person and trip.

Analysis of Cycling Potential
3
The second tool is a bespoke Cycle Market Segmentation, an analysis derived from a range of data
sources that evaluates the influences over travel behaviour in order to identify people most
amenable to cycling in future and most likely to cycle at present. The segmentation is a geo-
demographic classification based upon full postcode, so that each postcode is classified into one
of seven segments according to the average characteristics of its residents. Because postcode
zones are very small, resident populations tend to be highly homogeneous and therefore such
classifications can be used with a reasonable degree of accuracy to predict the likelihood of an
individual or household to exhibit a particular behaviour, characteristic or attitude. The market
segmentation utilises behavioural and attitudinal data and can be used to identify who is in the
„near market‟ for cycling and where they live, ensuring that interventions are suitable for the needs
of local people.
Structure of the report
This report describes the findings of this analysis and identifies the people and places across
London which can benefit most from the Mayor‟s Cycling Revolution.
Chapter 1 describes the method used to identify potentially cyclable trips, trips made by London
residents which could reasonably be cycled all the way but are not cycled at present. It presents a
summary of the potential for cycling in terms of the nature of trips being made and compares the
characteristics of potentially cyclable trips with current cycle travel.
Chapter 2 describes where potentially cyclable trips are being made, identifying those locations
with the greatest potential for cycling growth. It presents analysis of areas containing dense
„clusters‟ of potentially cyclable trips.
Chapter 3 presents analysis of cycling potential at a sub-regional and borough level. The London
sub-regions provide a level of London‟s geography that is wider than a single borough, to facilitate
the consideration of transport challenges and solutions on an area basis. Analysis has been carried
out at a sub-regional and borough level to inform TfL‟s Sub-Regional Transport Plans and borough
Local Implementation Plans.
Chapter 4 describes who is making potentially cyclable trips and compares their characteristics with
current London cyclists. The Chapter explores the demographic characteristics of those making
potentially cyclable trips and assesses the potential for growth that remains amongst those who
currently cycle, and those who do so frequently.
Chapter 5 introduces TfL‟s new Cycle Market Segmentation, an analysis derived from a range of
data sources that evaluates the influences over travel behaviour in order to identify households
most amenable to cycling in future and most likely to cycle at present. Analysis of the potential for
cycle travel by market segment is presented in the Chapter, with a particular focus on the two
segments with the greatest propensity to cycle at present and most amenable to cycling in future.
Finally, Chapter 6 describes the wider implications of the analysis for cycle policy development,
drawing conclusions about how TfL and London‟s boroughs can maximise the potential available to
them.

Analysis of Cycling Potential
4
Executive Summary
Purpose of the report
The Mayor has declared his aim of delivering a „cycling revolution‟ in London by 2026; delivering a
400 per cent increase (from 2001) in the number of cycling trips and a 5 per cent mode share for
cycling. This report presents the results of analysis carried out by TfL Group Planning to understand
the potential for growth in cycle travel and the nature of this potential, in terms of the type of trips,
people and places offering the best opportunity for growth. The analysis draws on two new tools
developed by TfL which, separately and in combination, provide a fascinating and unique insight
into where the potential to increase cycling can be found, and help the Mayor, TfL, and London‟s
boroughs plan effective and good value for money policy interventions.
Analysis of potentially cyclable trips
The Analysis of Cycling Potential is derived from TfL‟s London Travel Demand Survey (LTDS,
2005/06 to 2007/08) and seeks to identify current trips which could reasonably be cycled all the
way, but aren‟t at present. A trip is defined as a one-way movement from one place to another to
achieve a single main purpose. More than one mode of transport may be used during a single trip;
this analysis looks at trips currently made by a mechanised mode (car or public transport) that
could be cycled all the way. The potential for part of a trip to be cycled is not explored in this
analysis.
All trips currently made by mechanised modes have been assessed according to a set of criteria
based upon the characteristics of currently cycled trips. This is not intended to act as a limit on the
potential for growth in cycle travel; TfL recognises that many of the trips excluded by the filters
could and would be cycled. Equally, there is much we do not know about the trips and it is likely
that many of the trips identified here as potentially cyclable could not in fact be cycled in practice.
Nevertheless, the filters are designed to reflect the characteristics of the majority of trips currently
made by bicycle and act as a „rule of thumb‟ to identify those trips most likely to be considered
cyclable by most people.
In total, 4.3 million trips per average day have been identified as potentially cyclable, equivalent to
23 per cent of trips by all modes and 35 per cent of trips by mechanised modes. Analysis of the
characteristics of these trips shows that:
Nearly two thirds of potentially cyclable trips are currently made by car with the remainder
largely made by bus;
Four in ten potentially cyclable trips are made for shopping and leisure purposes and just under
a quarter for work purposes; and
Of the 4.3 million potentially cyclable trips made every day, 3.5 million would take less than 20
minutes for most people to cycle.
The greatest unmet potential for growth can be found within outer London - 54 per cent of
potentially cyclable trips - and only 5 per cent of the „total potential‟ in outer London is actually
cycled, compared to 14 per cent of that for central London (defined as the Central Activities Zone,

Analysis of Cycling Potential
5
broadly equivalent to Zone 1) and 9 per cent for inner London. The „total potential‟ is defined as
the total number of trips currently cycled added to the number of potentially cyclable trips.
A high density of potentially cyclable trips are made within central and parts of inner London
and around the outer London metropolitan town centres.
A higher proportion of mechanised trips made by residents of inner London are potentially
cyclable, yet there is greater potential in outer London, simply due to the size of the region.
Currently, nearly half of all cycle trips have an origin or destination in the Central sub-region
(including the Cities of London and Westminster, the boroughs of Camden, Islington,
Southwark and Lambeth and the Royal Borough of Kensington & Chelsea). In comparison,
potentially cyclable trips are more evenly dispersed across London, although the Central sub-
region still accounts for around a quarter of the total.
Identifying the cycling market
A simple comparison of those making current and potentially cyclable trips shows that, whilst
frequent cyclists are typically white, male, between 25 to 44, and on a higher than average income,
much of the potential comes from women, ethnic minorities, younger and older people, and those
on a lower income. Nevertheless, there remains significant potential for growth amongst existing
cyclists and people similar to them.
TfL‟s new Cycle Market Segmentation tool provides a more sophisticated method of understanding
who cycles at present and who is most amenable to cycling in future. The Cycle Market
Segmentation is derived from a wide range of survey and demographic data and allows all London
postcodes to be classified into seven segments based upon the average characteristics of their
residents. Key sources of data include TfL‟s London Travel Demand Survey, Market Segmentation
Survey and the annual Attitudes to Cycling Survey.
The segment most likely to cycle at present and most amenable to cycling in future is the „Urban
Living‟, making up 23 per cent of the London population and concentrated in central and inner
London and in the metropolitan town centres. A postcode classified as „Urban Living‟ can be
expected to generate 4.6 times as many cycling trips as a postcode of comparative population
classified as „Comfortable Maturity‟, the group least likely to cycle.
It is possible to combine the datasets and identify potentially cyclable trips made by those in the
segments most amenable to cycling. This can be considered the „near market‟ for cycling. Figure E1
below shows potentially cyclable trips by origin made by those in the top four segments by
propensity to cycle.

Analysis of Cycling Potential
6
Figure E1 Potentially cyclable trips by origin, top four segments by propensity to cycle
Source: Cycle Market Segmentation, TfL 2010; Analysis of Cycling Potential, London Travel Demand Survey 2005/06 to 2007/08
Implications – moving from analysis to policy
In summary, drawing upon the research evidence presented in this report and other research
evidence collected by TfL in recent years, this report concludes:
The Mayor has set an ambitious target to increase levels of cycling in London by 400 per cent
by 2026. To achieve this it would be necessary for one in every six potentially cyclable trips to
be cycled each day, throughout the year, based on the trip volumes of today.
Frequent cyclists already make the majority of cycle trips in London, but there remains some
potential for growth, particularly for the journey to work.
There remains significant potential to increase cycle trip making amongst existing infrequent
cyclists – safety, traffic and lack of facilities are the greatest barriers to this.
Cycling remains a minority activity – there are many people who are „just like‟ cyclists but do
not currently cycle, offering excellent potential for growth in cycle travel.
The cycle mode share in central London is already close to 3 per cent and there is the potential
to achieve a mode share in the centre of the Capital to challenge that of other major European
cities.
Beyond the centre, the potential to increase cycling is concentrated in pockets around the
outer London metropolitan town centres and some inner London major centres – boroughs in
these locations are well placed to deliver radical change.

Analysis of Cycling Potential
7
Regions expecting significant growth in population and employment have the opportunity to
„design in‟ a high cycle mode share through innovative transport and land use policies.
Huge potential exists in highly dispersed trips across outer London, demonstrating the
continued need to maintain investment in interventions targeted at and able to reach all
Londoners.
Whilst the best potential may come from targeting existing cyclists and those most similar to
them, non-cyclists can be encouraged to cycle through measures designed to encourage leisure
travel bringing long term transport benefits and shorter term benefits to health and community.
Further information
For enquiries about the content of this publication, please contact:
Tel: 020 7126 3678
Strategic Analysis, Group Planning
Transport for London
9th floor, Windsor House
42-50 Victoria Street
London SW1H 0TL

Analysis of Cycling Potential
8
Chapter 1 Identifying the potential for growth in cycle travel amongst Londoners
This Chapter describes the method used to identify potentially cyclable trips, trips made by
London residents which could reasonably be cycled all the way but are not cycled at present. It
presents a summary of the potential for cycling in terms of the nature of trips being made and
compares the characteristics of potentially cyclable trips with current cycle travel.
Identifying potentially cyclable trips
Between 2005/06 and 2007/08, London residents made an average of 18.5 million trips per day by
all modes. Of these, around 300,000 were already cycled and 5.8 million walked. The remainder,
12.4 million trips, were made by mechanised modes, primarily car, bus, underground and rail. This
analysis explores whether or not these trips currently made by mechanised modes could
potentially be cycled. Each trip is assessed according to a set of criteria based on the
characteristics of currently cycled trips; the filters are designed to reflect the majority of trips
currently made by bicycle. Table 1.1 describes the filters applied to the analysis and Figure 1.1
shows their impact.
Table 1.1 Filters applied to trips made by mechanised modes
Filter Proportion of currently cycled trips
Person carrying a heavy or bulky load 70% of cycle trips are unencumbered
Trip is longer than 8km 94% of cycle trips are currently below 8km
Trip would take over 20% more time to cycle Based on a reasonable value of time estimate
Traveller is over 5 and under 64 95% of cycle trips made by people in this age group
Trip is made between 8pm and 6am 93% of cycle trips are between 6am and 8pm
Traveller has a disability affecting their travel 96% of cycle trips made by those without a disability
Trip made by van, dial-a-ride, plane or boat Trips by these modes not considered switchable
Source: Data for current cycle trips based upon London Travel Demand Survey 2005/06 to 2007/08
Key findings
The Analysis of Cycling Potential seeks to identify trips currently made by mechanised modes
which could reasonably be cycled all the way but are not cycled at present, based upon the
London Travel Demand Survey 2005/06 to 2007/08.
4.3 million trips currently made by mechanised modes have been identified as potentially
cyclable, 23 per cent of trips by all modes and 35 per cent by mechanised mode.
Nearly two thirds of potentially cyclable trips are currently made by car and four in ten
potentially cyclable trips are made for shopping and leisure purposes
There are 3.5 million potentially cyclable trips made every day which would take less than 20
minutes for most people to cycle.

Analysis of Cycling Potential
9
Figure 1.1 Mechanised trips excluded as not cyclable, by reason for exclusion
3,411,000 3,344,000
2,355,000
1,239,000 1,182,000
749,000
254,000
0
500,000
1,000,000
1,500,000
2,000,000
2,500,000
3,000,000
3,500,000
4,000,000
Heavy or
bulky load
Longer than
8km
Takes >20%
longer
Under 5 or
over 64
Overnight Disability Minor modes
Source: Analysis of Cycling Potential, London Travel Demand Survey 2005/06 to 2007/08
Note: The filters overlap, so the sum of excluded trips is less than the sum of each
CAVEATS
The filters are intended to act as a „rule of thumb‟ to identify those trips most likely to be cyclable.
As a result, some trips are excluded which could, in fact be cycled. In particular, keen cyclists will
generally cycle faster and further than average, and so would be willing to cycle trips excluded here
as not potentially cyclable.
It is also the case that there is much we do not know about the trips identified as potentially
cyclable and the people making them. In particular, we do not know who the person may be
travelling with or what else they are doing on that day. People who in actuality are travelling as a
group are by necessity treated separately in this analysis. Therefore, some of the trips identified as
potentially cyclable could not, in fact, be cycled.
The analysis is limited to trips made by London residents (excluding those who travel to London
from elsewhere to work, shop and use services) and to trips which could potentially be cycled all
the way. Therefore, any potential for increases in cycle travel for parts of trips, such as after-rail, is
not captured here. Note that this will particularly understate the potential for growth in cycle travel
in central London, which receives a high volume of daily visitors.
Finally, note that it is necessary to draw on a wider range of data sources in order to draw
conclusions about whether or not these trips could or would transfer to cycling, or under what
circumstances such a change might happen. The Cycle Market Segmentation tool provides some
evidence on the likelihood of mode shift for an individual. It is worth noting that around three in
ten London residents consistently say that cycling is not for them under any circumstances; any
potentially cyclable trips made by this group are highly unlikely to ever be cycled.

Analysis of Cycling Potential
10
In total, 4.3 million trips per day currently made by mechanised modes were identified as
potentially cyclable, equivalent to 23 per cent of trips by all modes and 35 per cent of trips by
mechanised modes. Figure 1.2 summarises the results of the analysis.
Assuming that the „total potential‟ is the sum of the currently cycled and potentially cyclable trips,
and noting that London residents currently make 300,000 cycle trips on an average day, this
amounts to 7 per cent of potentially cyclable trips actually being cycled. This excludes trips which
are currently walked but could be cycled, reflecting the Mayoral goal to increase the overall mode
share for active travel modes.
Figure 1.2 Process to identify potentially cyclable trips
12.4m
Trips by
mechanised
modes
4.3m
Potentially
cyclable trips
18.5m
Trips per day
by all modes
6.1m trips made
by walk & cycle
excluded
8.1m
trips excluded as
not suitable for
cycling
Source: Analysis of Cycling Potential, London Travel Demand Survey 2005/06 to 2007/08
Potentially cyclable trips by current mode
Nearly two thirds of all potentially cyclable trips are currently made by car, just fewer than four in
ten of the car trips made in London by London residents. This reflects the high number of very
short car trips made in London and especially in the outer London boroughs. On a modal basis,
trips made by Underground and rail were the least likely to be potentially cyclable, and bus trips
were the most likely. This reflects both the average distance travelled by these modes, and the
relative speeds: rail trips are longer on average and rail travel is quicker than travelling by bus,
meaning that they are more likely to have been excluded as being longer than 8km or taking more
than 20% longer by bicycle. Figure1.3 shows the proportion of trips by each mode that were
assessed as potentially cyclable, and Figure1.4 shows potentially cyclable trips by the mode
currently used to make the trip.

Analysis of Cycling Potential
11
The current mode used for potentially cyclable trips varies considerably by the location of the trip.
Three quarters of potentially cyclable trips with an origin and/or destination in outer London are
currently made by car, compared to 46 per cent of those in inner London and only 15 per cent of
those in central London. Bus accounts for most of the remainder. More than half the potentially
cyclable trips made by Underground and rail were within central London or between central and
inner London, presumably reflecting the greater distances between stops further from the centre.
Figure 1.3 Trips by each mode identified as potentially cyclable or otherwise
35%
38%
45%
17%
28%
65%
62%
55%
83%
72%
0% 20% 40% 60% 80% 100%
All mechanised
modes
Car
Bus
Underground and rail
Other
Potentially cyclable Not cyclable
200,000
Potentially
cyclable trips:
4,300,000
2,700,000
1,100,000
300,000
Source: Analysis of Cycling Potential, London Travel Demand Survey 2005/06 to 2007/08
Figure 1.4 Potentially cyclable trips by current mode
Car, 63%
Bus, 26%
Underground and
rail, 7%
Other, 5%
Source: Analysis of Cycling Potential, London Travel Demand Survey 2005/06 to 2007/08
Analysis of Cycling Potential
12
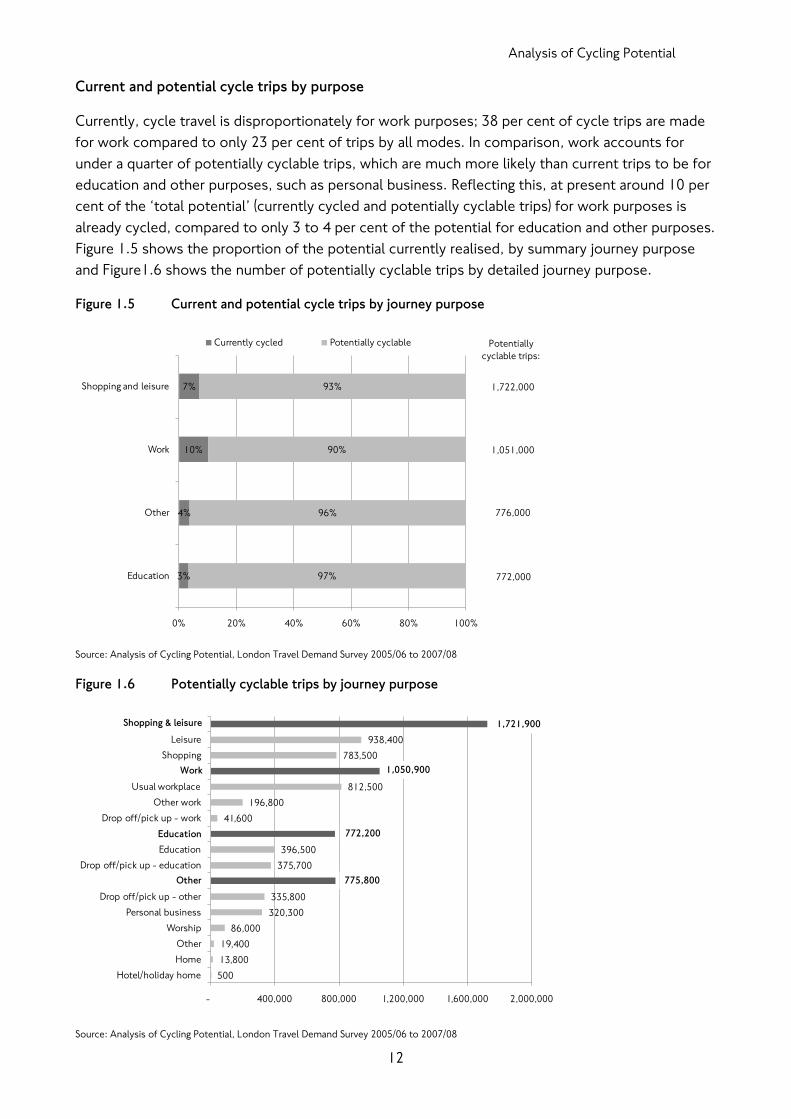
Current and potential cycle trips by purpose
Currently, cycle travel is disproportionately for work purposes; 38 per cent of cycle trips are made
for work compared to only 23 per cent of trips by all modes. In comparison, work accounts for
under a quarter of potentially cyclable trips, which are much more likely than current trips to be for
education and other purposes, such as personal business. Reflecting this, at present around 10 per
cent of the „total potential‟ (currently cycled and potentially cyclable trips) for work purposes is
already cycled, compared to only 3 to 4 per cent of the potential for education and other purposes.
Figure 1.5 shows the proportion of the potential currently realised, by summary journey purpose
and Figure1.6 shows the number of potentially cyclable trips by detailed journey purpose.
Figure 1.5 Current and potential cycle trips by journey purpose
3%
4%
10%
7%
97%
96%
90%
93%
0% 20% 40% 60% 80% 100%
Education
Other
Work
Shopping and leisure
Currently cycled Potentially cyclable
1,722,000
Potentially
cyclable trips:
772,000
776,000
1,051,000
Source: Analysis of Cycling Potential, London Travel Demand Survey 2005/06 to 2007/08
Figure 1.6 Potentially cyclable trips by journey purpose
500
13,800
19,400
86,000
320,300
335,800
775,800
375,700
396,500
772,200
41,600
196,800
812,500
1,050,900
783,500
938,400
1,721,900
- 400,000 800,000 1,200,000 1,600,000 2,000,000
Hotel/holiday home
Home
Other
Worship
Personal business
Drop off/pick up - other
Other
Drop off/pick up - education
Education
Education
Drop off/pick up - work
Other work
Usual workplace
Work
Shopping
Leisure
Shopping & leisureShopping & leisure
Work
Education
Other
1,721,900
1,050,900
775,800
772,200
Source: Analysis of Cycling Potential, London Travel Demand Survey 2005/06 to 2007/08

Analysis of Cycling Potential
13
Current and potential cycle trips by day and time
Reflecting the proportion of current cycle trips made for work purposes, half of all current cycle
trips are made during the weekday peak periods. Potentially cyclable trips are somewhat less likely
to be made during the weekday peak periods and somewhat more likely to fall during the weekday
inter-peak (see Figure 1.7). Broadly the same proportion of current and potentially cyclable trips is
made at the weekend (22 per cent compared to 24 per cent). More potentially cyclable trips are
made on an average weekday (4.5 million) than a Saturday (4.2 million) or Sunday (3.6 million). In
comparison, current cycle trips are somewhat less likely to be made on a Saturday than a Sunday,
although this may simply be the effect of small base sizes for weekend cycle trips.
Figure 1.7 Potentially cyclable trips by time and day
22%
29%
25%
13%
11%
26%
24%
28%
10%12%
0%
5%
10%
15%
20%
25%
30%
35%
Weekday - am peak Weekday -
interpeak
Weekday - pm peak Saturday Sunday
Potentially cyclable Current cycle trips
Source: Analysis of Cycling Potential, London Travel Demand Survey 2005/06 to 2007/08
Current and potential cycle trips by distance and time taken
Figure 1.8 compares current and potentially cyclable trips by distance. This shows that potentially
cyclable trips are longer on average than currently cycled trips, and a much lower proportion are
below 2km in length. Two thirds of all current cycle trips are less than 2km in length, compared to
only 39 per cent of potentially cyclable trips, and 10 per cent of the „total potential‟ for trips at this
distance is realised, compared to only around 4 per cent for longer trips. Nevertheless, this still
represents significant potential: there are fewer than 200,000 current cycle trips below 2km but 1.6
million potentially cyclable trips at this distance. Very short potentially cyclable trips are
particularly concentrated in outer London; nearly seven in ten potentially cyclable trips under 2km
have an origin and/or destination in outer London, 42 per cent of all potentially cyclable trips made
in outer London. Again, this reflects the prevalence of short car trips in outer London and the
relatively lower walk and cycle mode share.

Analysis of Cycling Potential
14
Figure 1.8 Current and potential cycle trips by trip distance (crow-fly)
39%41%
20%
66%
23%
11%
0%
10%
20%
30%
40%
50%
60%
70%
Under 2km 2km to less than 5km 5km to less than 8km
Potentially cyclable trips
Current cycle trips
Source: Analysis of Cycling Potential, London Travel Demand Survey 2005/06 to 2007/08
Figure 1.9 shows the profile of potentially cyclable trips by distance. The majority of potentially
cyclable trips are between 0.5km and 3km in length. The average cycle speed is assumed to be 15
kilometres per hour. Consequently, more than half the potentially cyclable trips would take
between 2 and 12 minutes to cycle.
Based upon this estimated average speed, a trip of 2km would take around 8 minutes, of 5km
around 20 minutes, and of 8km around half an hour. A more experienced or fitter cyclist would be
expected to achieve higher average speeds. In total, there are nearly 3.5 million trips made every
day in London which would take less than 20 minutes for most people to cycle. It is notable that
15km per hour is faster than average peak hour road speeds in central London and only a little
lower than peak speeds in inner London (around 18km per hour).
Furthermore, cycle journeys tend to be more predictable. Research carried out by TfL‟s Road
Network Performance team concluded that cycle journey times are highly consistent per rider, and
largely independent of traffic conditions and time of day. The research used GPS to track the
journey times of eight cyclists on their regular route to work over a period of several days; on one
example route, Colliers Wood to Victoria, the same 9.4km outbound journey was completed on
nine separate occasions and the variation between all those journeys was 53 seconds on a journey
time of 30 minutes. This was typical of results across the different routes (RNPR Traffic Note 11
Cycle Journey Time Reliability).
On average, potentially cyclable trips with an origin and/or destination in central London are longer
than those with an origin and/or destination elsewhere in London: 46 per cent are between 5 and 8
km compared to only 20 per cent overall. This suggests that there is considerable potential for time
savings to be achieved.

Analysis of Cycling Potential
15
Figure 1.9 Potentially cyclable trips by trip distance (crow-fly)
0
100000
200000
300000
400000
500000
600000
0 0.5km to
<1km
1.5km to
<2km
2.5km to
<3km
3.5km to
<4km
4.5km to
<5km
5.5km to
<6km
6.5km to
<7km
7.5km to
<8km
1.66m less
than 2km
1.79m
between 2km
and 5km
860k between
5km and 8km
Source: Analysis of Cycling Potential, London Travel Demand Survey 2005/06 to 2007/08

Analysis of Cycling Potential
16
Chapter 2 Where is the greatest potential for growth in cycle travel?
This Chapter describes where potentially cyclable trips are being made, identifying those locations
with the greatest potential for cycling growth. It presents analysis of areas containing dense
„clusters‟ of potentially cyclable trips.
Location of potentially cyclable trips
Between 2005/06 and 2007/08, London residents made an average of 307,000 cycle trips per day.
Of these, the majority (192,800, 63 per cent) had an origin and/or destination in central or inner
London and a quarter involved travel to or from central London from elsewhere in London. Figure
2.1 compares the origin and destination of current and potential cycle trips. It is clear that in
particular there is a great deal of unmet potential within outer London as only 5 per cent of the
„total potential‟ of trips with an origin and/or destination in outer London is actually cycled,
compared to 14 per cent of that for central London and 9 per cent for inner London.
Figure 2.1 Origin and destination of current and potential cycle trips, London residents
3%
24%
8%
54%
0%
9%
2%4%
30%
20%
36%
3%
6%
1%
0%
10%
20%
30%
40%
50%
60%
Within Central
London
Within Inner
London
Between
Central & Inner
London
Within Outer
London
Between
Central &
Outer London
Between Inner
& Outer
London
Between
Greater
London and
rest of UK
Potentially cyclable trips
Current cycle trips
Source: Analysis of Cycling Potential, London Travel Demand Survey 2005/06 to 2007/08
Note: Central London defined as the Central Activities Zone, broadly equivalent to Zone 1
Key findings
A quarter of potentially cyclable trips are made within inner London, 54 per cent within outer
London and 9 per cent travelling between the two regions.
A high density of potentially cyclable trips are made within central and parts of inner London
and around the outer London metropolitan town centres. In particular, more than 30,000
potentially cyclable trips had an origin or destination in each of Croydon, Ealing, Bromley and
Ilford town centres.

Analysis of Cycling Potential
17
The map presented in Figure2.2 provides a summary of where potentially cyclable trips are being
made. There is particular potential for growth in a number of different markets: short hops in
central London (around 100,000 trips); commuter trips from inner and outer London to central
London (nearly 400,000 trips); and local trips in inner (1 million trips) and outer London (more than
2.3 million trips). Note that this analysis includes London residents only. Central London attracts a
vast number of non-Londoners every day, coming to work, shop and use the many services unique
to the Capital city. Therefore, the real potential for cycling in this area may be considerably higher
than is represented here.
Potentially cyclable trips with an origin or destination in central London were twice as likely as trips
made elsewhere to be for work purposes (44 per cent compared to 22 per cent), accounting for one
in five potentially cyclable trips made for work purposes.
Figure 2.2 Origin and destination of potentially cyclable trips made by London residents
Source: Analysis of Cycling Potential, London Travel Demand Survey 2005/06 to 2007/08
Note: Excludes non-residents therefore „Between London and elsewhere‟ includes trips by London residents only; Central London defined as the
Central Activities Zone, broadly equivalent to Zone 1
As shown in Figures 2.4 and 2.5 overleaf, around a quarter of potentially cyclable trips originated in
London‟s 48 International, Metropolitan and Major town centres. Trips are concentrated in the
West End (130,000) and Knightsbridge (50,000) in central London and in Kilburn (31,000),
Hammersmith (27,000) and Lewisham (23,000) in inner London. 7 per cent of potentially cyclable
trips originated in the 11 outer London Metropolitan town centres, shown in Figure 2.3.
3%
Within outer
London
54%
Between outer
& inner London
9% Between
London &
elsewhere
2%
Between outer &
central London
0.4%
Between
inner &
central - 8%
Within inner
London - 24%

Analysis of Cycling Potential
18
Figure 2.3 Potentially cyclable trips with an origin in the outer London Metropolitan town centres,
London residents
38,000 37,000
31,000 31,000
27,000 26,000
25,000
21,000 19,000
17,000
13,000
-
5,000
10,000
15,000
20,000
25,000
30,000
35,000
40,000
Source: Analysis of Cycling Potential, London Travel Demand Survey 2005/06 to 2007/08
Figure 2.4 Potentially cyclable trips by trip origin, London residents
Source: Analysis of Cycling Potential, London Travel Demand Survey 2005/06 to 2007/08

Analysis of Cycling Potential
19
Figure 2.5 Potentially cyclable trips by trip destination, London residents
Source: Analysis of Cycling Potential, London Travel Demand Survey 2005/06 to 2007/08
Areas with high density cycling potential
The cycling potential „heat maps‟ shown in Figures 2.4 and 2.5 show a high density of potentially
cyclable trips in some central and inner London boroughs, particularly the City of London,
Westminster, Kensington and Chelsea, Camden, Islington, Lambeth and Hammersmith and Fulham.
The Barclays Cycle Hire Scheme will cater for much of the potential for short trips within central
London, whilst the Cycle Superhighways will deliver commuter cyclists into the city centre from
inner London and beyond.
By analysing areas with a high density of potentially cyclable trips, and understanding the nature of
such trips and the people making them, it is possible to identify places where intensive
interventions could provide value for money. More than half of the potentially cyclable trips are
local trips dispersed across inner and outer London, marked in yellow and green on the heat maps,
demonstrating the continuing need for interventions that can reach a dispersed population.

Analysis of Cycling Potential
20
Inner London beyond the Cycle Hire zone
Analysis has been carried out of existing potential in the area just beyond the current London Cycle
Hire Scheme zone, shown in Figure2.6. This area covers approximately 75 sq km and around half a
million potentially cyclable trips have an origin within the boundary, but outside the Cycle Hire
zone. Particularly high densities of trips are visible in Kensington and Chelsea and Hammersmith to
the west and in Camden and the northern parts of Westminster to the north-west of the zone. The
potential is largely derived from trips made by residents of the boroughs (85 per cent of trips) and is
drawn from public transport trips, particularly those made by bus (58 per cent public transport,
including 41 per cent bus).
Figure 2.6 Potentially cyclable trips in inner London and Canary Wharf
Source: Analysis of Cycling Potential, London Travel Demand Survey 2005/06 to 2007/08
Beyond the centre of London, there exist significant clusters of potential in some regions of inner
and outer London, as well as in and around several Metropolitan town centres. Analysis has been
carried out exploring in greater detail the potential for cycling in a selection of these areas. This is
summarised below.
Olympic area
This analysis describes the potential for cycling in an area of approximately 37 sq km lying mainly
within the London Borough of Newham, as well as small parts of Redbridge, Waltham Forest and
Barking and Dagenham. Nearly 200,000 potentially cyclable trips originated from this cluster,
undertaken by around 100,000 people. Potentially cyclable trips undertaken in this area were
shorter than average, with half under 2km compared to around 40 per cent across London, and
more likely to be made by bus, accounting for three in ten potentially cyclable trips in this area. The
vast majority of trips made in this area were made by residents of Newham, Redbridge, Waltham
Forest and Barking and Dagenham (96 per cent) and six in ten were made by car. Half of those
making a potentially cyclable trip had a low household income of less than £20,000; there is
therefore good potential to promote cycling as a relatively low cost and efficient mode.

Analysis of Cycling Potential
21
The area around the Olympic park is projected to experience very high growth in population and
employment over the London Plan period to 2031. This analysis only takes into account trips made
by current residents of the area; the projected growth provides considerable additional potential,
particularly given the opportunity to „build in‟ walking and cycling with innovative land use,
infrastructure, parking and urban realm policies.
Figure 2.7 Potentially cyclable trips in the Olympic area
Source: Analysis of Cycling Potential, London Travel Demand Survey 2005/06 to 2007/08
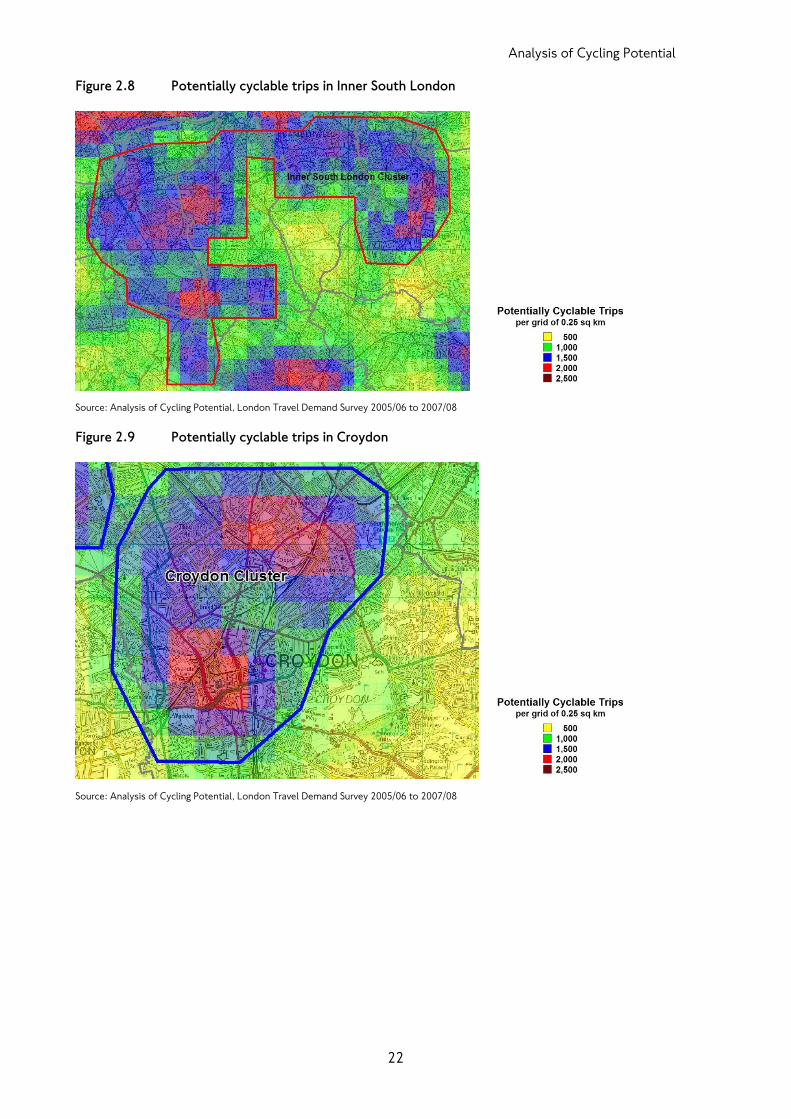
Inner South London and Croydon
A „spur‟ of high cycling potential southwards from central London is evident from the mapping of
the potentially cyclable trips, shown in Figure 2.8. This covers a large area of inner south London,
66 sq km in total from Wandsworth in the west to Deptford and Lewisham in the east, and reaching
as far south as Catford and Mitcham. There is a further „hotspot‟ with a high density of potentially
cyclable trips around Croydon town centre. This area covers a further 22 sq km and is shown in
Figure 2.9. These two areas contain more than 450,000 potentially cyclable trips – 343,000 in inner
south London and 119,000 in Croydon. 70 per cent of potentially cyclable trips were made by car
in Croydon compared to 56 per cent in inner south London, with the remainder largely made by
bus. Four in ten of those making a potentially cyclable trip in inner south London have a household
income below £20,000, so again there is good potential to promote cycling as a low cost mode.
Furthermore, Croydon is projected to experience substantial population and employment growth
over the coming decade, which can be expected to increase the potential demand for cycle travel.
Analysis of Cycling Potential
22
Figure 2.8 Potentially cyclable trips in Inner South London
Source: Analysis of Cycling Potential, London Travel Demand Survey 2005/06 to 2007/08
Figure 2.9 Potentially cyclable trips in Croydon
Source: Analysis of Cycling Potential, London Travel Demand Survey 2005/06 to 2007/08

Analysis of Cycling Potential
23
Chapter 3 Cycling potential by sub-region and borough
This Chapter presents analysis of cycling potential at a sub-regional and borough level. The London
sub-regions provide a level of London‟s geography that is wider than a single borough, to facilitate
the consideration of transport challenges and solutions on an area basis. Analysis has been carried
out at a sub-regional and borough level to inform TfL‟s Sub-Regional Transport Plans and borough
Local Implementation Plans.
Introducing the London sub-regions
A series of sub-regional plans were published in autumn 2010. These further develop London-wide
policies as set out in the Mayor‟s Transport Strategy, exploring how the Mayor‟s aspirations can be
delivered on a local level, recognising the different characteristics and challenges present in each
sub-region. The Sub-Regional Plans provide an important link between London-wide policies and
the boroughs‟ own priorities, which will be progressed through Local Implementation Plans (LIPs)
and other local plans. This chapter provides a summary of cycling potential at a sub-regional and
borough level.
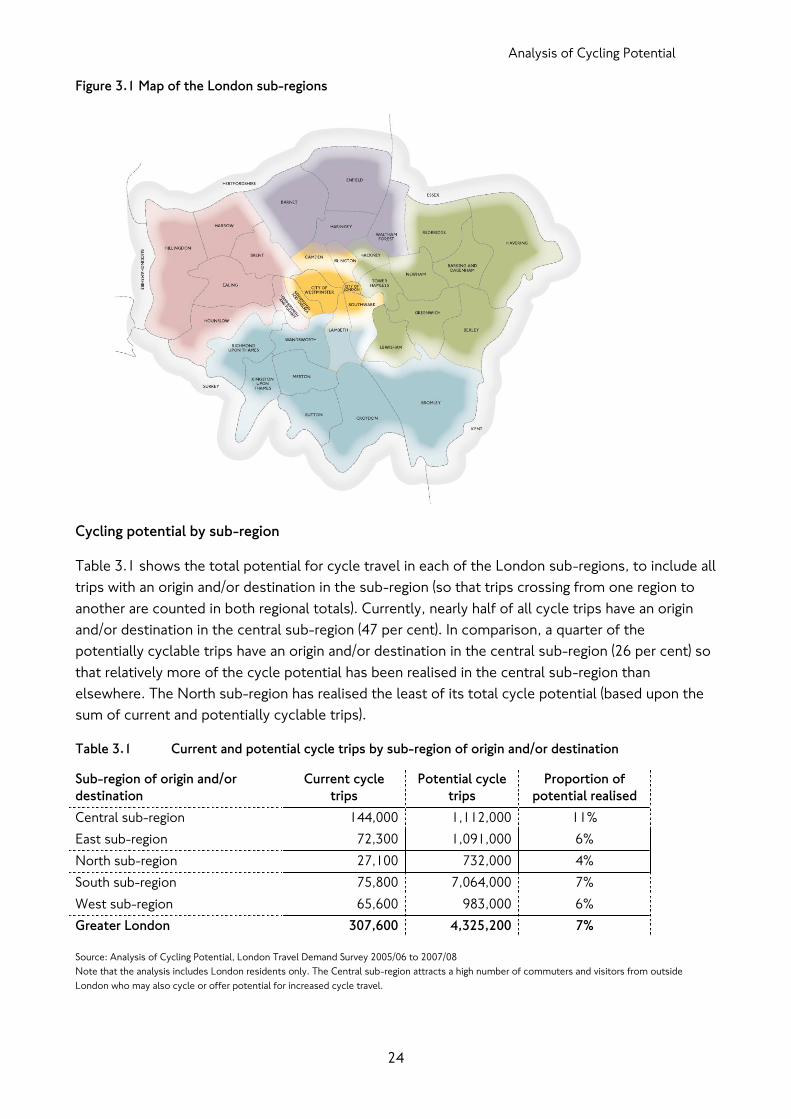
There are five sub-regions: central, east, north, south and west London, shown in Figure 3.1. The
sub-regions are considered to have „fuzzy‟ boundaries, recognising that any consideration of
transport challenges and other issues has cross-boundary impacts.
Key findings
Currently, nearly half of all cycle trips have an origin or destination in the Central sub-region. In
comparison, potentially cyclable trips are more evenly dispersed across London, although the
Central sub-region still accounts for around a quarter of the total (note that the Central sub-
region comprises the Cities of London and Westminster, the boroughs of Camden, Islington,
Southwark and Lambeth and the Royal Borough of Kensington & Chelsea. It is therefore larger
than central London as defined in Figures 2.1 and 2.2).
A higher proportion of mechanised trips made by residents of inner London are potentially
cyclable, however, there is greater potential overall in outer London, simply due to the size of
the region.
Analysis of Cycling Potential
24
Figure 3.1 Map of the London sub-regions
Cycling potential by sub-region
Table 3.1 shows the total potential for cycle travel in each of the London sub-regions, to include all
trips with an origin and/or destination in the sub-region (so that trips crossing from one region to
another are counted in both regional totals). Currently, nearly half of all cycle trips have an origin
and/or destination in the central sub-region (47 per cent). In comparison, a quarter of the
potentially cyclable trips have an origin and/or destination in the central sub-region (26 per cent) so
that relatively more of the cycle potential has been realised in the central sub-region than
elsewhere. The North sub-region has realised the least of its total cycle potential (based upon the
sum of current and potentially cyclable trips).
Table 3.1 Current and potential cycle trips by sub-region of origin and/or destination
Sub-region of origin and/or
destination
Current cycle
trips
Potential cycle
trips
Proportion of
potential realised
Central sub-region 144,000 1,112,000 11%
East sub-region 72,300 1,091,000 6%
North sub-region 27,100 732,000 4%
South sub-region 75,800 7,064,000 7%
West sub-region 65,600 983,000 6%
Greater London 307,600 4,325,200 7%
Source: Analysis of Cycling Potential, London Travel Demand Survey 2005/06 to 2007/08
Note that the analysis includes London residents only. The Central sub-region attracts a high number of commuters and visitors from outside
London who may also cycle or offer potential for increased cycle travel.

Analysis of Cycling Potential
25
As shown in Figure 3.2, potentially cyclable trips in the central sub-region are primarily made by
bus, Underground and rail at present, whereas across the other sub-regions the vast majority of
potentially cyclable trips are made by car. A higher than average proportion of potential cycle trips
is made by bus in the east sub-region, reflecting low levels of car ownership and use in the region.
Figure 3.2 Potentially cyclable trips by mode, by sub-region of origin/destination
35%
62%
72% 74%71%
39%
29%
23% 20%22%
22%
8%3% 5% 6%
4% 1% 1% 2% 2%
0%
10%
20%
30%
40%
50%
60%
70%
80%
90%
100%
Central East North South West
Other
Underground and rail
Bus
Car
Source: Analysis of Cycling Potential, London Travel Demand Survey 2005/06 to 2007/08
Figure 3.3 compares potentially cyclable trips with an origin and/or destination in each London sub-
region by journey purpose. Potentially cyclable trips in the central sub-region are more likely to be
for work purposes and less likely to be for education purposes than those in the other sub-regions.
Figure 3.3 Potentially cyclable trips by journey purposes, by sub-region of origin and/or destination
31%26%
21% 22% 25%
15%
16%
19% 19%18%
39%39%
41% 41% 39%
15% 18% 20% 18% 18%
0%
10%
20%
30%
40%
50%
60%
70%
80%
90%
100%
Central East North South West
Other
Shopping and leisure
Education
Work
Source: Analysis of Cycling Potential, London Travel Demand Survey 2005/06 to 2007/08

Analysis of Cycling Potential
26
Cycling potential by borough of residence
At present, the cycling mode share by borough of residence varies from less than half a per cent in
Bromley to 8 per cent in Hackney (based on 2005/06 to 2007/08 data). However, all boroughs have
significant potential to achieve mode shift to cycling amongst local residents. Figure 3.4 shows the
proportion of trips by mechanised modes that are potentially cyclable, by borough of residence.
On average, a higher proportion of mechanised trips made by residents of inner London are
potentially cyclable (39 per cent compared to 33 per cent in outer London). Boroughs with a
particularly high proportion of cyclable trips made by mechanised modes are Islington (50 per cent),
Southwark (47 per cent) and Hackney (45 per cent) in inner London, and Brent, Ealing and Enfield in
outer London (all 38 per cent). It is notable that Hackney has a particularly high proportion of
current mechanised trips that are potentially cyclable, despite already achieving the highest cycle
mode share of any London borough.
Although a higher proportion of trips made by mechanised modes in inner London are potentially
cyclable, there is greater potential overall amongst trips made by outer London residents simply
due to the size of the region. In total, 63 per cent of potentially cyclable trips are made by residents
of outer London (compared to 67 per cent of mechanised trips and 63 per cent of all trips).
Figure 3.4 Potentially cyclable trips as a proportion of all trips by mechanised modes, by borough of
residence
0% 20% 40% 60% 80% 100%
CamdenCity of London
HackneyHammersmith & Fulham
HaringeyIslington
Kensington & ChelseaLambeth
LewishamNewham
SouthwarkTower Hamlets
WandsworthWestminster
Inner London
Barking & DagenhamBarnetBexleyBrent
BromleyCroydon
EalingEnfield
GreenwichHarrow
HaveringHillingdonHounslow
Kingston upon ThamesMerton
RedbridgeRichmond upon Thames
SuttonWaltham Forest
Outer London
Greater London
Potentially cyclable trips Not potentially cyclable
Source: Analysis of Cycling Potential, London Travel Demand Survey 2005/06 to 2007/08

Analysis of Cycling Potential
27
As shown in Table 3.2 at present, residents of Hackney and Richmond upon Thames make the
greatest number of cycle trips and have realised the greatest proportion of the „total potential‟.
Residents of Barnet and Ealing make the greatest number of potentially cyclable trips.
Table 3.2 Current and potential cycle trips by borough of residence
Borough of residence Current cycle
trips 2005-8
Potential cycle
trips
Proportion of
potential realised
Camden 15,600 130,400 11%
City of London <100 9,400 <1%
Hackney 32,000 102,500 24%
Hammersmith & Fulham 15,200 89,100 15%
Haringey 7,500 124,300 6%
Islington 9,800 111,000 8%
Kensington & Chelsea 14,300 91,900 13%
Lambeth 12,100 146,300 8%
Lewisham 6,700 143,600 4%
Newham 3,500 150,600 2%
Southwark 11,900 132,000 8%
Tower Hamlets 7,700 86,400 8%
Wandsworth 20,100 157,700 11%
Westminster 18,500 130,400 12%
Inner and Central London 174,800 1,605,700 10%
Barking & Dagenham 3,100 68,800 4%
Barnet 8,500 241,200 3%
Bexley 3,500 77,500 4%
Brent 8,100 169,300 5%
Bromley 3,100 211,900 1%
Croydon 8,800 210,700 4%
Ealing 12,400 219,800 5%
Enfield 4,800 194,400 2%
Greenwich 4,700 107,900 4%
Harrow 3,500 126,900 3%
Havering 3,600 122,000 3%
Hillingdon 7,800 178,600 4%
Hounslow 12,600 124,500 9%
Kingston upon Thames 8,200 97,100 8%
Merton 4,700 101,500 4%
Redbridge 5,500 143,800 4%
Richmond upon Thames 20,400 86,900 19%
Sutton 2,800 118,200 2%
Waltham Forest 6,600 118,400 5%
Outer London 132,800 2,719,500 5%
Greater London 307,600 4,325,200 7%
Source: Analysis of Cycling Potential, London Travel Demand Survey 2005/06 to 2007/08

Analysis of Cycling Potential
28
Chapter 4 Who is making potentially cyclable trips?
Chapter 4 describes who is making potentially cyclable trips and compares their characteristics with
current London cyclists. The Chapter explores the demographic characteristics of those making
potentially cyclable trips and assesses the potential for growth that remains amongst those who
currently cycle, and those who do so frequently.
When comparing the characteristics of those making potentially cyclable trips with current London
cyclists, it assumed that it may be easier to realise the potential where the person making the trip
has more in common with people who currently choose to cycle, and that trips made by people
who are currently less likely to cycle would be harder to convert. It is worth noting that frequent
cyclists may have already assessed their travel for the potential to cycle and therefore that
potentially cyclable trips made by this group may in fact have already been judged not cyclable in
practice.
Current and potential cyclists by age and sex
Two thirds of frequent cyclists (those who cycle once a week or more often) and more than half of
infrequent cyclists are men. The proportion of men who cycle frequently is twice that of women
(16 per cent compared to 8 per cent). In comparison, women make up more than half those making
a potentially cyclable trip. Figure 4.1 compares current and potential cyclists by sex.
The age profile of current and potential cyclists is broadly similar (shown in Figure 4.2), although it
is notable that only one in six frequent cyclists is over 45, compared to a quarter of potential
cyclists. At present, children under 14 are the age group most likely to cycle at least once a week
and around 300,000 potentially cyclable trips are made by under 14s, suggesting that there may be
good potential to realise mode shift amongst this age group. In particular, 18 per cent of potentially
cyclable trips are made for education purposes, and just over half of these are made by under 19s
(the remainder are largely aged 35 to 44, and are parents escorting their children to school). This
demonstrates the potential that could be realised by continuing to work with schools and parents,
building on initiatives such as school travel planning.
Key findings
Frequent cyclists are typically white, male, between 25 to 44 years old, and on a higher than
average income.
In comparison, many of the potentially cyclable trips are made by women, ethnic minorities,
younger and older people, and those on a lower income.
Nevertheless, there remains significant potential for growth amongst existing cyclists and
people similar to them.

Analysis of Cycling Potential
29
Figure 4.1 Current and potential cyclists by sex
67%
53%
45% 45%
33%
47%
55% 55%
0%
10%
20%
30%
40%
50%
60%
70%
80%
90%
100%
Frequent cyclists Infrequent cyclists Non-cyclists Potential cyclists
Female
Male
Source: Analysis of Cycling Potential, London Travel Demand Survey 2005/06 to 2007/08
Figure 4.2 Current and potential cyclists by age
22%
12% 10%14%
11%
14%14%
15%
21%
21% 24%
21%
26%
25% 24%23%
12%
17% 16% 16%
7% 10% 12% 11%
0%
10%
20%
30%
40%
50%
60%
70%
80%
90%
100%
Frequent cyclists Infrequent cyclists Non-cyclists Potential cyclists
55 to 64
45 to 54
35 to 44
25 to 34
15 to 24
5 to 14
Source: Analysis of Cycling Potential, London Travel Demand Survey 2005/06 to 2007/08
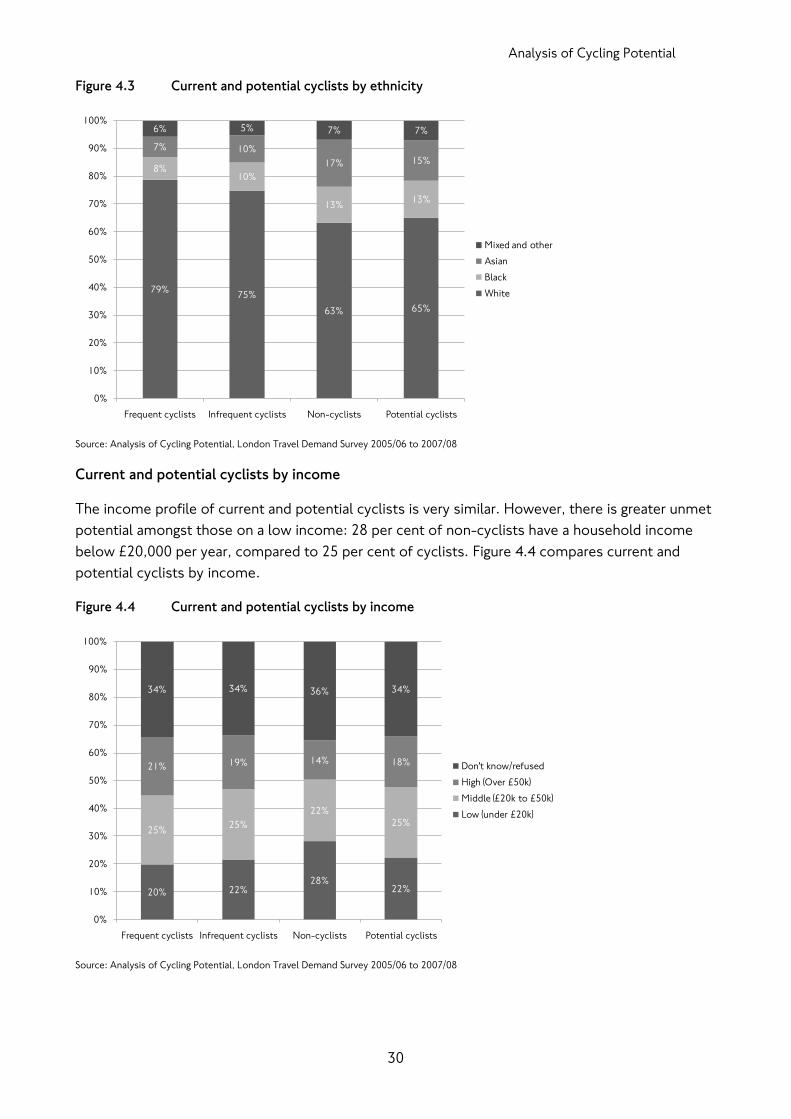
Current and potential cyclists by ethnicity
Eight in ten frequent cyclists and three quarters of infrequent cyclists are white. Asian people are
particularly unlikely to cycle frequently – only 7 per cent of frequent cyclists are Asian, compared
to 17 per cent of non-cyclists. There is a significant opportunity to increase cycling amongst those
from a minority ethnic background, in that they make up 35 per cent of potential cyclists, but there
may be cultural barriers to realising this potential amongst some ethnic groups. Figure 4.3
compares current and potential cyclists by ethnicity.
Analysis of Cycling Potential
30
Figure 4.3 Current and potential cyclists by ethnicity
79%75%
63% 65%
8%10%
13%13%
7% 10%
17% 15%
6% 5% 7% 7%
0%
10%
20%
30%
40%
50%
60%
70%
80%
90%
100%
Frequent cyclists Infrequent cyclists Non-cyclists Potential cyclists
Mixed and other
Asian
Black
White
Source: Analysis of Cycling Potential, London Travel Demand Survey 2005/06 to 2007/08
Current and potential cyclists by income
The income profile of current and potential cyclists is very similar. However, there is greater unmet
potential amongst those on a low income: 28 per cent of non-cyclists have a household income
below £20,000 per year, compared to 25 per cent of cyclists. Figure 4.4 compares current and
potential cyclists by income.
Figure 4.4 Current and potential cyclists by income
20% 22%28%
22%
25%25%
22%
25%
21% 19% 14% 18%
34% 34% 36% 34%
0%
10%
20%
30%
40%
50%
60%
70%
80%
90%
100%
Frequent cyclists Infrequent cyclists Non-cyclists Potential cyclists
Don't know/refused
High (Over £50k)
Middle (£20k to £50k)
Low (under £20k)
Source: Analysis of Cycling Potential, London Travel Demand Survey 2005/06 to 2007/08

Analysis of Cycling Potential
31
Potentially cyclable trips by whether currently cycle
Much of the growth in cycling since 2001 has been driven by existing cyclists making more trips by
bicycle. TfL‟s second Travel in London report stated that cycle trips grew by around 70 per cent
between 2001 and 2008. Between 2005/06 and 2008/09, there was an increase of only 3 per cent
in the number of London residents who ever cycle, but an increase of nearly 50 per cent in the
proportion of cyclists who cycle frequently.
There remains some potential for growth amongst those who cycle frequently – nearly half a
million potentially cyclable trips are made by those who cycle at least once a week. In particular,
only 24 per cent of those who cycle frequently and are in employment cycle to work and nearly
100,000 potentially cyclable work trips are made by frequent cyclists. Furthermore, around half a
million potentially cyclable trips are made by the group most likely to cycle: white men aged 25 to
44.
It is reasonable to assume that it may be easier to persuade existing cyclists to do so more
frequently than to get new people to cycle for the first time. The London Travel Demand Survey
three year dataset for 2005/06 to 2007/08 identifies over 1.5 million London residents who do
cycle, but do so infrequently (less often than once a week). This group makes 1.1 million potentially
cyclable trips every day.
Although 63 per cent of the potentially cyclable trips identified are made by those who currently
do not cycle at all, other research has found that many non-cyclists have access to a bike in their
household, or may even own a bike themselves. Furthermore, most non-cyclists say that they can
ride a bike, although they may not have done so since they were a child or feel confident doing so.
It is important to understand that this is a general assessment and that in any group there will be
people who are atypical. For example, some current non-cyclists may actually be experienced and
enthusiastic cyclists who simply do not have anywhere to store a bike at present and who, given
the opportunity, would become frequent cyclists. The evidence suggests, however, that there are
more significant barriers for most non-cyclists and that a gentler progression towards cycling is
more likely for much of this group.

Analysis of Cycling Potential
32
Chapter 5 Identifying the cycling market
This Chapter introduces TfL‟s new Cycle Market Segmentation, an analysis derived from a range of
data sources that evaluates the influences over travel behaviour in order to identify households
most amenable to cycling in future and most likely to cycle at present. Analysis of the potential for
cycle travel by market segment is presented in the Chapter, with a particular focus on the two
segments with the greatest propensity to cycle at present and most amenable to cycling in future.
Introducing TfL’s Cycle Market Segmentation
Comparing the characteristics of those making potentially cyclable trips with current London
cyclists, as presented in Chapter 4, can inform policy-makers‟ understanding of who is most likely
to respond positively to cycling interventions. Market segmentation exercises provide a more
sophisticated means of describing who is most likely to choose to cycle now and in future and
identifying where they live.
TfL‟s new Cycle Market Segmentation classifies the London population into seven segments,
evaluating the influences over travel behaviour in order to identify households most amenable to
cycling in future and most likely to cycle at present. The segmentation is a geo-demographic
classification based upon full postcode, so that each postcode is classified according to the
average characteristics of its residents. Because postcode zones are very small, resident
populations tend to be highly homogeneous and therefore such classifications can be used with a
reasonable degree of accuracy to predict the likelihood of an individual to exhibit a particular
behaviour, characteristic or attitude.
Key findings
The Cycle Market Segmentation classifies London households into seven segments based
upon their propensity to cycle at present and how amenable they are to cycling in future. In
combination, the Analysis of Cycling Potential and the Cycle Market Segmentation can identify
those trips where the potential can best be realised; in other words, trips more likely to be
cycled in future.
Two thirds of potentially cyclable trips are made by those in the four segments with a greater
than average propensity to cycle.
The segments with the greatest propensity to cycle are the Urban Living, making 900,000
potentially cyclable trips, and Young Couples and Families, making more than 600,000
potentially cyclable trips.

Analysis of Cycling Potential
33
The key inputs to the segmentation are:
TfL‟s London Travel Demand Survey – continuous survey sampling 8,000 London
households per year, providing demographics and travel behaviour patterns.
TfL‟s Market Segmentation Survey – one-off survey of 5,000 London residents carried out
in 2009 covering travel behaviour and behavioural change, attitudes to travel by mode.
TfL‟s Attitudes to Cycling Surveys – annual survey of around 1,000 London residents
covering attitudes to cycling, current and past experience of cycling.
Experian‟s MOSAIC dataset – consumer classification based upon a wide range of data
sources including the 2001 Census, government data such as the edited Electoral Roll, self-
reported lifestyle surveys and other compiled consumer data.
The strongest influences on the segmentation were travel behaviour choices and demographics
such as age, life stage and income. Weaker influences included attitudes to cycling. Chapter 4
examined the extent to which cycling frequency varies by demographic characteristics and found
that cyclists are atypical of the population as a whole; frequent cyclists tend to be white,
professional men aged 25 to 44. The segmentation reflects that finding and combines the impact
of all the demographic variations into one simple tool. In combination, the analysis of potentially
cyclable trips and the Cycle Market Segmentation can identify potentially cyclable trips made by
people with a higher than average propensity to cycle at present or in future, in other words, those
more likely to be cycled in future.
Segmenting the population
The Cycle Market Segmentation classifies the London population into seven segments, presented
in Table 5.1. The segment with the highest propensity to cycle at present is „Urban Living‟,
representing nearly a quarter of the London population. The „Manual Trades‟ and „Comfortable
Maturity‟ segments largely reject cycling – they do not cycle at present and are unlikely to do so in
future. They make up just 13 per cent of the population, concentrated in some outer London
boroughs. A postcode classified as „Urban Living‟ can be expected to generate 4.6 times as many
cycling trips as a postcode of comparative population classified as „Comfortable Maturity‟.

Analysis of Cycling Potential
34
Table 5.1 Cycle Market Segmentation - London segments
Segment Description % of London
population
Urban living Young (54% under 35), white (74%), well educated,
reasonably well-off and usually live in town/city centre
(41% in central London). Many choose to live without a
car (44%).
23%
Young couples and
families
Young (56% under 35), BAME groups (50%) and with
young children. Often tight finances, ethnic background
may present a barrier to cycling.
15%
High earning
professional
Well educated, affluent, white (83%), often working in
multinationals. Tend to use personal rather than public
transport, high car ownership (81%). More likely than
average to live in central London (24%).
11%
Suburban lifestyle Average income, heavily reliant on car (83% own a car)
and living in suburbia, especially in the south (24%) and
east (22%). Cycling for leisure is as likely as cycling for
purpose.
17%
Hard pressed
families
Difficult family finances, and often living in inner city
flats and tower blocks, especially in east (25%), west
(28%) and central (27%) London. Low car ownership
(49% no car). 58% BAME, ethnic background may
present a barrier to cycling.
21%
Manual trades Mainly white (79%) with high car ownership (70%), this
segment is unlikely to cycle with generally negative
attitudes towards cycling. 50% are under 35.
5%
Comfortable
maturity
Older (40% over 55) and retired people, white (83%), and
reasonably well off, living in suburban areas - some
potential for off-road leisure cycling.
8%
Source: Cycle Market Segmentation, TfL 2010
The group with the highest propensity to cycle, „Urban Living‟, is shown in yellow in Figure 5.1 and
concentrated in central and inner London, the South West London and in some outer London town
centres. The segment next most likely to cycle is „Young Couples and Families‟, concentrated in a
ring on the borders of inner and outer London. The segments least likely to cycle, „Manual Trades‟
and „Comfortable Maturity‟, tend to be located in outer London to the East and South East.
Most likely to
cycle
Least likely to
cycle

Analysis of Cycling Potential
35
Figure 5.1 Map of Cycle Market Segments by postcode
Source: Cycle Market Segmentation, TfL 2010
Figure 5.2 Propensity to cycle by postcode
Source: Cycle Market Segmentation, TfL 2010

Analysis of Cycling Potential
36
Potentially cyclable trips by market segment
Table 5.2 presents potentially cyclable trips by the market segment of the person making the trip. It
also lists the propensity to cycle of each segment, indexed against average use so that 100 is
average, above 100 is above average and below 100 is below average. Two thirds of the potentially
cyclable trips are made by people in the four segments with the highest propensity to cycle: „Urban
Living‟, „Young Couples and Families‟, „High Earning Professionals‟, and „Suburban Lifestyle‟, and
are shown in Figure 5.3, mapped by origin. High densities of potentially cyclable trips made by
those more likely to cycle are visible in many central London boroughs and in pockets around many
outer London town centres and across inner London, especially in the South.
Table 5.2 Potentially cyclable trips and propensity to cycle by segment
Segment Propensity to
cycle
Potentially cyclable trips
Number Percentage
Urban living 140 903,500 21%
Young couples and families 113 632,800 15%
High earning professional 106 546,700 13%
Suburban lifestyle 102 811,700 19%
Hard pressed families 85 839,600 19%
Manual trades 42 276,400 6%
Comfortable maturity 30 310,300 7%
Total 100 (average) 4,321,000 100%
Note: excludes 2,400 records with no home postcode or segment recorded
Source: Cycle Market Segmentation, TfL 2010; Analysis of Cycling Potential, London Travel Demand Survey 2005/06 to 2007/08
Figure 5.3 Potentially cyclable trips by origin, top four segments by propensity to cycle
Source: Cycle Market Segmentation, TfL 2010; Analysis of Cycling Potential, London Travel Demand Survey 2005/06 to 2007/08

Analysis of Cycling Potential
37
Spotlight on the ‘Urban Living’ - Potentially cyclable trips
People in the „Urban Living‟ segment are the prime target for cycling. They are the most likely to
cycle at present and the most amenable to cycling in future. On average, people in the „Urban
Living‟ segment cycle to a destination on 24 days per year, compared to a population average of
16.5 days. Men in the segment are more likely to cycle than women, cycling to a destination on 30
days per year compared to 16 days. Six in ten people in the „Urban Living‟ segment agree that
“Cycling is a mode of transport that you would want to be seen using”.
Figure 5.4 Map of ‘Urban Living’ postcodes
Source: Cycle Market Segmentation, TfL 2010
‘Urban Living’ – a pen portrait of a typical young man
Tom is 31, single and lives and works as a business consultant in central London. He owns a
one-bed flat in a new development but because of his hectic work and social life spends
little time there. Tom was a student in London and although he could afford a car has never
felt the need to buy one, as he can get to most places he wants to by public transport. He
owns a bike which he uses in his local area for running errands, going to football and
meeting friends at weekends. He likes the fact it gets him where he needs to be on time.
Tom uses the tube for his commute and finds it rather crowded. However, he doesn‟t
consider cycling to work an option as he needs to be suited and booted for meeting clients.
Anyway, he wouldn‟t want to be associated with the Lycra-clad brigade. Tom also feels it
would restrict the spontaneity of his after-work social life. Tom thinks the new Barclays
bikes are a good idea but he hasn‟t tried them out yet as he‟s been too busy to join up.

Analysis of Cycling Potential
38
In total, people in the „Urban Living‟ segment make more than 900,000 potentially cyclable trips
per day. Potentially cyclable trips made by those in the „Urban Living‟ segment were more likely to
be for work purposes (31 per cent compared to 24 per cent overall) and less likely to be made by
car (47 per cent compared to 63 per cent overall). This reflects the relatively low car ownership in
this segment: 44 per cent of „Urban Living‟ households do not have access to a car. Potentially
cyclable trips made by people in the „Urban Living‟ segment were also particularly likely to be made
by Underground or rail. This reflects the inner London location of most „Urban Living‟ postcodes,
as well as the fact that people with these characteristics are more likely to have a Travelcard and
therefore relatively more likely to make „short hop‟ trips by public transport, especially tube. Figure
5.5 compares potentially cyclable trips by current mode for those in the „Urban Living‟ segment
and the London population as a whole.
Figure 5.5 Potentially cyclable trips by current mode, 'Urban Living' and all London residents
47%
33%
17%
3%
63%
26%
7%5%
0%
10%
20%
30%
40%
50%
60%
70%
Car Bus Underground and rail Other
Urban living All potentially cyclable trips
Source: Cycle Market Segmentation, TfL 2010; Analysis of Cycling Potential, London Travel Demand Survey 2005/06 to 2007/08
Potentially cyclable trips made by the „Urban Living‟ are somewhat longer than average, with 44 per
cent between 2km and 5km and a quarter between 5km and 8km. As this group tend to be quite
young and generally do not have children, longer trips present less of a barrier to cycling.
A quarter of all potentially cyclable trips made by the „Urban Living‟ segment have an origin and/or
destination in central London, 44 per cent of all trips with an origin and/or destination in central
London. People in the „Urban Living‟ segment are much more likely than the population as a whole
to be making potentially cyclable trips in central and inner London, and less likely to be making
trips in outer London. Figure 5.6 presents the location of potentially cyclable trips made by those
in the „Urban Living‟ segment and in the London population as a whole

Analysis of Cycling Potential
39
Figure 5.6 Potentially cyclable trips by location, 'Urban Living' and all London residents
5%
38%
18%
28%
1%
10%
0%3%
24%
8%
54%
0%
9%
2%
0%
10%
20%
30%
40%
50%
60%
Within Central
London
Within Inner
London
Between
Central & Inner
London
Within Outer
London
Between
Central &
Outer London
Between Inner
& Outer
London
Between
Greater
London and
rest of UK
Urban living
All potentially cyclable trips
Source: Cycle Market Segmentation, TfL 2010; Analysis of Cycling Potential, London Travel Demand Survey 2005/06 to 2007/08

Analysis of Cycling Potential
40
Spotlight on ‘Young Couples and Families’ - Potentially cyclable trips
People in the „Young Couples and Families‟ segment are a good prospect for cycling. They have
relatively low car ownership (39 per cent have no car), are young and have young children. On
average, people in the „Young Couples and Families‟ segment cycle to a destination on 19 days per
year, compared to a population average of 16.5. Men in the segment are more likely to cycle than
women, cycling to a destination on 25 days per year compared to 11. Six in ten people in the
„Young Couples and Families‟ segment agree that “Cycling is a family activity”.
Figure 5.7 Map of ‘Young Couples and Families’ postcodes
Source: Cycle Market Segmentation, TfL 2010
‘Young Couples and Families’ – a pen portrait of a typical family
Aisha 28 and Daren 29, live in a terraced house in north London with their two young
children. Daren manages a call centre and uses the train for his commute to Central
London. He can‟t afford to buy a car at the moment but keeps a look out for a bargain in
Autotrader. Aisha has her hands full looking after the family and home. Now the children
are at school she works as a teaching assistant and the extra money comes in handy. Aisha
thinks a car would make her life much easier but for the moment she gets to most places by
bus. Aisha worries that as a family they are not as active as they could be and about how
much time the children spend indoors. School has started a cycle to school day once a
week. Her son is quite keen but Aisha is concerned that the local streets are not really
suitable for cycling. She would feel better if she could cycle with him and a friend has a bike
she could borrow. But, she hasn‟t cycled since she was a little girl and can‟t really imagine
herself on a bike now.

Analysis of Cycling Potential
41
In total, people in the „Young Couples and Families‟ segment make nearly 650,000 potentially
cyclable trips per day. Potentially cyclable trips made by those in the „Young Couples and Families‟
segment were more likely than average to be for education purposes (23 per cent compared to 18
per cent overall) and somewhat more likely to be made by bus (30 per cent compared to 26 per
cent overall). This reflects the dominance of families with children in this segment and also the
relatively high number of „Young Couples and Families‟ postcodes in east London, where bus use is
higher than average. Figure 5.8 compares potentially cyclable trips by current mode for those in the
„Young Couples and Families‟ segment and the London population as a whole.
Figure 5.8 Potentially cyclable trips by current mode, 'Young couples and families' and all Londoners
61%
30%
7%
2%
63%
26%
7%5%
0%
10%
20%
30%
40%
50%
60%
70%
Car Bus Underground and rail Other
Young couples & families
All potentially cyclable trips
Source: Cycle Market Segmentation, TfL 2010; Analysis of Cycling Potential, London Travel Demand Survey 2005/06 to 2007/08
The profile of potentially cyclable trips by length is very similar for the „Young Couples and
Families‟ as for the population as a whole. Around four in ten potentially cyclable trips made by
this group are less than 2km in length. There may be greater potential to convert short than longer
trips amongst this segment; notably, a quarter of the potentially cyclable trips are made by children
aged 5 to 19, including 10 per cent made by those aged 5 to 9.
As shown in Figure 5.9, potentially cyclable trips made by those in the „Young Couples and
Families‟ segment are more likely to be within inner London or travelling between inner and outer
London (43 per cent compared to 33 per cent for the general population). They are much less likely
to involve travel within or into central London than trips made by the population as whole.

Analysis of Cycling Potential
42
Figure 5.9 Potentially cyclable trips by location, 'Young couples and families' and all Londoners
1%
30%
4%
51%
0%
13%
1%3%
24%
8%
54%
0%
9%
2%
0%
10%
20%
30%
40%
50%
60%
Within Central
London
Within Inner
London
Between
Central & Inner
London
Within Outer
London
Between
Central &
Outer London
Between Inner
& Outer
London
Between
Greater
London and
rest of UK
Young couples & families
All potentially cyclable trips
Source: Cycle Market Segmentation, TfL 2010; Analysis of Cycling Potential, London Travel Demand Survey 2005/06 to 2007/08

Analysis of Cycling Potential
43
Chapter 6 Potential policy implications – moving from analysis to policy
This Chapter describes the wider implications of the analysis for cycle policy development, drawing
conclusions about how TfL and London‟s boroughs can maximise the potential available to them. It
summarises the research evidence presented in this report, and also draws upon other research
evidence collected by TfL in recent years, placing the findings of this analysis in a policy and
research wider context.
Key findings
The Mayor has set an ambitious target for growth in cycle travel: one in six potentially cyclable
trips must be cycled to achieve the target, based on the trip volumes of today.
Frequent cyclists already make the majority of cycle trips in London, but there remains some
potential for growth, particularly for the journey to work
There remains significant potential to increase cycle trip making amongst existing infrequent
cyclists – safety, traffic and lack of facilities are the greatest barriers to this
Cycling remains a minority activity – there are many people who are „just like‟ cyclists but do
not currently cycle, offering excellent potential for growth in cycle travel
The cycle mode share in central London is already close to 3 per cent and there is the potential
to achieve a mode share in the centre of the Capital to challenge that of other major European
cities
Beyond the centre, the potential to increase cycling is concentrated in pockets around the
outer London metropolitan town centres and elsewhere – boroughs in these locations are well
placed to deliver radical change
Regions expecting significant growth in population and employment have the opportunity to
„design in‟ a high cycle mode share through innovative transport and land use policies
Huge potential exists in highly dispersed trips across outer London, demonstrating the
continued need to maintain investment in interventions targeted at and able to reach all
Londoners

Analysis of Cycling Potential
44
The Mayor has set an ambitious target: to achieve a 5 per cent mode share for cycling by 2026,
representing growth of 400 per cent from 2001. By 2008, the cycle mode share had increased from
1 to 2 per cent. This increase must be repeated three times over to achieve the Mayor‟s target.
+300%
growth
2006
Walk,
24%
Cycle,
2%
PT,
31%
Car,
43%
Car,
37%
PT,
34%
Cycle,
5%
Walk,
25%
2031
London-wide mode share, Mayor’s Transport Strategy 2010
4.3 million potentially cyclable trips are made by London residents every day in the city.
Furthermore, many people travel in to the Capital every day to work, shop and use the unique array
of services London has to offer. Although most of these inbound journeys will be too great a
distance to cycle, non-residents make thousands of shorter trips within the city which could
potentially be cycled. Schemes such as Barclays Cycle Hire will help facilitate this.
Nevertheless, it would not be wise to be complacent. Based upon the trip volumes of today, one in
six of the potentially cyclable trips must actually be cycled to meet the target. Achieving
behavioural change is extremely difficult; on an aggregate level, travel behaviour in London changes
very little and very slowly. Underneath this relative stability at the aggregate level is a mass of
change at the individual and household level. This is known as „churn‟ and can be triggered by a
number of factors, including „push‟ factors that deter people from their previous choice of mode
(such as crowding, congestion or fares increases) and „pull‟ factors that encourage people towards
an alternative or generate new trips (such as new services, infrastructure or information). In addition
macro-economic factors, such as the state of the economy, can influence choice-making.
Evidence suggests that the growth in cycle travel between 2001 and 2008 was largely caused by
cyclists increasing their cycle trip-making. There is no evidence of a net increase in the number of
cyclists overall, although this disguises a level of „churn‟, so that some people stop cycling whilst
others start. LTDS showed an increase of only 3 per cent in the number of people who ever cycle
between 2005/6 and 2008/9 but an increase of nearly 50 per cent in the proportion of cyclists who
cycled frequently. A very small number of cyclists account for a large proportion of trips – recent
The Mayor has set an ambitious target for growth in cycle travel

Analysis of Cycling Potential
45
analysis of LTDS found that around 2% of London residents cycle as their main mode of travel to
work, yet this group accounts for around half of all cycle trips made in London (for all trip
purposes). So, although many people have taken up cycling in the past decade, a similar number
have stopped cycling - i.e. there has been „churn‟ but no change at an aggregate level.
It is reasonable to assume that it may be easier to persuade and enable existing cyclists to cycle
more frequently than to encourage others to cycle for the first time. There remains potential to
increase cycle travel even amongst those who cycle the most frequently. Nearly half a million
potentially cyclable trips are made by those who cycle at least once a week. In particular, only 24
per cent of those who cycle frequently and are in employment cycle to work and nearly 100,000
potentially cyclable work trips are made by frequent cyclists.
Research exploring the barriers to cycling and the factors which would encourage people to cycle
more found that frequent cyclists were more likely to be put off by their experiences with traffic
and other road users and to mention practical barriers, such as a lack of suitable parking or shower
facilities (TfL Cycling Behaviour Survey 2010). For all groups, including frequent cyclists, safety was
the most significant barrier to cycling in general and for specific trips. This suggests that, in order to
realise the remaining potential from existing frequent cyclists, practical measures to increase safety
and improve the provision of facilities will be the most effective. As infrequent cyclists begin to
cycle more frequently, they can also be expected to benefit from such interventions and be
encouraged to cycle more.
More than a million potentially cyclable trips are made each day by those who cycle, but only
infrequently. This group will encompass a wide range of people, from those who cycle just once or
twice a year and only for leisure purposes, to those who perhaps cycle relatively frequently for a
purpose, but less often than once a week. Infrequent cyclists face similar barriers to frequent
cyclists to cycling more, but these barriers are stronger and more influential. They are more
concerned about safety and other traffic on the roads, as well as about the weather, the time their
trip would take, and the facilities available to them. These factors act as a barrier preventing
infrequent cyclists from cycling more. For this group, practical facilities are important, alongside
measures to raise the perception of safety and increase confidence.
It is clearly worthwhile continuing to target existing cyclists as there remains much untapped
potential for growth – more than one and a half million potentially cyclable trips are made by this
group. Existing cyclists, both frequent and infrequent, have already overcome many of the barriers
to cycling, typically own or have access to a bike, and are much more likely to be prepared to
Frequent cyclists already make the majority of cycle trips in London, but there remains
some potential for growth amongst frequent cyclists, particularly for the journey to
work
There remains significant potential to increase cycle trip making amongst existing
infrequent cyclists – safety, traffic and lack of facilities are the greatest barriers to this

Analysis of Cycling Potential
46
consider cycling a trip. In a recent survey, when asked to select a trip they currently make by
another mode that could feasibly be cycled, 73 per cent of frequent cyclists and 60 per cent of
infrequent cyclists said that they would definitely or possibly cycle this trip, compared to only 33
per cent of non-cyclists (TfL Cycling Behaviour Survey 2010). Non-cyclists who did not have access
to a bike were less likely to say they would cycle the trip than those who did have access, and as
would be expected, those who could not ride a bike were the least likely to say they would cycle
the trip.
Cycling remains a minority activity: around a third of London residents made a cycle trip in the last
year and only one in ten cycles frequently (once a week or more). This means that there is
significant potential amongst those groups of the population already more likely to cycle – there
are many people who are „just like‟ cyclists, but don‟t cycle. This is not true for any other public
transport mode in London.
At present, those most likely to cycle are white men aged 25 to 44. Current cyclists have a higher
than average income and are more likely to be resident in inner London. Around half a million
potentially cyclable trips are currently made by men who fit this profile. TfL‟s new Cycle Market
Segmentation provides a more sophisticated understanding of the characteristics of those most
likely to cycle at present and most amenable to cycling in future. The „Urban Living‟ segment
describes this „typical London cyclist‟ – young, professional city dwellers who travel more than
average but have low levels of car ownership, driven by lifestyle choice rather than income. This
group make more than 900,000 potentially cyclable trips. A key barrier to cycling for people in the
„Urban Living‟ segment is not having a safe place to park their bike at home. Whilst difficult to
resolve in high density urban locations, overcoming this barrier could un-tap significant potential,
given that the Urban Living are the group most likely to cycle frequently when given the
opportunity.
Beyond the „Urban Living‟ segment, other groups offer good potential for cycling. In inner and outer
London, the group with the greatest propensity to consider cycling is „Young Couples and Families‟.
Clearly, measures targeted at children and families cycling together will be a particularly effective
way of encouraging change amongst this group. They are also more cost conscious and more likely
to be travelling by car than the „Urban Living‟. „Young Couples and Families‟ have very little in
common with the „Urban Living‟, demonstrating the importance of targeting interventions at the
needs of local people.
Cycling remains a minority activity – there are many people who are ‘just like’ cyclists
but do not currently cycle, offering excellent potential for growth in cycle travel

Analysis of Cycling Potential
47
Across central London and parts of inner London, there is an extremely high density of potentially
cyclable trips in general, and in particular of potentially cyclable trips made by „near market‟
segments – the potential is significant and the likelihood of realising it is good. This potential is
primarily derived from existing public transport trips, particularly bus trips, and includes a higher
than average proportion of travel to, from and in the course of work. Central London suffers from
public transport crowding at peak hours and traffic congestion. Consequently, the potential
benefits of achieving mode shift from mechanised to active modes can be considerable in terms of
relieving pressure on the network and improving the speed and reliability of individual journeys.
A key barrier to cycling more often, particularly for infrequent and non-cyclists, is time. This may
be because the time it would take to cycle a journey is not well understood. In fact, simply cycling
at the average speed of 15 km per hour is highly competitive with average speeds in central and
inner London, and cycle journeys have been found to be largely unaffected by traffic and time of
day, remaining highly predictable in nearly all conditions. One in five potentially cyclable trips made
for work purposes had an origin or destination in the Central activity zone, around 200,000 trips.
The high density of trips facilitates investment in major schemes such as Cycle Hire and the Cycle
Superhighways. There remains significant potential just beyond the boundary of the existing Cycle
Hire Zone. Expanding Cycle Hire eastwards can realise the potential in this area, but there remains
scope to introduce new measures to realise the significant potential to the west and north of the
existing zone. Existing cyclists say that a key reason for choosing to cycle is that they enjoy it, with
safety and traffic acting as major barriers for this group. The high density of travel by all modes
makes managing interactions between modes a challenge. Clearly, creative solutions to improve
safety and the quality of the cycle journey experience in central London are crucial to realising the
potential. This might include opening parks and open spaces to cyclists and improving the
permeability of the road network with new approaches to one-way streets and signage. Alongside
this, measures are required to improve the perception of cyclists by other road users, and to
improve the behaviour of the small minority of cyclists who damage the journey experience of
other travellers.
The cycle mode share in central London is already close to 3 per cent and there is the
potential to achieve a mode share in the centre of the Capital to challenge that of other
major European cycling cities, such as Berlin

Analysis of Cycling Potential
48
There are clusters of high potential across a range of locations in inner and outer London, with one
in fourteen trips having an origin or destination in the 11 outer London metropolitan town centres.
In particular, Croydon, Ealing, Kingston and Stratford offer a high density of potentially cyclable
trips made by those with a greater propensity to consider cycling. There is also significant high
density potential in inner London from Wandsworth and Lewisham southwards to Croydon.
These „high density‟ areas of potential would be suitable locations for more significant
infrastructure schemes than could be supported elsewhere in outer London; similarly to central
London, many of the trips are essentially radial in nature, travelling to the town centres from the
surrounding area. However, the trips made and people making the trips are very different in
character to those in central London, so solutions would need to be tailored to the specific needs
of the area. For example, there is significant potential to promote cycling as a low cost alternative
to the car in outer London, and to develop creative solutions such as „cycle hubs‟ and local route
improvements. The greater access to green space and large volume of low-traffic local roads allow
for the development of schemes which would simply not be possible in central London.
The London Plan allows for a step-change in development in east London, predicting 600,000 new
people and 160,000 new jobs in the region by 2031. The analytical tools presented here only allow
assessment of potential based upon current trip and population profiles. These reveal a large
number of potentially cyclable trips taking place in the region – 1.1 million – but also show that the
population making the trips have a relatively low propensity to cycle; it would be harder to realise
the potential in east London than in some other regions. This reflects other work carried out by TfL
which found that residents of the region tend to aspire to drive and that, despite low average
incomes in the region, the walk and cycle mode share is relatively low.
Nevertheless, there are reasons to focus on east London. The London Borough of Hackney has
shown that, despite these constraints, it is possible in the east end to deliver a cycle mode share
far above the norm. Investment related to the Olympic legacy will deliver improvements in the
urban realm and a network of Greenways across the region, as well as an Olympic park that
includes a velodrome. Major developments offer the opportunity to introduce innovative new
schemes and policy initiatives, making it easy for residents to choose to cycle for their journeys.
This might include a cycle-friendly urban realm, car-free or low car developments, good quality and
abundant cycle facilities in homes and at destinations, and a permeable network of streets and
routes suitable for cyclists of all ages and levels of experience. This may have two effects, firstly,
Regions expecting significant growth in population and employment have the
opportunity to ‘design in’ a high cycle mode share through innovative transport and land
use policies
Beyond the centre, the potential to increase cycling is concentrated in pockets around
the outer London metropolitan town centres and elsewhere – boroughs in these
locations are well placed to deliver radical change

Analysis of Cycling Potential
49
to encourage those who would like to be able to cycle to move into the area, and secondly, to
overcome some of the major barriers to cycling for the existing population. Further work is required
to understand the extent to which cultural barriers to cycling can be overcome or to what extent
they may act as a limit to the growth of cycling in the region.
Furthermore, Canary Wharf and the new metropolitan town centre at Stratford will act as major
employment hubs, drawing in workers from across London and the South East. It will be necessary
to encourage more sustainable modes; schemes like cycle hire offer both residents and non-
residents the opportunity to cycle their journeys.
More than half the potential for cycling is highly dispersed across outer London, from trips largely
made by car. The diffuse nature of these trips means that it is not practical to provide a public
transport alternative and, similarly, it would not be cost effective to invest in expensive cycling
infrastructure in these areas. Typically, trip-makers in outer London are less amenable to cycling
and find the car a convenient and cost effective means of travel. Nevertheless, the volume of
potentially cyclable trips made across outer London merits attention. In particular, encouraging
people to cycle (or walk) very short car trips could reduce pressure on the road network. Measures
that can reach a large number of people at relatively low cost, such as marketing initiatives,
workplace and school travel plans, can be worthwhile, even if the resulting take-up rate is lower
than would be expected in central and inner London. If just one in ten of the potentially cyclable
trips dispersed across outer London were to be cycled, this would deliver nearly 250,000 trips, a 50
per cent increase on the current pan-London total.
Huge potential exists in highly dispersed trips across outer London, demonstrating the
continued need to maintain investment in interventions targeted at and able to reach all
Londoners
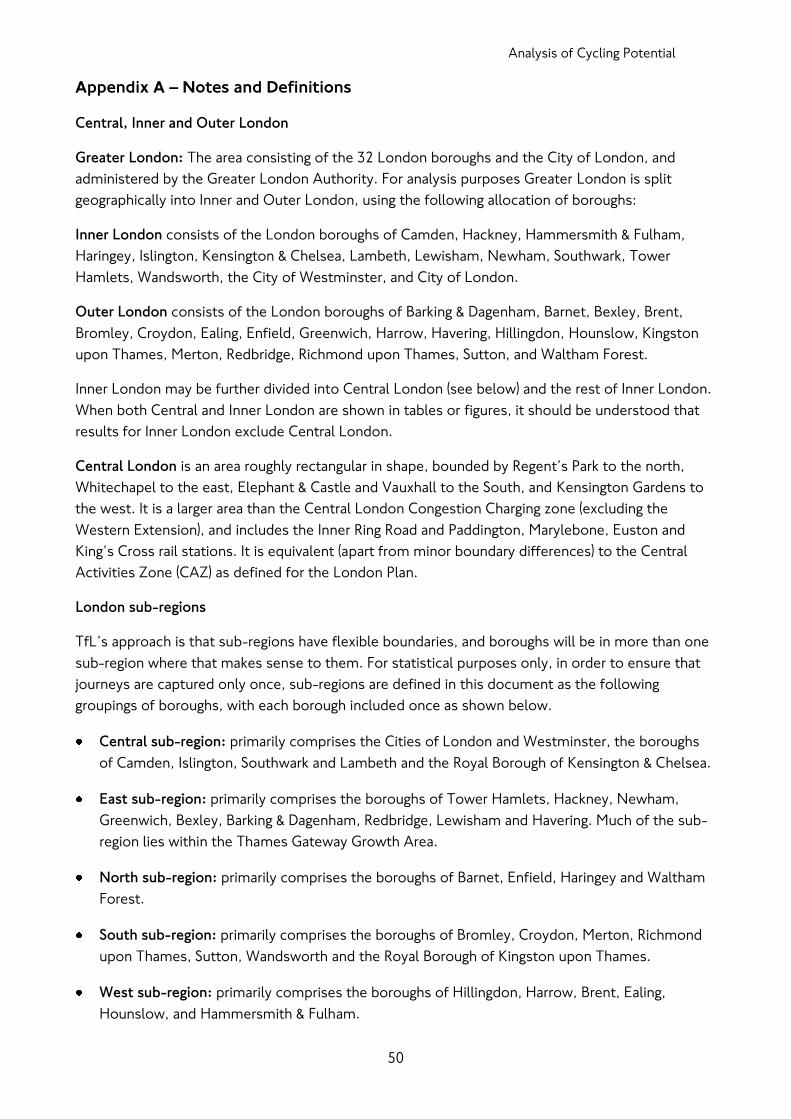
Analysis of Cycling Potential
50
Appendix A – Notes and Definitions
Central, Inner and Outer London
Greater London: The area consisting of the 32 London boroughs and the City of London, and
administered by the Greater London Authority. For analysis purposes Greater London is split
geographically into Inner and Outer London, using the following allocation of boroughs:
Inner London consists of the London boroughs of Camden, Hackney, Hammersmith & Fulham,
Haringey, Islington, Kensington & Chelsea, Lambeth, Lewisham, Newham, Southwark, Tower
Hamlets, Wandsworth, the City of Westminster, and City of London.
Outer London consists of the London boroughs of Barking & Dagenham, Barnet, Bexley, Brent,
Bromley, Croydon, Ealing, Enfield, Greenwich, Harrow, Havering, Hillingdon, Hounslow, Kingston
upon Thames, Merton, Redbridge, Richmond upon Thames, Sutton, and Waltham Forest.
Inner London may be further divided into Central London (see below) and the rest of Inner London.
When both Central and Inner London are shown in tables or figures, it should be understood that
results for Inner London exclude Central London.
Central London is an area roughly rectangular in shape, bounded by Regent‟s Park to the north,
Whitechapel to the east, Elephant & Castle and Vauxhall to the South, and Kensington Gardens to
the west. It is a larger area than the Central London Congestion Charging zone (excluding the
Western Extension), and includes the Inner Ring Road and Paddington, Marylebone, Euston and
King‟s Cross rail stations. It is equivalent (apart from minor boundary differences) to the Central
Activities Zone (CAZ) as defined for the London Plan.
London sub-regions
TfL‟s approach is that sub-regions have flexible boundaries, and boroughs will be in more than one
sub-region where that makes sense to them. For statistical purposes only, in order to ensure that
journeys are captured only once, sub-regions are defined in this document as the following
groupings of boroughs, with each borough included once as shown below.
Central sub-region: primarily comprises the Cities of London and Westminster, the boroughs
of Camden, Islington, Southwark and Lambeth and the Royal Borough of Kensington & Chelsea.
East sub-region: primarily comprises the boroughs of Tower Hamlets, Hackney, Newham,
Greenwich, Bexley, Barking & Dagenham, Redbridge, Lewisham and Havering. Much of the sub-
region lies within the Thames Gateway Growth Area.
North sub-region: primarily comprises the boroughs of Barnet, Enfield, Haringey and Waltham
Forest.
South sub-region: primarily comprises the boroughs of Bromley, Croydon, Merton, Richmond
upon Thames, Sutton, Wandsworth and the Royal Borough of Kingston upon Thames.
West sub-region: primarily comprises the boroughs of Hillingdon, Harrow, Brent, Ealing,
Hounslow, and Hammersmith & Fulham.

Analysis of Cycling Potential
51
Trips and Journey Stages
Trip: A trip is defined as a one-way movement from one place to another to achieve a single main
purpose. Round trips are divided so that the return leg is treated as a separate trip. A single trip may
use several methods or modes of transport, which divide the trip into its separate stages. In this
way, trip rates can be analysed by trip main mode, based on distance: the main mode of a trip is
the mode on which the greatest proportion of the total trip distance is travelled.
Journey stage: Trips may be further subdivided into journey stages, the component parts of a trip
using a single mode of transport between interchanges. Walking is counted as a separate mode, but
walks within single premises or between platforms at interchange stations are not included.
Journey Purposes
The purpose of a trip is defined by the activity at the destination, except when the trip is returning
home in which case the purpose is defined by the activity at the origin. The following purposes are
defined:
Work/commuting – travel to, or from, the respondent‟s usual place of work;
Employer‟s business/other work – travel in course of work, or to work at a location that is not
the respondent‟s usual workplace;
Education – travel as a pupil or student to or from school, college or university;
Escort education – accompanying a child to, or from, school;
Shopping and personal business – including shopping and use of services such as hairdressers,
dry-cleaners, doctors, dentists, banks, solicitors, etc;
Leisure – travel to, or from, entertainment, sport or social activities;
Other (including escort) – all purposes not otherwise classified, including accompanying or
meeting another person if that is the main purpose of the trip.
Weekday time periods
AM peak – morning peak, 07:00 to 10:00.
Inter-peak – 10:00 to 16:00.
PM peak – evening peak, 16:00 to 19:00.
Evening – 19:00 to 22:00.
Night-time – 22:00 to 04:00.
Early am – 04:00 to 07:00.

Analysis of Cycling Potential
52
Work status
Working full-time: People in paid employment normally working for more than 30 hours a week.
Working part-time: People in paid employment working for not more than 30 hours a week.
Self-employed: Those who in their main employment work on their own account, whether or
not they have any employees.
Analysis of Cycling Potential
53
Appendix B – Glossary of principal sources of data
London Travel Demand Survey (LTDS): Annual sample survey of 8,000 randomly selected
households in London and the surrounding area (within the M25). Interviewer-administered sample
survey including a one-day travel diary. The data have been expanded to represent the household
population of Greater London.
Analysis of Cycling Potential: Tool derived from the LTDS 2005/06 to 2007/08 dataset, identifying
trips made at present by other modes, and assessing whether they could potentially be cycled,
based on a set of criteria about the person and trip. The Tool is derived from a sample of 19,000
households and 42,000 residents. Trips were excluded if they were:
Already walked or cycled;
Made by young children, elderly and/or disabled people;
Longer than 8km or would take at least 20% more time if cycled (based upon an average
cycle speed of 15km/hour);
Made between 8pm and 6am; or
Carrying heavy or bulky goods.
Cycle Market Segmentation: Geo-demographic tool classifying the London population into seven
segments, evaluating the influences over travel behaviour in order to identify households most
amenable to cycling in future and most likely to cycle at present. Key inputs include the LTDS and
other TfL surveys as detailed below.
Market Segmentation Survey 2009: One-off survey of 5,000 London residents carried out online in
2009 covering travel behaviour and behavioural change and attitudes to travel by mode.
Attitudes to Cycling Survey: Annual survey of around 1,000 London residents covering attitudes to
cycling, current cycle behaviour and past experiences of cycling.
Experian’s MOSAIC dataset: Consumer classification based upon a wide range of data sources
including the 2001 Census, government data such as the edited Electoral Roll, self-reported
lifestyle surveys and other compiled consumer data.