analysis of copper in a penny by atomic absorption ... · pdf fileanalysis of copper in a...
TRANSCRIPT

Analysis of Copper in a Penny by Atomic Absorption Spectroscopy and Ultraviolet-Visible Spectroscopy
Abstract The composition of the penny has never been static due to the price of copper fluctuating with time. The definitive year the composition of the penny was changed was 1982 where the penny had changed form 95% copper to 5% copper. After obtaining a 1981 penny, the analysis of copper mass percent in a pre-1982 penny was determined through two analytical techniques, atomic absorption spectroscopy (AA) and ultraviolet-visible spectroscopy (UV-Vis). The 95% copper 5% zinc penny was found to have 91 (±9) mass percent copper for AA and 89.2 (±0.2) % mass percent copper for UV-Vis. The use of the two different methods were used because of their unique differences selectivity. AA is known to atomize the sample and subject to a flame while UV-Vis examines the ions in the solution and their ability to absorb at different wavelengths. In the end with the use of a T test, the two methods were found to be statistically the same. Introduction: It costs more money to create a penny than a penny is actually worth. As metals increase in value, it gets increasingly difficult to keep low money denominations in circulation. To decrease the cost of the penny, the penny had to undergo changes in its metal composition. It is a common misconception to think that a penny is currently composed of pure copper. The original pennies minted from 1793-1857 were 100% copper but were changed over time to have less copper in them. The current penny, made after 1982, is an alloy which is defined as a mixture of metals: copper and zinc. Before 1982, the composition of the penny was 85% copper which then decreased to 2.5% thereafter2. The change from 85% copper to a sparse 2.5% copper is due to the changing values of copper and efforts to keep the cost of producing a penny to a minimum. The 2.5% portion of copper is used to keep the distinguishing copper color on an otherwise pure zinc penny. This type of penny is a copper plated zinc penny that is mainly in circulation today. To determine the mass percent of copper in a pre 1982 penny, a solution of its ions must be prepared. The penny can be dissolved in a concentrated nitric acid diluted with water. Nitric acid is a corrosive acid that is strong enough to dissolve copper into solution. The reaction is as follows:
Cu(s) + 4HNO3(aq) —> Cu(NO3)2(aq) + 2NO2(g) + 2H2O(l) (1)
With concentrated nitric acid, the solid copper penny will be stripped of its copper to make Cu(NO3)2 or simply Cu2+. It is expected that the solution will turn a distinct blue color because the copper ions are absorbing orange light strongly. The blue light that the copper solution reflects off is the light that reaches the eyes and is observed as blue. Since zinc is also a significant component of the penny, zinc ions are expected to be in solution as well. Although this is true, zinc ions will not change the color of solution because zinc nitrate is colorless. The zinc ion solution is colorless because it does not adsorb any wavelengths of visible light. The reaction between concentrated nitric acid and the present zinc metal on the penny is as follows:
Zn (s) + HNO3 (aq) —> H2 (g) + Zn(NO3)2 (aq) (2)
Since pre 1982 pennies are composed of 85% copper and 15% zinc, the sample solution will contain various ions such as copper and zinc ions. The solution that contains the penny alloy being dissolved in nitric acid will contain zinc nitrates and copper nitrates. Once these copper and zinc ions are in solution, the solution can now be analyzed using laboratory techniques such as atomic adsorption spectroscopy and ultraviolet-visible spectroscopy. The solution containing both copper and zinc nitrates can be analyzed using an ultraviolet-visible spectrophotometer with an addition of a reference. Since the double beam spectrophotometer will be used, a reference will be required. The reference will be made with the identical standard 1% nitric acid that was used to dissolve the penny. Ultraviolet-visible spectrophotometer will shoot a spectrum of

wavelengths of light at the sample and a reference simultaneously and measure the sample’s irradiance, P, which is the light that leaves the analyte and into the detector. From this measurement, P, we can then measure the adsorption, A, of the analyte in solution where P0 is the initial incoming incident ray.
A = log P0 / P (3)
Once adsorption is found, it can be used in Beer’s Law to find the concentration in the sample. A = ε b c (4) The path length, b, is measured in centimeters which is the measurement of the length of the cuvet in which the light travels through. ε, the molar absorptivity, is the amount of light absorbed by the species in solution at a specific wavelength. By using the differences in solution color, the spectrophotometer can distinguish between the adsorption of the colored copper and the colorless zinc ions. Observing near 580-620 nm, where orange light starts, will allow us to see the absorption of copper on the spectrophotometer but not measure the adsorption due to zinc being colorless. Colorless solutions such as zinc do not absorb any light in the visible spectra, contributing to its colorless properties. Since zinc cannot adsorb any wavelengths in the visible spectra, zinc is ideal to help select for copper using a ultraviolet-visible spectrophotometer. It is important to note that this the main method of selectivity in the analysis of mass percent of copper in a copper penny. The ultraviolet-visible spectrophotometer will be able to measure the adsorption of orange light of copper whilst bypassing the other ions in solution that cannot adsorb the light such as zinc. Atomic adsorption spectroscopy is the other technique that is employed to analyze the composition of a pre 1982 penny. As stated, it is expected to have both ions in solution but the method of atomic adsorption spectroscopy is different than that of ultraviolet-visible spectroscopy. The atomic adsorption spectroscopy will absorb atoms instead of ions that ultraviolet-visible spectroscopy will adsorb. The sample will be subjected to a flame which will evaporate the sample at 2000-3000 K and atomize the remaining particles in solution1. These particles are the copper and zinc atoms will have photons of light emitted once atomized and heated with the flame. Much like a ultraviolet-visible spectrophotometer, there will be a detector at the end which will measure the light that was emitted by the atoms being vaporized in the flame. The light source will be a specific hollow-cathode lamp filled with a known element, copper. The hollow-cathode lamp, filled with copper vapor, will be utilized to dial in the desired emission lines and eliminate any light entering the detector due to the flame itself. The hollow-cathode lamp will also serve to selectively analyze copper and not zinc because zinc will not be in the lamp. Light that zinc will emit will be present in the data but will not be near the specific emission lines due to the copper filled hollow-cathode lamp1. The atomic adsorption spectroscopy will be able to more accurately distinguish between the copper and zinc ions in solution because it is a very sensitive piece of equipment. The atomic adsorption spectroscopy, then, will be the superior choice in terms of performance and accuracy. Performing both atomic adsorption spectroscopy and ultraviolet-visible spectroscopy will allow data comparisons between the instruments and test for accuracy of the instruments. Experimental: The procedures of the lab manual provided by California State University, Fullerton were followed precisely to determine the mass percent of copper in a penny using both atomic absorption spectroscopy (AA) and ultraviolet-visible spectroscopy (UV-Vis). A calibration curve was constructed for both instruments by using standard dilutions. To make the standard dilutions, 80 mL of 1 M copper nitrate was obtained and diluted using 1% nitric acid. No more than 20 fold dilutions were ever used to ensure the accuracy of the dilutions. The dilutions used for UV-Vis were 0.1, 1 x 10⁻², 5 x 10⁻³, 1 x 10⁻³, 5 x 10⁻⁴ M. For AA, 1 x 10⁻⁴, 5 x 10⁻⁵, 1 x 10⁻⁵, 5 x 10⁻⁶ M were used to construct the calibration curve3. For a more precise calibration curve, the 5 x 10⁻⁶ M standard dilution had to be thrown out.

Once the calibration curves were constructed with the various standard dilutions, the sample solution was to be prepared. A 1981 penny was dissolved in concentrated nitric acid to yield our copper nitrate solution. The solution was transferred into a separate beaker and dilutions were performed to obtain the sample to be tested. In the UV-Vis, a 20-fold dilution was performed and labelled sample 1. Similarly, for AA, a 20-fold dilution was performed and then a 1000-fold dilution was performed stepwise, never exceeding more than a 20 fold dilution in a single step3. This dilution was labelled sample 2 and was subject to testing with the AA. All dilutions were stored in a small plastic bottle until testing. Sample 1 was first to be tested by the UV-Vis spectrophotometer (SHIMADZU U-Visible Spectrophotometer UV-1601) and the absorbance was recorded. The spectrophotometer was blanked with identical 1% nitric acid used in the standard dilutions. The limit of detection was determined by using a 5 x 10⁻⁴ M standard dilution and recording 7 replicate measures2. A check standard (Check standard A – 2.995 x 10⁻³ M Copper (II) Nitrate in 1% Nitric Acid) was also used to test the accuracy of the instrument. Sample 2 was to be tested by the atomic absorption spectrophotometer (Buck Scientific Atomic Absorption Spectrophotometry 210VGP) and the absorbance was recorded over 10 replicate measures. The spectrophotometer was blanked with identical 1% nitric acid used in the standard dilutions. The limit of detection was also found using the measurements taken from sample 2. Replicate measures were taken to determine the limit of detection. A check standard (Check standard B – 3.1 x 10⁻⁵ M Copper (II) Nitrate in 1% Nitric Acid) was also used to test the accuracy of the instrument. Results: Atomic absorption spectroscopy One of two methods to be used in the analysis of copper in a pre-1981 penny is atomic absorption spectroscopy using the atomic absorption spectrophotometer (Buck Scientific 210VGP). The concentration was determined through replicate measures of absorption values and calculating the concentration using a calibration curve. The calibration curve used for atomic absorption spectroscopy was constructed with the standard additions before measuring the sample. The calibration curve, shown in figure 1, shows a linear relationship with a R2 of 0.9928. To obtain a more linear relationship, the last data point for 5 x 10⁻⁶ M was discarded so only 3 data points are included in the construction of the calibration curve.
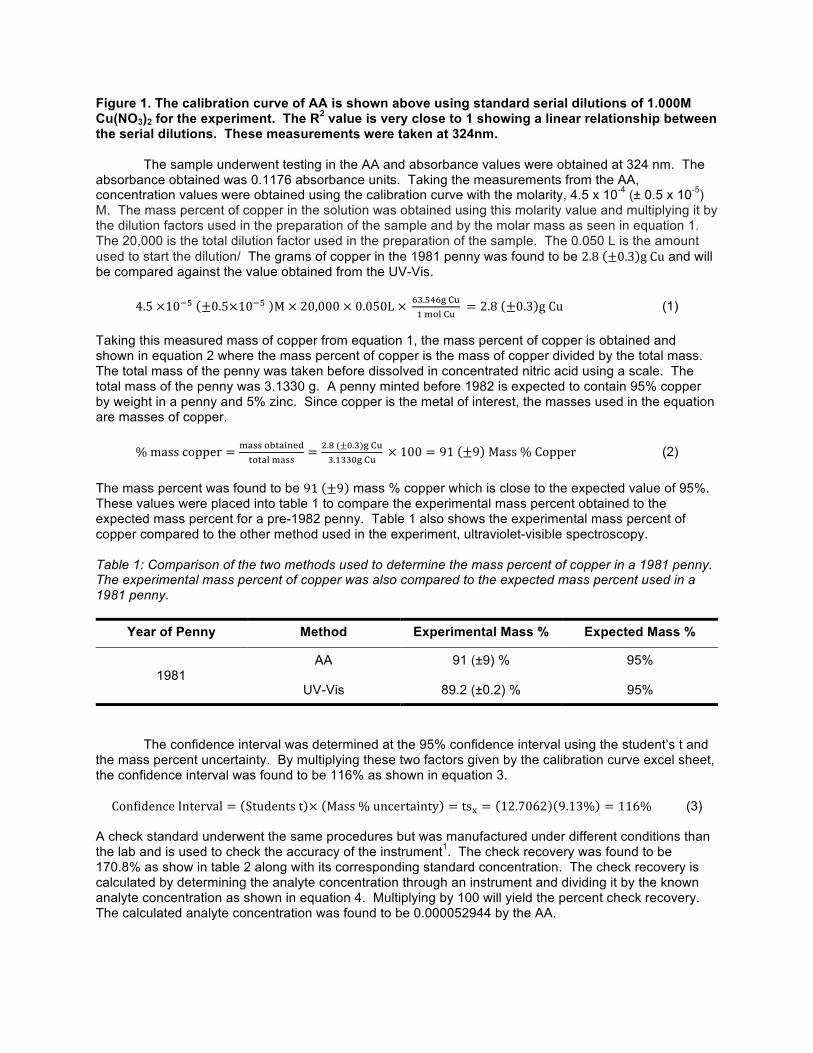
Figure 1. The calibration curve of AA is shown above using standard serial dilutions of 1.000M Cu(NO3)2 for the experiment. The R2 value is very close to 1 showing a linear relationship between the serial dilutions. These measurements were taken at 324nm.
The sample underwent testing in the AA and absorbance values were obtained at 324 nm. The absorbance obtained was 0.1176 absorbance units. Taking the measurements from the AA, concentration values were obtained using the calibration curve with the molarity, 4.5 x 10⁻⁴ (± 0.5 x 10⁻⁵) M. The mass percent of copper in the solution was obtained using this molarity value and multiplying it by the dilution factors used in the preparation of the sample and by the molar mass as seen in equation 1. The 20,000 is the total dilution factor used in the preparation of the sample. The 0.050 L is the amount used to start the dilution/ The grams of copper in the 1981 penny was found to be 2.8 ±0.3 gCu and will be compared against the value obtained from the UV-Vis.
4.5×10/0 ±0.5×10/0 M×20,000×0.050L×45.064789:;<=89
= 2.8 ±0.3 gCu (1)
Taking this measured mass of copper from equation 1, the mass percent of copper is obtained and shown in equation 2 where the mass percent of copper is the mass of copper divided by the total mass. The total mass of the penny was taken before dissolved in concentrated nitric acid using a scale. The total mass of the penny was 3.1330 g. A penny minted before 1982 is expected to contain 95% copper by weight in a penny and 5% zinc. Since copper is the metal of interest, the masses used in the equation are masses of copper.
%masscopper = ;HII<JKHLMNOK<KH=;HII
= P.Q(±S.5)7895.:55S789
×100 = 91 ±9 Mass%Copper (2) The mass percent was found to be 91 ±9 mass % copper which is close to the expected value of 95%. These values were placed into table 1 to compare the experimental mass percent obtained to the expected mass percent for a pre-1982 penny. Table 1 also shows the experimental mass percent of copper compared to the other method used in the experiment, ultraviolet-visible spectroscopy. Table 1: Comparison of the two methods used to determine the mass percent of copper in a 1981 penny. The experimental mass percent of copper was also compared to the expected mass percent used in a 1981 penny.
Year of Penny Method Experimental Mass % Expected Mass %
1981
AA 91 (±9) % 95%
UV-Vis 89.2 (±0.2) % 95%
The confidence interval was determined at the 95% confidence interval using the student’s t and the mass percent uncertainty. By multiplying these two factors given by the calibration curve excel sheet, the confidence interval was found to be 116% as shown in equation 3. ConfidenceInterval = Studentst × Mass%uncertainty = ts` = 12.7062 9.13% = 116% (3)
A check standard underwent the same procedures but was manufactured under different conditions than the lab and is used to check the accuracy of the instrument1. The check recovery was found to be 170.8% as show in table 2 along with its corresponding standard concentration. The check recovery is calculated by determining the analyte concentration through an instrument and dividing it by the known analyte concentration as shown in equation 4. Multiplying by 100 will yield the percent check recovery. The calculated analyte concentration was found to be 0.000052944 by the AA.

𝑃𝑒𝑟𝑐𝑒𝑛𝑡𝐶ℎ𝑒𝑐𝑘𝑅𝑒𝑐𝑜𝑣𝑒𝑟𝑦 = pqrstrquvwqxqryuvszxsvxu{qu|zx}xz~xqxqryuvszxsvxu{qu|zx
×100 = S.SSSS0P�665.:×:S��
×100 = 171% (4) Table 2: Comparison of the check standard values for the corresponding methods used in the experiment. Check standards is a standard prepared under different conditions than the rest of the experiment and is used to to verify the calibration accuracy. An acceptable check standard recovery is in the range of 85-115%.
The limit of detection (LOD) was found by equation 5 as seen below where s is the standard
deviation of several replicate measures and m is the slope of the calibration curve. For s, the standard deviation data is determined and calculated through the excel spreadsheet under the LINEST function. The slope of the line is given in figure 1 where the equation of the line is form y=mx+b.
3 ��= 5(6.0×:S��)
5.:6P×:S��= 4.3×10/5M (5)
From equation 5, an LOD value is obtained. This value was placed into table 3 for direct comparison of the two methods. To determine the limit of quantitation, a similar equation is used in which the variables are still s, the standard deviation, and m, the slope of the line multiplied by 10 as shown in equation 6.
10 ��= :S(6.0×:S��)
5.:6P×:S��= 1.43×10/PM (6)
This value can be seen in table 3. Sensitivity was determined by using a similar equation as LOD, equation 5, and LOQ, equation 6.
��= 5.:6P×:S��
6.0×:S��= 698.2M/: (7)
The LOD, LOQ, and sensitivity were all placed into table 3 to directly compare the the two methods. Table 3: A direct comparison of the LOD, LOQ, and sensitivities are listed for each method of analysis for the determination of copper in a pre-1982 penny.
Ultraviolet-Visible spectroscopy The second method used in the experiment to determine the mass percent of copper in a pre-1982 penny is ultraviolet-visible spectroscopy (UV-Vis) from 550-790nm. Using the 5 data points from the standard dilutions, a calibration curve was made with an R2 value of 0.9999 as shown in figure 2. This R2 value shows a very linear relationship which makes the calibration curve more accurate when using to determine the mass percent of copper in the penny.
Method Standard Standard Concentration (M) Recovery
UV-Vis A 2.995 x 10⁻³ 88%
AA B 3.1 x 10⁻⁵ 171%
Method LOD (M) LOQ (M) Sensitivity (M-1)
UV-Vis 2.6 x 10⁻⁵ 8.6 x 10⁻⁵ 120,000
AA 4.3 x 10⁻³ 1.4 x 10⁻² 700

Figure 2. The calibration curve of UV-Vis is shown above using standard serial dilutions of 1.000M Cu(NO3)2 for the experiment. The R2 value is very close to 1 showing a linear relationship between the serial dilutions. These measurements were taken from 550-790nm.
After constructing the calibration curve, the sample was measured in the UV-Vis from 550-790nm3. The peak absorbance measurement was taken at 790nm and inserted into the calibration curve equation. This can be seen in figure 3 where a sample data was run with UV-Vis.
Figure 3: The sample data plot was taken from 550-790nm using a Ultraviolet-Visible spectrophotometer (SHIMADZU U-Visible Spectrophotometer UV-1601) and the absorbance was recorded at the peak of 790nm.
00.10.20.30.40.50.60.70.80.91
1.11.21.3
550 600 650 700 750 800
Absorban
ce(au)
Wavelength(nm)
SamplePlot
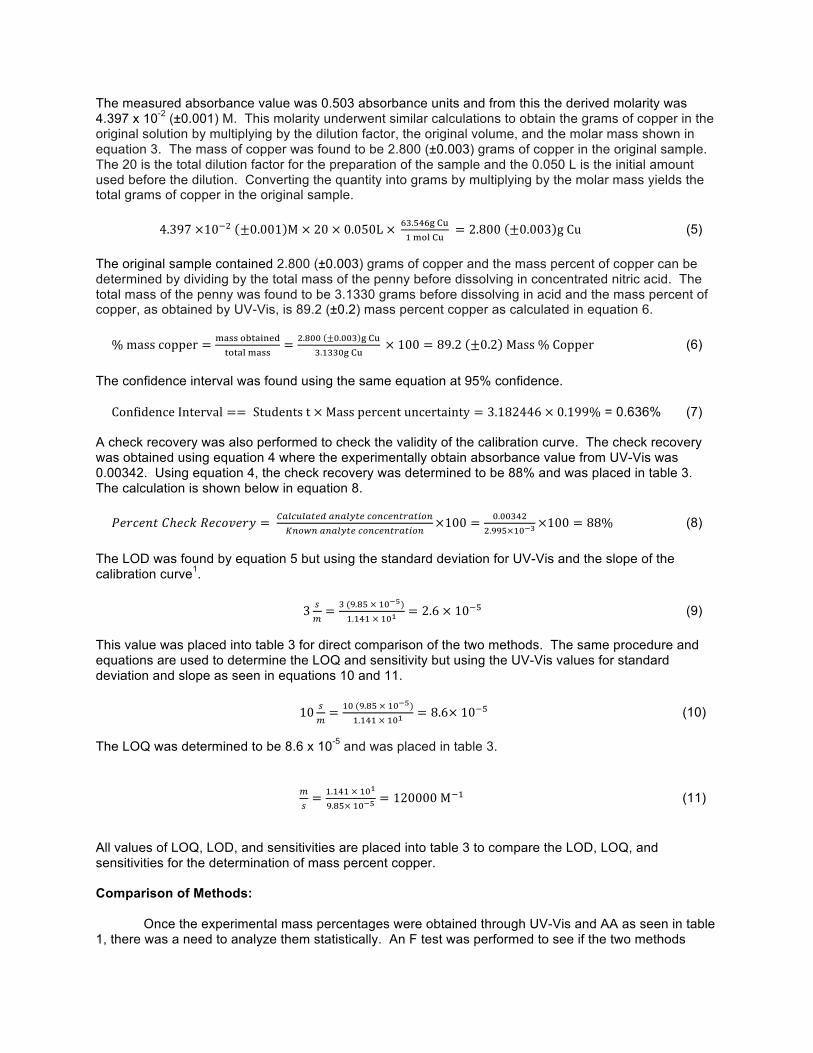
The measured absorbance value was 0.503 absorbance units and from this the derived molarity was 4.397 x 10⁻² (±0.001) M. This molarity underwent similar calculations to obtain the grams of copper in the original solution by multiplying by the dilution factor, the original volume, and the molar mass shown in equation 3. The mass of copper was found to be 2.800 (±0.003) grams of copper in the original sample. The 20 is the total dilution factor for the preparation of the sample and the 0.050 L is the initial amount used before the dilution. Converting the quantity into grams by multiplying by the molar mass yields the total grams of copper in the original sample.
4.397×10/P ±0.001 M×20×0.050L×45.064789:;<=89
= 2.800 ±0.003 gCu (5) The original sample contained 2.800 (±0.003) grams of copper and the mass percent of copper can be determined by dividing by the total mass of the penny before dissolving in concentrated nitric acid. The total mass of the penny was found to be 3.1330 grams before dissolving in acid and the mass percent of copper, as obtained by UV-Vis, is 89.2 (±0.2) mass percent copper as calculated in equation 6. %masscopper = ;HII<JKHLMNO
K<KH=;HII= P.QSS ±S.SS5 789
5.:55S789×100 = 89.2 ±0.2 Mass%Copper (6)
The confidence interval was found using the same equation at 95% confidence. ConfidenceInterval == Studentst×Masspercentuncertainty = 3.182446×0.199% = 0.636% (7)
A check recovery was also performed to check the validity of the calibration curve. The check recovery was obtained using equation 4 where the experimentally obtain absorbance value from UV-Vis was 0.00342. Using equation 4, the check recovery was determined to be 88% and was placed in table 3. The calculation is shown below in equation 8. 𝑃𝑒𝑟𝑐𝑒𝑛𝑡𝐶ℎ𝑒𝑐𝑘𝑅𝑒𝑐𝑜𝑣𝑒𝑟𝑦 = pqrstrquvwqxqryuvszxsvxu{qu|zx
}xz~xqxqryuvszxsvxu{qu|zx×100 = S.SS56P
P.��0×:S��×100 = 88% (8)
The LOD was found by equation 5 but using the standard deviation for UV-Vis and the slope of the calibration curve1.
3 ��= 5(�.Q0×:S��)
:.:6:×:S�= 2.6×10/0 (9)
This value was placed into table 3 for direct comparison of the two methods. The same procedure and equations are used to determine the LOQ and sensitivity but using the UV-Vis values for standard deviation and slope as seen in equations 10 and 11.
10 ��= :S(�.Q0×:S��)
:.:6:×:S�= 8.6×10/0 (10)
The LOQ was determined to be 8.6 x 10⁻⁵ and was placed in table 3.
��= :.:6:×:S�
�.Q0×:S��= 120000M/: (11)
All values of LOQ, LOD, and sensitivities are placed into table 3 to compare the LOD, LOQ, and sensitivities for the determination of mass percent copper. Comparison of Methods:
Once the experimental mass percentages were obtained through UV-Vis and AA as seen in table 1, there was a need to analyze them statistically. An F test was performed to see if the two methods

statistically agree with one another. This normally can be done by using the standard deviations of each sets of data. Replacing the standard deviation with mass percent uncertainty is ideal for comparing two methods statistically and finding if the two methods statistically agree. The F test equation should have the larger of the two mass percentages on top to receive a Fcalculated that is greater than 1 shown in equation 12. The mass percent uncertainty for s1 will come from AA and the mass percent uncertainty for s2 will come from UV-Vis.
Fsqrstrquvw =���
���= (�)
�
(S.P)�= 2104 (12)
The F calculated was determined to be 2104. Using the degrees of freedom and an F table, one can determine the Ftable value. The Ftable value was found to be 19.0 by using the degrees of freedom where the degrees of freedom for s1 is equal to 2 and the degrees of freedom for s2 is also 2. These values were placed into table 2 where table 2 compares the the Fcalculated with Ftable.
A comparison of the means can also allow the characterization of the two methods of the analysis of copper mass percent in a pre-1982 penny. Assuming the data follows a Gaussian distribution, a T test was performed two test if the two data sets are significantly different in addition to the F test1. The x1 and x2 values come directly from the mass percent obtained in table 1.
tsqrstrquvw = |��/��|�������
x�x�x��x�
= |�S.�6/Q�.SS|4.6046
(5)(5)5�5
= 0.71 (13)
The equation for the T test can be shown in equation 13 where a new variable, spooled is utilized. The equation for spooled is also shown below in equation 14.
𝑆�zzrvw = ���(x�/:)����(x�/:)
x��x�/P= ��(P)�S.P�(P)
6= 6.4564 (14)
This spooled can be directly inserted into the tcalculated equation in equation 10 to yield the tcalculated value of 0.71. This value is compared to the student’s ttable which gave a 4.303 where the degrees of freedom is 2 at the 95% confidence interval. These values were placed into table 4 to compare side by side the F values and T values. Table 4: Statistical analysis was performed comparing UV-Vis and AA through F test and T test. The F test compares the standard deviation of two sets of data while the T test compares the means of two sets of data.
Discussion Atomic Absorption Spectroscopy
Atomic absorption spectroscopy subjects the copper sample to a flame which will atomize the copper solution. A copper filled hollow-cathode lamp will emit light that will selectively analyze copper but not zinc. The detector on the end will capture the data which will have specific emission lines due to the copper hallow-cathode lamp. The AA is set to check the absorbance at 324 nm, where copper emission lines are ideal and zinc emission lines are not1. Zinc emission lines are ideally found when the AA is set to roughly 214nm. Since the difference in their peaks are due to the wavelength of light chosen, we exploited this to select absorbance values for copper and not measure absorbance values for zinc. Atomic absorption spectroscopy can be used to determine the mass percent of copper accurately because of the selectivity of the instrument for copper.
Fcalculated Ftable Tcalculated Ttable
2104 19.0 0.71 4.303

As seen in table 1, we are 95% confident that the mass percent of copper in the penny as determined by AA is 91% ±9 Mass % copper within 116% of the true value. This does overlap with the expected value but it is extremely high confidence interval. This is due to the decreased number of n data points which makes the confidence interval larger. In future experiments, keeping the n data points is crucial to having an adequate confidence interval. There is a higher mass percent uncertainty associated with the measurements taken from the AA which is most likely due to the number of measurements, n, taken. This can be seen through equation 3 where student’s t is calculated through the number of degrees of freedom which is the number of data points, n, minus 1. Since there is a smaller number of data points, there will also be a smaller number of degrees of freedom. An acceptable minimum range for degrees of freedom should be around 3-5. For AA, there were only 2 degrees of freedom. Though the loss of a data point on the calibration curve drastically improved the R2 value, there is also a significant gain in uncertainty and confidence at the 95% confidence level. This would contribute to determinant error that can be minimized in the future by recreating the calibration curve including the data points listed in the lab manual. This would give a more acceptable degrees of freedom value, 3. This would also later affect the results for the limit of detection, limit of quantitation, and sensitivity.
The calibration curve, shown in figure 1, shows a R2 value of 0.9928 which shows a linear relationship. As stated above, the linear relationship was obtained through the loss of a data point. With the data point of the last dilution the R2 value drops significantly to around 0.94. Since the best R2 value obtained is 1, the calibration curve is not ideal but still fit to use for the experiment. In addition, multiple absorbance measurements (10) are taken from the AA and averaged to give a final absorbance value that is used in the calibration curve. It is expected that AA would have a higher precision because of taking multiple measurements whereas in UV-Vis only one absorbance value is recorded.
The check control percent, for check standard B, was abnormally high at 170.8% which may be
attributed to the level of contamination of the check standard B. This determinant error was found after many repeat trials of AA with the check standard B. Over many trials of check control measurements, we were never able to obtain a value near 100% check recovery. A normal check recovery would be near 85-115% to confirm the validity of the calibration curve. Though 170.8% check recovery was received, we do not doubt the validity of the calibration curve. Since there are 16 students in the lab all using the same check standard multiple times, there are many opportunities for the check standard to get contaminated. Various ways would include using dirty Pasteur pipettes, returning excess check standard, or leaving the bottle open for extended amount of time. In addition, it should be noted that our check control recovery measurements were performed on different days due to the repeat trials. Different days have slightly different room temperature and pressure that might affect the sample measurements. Also, measuring on different days means you may not have the identical sample due to contamination.
The limit of detection was also severely affected by the loss of the data point by affecting the
standard deviation. Equation 9 and 10 both show the significance of the standard deviation for the calculation of the LOD and LOQ. Table 3 outlines the LOD and LOQ values as 4.3 x 10⁻³ and 1.4 x 10⁻², respectively. These values were expected to be much lower but is explained through the calculations of standard deviation. The sensitivity value of 700, listed in table 3, is also affected by the standard deviation calculation due to the decreased amount of data points. This determinant error can be accounted in future studies by increasing the different serial dilutions. Since the sensitivity value is low, that means a small change in the signal will illicit a small change in analyte concentration. This gives us another tool to characterize the atomic absorption spectrophotometer.
As with any electronic instrument, indeterminate error in the form of electronic noise will always
be present. There will always exist fluctuations in the signal in both the positive and negative directions. The atomic absorption will have traces of 1/f noise, also called drift, which was very prominent. The 1/f noise is due to the slow changes of temperature or power voltage1. Since the flame is attempting to stay at a constant temperature, there is variance in flame temperature and thus creating noise1. The flickering of the flame contributes to the absorbance values jumping up and down even when the instrument’s baseline is set. Line noise is always apparent because of the vibrational frequencies of the environment.

Ultraviolet-Visible Spectroscopy
UV-Vis spectroscopy uses ions instead of atoms to analyze the copper sample. Since copper absorbs at a different wavelength of light than zinc, it will be the main determinant factor to select copper in a solution. The observation of copper on a UV-Vis spectrophotometry is near 580-620nm. Physically, it makes sense because copper is a blue solution which means it absorbs significant amounts of orange light. As seen in the sample data plot in figure3, 790 nm is the optimal peak absorption for copper in solution. 790 nm is a deep red color and so the blue copper ions respond by absorbing this wavelength the best.
Table 1 shows that the experimental mass percent of copper in the penny is 89.2 (±0.2) mass
percent. The mass percent of copper shows that the accuracy of UV-Vis is less than that of the AA but the precision is higher. According to our data, we are 95% confident that the mass percent of copper in the penny as determined by UV-Vis is 89.2 ±0.2 Mass % copper within ±0.6mass% of the true value. This does not overlap with the expected value for a pre-1982 penny which contains 95% copper. The check recovery came back in the normal acceptable range for check recoveries with 88% check recovery seen in table 3. In table 3, there was a significant decrease in the check recovery with the UV-Vis. The acceptable range would be from 85-115% and our data shows that we are in the acceptable range. There are many opportunities for the check standard to be contaminated through pipette or returning excess check control3. There might have been less of a drop in check recovery when compared to the check standard B of AA, seen in table 3, because of its higher concentration of copper. If there was any copper contamination in the check standard, it already has a high concentration and would not be affected as much as the check standard B used for AA. Unlike AA, there was not a discrepancy between the standard deviations and the LOD, LOQ and sensitivity calculations. This is because, for UV-Vis, we kept all data points as stated in the lab manual. The limit of detection is the lowest concentration that can be used to accurately measure a sample. The LOD of 2.6 x 10⁻⁵ M, shown in table 3, shows that the limit of detection is less than sample measurements taken shown in the experimental section where the lowest concentration measured was 5.0 x 10⁻⁴ M. Since the limit of detection of significantly less than the lowest concentration measured, we may conclude that this instrument is fit to measure our samples with accuracy and precision.
The standard dilutions are greater than the detection limit for UV-Vis. For UV-Vis, we used 5 x 10⁻⁴ M of Copper (II) Nitrate but the limit of detection was only 1.5 x 10⁻⁴ M. This would mean that the standard dilutions were greater than the limit of detection. Since the limit of detection is the lowest concentration that can be used to accurately measure a sample we are in the clear to measure this dilution. The dilution can be accurately measured with this instrument. The limit of quantitation was also examined and was found to be 8.6 x 10⁻⁵ M. The limit of quantitation is similar to LOD but is the lowest concentration that the instrument can not be a reliable method to use due to diminished accuracy and precision. As expected in equation 10, there would be an increase of magnitude when compared to the LOD. Since the LOQ is still less than that of the lowest concentration sample measured, we may conclude that the instrument is precise in its measurement. The sensitivity is also an important to calculate to characterize the method of analysis. The sensitivity, shown in table 3, is 120,000 M-1 which explains the instrument’s change in signal divided by its change in analyte concentration. In essence, it is the instrument’s ability to respond precisely with small changes in concentration. As the change in the signal is small, the change in the analyte concentration on the calibration curve will be great.
As with the AA, there is instrument noise in the UV-Vis spectrophotometer which contributes to the error of the measurement. Errors that contribute to spectrophotometer’s ability to precisely measure the sample will be 1/f noise and line noise. 1/f noise, also called drift, is the noise that comes about variation of power voltage to the instrument1. It is called 1/f due to the inverse relationship that frequency has on the signal. The spectrophotometer will also have line noise which is the bottom noise due to the vibrational frequency of the environment1. All of this can be minimized for with the use of a beam chopper which will shift the analysis of the signal between the sample and the reference1. Though these noises can be minimized, they are still indeterminate error and cannot be accounted for.

Comparison of Methods
The atomic absorption spectroscopy was the more accurate technique for the determination of
copper content in a pre-1981 penny. A pre-1981 penny is expected to have 95% copper while the experimental results showed the penny was 91%. Using UV-Vis spectroscopy, the mass percent copper in our penny was 87% which was less than the expected value of 95%. This would make the atomic absorption spectroscopy the more accurate technique because it lies closest to the true value. The more precise instrument, though, was the UV-Vis. Its uncertainty was significantly smaller with only ±0.2 mass percent copper compared to the atomic absorption spectroscopy which gave ±9.13 mass % copper. This small uncertainty is attributed to having numerous replicate measures with the same experimental conditions and a small standard deviation associated with them.
Though the most accurate instrument for determining the mass percent of copper in a penny was
AA, testing to see if UV-Vis accuracy is in order. We know that UV-Vis is less accurate but UV-Vis can still be an optimal instrument for determining copper content if an AA is not present. An F Test can be performed to see if the two methods of analyzing statistically agree with each other by analyzing the differences in the standard deviation. Table 4 shows the Fcalculated and Ftable values in which statistical analysis of the standard deviation will be compared through these values. If the Fcalculated value is greater than the Ftable value, then we may accept that the difference is significantly significant at the 95% confidence level. Since table 4 lists that Fcalculated is 2104 while the Ftable value is 19.0, we may say that the two sets of data are also significantly different statistically. The Fcalculated table is a significantly greater number and, while we did expect the Fcalculated table to be closer to the Ftable value, we did not achieve those values. This is due to the loss of a data point for the constructing the calibration curve which leads to large Fcalculated values. As seen in the LINEST calibration curve document3, the number of data points, n, is a significant factor in calculating standard deviation. Since the decrease of a data point is significant, the degrees of freedom also decreases and the standard deviation increases. In addition, the F test compares standard deviations so it is expected to see a very large Fcalculated value.
The T test was also performed to see if the two sets of data is significantly different by comparing
the means of the two sets of data assuming that it is a Gaussian distribution1. Table 4 shows the tcalculated and ttable values in which we will compare the two methods. The tcalculated value was determined to be 0.71 by using equation 13. Though equation 13 has n data point terms, it does not greatly affect the tcalculated value as significantly as it does the F test. The ttable value was determined to be 4.303 at the 95% confidence interval using 2 degrees of freedom. The 2 degrees of freedom come from the 3 n terms where the degrees of freedom is n minus 1. If tcalculated is greater than ttable, we may say that the two sets of data are significantly different. We determined that the tcalculated is 0.71 which is smaller than the listed ttable vaue of 4.303. For the two methods used in the determination of copper in a pre-1982 penny and according to the T test, we may say that the two methods are not statistically different. After completing both the F test and T test, there are mixed results whether or not the two methods are statistically different than each other. I believe that they are not statistically different because the mass percentages of copper are very close and the number of data points changed a lot of values. In the future, using more data points would be ideal in completing a more accurate and precise calibration curve. In addition, the data would have a better representation the uncertainty, confidence interval, and F test values. Though the two tests do not agree with each other, we may still gauge how accurate and precise each instrument was with the current data. Based on the confidence intervals, atomic absorption spectroscopy was the more accurate technique for the determination of copper content in a pre-1981 penny. A pre-1981 penny is expected to have 95% copper while the experimental results showed the penny was 91%. Using UV-Vis spectroscopy, the mass percent copper in our penny was 87% which was less than the expected value of 95%. This would make the atomic absorption spectroscopy the more accurate technique because it lies closest to the true value. The more precise instrument, though, was the UV-Vis. Its uncertainty was significantly smaller with only ±0.2 mass percent copper compared to the atomic absorption spectroscopy which gave ±9.13 mass % copper. This small uncertainty is attributed to

having numerous replicate measures with the same experimental conditions and a small standard deviation associated with them. In addition, the calibration curve for UV-Vis was more accurate and precise. The R2 value for the UV-Visible spectrophotometry was the closer to 1 (0.9999) compared to the atomic absorption spectrophotometer (0.9928) though both were close to 1. In addition, the UV-Visible spectrophotometer was more precise because it took replicate measures consistently with the same sample over many trials. This can be seen in the LOD data where the UV-Vis only fluctuated ±(0.001) absorbance units. For future experiments, I would choose the atomic absorption spectrophotometer for future copper analysis because it came the closest to the expected mass % value of copper in the penny. I realize that one cannot get exactly 95% copper because of loss of possibly in transferring or perhaps some copper has been lost in production or overtime. I think that 91% is very close to the expected value and I think that atomic absorption spectroscopy is the best method to analyze copper in the presence of zinc. Though the sensitivities in table 3 show otherwise, atomic absorption spectroscopy is the ideal method of quantitation due to the replicate measures and the ability to test at lower concentrations. AA preferably uses more dilute mixtures compared to the UV-Vis which would make it ideal for determination of copper mass percent in a penny, especially after 1982. After 1982, the copper mass percent is near 5% which would make AA the preferred technique to analyze. Conclusion
Using both the UV-Vis and AA, we were able to determine the mass percent of copper in the 1981 penny which is expected to contain 95% copper. Table 1 shows that the AA determined the mass percent to be 91 (±9) mass percent copper while the UV-Vis determined it was 89.2 (±0.2) mass percent copper. These values are very close to the expected value of 95% with less than a 4% difference mass. This also shows the accuracy and precision of each instrument by demonstrating the instrument’s ability to come close to the expected value. The AA is the more accurate instrument but the precision could not be determined with accuracy due to the loss of a data point. The loss of the data point had also skewed our LOD, LOQ, and sensitivity measurements creating lower LOD and LOQ numbers than the lowest concentration of standard used. The AA, though, is an accurate instrument and further testing would be needed to accurately gauge the LOD, LOQ, and sensitivity measurements. UV-Vis had returned accurate LOD, LOQ, and sensitivity measurements showing LOD and LOQ were lower than the lowest concentration tested. Both the LOD, 2.6 x 10⁻⁵ M, and the LOQ, 8.6 x 10⁻⁵ M, were smaller values compared to the lowest concentration of standard used, 5 x 10⁻⁴ M. The check percent recovery was used to test the validity of the calibration curve assuming the standard was not contaminated. We believe that the check standard B used for AA was contaminated. Over multiple trials the check recovery yielded 171%, as seen in table 2, which is not in the acceptable range of a check recovery. The check standard A for UV-Vis was not contaminated with a check recovery of 88% which is in the acceptable range and confirms the validity of the method that was used to construct the calibration curve. The calibration linearity of UV-Vis can also be confirmed with the R2 value of 0.9999. Using this data from both methods, we may say that the most accurate measurement method is AA. Statistically, using the F test and T test, there was a discrepancy with agreement of whether they were statistically different. When factoring in the error associate with the F test, it is safe to say that the T test is still a valid technique and demonstrates that both methods are statistically the same.

References
1. Harris, Daniel C. Quantitative Chemical Analysis. 8th ed. New York: W.H. Freeman, 2010. Print.
2. "The United States Mint · About The Mint." The United States Mint · About The Mint. N.p., n.d.
Web. 02 Sept. 2015. 3. Haan, John. Experiments for Quantitative Analysis Laboratory Fullerton: Montezuma Publishing,
2015. Print.