analysis of competitiveness in colombian family businesses
TRANSCRIPT

1
Analysis of Competitiveness in Colombian Family Businesses
Jorge Moreno-Gómez Departamento de Gestión Organizacional, Corporación Universidad de la Costa, Colombia.
Calle 58 # 55-66, Barranquilla, Colombia. Email: [email protected]
ORCID: 0000-0002-8828-4284
Esteban Lafuente Department of Management, Universitat Politècnica de Catalunya (Barcelona Tech)
EPSEB, Av. Gregorio Marañón, 44–50, 2da planta. 08028. Barcelona. Spain Email: [email protected] ORCID: 0000-0001-5889-7656
Abstract Purpose: Building on the Resource-Based View and the Configuration Theory, this study employs a systemic and multidimensional competitiveness index—i.e., that incorporates system constraints among the ten competitive pillars that form the index—to assess the competitiveness level and the connection between competitiveness and economic performance (ROA) in family businesses. Design/methodology/approach: For the empirical application we use a unique primary dataset drawn from the Global Competitiveness Project (GCP: www.gcp.org) that includes information for 77 Colombian family businesses for 2017. Cluster analysis is used to evaluate the potential relationship between competitiveness, the configuration of competitive pillars and economic performance (ROA). Findings: The results show that the main competitive strengths are the introduction of product innovations and network (suppliers and customers), while the limited use of technologies and the low online presence are the main competitive weaknesses of the sampled firms. The findings of the cluster analysis reveal that different configurations of competitiveness pillars are associated with different performance levels. Our results contribute to identify how specific strategies aimed at improving different resources or capabilities contribute to enhance business competitiveness and, ultimately, performance. Originality/value: By using an index number that takes into account the multiple interactions between resources and capabilities, the proposed analysis not only sheds light on the drivers of competitiveness—i.e., resources and capabilities—and its connection to performance, but also contributes to understand the boundaries of the businesses’ competitiveness system as well as the strategies that can potentially enhance competitiveness and, subsequently, business performance. Keywords: Competitiveness, resource-based view, system dynamics, family business
2
Analysis of Competitiveness in Colombian Family Businesses
1. Introduction
The measurement of a country’s competitiveness has become a focus of economic
research in the last decades (Garelli, 2014; Sala-i-Martin et al., 2014). Existing research has
developed a variety of competitiveness indices to rank nations, such as the world
competitiveness ranking by the Institute for Management Development (IMD) World
competitiveness Centre (Garelli, 2014) and the ranking global competitiveness index by the
World Economic Forum (Sala-i-Martin et al., 2014). However, prior studies focus on the
measurement of competitiveness at country level, while neglecting firm competitiveness
(Cetindamar and Kilitcioglu, 2013).
One of the biggest challenges for researchers is to propose accurate measures of
business competitiveness (Ketchen et al., 2007). For example, Ajitabh and Momaya (2004)
study competitiveness-related frameworks and models, including the Asset-Processes-
Performance (APP) approach. The APP model focuses on firm’s internal assets, process
and performance, and this approach was found relevant to understand the main drivers of
competitiveness in times of economic growth and slowdown. Also, by using Porter’s
competitiveness diamond (1990) Chikán (2008) develops a general model of
competitiveness. This study represents a well-structured model that connects national- and
business-level competitiveness.
Over the last two decades researchers have witnessed how the Resource-Based View of
the firm (RBV) has become one of the dominant theoretical frameworks used to explain
competitive advantage differences among businesses (Ismail et al., 2012). Firms seek to

3
gain and develop bundles of capabilities which enable them to employ their internal
resources more effectively. The primary premise of the RBV is that resource heterogeneity
across businesses explains performance differences between them (Wong and Wong,
2011). RBV theorists propose that the associations resulting from connecting resources and
capabilities contribute to enhance business competitiveness (Prahalad and Hamel 1990;
Wernerfelt 1984). Business competitiveness is an attractive concept characterised by its
long-term orientation and dynamism (Barney, 1995; Webb et al., 2010), and is a
multidimensional construct that can be analysed from a systemic perspective (Miller, 1996;
Cetindamar and Kilitcioglu, 2013).
In most economies, family businesses (FBs) are an important source of economic
development and growth among competing firms (Astrachan, and Shanker, 2003). Prior
work highlights that FBs are characterised by idiosyncratic firm-level bundle of resources
and capabilities, because of the systemic interaction between the family, its members, and
the business (Habbershon and Williams, 1999; Habbershon et al., 2003). By examining the
outcomes that flow from the creation or development of competencies, the owner or
managers of FBs could be in a better position to balance strategic investments with actions
that contribute to manage on the organisation’s resources and capabilities efficiently,
improving competitiveness.
Most empirical work has sought to assess the contribution of different resources and
capabilities to performance (Newbert, 2008). On contrary, in this study we propose a
multidimensional business competitiveness index that considers the interdependence of a
number of resources and capabilities. By accounting for the interactions that exist between
resources and capabilities, the proposed competitiveness index connects the Resource-
Based View (Wernerfelt, 1984) with the Configuration Theory (Miller, 1996).

4
We employ the index-building methodology developed by Lafuente et al., (2016) to
scrutinise the competitiveness level of Colombian FBs. The analysis of competitiveness is
based on an index number that uses a system dynamics model that incorporates systemic
constraints between the analysed resources and capabilities. Building on the premises of the
RBV, competitiveness is defined as the set of interdependent resources and capabilities that
enable the creation or development of valuable competencies (Barney, 2001; Habbershon,
and Williams, 1999). The proposed measure of competitiveness consists of 46 variables
grouped into ten pillars that represent different resources and capabilities.
Additionally, a second stage of the study involved a cluster analysis in order to gain a
more complete picture of the competitiveness of Colombian FBs. This analysis offers the
opportunity to assess how different competencies contribute to business competitiveness in
contexts where the interactions between resources and capabilities are complex and
heterogeneous. The empirical application uses a sample of 77 FBs from different economic
sectors located in Colombia in the year 2017.
Our paper makes three contributions to the literature. First, by connecting the RBV
with Configuration Theory, we contribute to a better understanding of the factors driving
competitive advantage. This way, this study also contributes to the growing stock of
empirical literature dealing with the RBV and Configuration Theory in developing settings.
Second, existing research focused on competitiveness models at country- and business-
level has mainly focused on individual factors or capabilities that increase competitiveness
and contribute to success, growth and survival of the firm. In this sense, little attention has
been paid to the systemic analysis of competitiveness in family businesses. Our
multidimensional competitiveness model employs an index number methodology with
systemic constraints that enables multiple interactions between the different pillars that

5
shape competitiveness. Thus, the results of the proposed analysis help to identify the main
determinants of FBs competitiveness and may encourage the development of
competitiveness-enhancing support policies. Third, this article contributes to the
competitiveness literature by studying FBs in a developing country (Colombia)
characterised by continuous changes in economic policy that may affect business
performance. In the Colombian context, FBs represent 70% of the total number of firms in
the country, contribute more than 50% of the Gross Domestic Product (GDP) and provide
70% of employment (Müller et al., 2018), which further validates the importance of
studying business competitiveness in this context.
2. The Resource-Based View of the firm and business competitiveness
The theoretical basis of this study is the RBV of the firm (Wernerfelt, 1984). This
theoretical approach emphasises that resources and capabilities are the main source of
competitive advantage of businesses (Barney, 2001), and suggests that companies seek to
generate a competitive advantage by developing combinations of resources that are
valuable, rare and difficult to replace or imitate (Barney, 1991). Habbershon and Williams,
(1999) consider that different levels of investment’ differentiated investments in the
dominant resources of FBs could contribute to competitive advantage by creating
idiosyncratic combinations of resources.
The RBV considers the accumulation of resources that are valuable, rare and difficult
to replace or imitate as the basis of business competitiveness and profitability (Wernerfelt,
1984; Peteraf, 1993). Newbert (2008) suggests that valuable and rare resources are related
to competitive advantage and, subsequently, financial and economic performance. Resource
heterogeneity contributes to explain performance differences among businesses, especially

6
when it comes to creating a sustained resource-based competitive advantage (Wong and
Wong, 2011; Ismail et al., 2012). Researchers have theorised that in order to obtain
sustainable competitive advantage, firms have to possess valuable resources that are
difficult to imitate and must implemented new value-creation strategies that competing
firms will find hard to replicate (Newbert, 2007)
From the RBV point of view, FBs have the capacity to generate idiosyncratic firm-
level bundles of resources and capabilities as a result of the systemic interaction between
the family, its members, and the business (Habbershon and Williams, 1999; Nordqvist and
Melin, 2010). Chrisman et al., (2003) argued that the contributions of family members to
the business may yield to obtain distinctive resources and capabilities, which can serve as a
source of competitive advantage for the FBs. Irava and Moores (2010) show that, in the
context of FBs, a sustainable competitive advantage emerges from the combination of three
main dimensions: human resources, organizational resources, and process resources.
Competitiveness is a multidimensional concept, characterised by its long-term focus,
controllability and dynamism. From the perspective of the business, the key for formulating
a successful competitive strategy requires the understanding of the relationships between
resources and capabilities (Sirmon et al., 2007) as well as of the characteristics of the
environmental context in which the firm operates (Chirico and Bau, 2014).
Competitiveness is a complex construct that should be assessed from a holistic
approach in order to better understand how organizations ‘do business’ (Barney, 1995). The
core of our analysis is to match resources and capabilities with the creation of value-adding
competencies, while acknowledging the multidimensionality of competitiveness, as well as
the complementarities that exist between a business’ resources and capabilities.

7
In this study we follow the methodology proposed by Lafuente et al., (2016) to
measure competitiveness using a systemic index number. These authors define
competitiveness as a mutually dependent bundle of ten pillars: human capital, product,
domestic market, networks, technology, decision making, strategy, marketing,
internationalization and online presence, that allow a firm to effectively compete with other
firms and serve customers with valued goods/services.
3. Proposal for assessment of business competitiveness
Organisations have different strengths and weaknesses in terms of resources and
capabilities, and it is critical for these to be identified because the key to a business’ success
and its future development lies in its ability to create or develop valuable competencies
(Teece et al., 1997). Competitiveness has been operationalized in several ways. Previous
studies have highlighted a number of firm-specific competitive factors; but attempts to
measure competitiveness have been based on individual variables or on the estimation of
aggregate metrics in which the analysed components contribute individually to
competitiveness (Douglas and Ryman, 2003; Fernhaber and Patel, 2012). These measures
capture the level of statistical association between the analysed variables. However, studies
of competitiveness based on aggregate indicators may not efficiently capture the possible
connections between resources and capabilities. Building on Lafuente et al., (2016) and
following the theory in section 2, we propose that:
Competitiveness is a mutually dependent bundle of ten pillars: human capital, product,
domestic market, networks, technology, decision making, strategy, marketing,
internationalization and online presence, that allow a firm to effectively compete with other
firms and serve customers with valued goods/services.

8
The chosen pillars of competitiveness coincide with the postulates of the RBV (Webb
et al., 2010; Peteraf, 1993), and their relevance arises from the recognition that there may
be multiple interactions within the firm and that the intensity of these relationships affects
competitiveness. FBs present significant peculiarities in terms of organisation, resource
allocation, management styles and strategic choices (Irava and Moores, 2010). FBs are
faced with major resource constraints that increase their vulnerability with respect to
environmental changes. SMEs often lack resources that are especially vital for their
survival and performance (Newbert, 2007). As a result, networks, external partnerships and
efficient channels for disseminating knowledge are critical competencies (Díaz-Chao et al.,
2016). Innovation is another variable that is frequently used to explain small firms’
differentiating behaviour (Farinha et al., 2018). In addition, the use of ICT-based skills is
increasingly considered a central element of SME strategy (Spinelli, 2016). One of the new
features of our approach to competitiveness is the inclusion of the firm’s online presence
and the application of information technologies. There have been several attempts to
develop a variety of competitiveness measures, but the multidimensional nature of the
relations between the analysed competencies has been largely ignored in the literature. By
connecting the RBV with the postulates of Configuration Theory, we propose a five-step
procedure to compute business competitiveness.
To estimate the competitiveness index, we first normalise in the [0,1] range all
variables included in the analysis (j = 1,…,J):
,*, max( )
i ji j
j
xx
x , j = 1,…,J and i = 1,…,N (1)
9
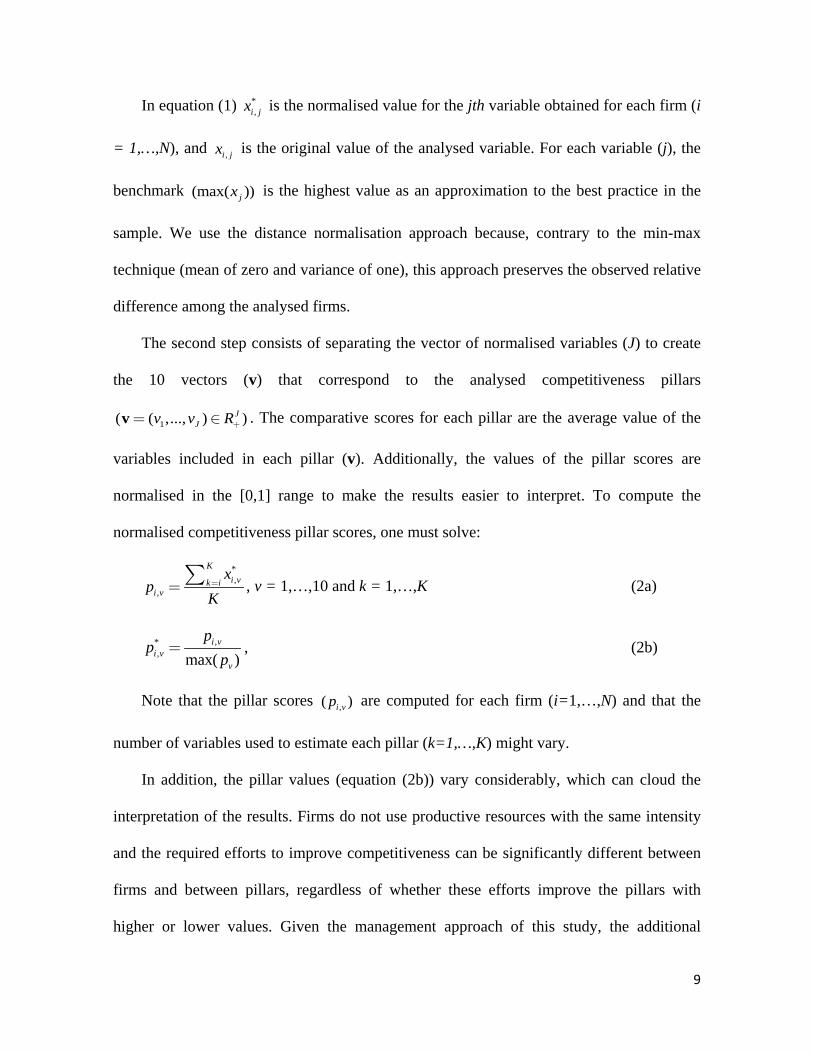
In equation (1) *,i jx is the normalised value for the jth variable obtained for each firm (i
= 1,…,N), and ,i jx is the original value of the analysed variable. For each variable (j), the
benchmark (max( ))jx is the highest value as an approximation to the best practice in the
sample. We use the distance normalisation approach because, contrary to the min-max
technique (mean of zero and variance of one), this approach preserves the observed relative
difference among the analysed firms.
The second step consists of separating the vector of normalised variables (J) to create
the 10 vectors (v) that correspond to the analysed competitiveness pillars
1( ( ,..., ) )JJv v R v . The comparative scores for each pillar are the average value of the
variables included in each pillar (v). Additionally, the values of the pillar scores are
normalised in the [0,1] range to make the results easier to interpret. To compute the
normalised competitiveness pillar scores, one must solve:
*,
,
Ki vk i
i v
xp
K , v = 1,…,10 and k = 1,…,K (2a)
,*, max( )
i vi v
v
pp
p , (2b)
Note that the pillar scores ,( )i vp are computed for each firm (i=1,…,N) and that the
number of variables used to estimate each pillar (k=1,…,K) might vary.
In addition, the pillar values (equation (2b)) vary considerably, which can cloud the
interpretation of the results. Firms do not use productive resources with the same intensity
and the required efforts to improve competitiveness can be significantly different between
firms and between pillars, regardless of whether these efforts improve the pillars with
higher or lower values. Given the management approach of this study, the additional

10
resources required to achieve the same marginal improvement in the average pillar scores
should be the same.
So, and to ensure a robust estimation, in the third step the marginal effect of the
competitive pillars is equalled ,( )i vp , and the strength and direction of the adjustment of
each pillar is estimated by solving the following expression forδ :
*, ,i v i vy p δ=
(3a)
*,
10
N
i v vi
p Nyδ
=
− =∑ (3b)
In equations (3a) and (3b) δ represents the ‘adjustment strength’ for the vth pillar, i.e.
moment δ -th of variable *,i vp corresponds to the average value of the corresponding pillar
( )vy . Equation (3b) delineates a decreasing, convex function, and the solution for δ is
obtained by using the Newton-Raphson method with initial values of zero (Atkinson,
2008). From the analysis of equations 3(a) and 3(b) it follows that:
*
*
*
1 1 1
v v
v v
v v
p yp yp y
δ
δ
δ
< <
= =
> >
So, using the procedure presented in equations (3a) and (3b) we can obtain the strength
(and direction) of adjustment ( )δ in the analysed pillars.
The fourth step considers the mutual dependence of the 10 competitiveness pillars by
introducing a penalty for bottleneck to the estimation of the competitiveness index.

11
Following Configuration Theory (Miller, 1996), improvements can be only achieved by
strengthening the weakest link, the bottleneck, that constrains the performance of the whole
system. Good performing pillars can only partially and not fully compensate for poorly
performing pillars. This imbalance reduces the firm's competitive performance.
Mathematically, the bottleneck is modelled by means of a correction in the form of an
exponential function bxae (Tarabusi and Guarini, 2013). In this study, the penalty function
is defined as:
* *, ,( min( ))*
, ,min( ) (1 )i v i vp pi v i vh p e (4)
where ,i vh is the post-penalty value for the vth pillar and *,min( )i vp is the pillar with the
lowest reported value for the analysed firm (i).
Finally, the fifth step uses the results obtained from equation (4) to estimate the
competitiveness index (CI) for each firm as the sum of the ten competitiveness pillars:
10,1i i vv
CI h
(5)
It is important to note that in our approach to competitiveness, 1) competencies subject
to bottleneck penalties dilute the contribution of other valuable competencies, 2)
improvements in bottleneck competencies are a costly investment, 3) the harmonisation of
competencies is a source of competitive advantage linked to the exploitation of resources
and capabilities, and 4) the development of competitive strengths leads to superior
performance. The proposed systemic approach to the measurement of competitiveness is a
valuable managerial tool that not only reveals a firm's weaknesses and their effect on

12
competitiveness, but also captures the multiple relationships that exist among the analysed
competitiveness pillars.
4. Empirical application: Data and variables used to build the competitiveness index
and method
4.1 Data
For the empirical application we use a primary dataset drawn from the Global
Competitiveness Project (GCP: www.gcp.org), an international research programme
developed by the University of Pécs (Hungary) and the Polytechnic University of Catalonia
(UPC Barcelona Tech, Spain) to identify the potential competitiveness of firms. In
Colombia, the Universidad de la Costa (Barranquilla) is leading the GCP.
The data was collected specifically for this study and the procedure was fully
supervised by the project team. The procedure for selecting the surveyed FBs was carried
out in two phases. First, we identified a group of firms that operate in different industrial
sectors and have a relationship with the University. At this stage of the study, senior
executives are a relevant group of respondents. So, after an initial phone call to gain their
approval, the second step involved a face-to-face interview with one of the owners (only if
he or she is a member of the senior executive) in the case of companies with less than 20
employees, while for companies with more than 20 employees, a senior executive was
interviewed, regardless of whether or not he or she is a shareholder in the company. The
data collection procedure involved self-administered structured interviews in which
managers were asked to answer mainly closed questions. The questionnaire was subjected
to a preliminary test to correct potentially confusing or confusing questions.

13
A total of 107 surveys were obtained. However, in order to ensure a rigorous
methodology, we only included observations for which a complete dataset could be
constructed for the analysed variables. We therefore excluded 30 companies due to
incomplete data. This yielded a final sample of 77 FBs. The companies have an average of
87 employees, with 16 years of experience in the market. An analysis of the industrial
makeup of the final sample reveals that 46.15% of the companies provide knowledge-
intensive business services, 18.27% are in the construction sector, 15.38% are in the
manufacturing sector, and the proportions of professional services companies and retail
firms are 17.31% and 7.69%, respectively. We tested the non-response bias for initial and
late respondents in terms of business size (employees), business age and return on assets
(ROA) in the analysed industrial sectors and no significant differences were detected (t-
test).
4.2 Variables used to estimate the competitiveness pillars
To compute the competitiveness index, we employed a set of variables dealing with
different resources and capabilities. Respondents were asked to score the individual
importance of a series of resources and capabilities on a five-point scale. These resources
and capabilities are only valuable if the respondents deem them to be so (Priem and Butler,
2001). On the proposed Likert-type scale a value of 4 designates a highly relevant variable,
while a value of 1 represents a variable of very little relevance. A 0 value indicates that the
focal resource or capability has no strategic value whatsoever (Douglas and Ryman, 2003),
and the remaining points on the scale ensure the uniform evaluation and quantification of
the variables’ importance. Also, the division of the positive scale values (from 1 to 4)

14
allows a sufficient degree of differentiation in the valuation of the analysed variables
(Lederer et al., 2013).
It is important to note that, in order to make the survey easier for respondents to read,
the coding of some variables was modified. In the case of the human capital pillar,
numerical values were used to codify employees' educational achievements (number and
share of employees with a higher education degree) and the proportion of employees
actively participating in training programmes. Similarly, the weight of new products in the
firms’ sales is introduced to the product pillar, while the strategic pillar includes the number
of economic activities (NACE codes) as a proxy variable for the firm’s diversification
strategy. The networks pillar considers the number of cooperation and innovation
agreements. Finally, the proportion of sales in foreign markets was included in the
internationalisation pillar. Therefore, from our questionnaire it is possible to obtain
information for 46 variables related to the ten competitiveness pillars (competencies)
analysed in this study. The description of the variables used to build the competitiveness
pillars is presented in the Appendix (Table A1).
4.3 Method
This study employs cluster analysis to scrutinise how business specific factors
contribute to explain performance differences among the sampled Colombian FBs.
Additionally, we present a complementary descriptive analysis including the competitive
pillars in order to further explore how competitive drivers relate to performance. Table 1
presents the descriptive statistics for the variables used to cluster Colombian FBs: size
measured by the number of employees, age of the company expressed in years, and return

15
on assets (ROA). This study proposes a non-hierarchical cluster analysis (K-means) using
the variables in Table 1 as inputs.
The cluster analysis is especially suitable for the study of the connection between
relevant business characteristics (i.e., firm size and firm age) and performance (ROA). This
technique highlights the variety of competitive structures across the analysed Colombian
FBs, that is, this procedure makes it possible to classify the units of analysis (FBs) based on
their similarities in resources and capabilities and offers a picture of the relationship
between the different configurations of competitive pillars and performance (ROA).
--- Insert Table 1 about here ---
The non-hierarchical cluster analysis requires the establishment of a fixed number of
groups (clusters), which presents a challenge in many fields of social science research
where this type of analysis is usually more of an exploratory nature. In order to corroborate
the number of clusters and the validity of the analysis, we adopted two approaches. First,
the Calinski and Harabasz (1974) statistic is used to determine the optimal number of
groups for the analysis: the result indicates that the cluster number that maximizes the
Calinski and Harabasz index is 4 (pseudo-F value: 67.63). Therefore, the final non-
hierarchical cluster analysis requires a division into four groups.
Second, a discriminant analysis was performed to validate the results of the cluster
analysis. The results of the discriminant analysis in Table 2 reveal a high convergence
between the groups resulting from the cluster analysis and the groups generated by the
discriminant analysis. Therefore, this suggests that the approach proposed for the
examination of the competitiveness levels of Colombian FBs is appropriate.

16
--- Insert Table 2 about here ---
Finally, by presenting a supplementary analysis that includes the competitiveness
pillars, we seek to further explore how the configuration of competitive pillars relates to
economic performance (ROA) among the sampled businesses.
5. Results
Before analysing the results of the cluster model, we first present a descriptive analysis
of the results of the competitiveness index for the surveyed Colombian FBs.
These findings (equation (5)) are shown in Table 3, and indicate that the analysed FBs
have an average competitiveness level of 5.347 (on base 10), and that business
competitiveness ranges between 1.979 and 8.448.
The results also show how the main competitive strengths of the analysed firms are
related to the introduction of product innovations (0.549) and the development of a solid
network of contacts with suppliers and customers (0.545). This result is in line with Singh
and Kota (2017) and Farihna et al., (2018), who remark that innovation is a crucial factor
for the competitiveness of FBs. Also, these results are similar to those reported by Monroy
et al., (2015) who show that the quality of the social ties with employees, allies and family
members is a relevant determinant to competitiveness. On the other hand, it is observed that
the main competitive weaknesses of these companies are the limited use of technologies in
their operating processes (0.519) and their limited online presence (0.528). This result is in
sharp contrast to Lundvall and Nielsen, (2007), and suggests that the adoption of

17
technologies and online presence are not critical competitiveness factor among the sampled
businesses.
--- Insert Table 3 about here ---
Table 4 presents the four different groups of firms resulting from the cluster analysis:
small young companies (not very old) (Group 1), medium-sized companies (Group 2),
small consolidated companies (very old) (Group 3) and large companies (Group 4).
--- Insert Table 4 about here ---
Group 1 includes 12 firms (13% of firms) that present a low level of competitiveness
(average= 5.33) and the lowest profitability out of the groups extracted from the cluster
analysis (average= 4.33%). A more detailed analysis of the competitive pillars reveals that
human capital is the main competitive strength in this group (average= 0.6063). This group
also stands out for more intense development of competitive strategies (average= 0.5934)
and for the quality of the products they offer (average= 0.5845). In FBs it is common that
the firm’s founder works to fulfil the agreements made with suppliers and clients, offering
quality products and services (Müller et al., 2018). The main competitive weaknesses of
these companies lie in their poor decision-making processes, given how weak their
management systems and corporate governance structures are (average= 0.4515), and their
limited focus on exports (average= 0.4640). In fact, many FBs lack comprehensive
information on markets and strategic planning, and rely on centralised decision-making
processes implemented by the founder/entrepreneur (Nordqvist, and Merlin, 2010).

18
Group 2 includes 23 mostly medium-sized firms (average size= 67.91 employees).
Compared to businesses in Group 1, this group is, on average, more competitive (5.8468),
has more developed decision-making processes (0.6173), and is more focused on the
domestic market (0.6112) by leveraging its contact networks (0.6076). These companies
mainly focus on competing in a specific market as well as increasing their market share to
achieve sustainable growth and performance (Cetindamar and Kilitcioglu, 2013).
The small consolidated companies in the market, which make up Cluster 3, have an
average of 12 workers and 15 years of operation. The firms in this cluster present higher
returns on assets (average= 19.26%) than those observed in the other clusters. However,
this group of companies has the lowest level of competitiveness (4.8339). They have a
consolidated product on the market (0.5272) and a strong relationship with their customers
and suppliers (networks= 0.5083), but their main weaknesses are their online presence
strategies (0.4281) and their poor use of new technologies in their production processes
(0.4528).
Group 4 comprises large and experienced firms (average size= 467 employees; average
market experience= 43 years). This Group has 10 companies that present the best
competitiveness results (5.86). Their main strengths are: focus on international markets
(0.6325) through the export of their products, high online presence (0.6785), and a
consolidated corporate governance structure that allows them to make more accurate
decisions (0.6390). Singh and Kota (2017) highlight that strategic planning and decision-
making is a critical factor for firms offering their services and products to international
markets. Zahra (2005) shows that FBs have relatively high levels of internationalisation;
however, in Group 4 the result for the human capital pillar (0.5387) and the quality of their
competitive strategies (0.4954) are below the level reported by firms in Group 1.
19
Overall, our empirical analysis of competitiveness in FBs shows that the role of
competitive pillars on performance is heterogeneous across the analysed FBs. We find that
discrepancies in FBs’ resources and capabilities result in different competitive positions
(advantages and disadvantages) with respect to the pillars driving competitiveness. Also,
from the results of the cluster analysis we observe that the evolution on FBs’
competitiveness does not follow a homogeneous pattern. The findings suggest that the
determinants of FBs competitiveness may be different in young vis.-à-vis. more
consolidated family businesses (Hoy & Sharma 2010).
Furthermore, the results show how the proposed analysis of competitive pillars
contributes not only to clarify how competitiveness impacts performance but also to
improve our capacity to operationalise relevant competencies with performance
consequences.
6. Conclusions and implications of the study
The purpose of this paper has been to evaluate business competitiveness from a
systemic perspective by taking into account the interrelationships between the resources
and capabilities available to the analysed Colombian FBs. Building on the RBV and
Configuration Theory, competitiveness was contextualised as a multidimensional construct
that considers the interdependence of resources and capabilities (Barney, 2001; Prahalad
and Hamel, 1990). More specifically, our comprehensive competitiveness measure employs
an index number methodology that takes into account both the multiple interactions
between different competencies, and the potentially restraining effect of weak (bottleneck)
competencies on overall business competitiveness.

20
The results reveal the explanatory power and benefits of the proposed managerial tool
by showing how the adoption of strategies aimed at improving different resources or
capabilities contributes to the enhancement of business competitiveness. Our analysis
therefore shows how FBs can optimise the allocation of additional resources in the hope of
becoming more competitive. In general, we find that the configuration of a firm's
competitive system (in terms of resources and capabilities) conditions the success of the
strategy that has been implemented, and how these strategies (associated to the acquisition
or development of resources and capabilities) can have a (generally) heterogeneous and
positive effect on competitiveness.
These findings have important implications for academics and practitioners. First, the
proposed competitiveness index coincides with the postulates of the RBV, which
emphasises the complexity of the associations between resources and capabilities with the
need to accurately measure competitiveness from a holistic perspective. Our proposal
adopts a system dynamics approach that takes into account the interactions between
resources and capabilities in order to explain the boundaries of businesses’ competitiveness
system. In this sense, this study contributes to the literature dealing with the determinants
of competitiveness (Newbert, 2008). Also, this study contributes to expand the research
work associated with the competitiveness of FBs as well as the competitiveness level of
organisations operating in developing economies (Tálas. and Rózsa, 2015), and provides
valuable information to policy makers and practitioners on the subject matter.
Second, prior research on the RBV has addressed the individual contribution of
relevant variables of different resources and capacities to competitiveness (Douglas and
Ryman, 2003; Fernhaber and Patel, 2012). Our results reveal that, when business
competitiveness is comprehensively evaluated, it is possible to identify the resources and

21
capabilities that to a greater or lesser extent contribute to a firm’s competitiveness
(strengths and weaknesses). Also, the findings provide important information to managers
of family firms that can be used in decision-making processes linked to investments in
specific resources that may contribute to create or develop a competitive advantage by
creating idiosyncratic combinations of resources. Furthermore, these specific investments
are potentially conducive to higher survival rates and superior performance among FBs.
There are several limitations to this study that should be addressed in future research.
First, the data does not permit direct analysis of the effect of improvements in resources or
capabilities on competitiveness. Interpretations of how actions to improve resources and
capabilities impact competitiveness are presented, but we do not evaluate how firms
implement such actions, nor how firms internalise these investments and how they affect
their competitiveness. Second, future research should corroborate the robustness of the
proposed competitiveness index in other types of firms that are exposed to external market
pressures and whose managers tend to prioritise short-term profits over long-term strategic
targets (Cetindamar and Kilitcioglu, 2013).
Bibliography
Astrachan, J.H. and Shanker, M.C. (2003), “Family businesses’ contribution to the U.S.
economy: A closer look.”, Family Business Review, Vol. 16 No. 3, pp. 211-219.
Atkinson, K.E. (2008), An introduction to numerical analysis. John Wiley and Sons, New
York.
Ajitabh, A. and Momaya, K. (2004), “Competitiveness of firms: review of theory,
frameworks and models”, Singapore Management Review, Vol. 26 No. 1, pp. 45-61.

22
Barney, J.B. (1991), “Firm resources and sustained competitive advantage”, Journal of
Management, Vol. 17 No. 1, pp. 99–120.
Barney, J.B. (1995), “Looking inside for competitive advantage”. Academy of Management
Executive, Vol. 9 No. 4, pp. 49-61.
Barney, J.B. (2001), “Resource-based theories of competitive advantage: A ten-year
retrospective on the resource-based view”, Journal of Management, Vol. 27 No. 6, pp.
643-650.
Calinski, R.B. and Harabasz, J. (1974), “A dendrite method for cluster analysis”,
Communications in Statistics, Vol. 3 No. 1, pp. 1–27.
Cetindamar, D. and Kilitcioglu, H. (2013), "Measuring the competitiveness of a firm for an
award system", Competitiveness Review: An International Business Journal, Vol. 23
No. 1, pp. 7-22.
Chikán, A., (2008), “National and firm competitiveness: a general research model”,
Competitiveness Review: An International Business Journal, Vol. 18 No. 1/2, pp. 20-28.
Chirico, F. and Bau, M. (2014), “Is the family an “asset” or “liability” for firm
performance? The moderating role of environmental dynamism”, Journal of Small
Business Management, Vol. 52 No. 2, pp. 210–225.
Chrisman, J.J., Chua, J.H., and Litz, R. (2003), “A unified systems perspective of family
firm performance: An extension and integration”, Journal of Business Venturing, Vol.
18 No. 4, pp. 467–472.
Díaz-Chao, Á., Sainz-González, J. and Torrent-Sellens, J. (2016), “The competitiveness of
small network-firm: A practical tool”, Journal of Business Research, Vol. 69 No. 5, pp.
1769-1774.

23
Douglas, T.J. and Ryman, J.A. (2003), “Understanding competitive advantage in the
general hospital industry: evaluating strategic competencies”, Strategic Management
Journal, Vol. 24 No. 4, pp. 333-347.
Farinha, L., Ferreira, J.J. and Nunes, S. (2018), “Linking innovation and entrepreneurship
to economic growth”, Competitiveness Review: An International Business Journal, Vol.
28 No. 4, pp. 451-475.
Fernhaber, S. and Patel, P. (2012), “How Do Young Firms Manage Product Portfolio
Complexity? The Role of Absorptive Capacity and Ambidexterity”, Strategic
Management Journal, Vol. 33 No. 13, pp. 1516-1539.
Garelli, S. (2014), “The fundamentals and history of competitiveness”, in IMD World
Competitiveness Yearbook 2014, IMD World Competitiveness Centre, Lausanne, pp.
492- 507.
Habbershon, T.G. and Williams, M.L. (1999), “A resource-based framework for assessing
the strategic advantages of family firms”, Family Business Review, Vol. 12 No. 1, pp. 1–
25.
Habbershon, T.G., Williams, M. and MacMillan, I.C. (2003), “A unified systems theory of
family firm performance”, Journal of Business Research, Vol. 18 No. 4, pp. 451–465.
Hoy, F. and Sharma, P. (2010), Entrepreneurial family firms. Upper Saddle River, Prentice
Hall, NJ.
Irava, W. and Moores, K (2010), “Clarifying the strategy advantage of familiness:
Unbunding its dimensions and highlighting its paradoxes”, Journal of Family Business
Strategy, Vol. 1 No. 3, pp. 131-144.

24
Ismail, A.I., Rose, R.C., Uli, J. and Abdullah, H. (2012), ‘The relationship between
organisational resources, capabilities, systems and competitive advantage”, Asian
Academy of Management Journal, Vol. 17 No. 1, pp. 151-173.
Ketchen, D.J..Jr, Huit G.T.M. and Slater S.F. (2007), “Toward greater understanding of
market orientation and resource-based view”, Strategic Management Journal, Vol. 28
No. 9, pp. 961-964.
Lafuente, E., Szerb, L. and Rideg, A. (2016), “A system dynamics approach for assessing
business competitiveness”. Working paper presented at the 30th RENT Conference,
University of Antwerp, Belgium (November 16th-18th).
Lederer, M., Schott, P., Huber, S. and Kurz, M. (2013), “Strategic Business Process
Analysis: A Procedure Model to Align Business Strategy with Business Process
Analysis Methods, In International Conference on Subject-Oriented Business Process
Management (pp. 247-263). Springer, Berlin, Heidelberg.
Leenders, M. and Waarts, E. (2003), "Competitiveness and Evolution of Family
Businesses: The Role of Family and Business Orientation", European Management
Journal, Vol. 21 No. 6, pp 686-697.
Lundvall, B.A. and Nielsen, P. (2007), “Knowledge management and innovation
performance”, International Journal of Manpower, Vol. 28 No. 3–4, pp. 207–223.
Miller, D. (1996), “Configurations revisited”, Strategic Management Journal, Vol. 17 No.
7, pp. 505-512.
Monroy, B., Ilián, V., Ramírez Solís, E.R. and Rodríguez-Aceves, L. (2015), “Familiness
and its relationship with performance in mexican family firms”, Academy of Strategic
Management Journal, Vol. 14 No. 2, pp. 1-21.

25
Müller, C., Botero, I, Discua-Cruz, A. and Subramanian, R. (2018), Family Firms in Latin
America. Routledge, New York.
Newbert, S.L. (2007), “Empirical research on the resource-based view of the firm: An
assessment and suggestions for future research”, Strategic Management Journal, Vol. 28
No. 2, pp. 121-146.
Newbert, S.L. (2008), “Value, rareness, competitive advantage, and performance: A
conceptual-level empirical investigation of the resource-based view of the firm”,
Strategic Management Journal, Vol. 29 No. 7, pp. 745-768.
Nordqvist, M. and Merlin, L. (2010), “Entrepreneurial families and family firms”,
Entrepreneurship and Regional Development, Vol. 22 No. 3–4, pp. 211–239
Peteraf, M.A. (1993), “The cornerstones of competitive advantage”, Strategic Management
Journal, Vol. 14 No. 3, pp. 179–191.
Porter, M. (1990), The Competitive Advantage of Nations, The Free Press, New York.
Prahalad, C.K., and Hamel, G. (1990), “The core competence of the corporation”, Harvard
Business Review, Vol. 68, pp. 79-91
Priem, R. and Butler, J. (2001), “Is the resource-based ‘view’ a useful perspective for
strategic management research?”, Academy of Management Review, Vol. 26 No. 1, pp.
22-40.
Sala-i-Martin, X., Bilbao-Osorio, B., Blanke, J., Hanouz, M.D., Geiger, T. and Ko, C.
(2014), “The global competitiveness index 2014-2015: Accelerating a robust recovery to
create productive jobs and support inclusive growth”, in Schwab, K. (Ed.), The Global
Competitiveness Report 2014-2015: Full Data Edition, World Economic Forum,
Geneva, pp. 3-52.

26
Singh, R. and Kota, H.B. (2017), “A resource dependency framework for innovation and
internationalization of family businesses: Evidence from India”, Journal of
Entrepreneurship in Emerging Economies, Vol. 9 No. 2, pp. 207-231.
Sirmon, D.G., Hitt, M. and Ireland, R.D. (2007), "Managing firm resources in dynamic
environments to create value: Looking inside the black box." Academy of management
Review, Vol. 32 No. 1, pp. 273-292.
Sirmon, D.G., Hitt, M.A., Ireland, R.D. and Gilbert, B.A. (2011), “Resource orchestration
to create competitive advantage breadth, depth, and life cycle effects”, Journal of
Management, Vol. 37 No. 5, pp. 1390-1412.
Spinelli, R. (2016), “The Determinants of IT Adoption by SMEs: An Agenda for
Research”. In Organizational Innovation and Change (pp. 41-52). Springer, Cham.
Tálas, D. and Rózsa, A. (2015), “Financial competitiveness analysis in the Hungarian dairy
industry”, Competitiveness Review: An International Business Journal, Vol. 25 No. 4,
pp. 426-447.
Tarabusi, E.C. and Guarini, G. (2013), “An unbalance adjustment method for development
indicators”, Social Indicators Research, Vol. 112 No. 1, pp. 19-45.
Teece, D., Pisano, G. and Shuen, A. (1997), “Dynamic capabilities and strategic
management”, Strategic Management Journal, Vol. 18 No. 7, pp. 509-533.
Webb, J.W., Ketchen, D.J. and Ireland, R.D. (2010), “Strategic entrepreneurship within
family-controlled firms: Opportunities and challenges”, Journal of Family Business
Strategy, Vol. 1 No. 2, pp. 67-77.
Wernerfelt, B. (1984), “A Resource-Based View of the Firm”, Strategic Management
Journal, Vol. 5 No. 2, pp. 171-180.

27
Wong, W.P. and Wong, K.Y. (2011), “Supply chain management, knowledge management
capability, and their linkages towards firm performance”, Business Process Management
Journal, Vol. 17 No. 6, pp. 940-964.
Zahra, S.A. (2005), “Entrepreneurial risk taking in family firms”, Family Business Review,
Vol. 18 No. 1, pp. 23-40.

28
List of Tables
Table 1. Cluster analysis: Descriptive statistics for the selected variables Average Std. Dev. Minimum Maximum ROA 0.110 0.259 -0.0985 2.073 Firm size (employees) 87.67
220.87 3 1300
Firm age (years) 16.67 16.07 1 81
Table 2. Results: Discriminant analysis
Classification generated by the discriminant analysis
Cluster Analysis (groups) Group 1 Group 2 Group 3 Group 4 N
Group 1 12 (100%)
0 (0.00%)
0 (0.00%)
0 (0.00%) 12
Group 2 0
(0.00%) 23
(100%) 0
(0.00%) 0
(0.00%) 23
Group 3 1 (3.13%)
0 (0.00%)
32 (100%)
0 (0.00%)
32
Group 4 0 (0.00%)
0 (0.00%)
0 (0.00%)
10 (100%)
10

29
Table 3. Business competitiveness: Descriptive statistics Average Std. Dev. Minimum Maximum Competitiveness Index (CI) 5.347 1. 353 1.979 8.448 Human capital 0.535 0.165 0.124 0.886
Product 0.549 0.195 0.147 0.960
Domestic market 0.538 0.122 0.275 0.846
Networks 0.545 0.173 0.186 0.883
Technology 0.519 0.178 0.117 0.925
Decision making 0.539 0.223 0.094 0.960
Competitive strategy 0.537 0.154 0.213 0.837
Marketing 0.532 0.176 0.062 0.912
Internationalization 0.525 0.180 0.015 0.936
Online presence 0.528 0.232 0.081 0.964

30
Table 4. Results: Cluster analysis
Group 1 Group 2 Group 3 Group 4 Total Variables included in the cluster analysis ROA 0.0433 0.0562 0.1926 0.0630 0.1118 Firm size (employees) 10.75
67.91 12.09 467.30 87.68
Firm age (years) 2.75 14.83 15 43 16.68 Competitiveness (not included in the cluster analysis) Competitiveness Index (CI) 5.332 5.847 4.834 5.859 5.347
Human capital 0.606 0.557 0.490 0.539 0.535
Product 0.585 0.547 0.527 0.584 0.549
Domestic market 0.518 0.611 0.490 0.549 0.538
Networks 0.481 0.608 0.508 0.593 0.545
Technology 0.511 0.577 0.453 0.607 0.519
Decision making 0.452 0.617 0.485 0.639 0.539
Competitive strategy 0.593 0.584 0.495 0.495 0.537
Marketing 0.570 0.581 0.481 0.542 0.532
Internationalization 0.464 0.578 0.477 0.633 0.525
Online presence 0.552 0.589 0.428 0.679 0.528
N 12 23 32 10 77
Number of observations: 77 firms.