analysis of class-x performanceedudel.nic.in/result_analysis/2011/x_2011_ppt.pdf · analysis of...
TRANSCRIPT
Analysis of Class-XPerformance
CBSE Result 2011
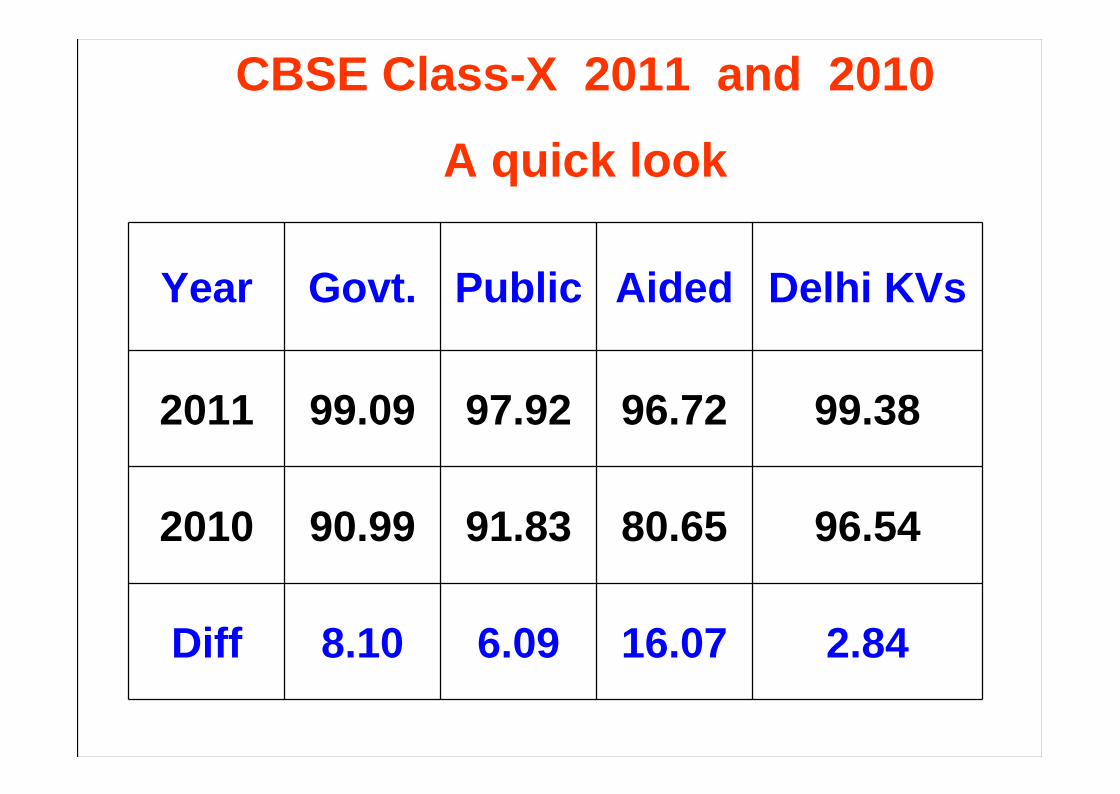
CBSE Class-X 2011 and 2010
A quick look
Year Govt. Public Aided Delhi KVs
2011 99.09 97.92 96.72 99.38
2010 90.99 91.83 80.65 96.54
Diff 8.10 6.09 16.07 2.84

Average CGPA
This year CBSE has given grade points foreach student for each subject.
The grade points of all the five subjects foreach qualified student in a school havebeen added to achieve average CGPA of aschool.
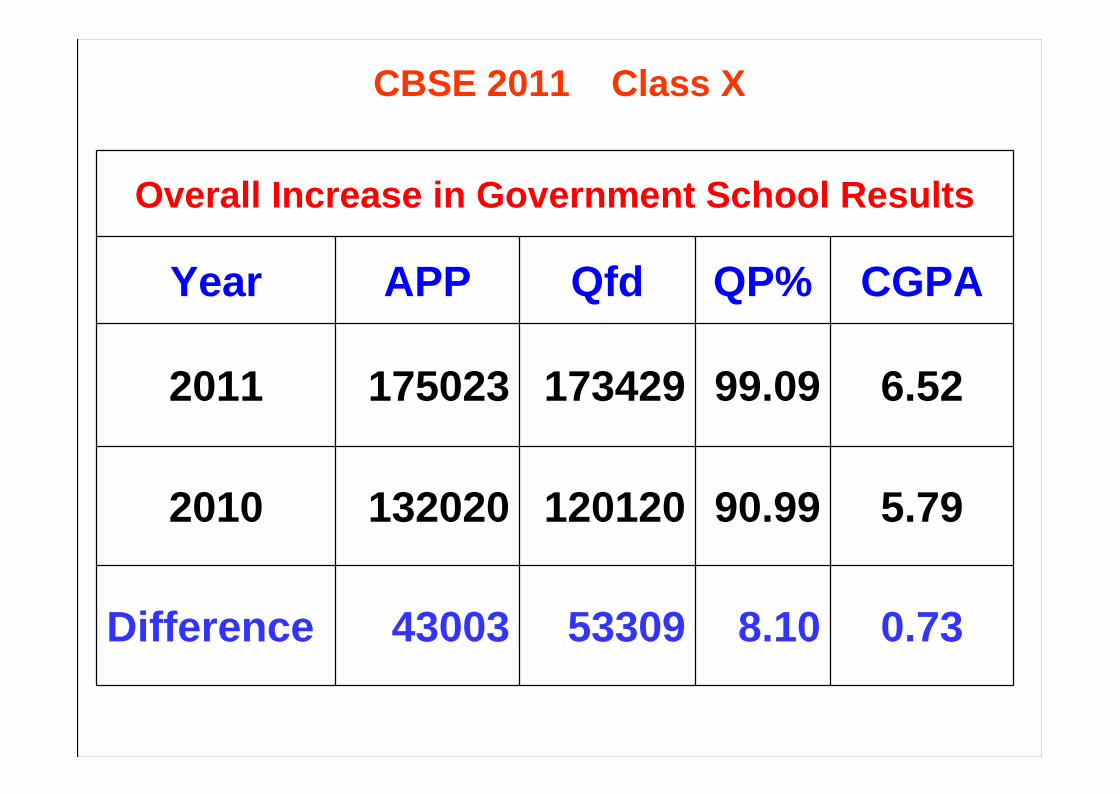
Overall Increase in Government School Results
Year APP Qfd QP% CGPA
2011 175023 173429 99.09 6.52
2010 132020 120120 90.99 5.79
Difference 43003 53309 8.10 0.73
CBSE 2011 Class X

Year Gap%2001-02 -45.402002-03 -43.002003-04 -40.602004-05 -38.332005-06 -28.592006-07 -13.932007-08 -07.422008-09 -1.272009-10 -0.842010-11 +1.17
Gap between Government and Private Schools – a glance
Class-X CBSE
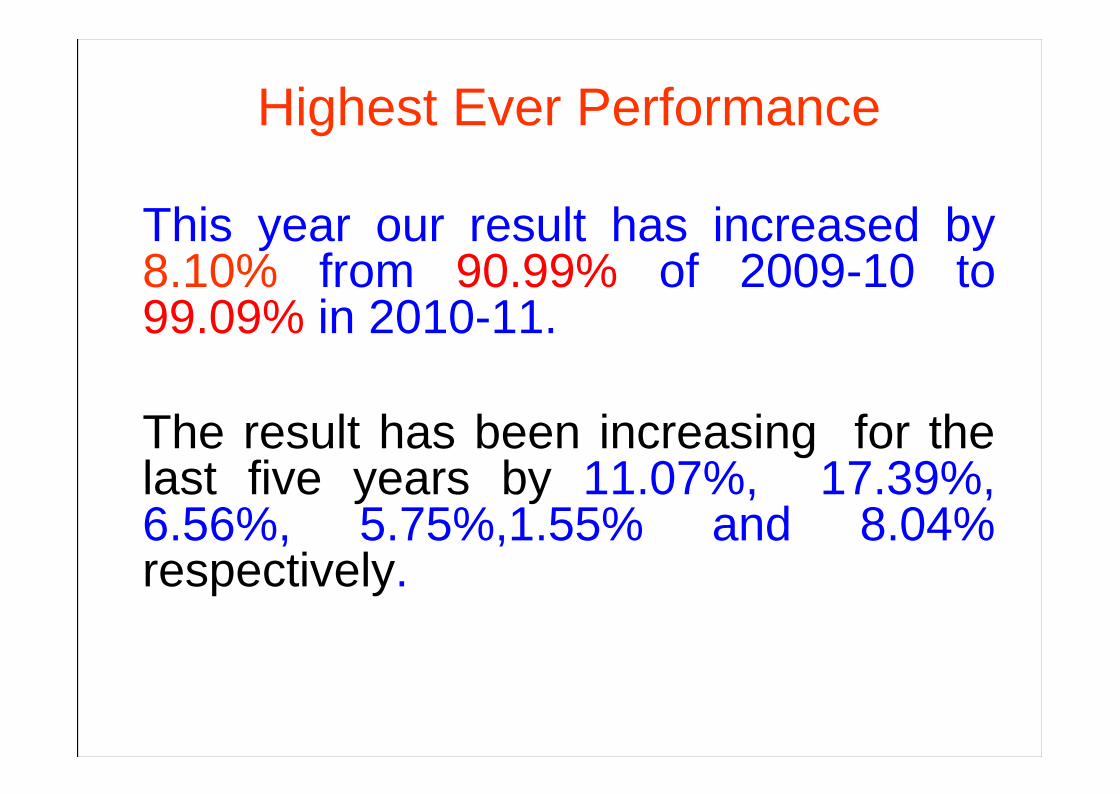
Highest Ever Performance
This year our result has increased by8.10% from 90.99% of 2009-10 to99.09% in 2010-11.
The result has been increasing for thelast five years by 11.07%, 17.39%,6.56%, 5.75%,1.55% and 8.04%respectively.

CBSE Result for Class-X for the last 10 YearsYear No. of students
appearedPass percentage
(%)2001-02 83086 46.142002-03 79069 48.872003-04 79330 50.772004-05 85479 48.032005-06 96551 59.732006-07 95309 77.122007-08 105332 83.692008-09 116054 89.442009-10 132020 90.992010-11 175023 99.09
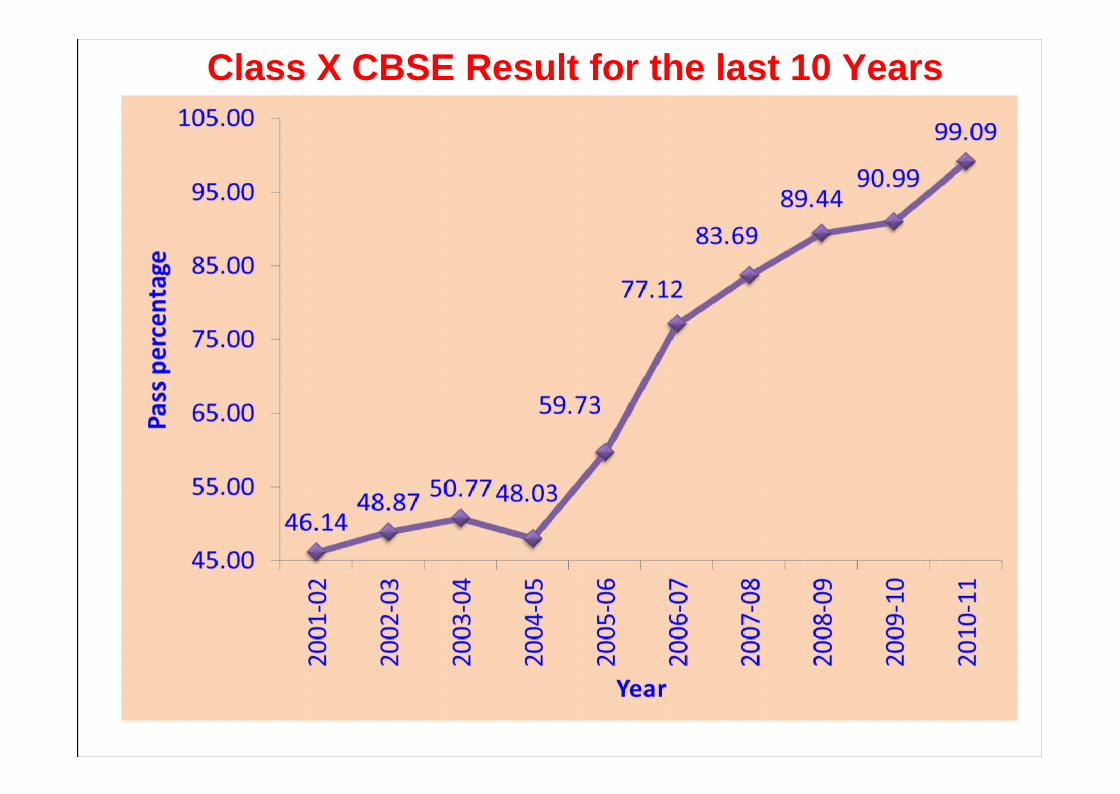
Class X CBSE Result for the last 10 Years
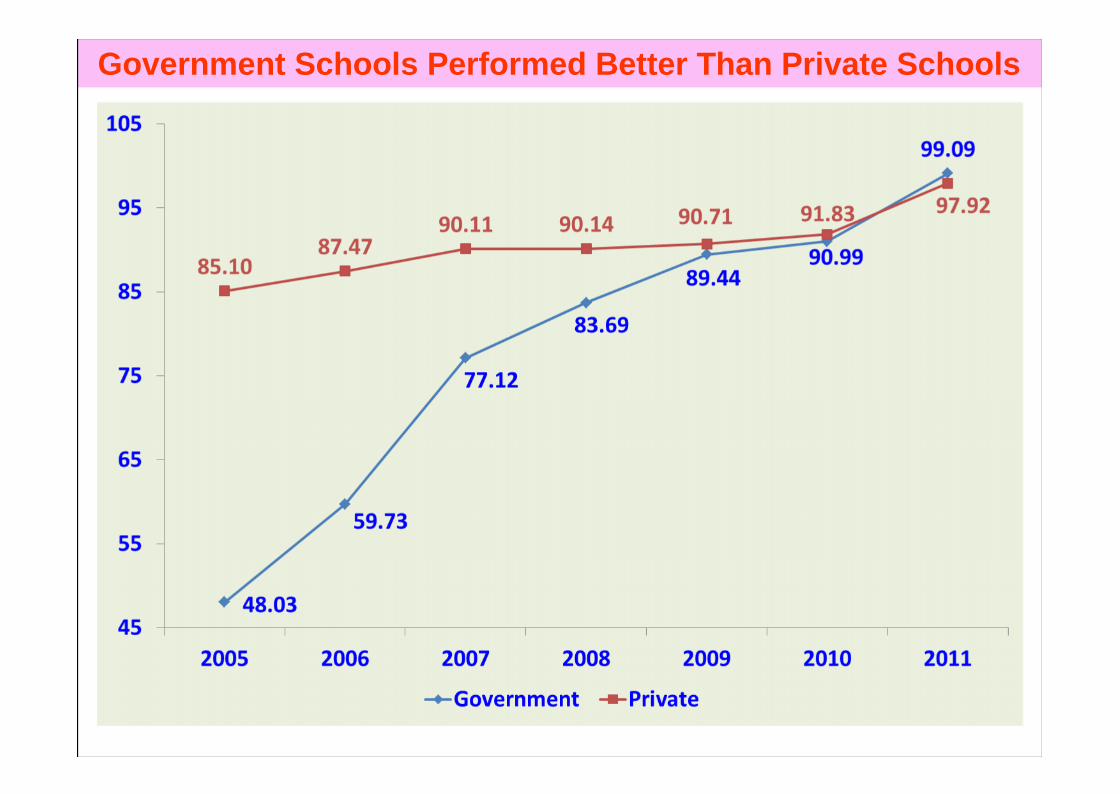
Government Schools Performed Better Than Private Schools

Highest everPass Percentage
99.09%
CBSE CLASS – X RESULT 2010
Appeared candidates increased by43003over the last year
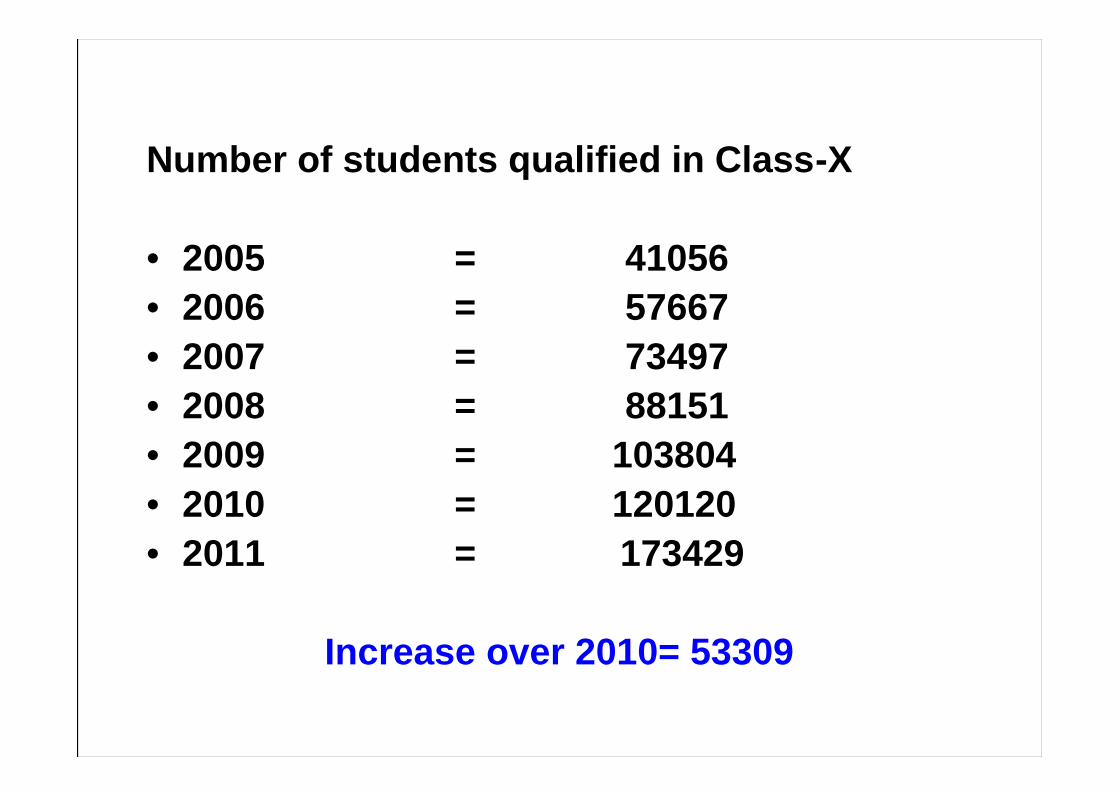
Number of students qualified in Class-X
• 2005 = 41056• 2006 = 57667• 2007 = 73497• 2008 = 88151• 2009 = 103804• 2010 = 120120• 2011 = 173429
Increase over 2010= 53309
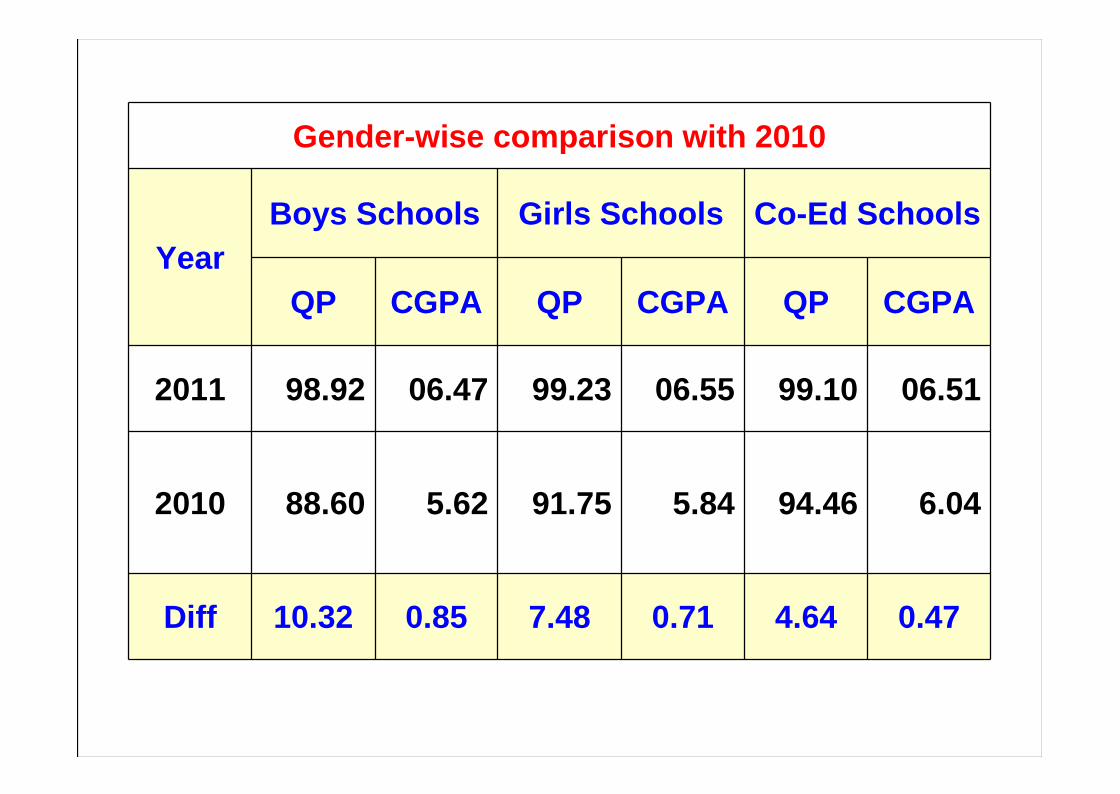
Gender-wise comparison with 2010
YearBoys Schools Girls Schools Co-Ed Schools
QP CGPA QP CGPA QP CGPA
2011 98.92 06.47 99.23 06.55 99.10 06.51
2010 88.60 5.62 91.75 5.84 94.46 6.04
Diff 10.32 0.85 7.48 0.71 4.64 0.47

School Type wise PP
Category
2011 2010Differe
nceApp Qfd QP% App Pass PP%
RPVV 2251 2236 99.36 2009 1982 98.66 0.67
Sarvodaya 75413 74736 99.10 59063 54816 92.81 6.29
Non Sarvodaya 97359 96457 9907 70948 63322 89.25 9.82
Total 175023 173429 99.09 132020 120120 90.99 8.10
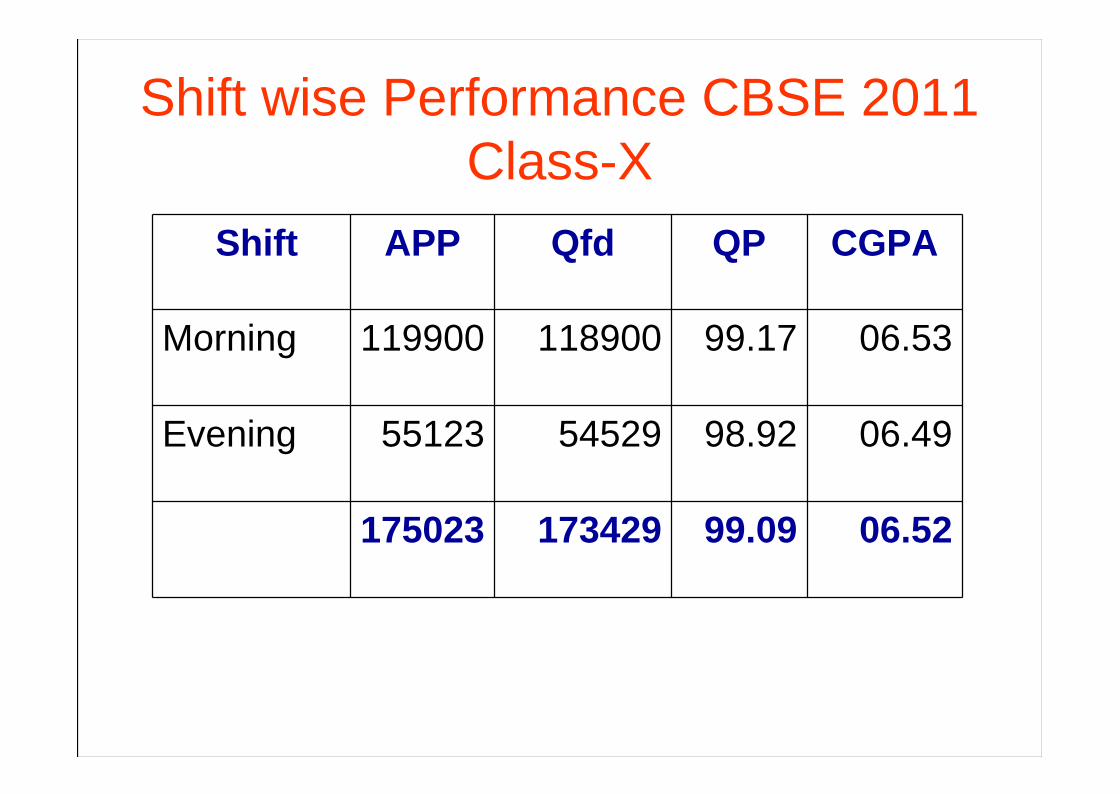
Shift wise Performance CBSE 2011Class-X
Shift APP Qfd QP CGPA
Morning 119900 118900 99.17 06.53
Evening 55123 54529 98.92 06.49
175023 173429 99.09 06.52

GOVERNMENT SCHOOLS - 100% RESULTYear No. of
Schools2011 3262010 1662009 1302008 1002007 412006 9

Class – X 2011
No. of Schools with Qualified Percentage –A comparison between 2011& 2009
YEAR 100% >=90%&<100%
<=80%&<90%
<=70%&<80%
<=60%&<70%
<60%
TOTAL
2011 326 567 2 0 0 0 895
2010 166 443 129 61 37 15 851
Difference 160 124 -127 -61 -37 -15 44

2011 CBSE Class X
02011
Year No. ofSchools
2010 3
2009 4
2008 20
2007 52
2006 217
Schools with less than 50 % Result
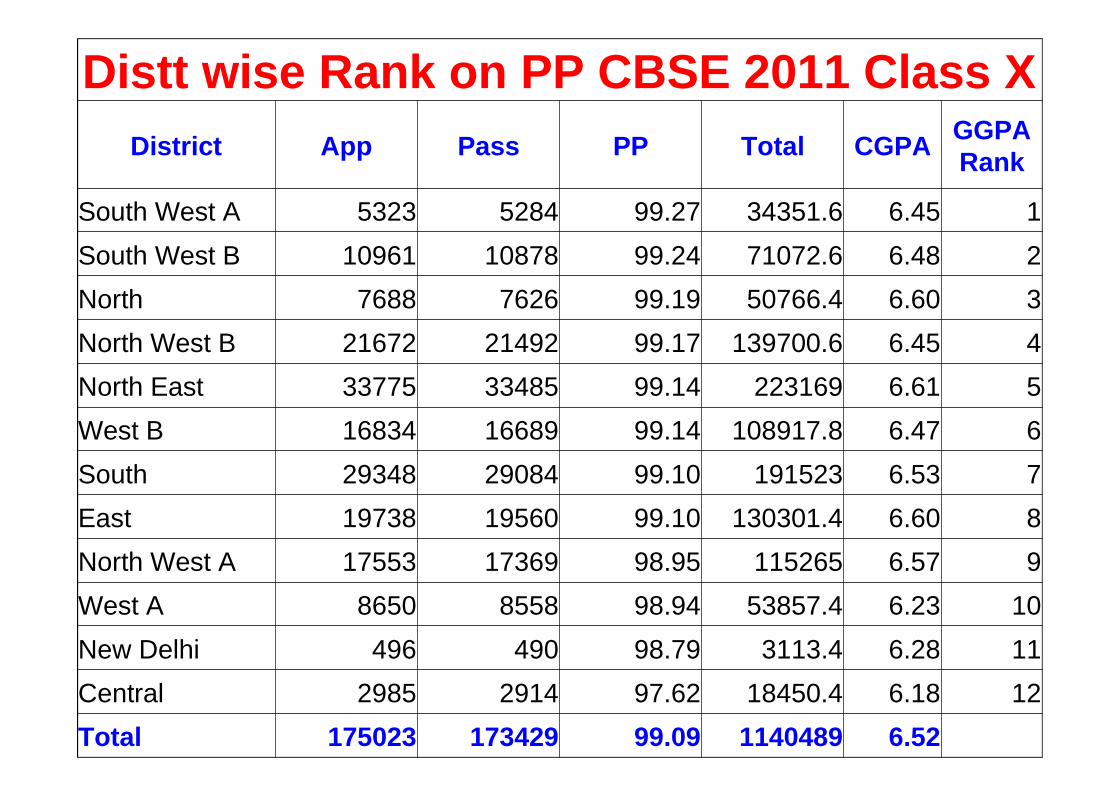
Distt wise Rank on PP CBSE 2011 Class XDistrict App Pass PP Total CGPA GGPA
Rank
South West A 5323 5284 99.27 34351.6 6.45 1South West B 10961 10878 99.24 71072.6 6.48 2North 7688 7626 99.19 50766.4 6.60 3North West B 21672 21492 99.17 139700.6 6.45 4North East 33775 33485 99.14 223169 6.61 5West B 16834 16689 99.14 108917.8 6.47 6South 29348 29084 99.10 191523 6.53 7East 19738 19560 99.10 130301.4 6.60 8North West A 17553 17369 98.95 115265 6.57 9West A 8650 8558 98.94 53857.4 6.23 10New Delhi 496 490 98.79 3113.4 6.28 11Central 2985 2914 97.62 18450.4 6.18 12Total 175023 173429 99.09 1140489 6.52
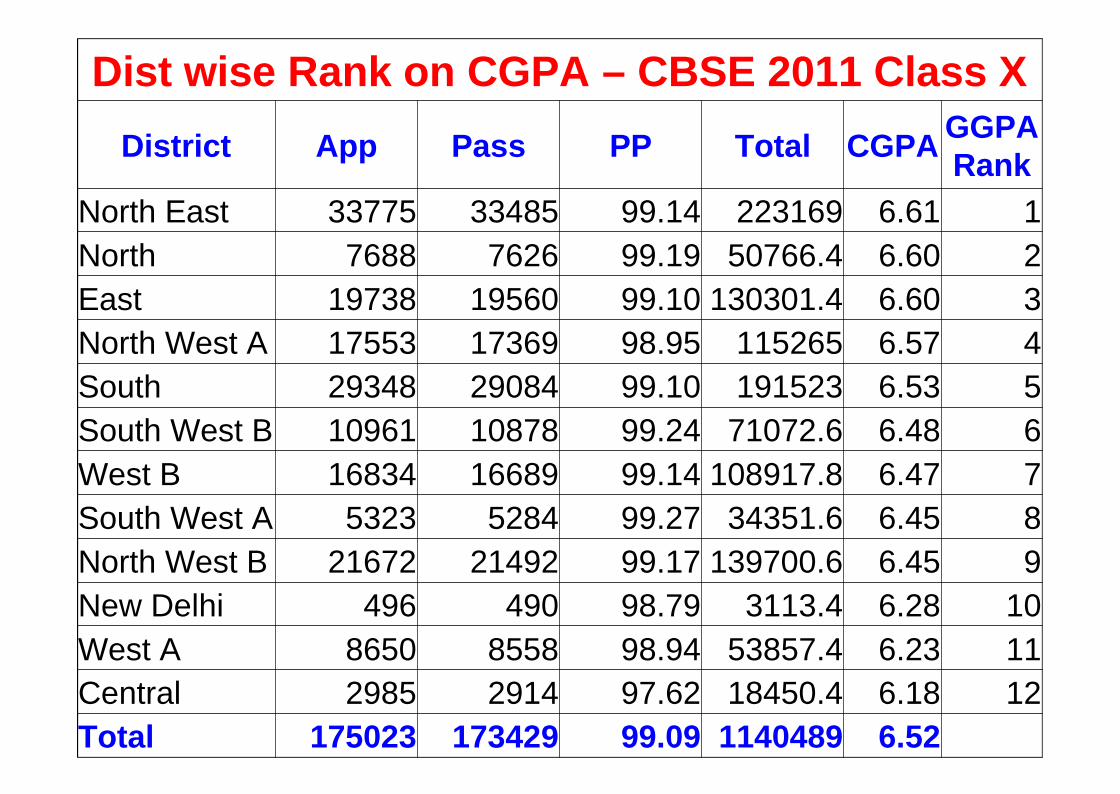
Dist wise Rank on CGPA – CBSE 2011 Class XDistrict App Pass PP Total CGPA GGPA
RankNorth East 33775 33485 99.14 223169 6.61 1North 7688 7626 99.19 50766.4 6.60 2East 19738 19560 99.10 130301.4 6.60 3North West A 17553 17369 98.95 115265 6.57 4South 29348 29084 99.10 191523 6.53 5South West B 10961 10878 99.24 71072.6 6.48 6West B 16834 16689 99.14 108917.8 6.47 7South West A 5323 5284 99.27 34351.6 6.45 8North West B 21672 21492 99.17 139700.6 6.45 9New Delhi 496 490 98.79 3113.4 6.28 10West A 8650 8558 98.94 53857.4 6.23 11Central 2985 2914 97.62 18450.4 6.18 12Total 175023 173429 99.09 1140489 6.52

DISTRICT WISE SUBJECT WISE A1 GRADES - CBSE 2011DISTRICT ENG HINDI SKT MATH SCIENCE SST URDU
EAST 78 284 83 134 58 121 0
NORTH-EAST 84 281 95 127 62 155 8
NORTH 47 113 29 106 41 109 1
NORTH-WEST-A 41 214 163 93 36 100 0
NORTH-WEST-B 52 148 78 105 58 126 0
WEST-A 32 60 14 51 25 42 0
WEST-B 40 139 62 108 47 147 0
SOUTH-WEST-A 3 22 11 34 12 50 0
SOUTH-WEST-B 30 120 77 82 27 118 0
SOUTH 41 144 77 86 28 90 1
NEW-DELHI 0 11 0 0 0 1 0
CENTRAL 3 26 4 7 2 8 4
TOTAL 451 1562 693 933 396 1067 14
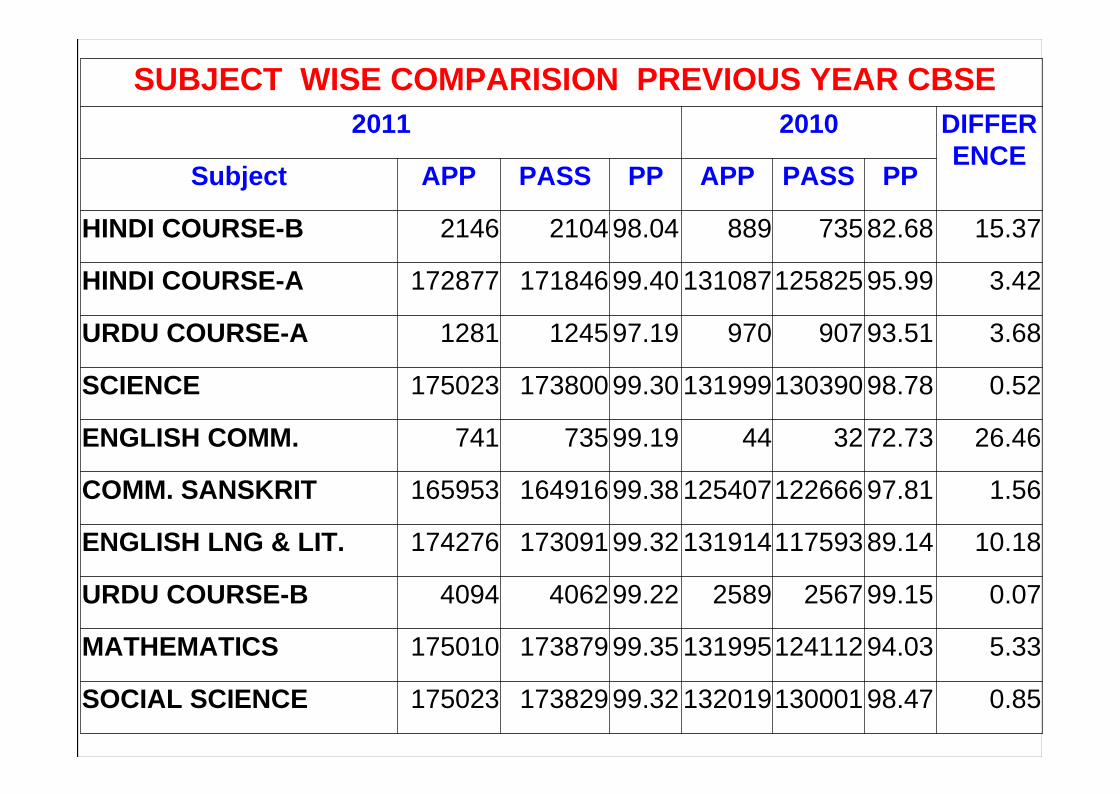
SUBJECT WISE COMPARISION PREVIOUS YEAR CBSE2011 2010 DIFFER
ENCESubject APP PASS PP APP PASS PP
HINDI COURSE-B 2146 2104 98.04 889 735 82.68 15.37
HINDI COURSE-A 172877 171846 99.40 131087125825 95.99 3.42
URDU COURSE-A 1281 1245 97.19 970 907 93.51 3.68
SCIENCE 175023 173800 99.30 131999130390 98.78 0.52
ENGLISH COMM. 741 735 99.19 44 32 72.73 26.46
COMM. SANSKRIT 165953 164916 99.38 125407122666 97.81 1.56
ENGLISH LNG & LIT. 174276 173091 99.32 131914117593 89.14 10.18
URDU COURSE-B 4094 4062 99.22 2589 2567 99.15 0.07
MATHEMATICS 175010 173879 99.35 131995124112 94.03 5.33
SOCIAL SCIENCE 175023 173829 99.32 132019130001 98.47 0.85
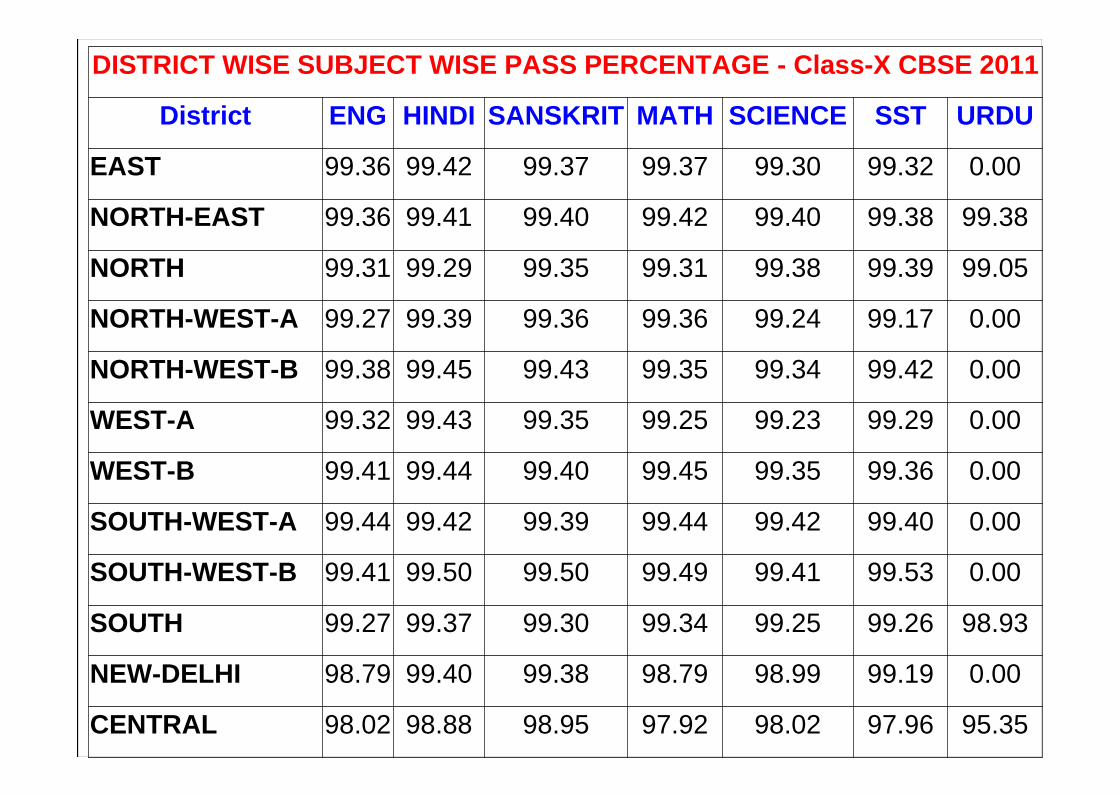
DISTRICT WISE SUBJECT WISE PASS PERCENTAGE - Class-X CBSE 2011
District ENG HINDI SANSKRIT MATH SCIENCE SST URDU
EAST 99.36 99.42 99.37 99.37 99.30 99.32 0.00
NORTH-EAST 99.36 99.41 99.40 99.42 99.40 99.38 99.38
NORTH 99.31 99.29 99.35 99.31 99.38 99.39 99.05
NORTH-WEST-A 99.27 99.39 99.36 99.36 99.24 99.17 0.00
NORTH-WEST-B 99.38 99.45 99.43 99.35 99.34 99.42 0.00
WEST-A 99.32 99.43 99.35 99.25 99.23 99.29 0.00
WEST-B 99.41 99.44 99.40 99.45 99.35 99.36 0.00
SOUTH-WEST-A 99.44 99.42 99.39 99.44 99.42 99.40 0.00
SOUTH-WEST-B 99.41 99.50 99.50 99.49 99.41 99.53 0.00
SOUTH 99.27 99.37 99.30 99.34 99.25 99.26 98.93
NEW-DELHI 98.79 99.40 99.38 98.79 98.99 99.19 0.00
CENTRAL 98.02 98.88 98.95 97.92 98.02 97.96 95.35

CBSE Class –X 2011
Number of Schools whose PP
Year Increased
Declined
Nochange
FirstTime
Total
2011 604 160 86 45 895
2010 441 332 69 9 851

DISTRICT WISE NUMBER OF SCHOOLS WHOSE PP HAS DECLINEDOVER THE LAST YEAR - Class X CBSE
District 2011 2010<=5 >5 AND <=10 >10 TOTAL <=5 >5 AND <=10 >10 TOTAL
EAST 18 0 0 18 18 4 5 27NORTH-EAST 24 0 0 24 12 4 8 24NORTH 4 0 0 4 9 3 10 22NORTH-WEST-A 23 0 1 24 18 6 6 30
NORTH-WEST-A 28 0 0 28 26 4 8 38
WEST-A 8 0 0 8 17 9 4 30WEST-B 18 0 0 18 22 4 4 30SOUTH-WEST-A 4 0 0 4 10 4 1 15
SOUTH-WEST-B 15 0 0 15 14 8 5 27
SOUTH 7 1 0 8 27 15 27 69NEW-DELHI 1 0 0 1 1 0 0 1CENTRAL 7 1 0 8 8 2 9 19TOTAL 157 2 1 160 182 63 87 332

CBSE 2011 CLASS-X SCHOOLS HAVING URDU AS A MEDIUM OF INSTRUCTIONS.NO SCHID SCHNAME APP PASS PP
1 1105008 Jafrabad-GBSSS 398 394 98
2 1105018 Jafrabad, Zeenat Mahal(Urdu Medium)-SKV 617 612 99
3 1208027 Quresh Nagar(Urdu Medium)-GGSS 37 37 100
4 1208090 Inder Lok-SKV 109 107 98
5 1925002 Noor Nagar-GBSSS 334 329 98
6 1925035 Noor Nagar-SKV 232 232 100
7 1925049 Joga Bai-GGSSS 236 233 98
8 1925052 Joga Bai-GBSSS 183 183 100
9 2127002 Jama Masjid, No.1(Urdu Medium)-SBV 60 60 100
10 2127003 Darya Ganj, Pataudi House-SBV 132 128 96
11 2127017 Jama Masjid, No.2-SKV 120 119 99
12 2127021 Bulbuli Khana-SKV 132 129 97
13 2127022 Haweli Azam Khan-GGSS 43 39 90
14 2127025 Chashma Building(Urdu Medium)-GGSSS 55 50 90
15 2127027 Kalan Mahal-GGSS 51 51 100
16 2127179 Lal Kuan, Zeenat Mahal, No.2-SKV 157 137 87
17 2127180 Lal Kuan, No.1-GGSS 28 27 96
TOTAL 2924 2867 98.05
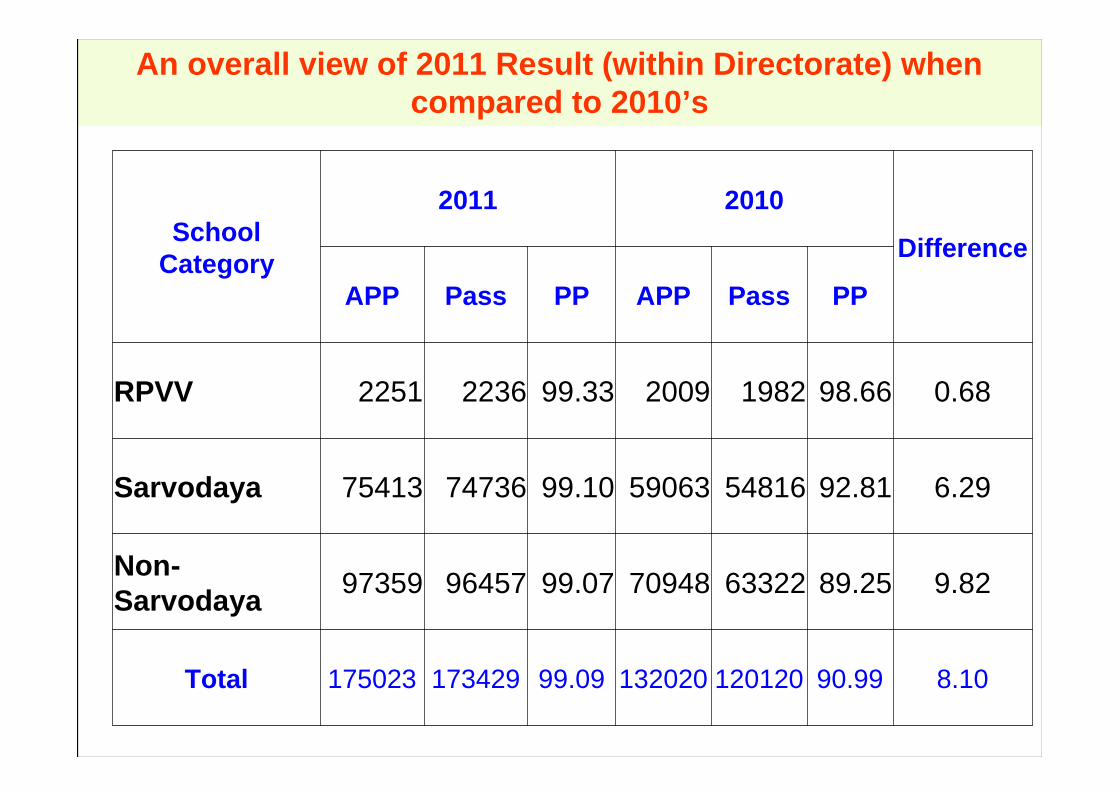
An overall view of 2011 Result (within Directorate) whencompared to 2010’s
SchoolCategory
2011 2010
Difference
APP Pass PP APP Pass PP
RPVV 2251 2236 99.33 2009 1982 98.66 0.68
Sarvodaya 75413 74736 99.10 59063 54816 92.81 6.29
Non-Sarvodaya 97359 96457 99.07 70948 63322 89.25 9.82
Total 175023 173429 99.09 132020 120120 90.99 8.10
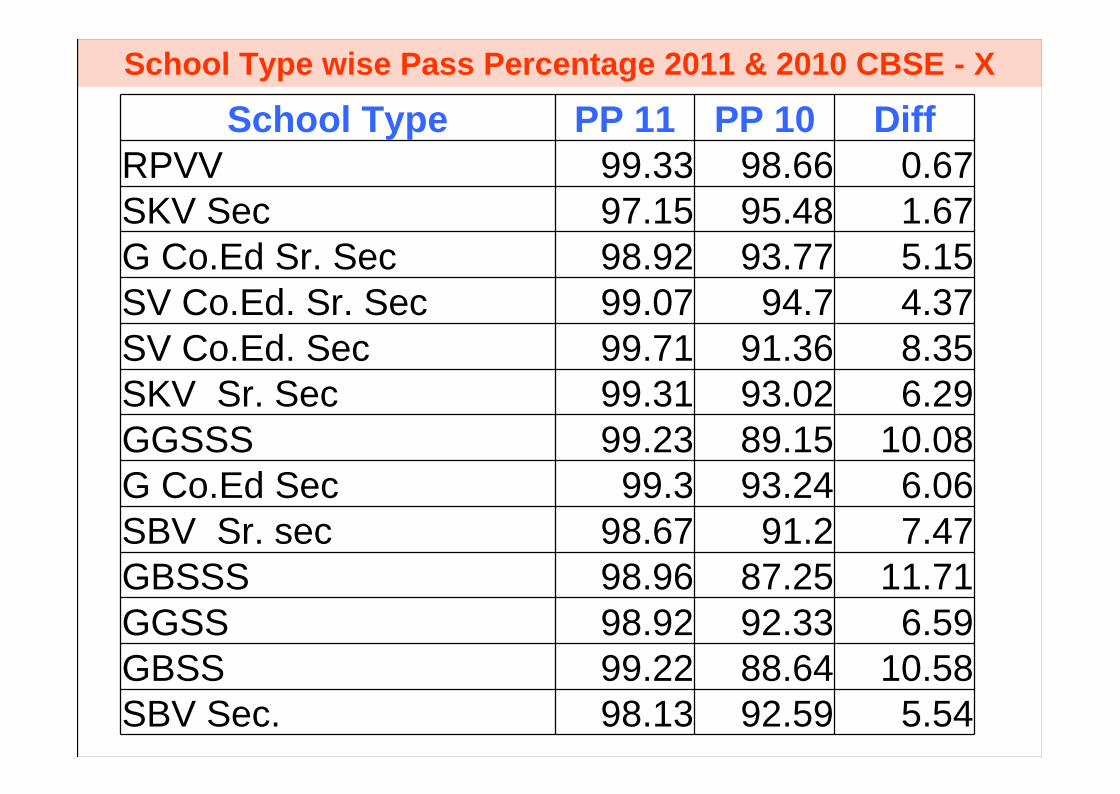
School Type wise Pass Percentage 2011 & 2010 CBSE - X
School Type PP 11 PP 10 DiffRPVV 99.33 98.66 0.67SKV Sec 97.15 95.48 1.67G Co.Ed Sr. Sec 98.92 93.77 5.15SV Co.Ed. Sr. Sec 99.07 94.7 4.37SV Co.Ed. Sec 99.71 91.36 8.35SKV Sr. Sec 99.31 93.02 6.29GGSSS 99.23 89.15 10.08G Co.Ed Sec 99.3 93.24 6.06SBV Sr. sec 98.67 91.2 7.47GBSSS 98.96 87.25 11.71GGSS 98.92 92.33 6.59GBSS 99.22 88.64 10.58SBV Sec. 98.13 92.59 5.54

THANKS