analysis of causes of national - departamento de...
TRANSCRIPT

Analysis of Causes of National Deaths for Action (ANACONDA)
Prof. Alan Lopez Recife, Brazil
October, 2017

Assessing the quality of mortality data: Key demographic and
epidemiological concepts underlying ANACONDA

The building blocks
• ANACONDA is built around a set of standard demographic and epidemiological concepts and classifications
• You need to be familiar with these in order to be better able to interpret the results
• Age and sex are the most important determinants of mortality risk and occurrence of disease and injury; hence we disaggregate by age and sex in all our data quality checks and analyses

What are the main data quality issues that ANACONDA checks?
• Completeness of your dataset: i.e. is your system able to record/register most, if not all, births and deaths that occur?
• How complete is child death registration? • Is age and sex of people who die being recorded correctly? • Are the broad cause of death patterns plausible given the
age structure and overall health status of the population? • What fraction of deaths are assigned an “unusable” code? • What are the most common reasons for unusable causes in
your data; how severe are they for mis-informing policy? • How common are unusable (‘garbage’) causes among the
leading causes of death?

Key demographic concepts underlying data quality
assessment

Concept of completeness of registration
Completeness of registration of vital events is the proportion of deaths (or births) that occur in a given year and are registered in your Civil Registration system in the year that they occur. To calculate registration completeness, you need to know the
– number of events registered in a given year – actual number of events that occurred in that year
• Many countries don’t know the actual number of births and deaths, so registration systems are very incomplete; this has serious implications for using data from these systems to guide policy. WHY?
How can we measure completeness of registration of deaths in a population?
• Established indirect demographic techniques (e.g. Brass Growth-Balance, Bennet-Horiuchi, Preston-Coale,etc) known as ‘Death Distribution Methods’ have been used to estimate completeness.
• These methods are complex, highly dependent on (usually) unrealistic demographic assumptions about your population being ‘closed’ (i.e. no migration) and ‘stable’ (i.e. constant difference between birth and death rates); also very unreliable (+/- 15% accuracy, at best).
• This inaccuracy likely to be far too great to monitor progress with registration improvements, and to be able to use data confidently for policy and planning.

Interpreting the Crude Death Rate
• ANACONDA uses the observed level of the Crude death rate (CDR) as a one proxy indicator of death registration completeness, taking into account population age structure; the lower the CDR, inter-alia, the higher the degree of mortality under-registration in the population.
• CDR calculated as:
• ANACONDA calculates the CDR directly from your input data and assesses likely completeness by comparing your CDR to that estimated for the GBD Study for your country
• The trend in the CDR estimated by the GBD Study is also provided to assist with interpretation of current observed CDR; does it make sense in context of previous levels of the CDR?
• A CDR of less than about 5/1000 generally indicates incomplete death reporting. Only very few countries have recorded true CDRs <5/1000. WHICH ONES? WHY?

Understanding population age structure is key to understanding mortality
• Younger populations are characterised by high birth rates and few older people. They usually have high mortality, particularly for children
• Older populations are characterised by declining fertility rates, declining child and adult mortality rates, leading to a high proportion of the elderly
• These demographic observations are important since they help interpret the plausibility of the Crude Death Rate calculated from your data
• The progressive change from a ‘young’ to an ’old’ population is known as “demographic transition”

Population pyramids give you an overview of the age structure (to interpret plausibility of the CDR)
Very young population Older population
Note: two populations (such as Japan and Sudan) with very different age structures and very different levels of mortality can have the same Crude Death Rate. WHY?

Empirical evidence about demographic transition: example of Japanese females, 1950-2010
--- Life expectancy at birth --- % Population 65+ --- Under 5 mortality rate (x1000)
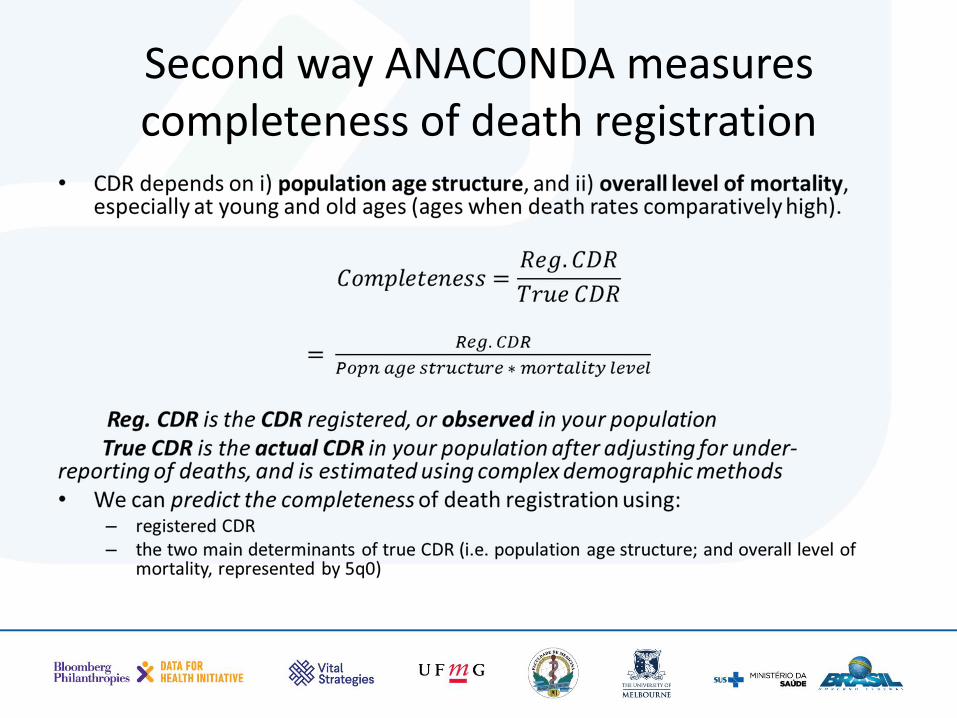
Second way ANACONDA measures completeness of death registration

Adair-Lopez completeness prediction Model

How does the model perform? Predicted v observed completeness (observed compl. = Reg CDR/True CDR)
0.1
.2.3
.4.5
.6.7
.8.9
1
Pre
d A
llcom
pl.
0 .1 .2 .3 .4 .5 .6 .7 .8 .9 1Obs Allcompl.
Predicted y

Predicted v observed completeness – at various levels of registered CDR
0.2
.4.6
.81
Com
ple
tene
ss
0 1 2 3 4 5 6 7 8 9 10 11 12 13 14 15Registered CDR
Observed Predicted

Advantages/application of model to predict completeness
• Prediction can be done entirely from input data/comparator data entered into ANACONDA; no additional external data
• Easily applied to estimate sub-national completeness of registration; option to input regional values of 5q0
• Sub-national estimates likely to vary substantially; better guide for targeting interventions to improve death registration

Model predicted completeness in Data for Health countries
Country/ city Predicted Observed (i.e. best estimate)
Bangladesh 9 5
Brazil 97 94
Shanghai 99 100
Colombia 85 83
Ecuador 80 81
Ghana 23 28
Mumbai 98 100
Myanmar 46 47
Peru 73 73
Philippines 82 87
Rwanda 6 5
Solomon Islands 52 59
Sri Lanka 98 100
Tanzania 8 12
Zambia 5 3

Example of sub-national application: Colombia departments
Department Pred. compl. Department Pred. compl.
Amazonas 67 Guaviare 52 Antioquia 88 Huila 83 Arauca 82 La Guajira 22 Archipiélago de San Andrés y Providencia 89 Magdalena 81 Atlántico 95 Meta 97 Bogotá 92 Nariño 74 Bolívar 74 Norte de Santander 86 Boyacá 80 Putumayo 36 Caldas 97 Quindío 89 Caquetá 75 Risaralda 94 Casanare 79 Santander 94 Cauca 61 Sucre 90 Cesar 80 Tolima 77 Chocó 36 Valle del Cauca 94 Córdoba 87 Vaupés 29 Cundinamarca 81 Vichada 60 Guainía 66 National 85
Conclusions: applicability of the method
• Main drivers of true CDR (population ageing, level of mortality represented by 5q0) can be used, with registered CDR and child mortality completeness, to predict completeness of registration
• All of these variables can be calculated directly from input data into ANACONDA; no need for external data inputs - huge advantage!
• Predicted completeness of registration usually with +/- 3-5% of true rate (R² = .85)
• Likely to be accurate enough to indicate where (in which populations) there is urgent need to rapidly improve death registration processes

What else affects data quality of registered deaths in a population?
• Completeness of registration by far the most important determinant of mortality data quality; need to check if female deaths less well counted
• But age misreporting of deaths also a key determinant of mortality data quality
• Why? Because the risk of dying is not the same for all age groups; need to accurately identify premature deaths in the data
• ANACONDA therefore checks how well you are reporting deaths at different ages

Spot the difference: Australian mortality rates by age and sex
-
100
200
300
400
500
600
<1
5-9
15-1
9
25-2
9
35-3
9
45-4
9
55-5
9
65-6
9
75-7
9
85-8
9
95-9
9
<1
5-9
15-1
9
25-2
9
35-3
9
45-4
9
55-5
9
65-6
9
75-7
9
85-8
9
95-9
9
Mort
alit
y ra
te p
er
1,0
00
Age
Males Females

The risk of dying is not the same for all age groups as reflected in the Age-Specific Death Rate (ASDR)
• The ASDR is the number of deaths recorded for a specific age group in a given year, related to the total mid-year population in that age-group:
• ANACONDA calculates these mortality rates in standard 5-year age groups and allows you to check them against comparators for plausibility
• In the absence of high injury/HIV/maternal mortality, death rates rise exponentially with age beyond about age 35 (Gompertz’ law (1825)).
• That is, m(x) = α.exp(βx), so ln[m(x)] = A + B.x , where A, B are constants. i.e. natural logarithm (ln) of the death rate [m(x)] is a linear function of age, i.e. is a straight line after about age 35
• We use this observation to compare the age and sex pattern of death rates in VR data with the comparator (much easier to see differences)

Linear increase in Natural log (ln) of the ASDR with age

Log plots of age-specific death rates, Zimbabwe 2006, Mauritius 2000, Australia 2005

At what ages does most under-counting
of deaths occur? Study in Thailand (2005)
Age group
0-4 5-49 50-74 75+ All ages
Undercount (%)
42.8 14.8 7.7 5.9 8.7
ANACONDA therefore focuses special attention on assessing completeness of death registration in this age group

Child mortality rate • Mortality among children under five years of age widely used health indicator;
included in MDGs, SDGs.
• Enormous global health focus during past 5 decades to improve child survival; improved by 70-80% since 1970
• Because of this global focus, very large amount of data on levels of child mortality collected from censuses and surveys and used to indirectly measure probability of dying before age 5 (5q0), expressed as a risk per 1000 live births.
• These data likely to more accurately reflect level of child mortality than deaths reported in CRVS system. WHY?
• Can we use these widely available data on probability of dying before age 5 to estimate the completeness of registration of child deaths?
• To do so, need to convert death rates among children at different ages under 5 into the cumulative probability of dying before age 5 (5q0)
• This requires calculation of a Life Table; ANACONDA calculates a full (over all ages) Life Table and hence 5q0, directly from your input data
• This Life Table NOT to be used for any other mortality analysis. WHY?
Life table and life expectancy
• A life table provides various measures of mortality that are of public health importance such as:
– The probability of dying at any age
– Life expectancy at birth
– Life expectancy at any age
• Life expectancy is the average number of years that a person can expect to live assuming current ASDR continue forever
• Remember that the life table that ANACONDA calculates is only as reliable as your input data. If you seriously under-report deaths, the life table will be biased and over-estimate life expectancy

Observed (from vital registration (VR)) and estimated levels of the under-five mortality rate (5q0), selected countries, 1960-2000

Child mortality comparator
• The 5q0 comparator we use is from the IGME, an Inter-agency group that prepares mortality estimates for child deaths
• To estimate completeness of child death registration, calculate the relative difference between the two rates (i.e. input data (O), and comparator (E)). Calculated as (E-O)/E x 100%
• For example, if this = 50%, then half of all deaths among children under 5 are not being registered.
• WHY?
Key epidemiological concepts underlying data quality
assessment

Disease and Injury classification system
• The International Statistical Classification for Diseases and Related Health Problems (ICD) is the global standard for collecting cause of death data
• First developed around 1900; currently in its 10th Revision. Issued by WHO since 1948
• The ICD classification is divided into 21 Chapters, subdivided into homogenous blocks that consist of 3-character disease categories, e.g. I50, C48, etc
• ICD is used to translate diagnoses into alphanumeric codes that can be compiled into statistics
• Requires a three-stage process – certification of the cause of death by a physician, coding of the certificates by trained coders applying the rules of the ICD, and tabulation of the individual codes into cause of death tabulations or tables/graphs to inform policy.

ICD classification system for deaths
• Originally only used to classify COD – later expanded to cover morbidity and contacts with health services
• The “core” classification item for any disease or injury is the 3-character ICD code; over 3000 separate codes to describe causes of death
• For public health purposes, we aggregate these codes into Short or Tabulation Lists, usually containing between 50-300 categories

International form of medical certification of cause of death (WHO 2016)

COD concepts
• The medical certificate must contain all those diseases or injuries which either resulted in or contributed to death (but not the symptoms or modes of dying)
• Line 1: the immediate/direct cause
• Line 2: the intermediate cause (if any)
• Last line: the underlying COD – critical!!
• Part 2: other significant contributory conditions

Underlying Cause of Death (UCOD)
• The disease or injury which initiated the train of morbid events leading directly to death;
OR
• The circumstances of the accident or violence which produced the fatal injury
• Crucial to get the underlying cause of death correct to guide public health interventions

Certifier’s role in diagnosing the COD
• Doctors play a crucial role in the overall quality of cause of death data since only they are qualified to identify the disease or injury that initiated the sequence of morbid events which led to death
• Certifying the COD of their patients often seen as an administrative task; not a job they like
• Doctors often unaware of their public health responsibility
• Consequence: COD often poorly/incorrectly certified

What can we conclude from CoD data for hospital deaths? Example of misdiagnosis in Thailand MEDICAL RECORDS DIAGNOSES
HIV
/AID
S (2
0)
Live
r can
cer (
31)
Lung
can
cer (
34)
Oth
er c
ance
rs (4
6)
Dia
bete
s (5
2)
Hyp
erte
nsiv
e di
seas
es (6
6)
Isch
aem
ic h
eart
dis
ease
s (6
7)
Oth
er h
eart
dis
ease
s (6
8)
Cere
brov
ascu
lar d
isea
ses
(69)
Pneu
mon
ia (7
4)
COPD
(76)
Live
r dis
ease
s (8
0)
Oth
er d
iges
tive
dise
ases
(81)
Gen
itour
inar
y di
seas
es (8
4)
Tran
spor
t acc
iden
ts (9
6)
All o
ther
cau
ses
Total
Septicaemia (12) 44 2 3 3 53 6 8 3 55 38 16 27 19 47 2 144 470
Ill defined conditions (94) 16 6 7 5 27 16 75 36 25 14 39 10 14 13 9 135 447
Cerebrovascular diseases (69) 1 7 1 4 5 203 1 9 31 262
Ischaemic heart diseases (67) 1 2 26 5 138 9 3 2 3 3 6 16 214
Pneumonia (74) 40 3 9 1 4 2 25 44 21 7 1 10 3 37 207
All other external causes (103) 1 1 2 1 25 1 93 61 185
Genitourinary diseases (84) 1 1 1 37 24 2 3 3 1 1 5 2 58 17 156
Lung cancer (34) 1 85 6 1 4 5 102
Transport accidents (96) 1 91 92
Liver diseases (80) 2 2 1 2 2 63 2 1 11 86
HIV/AIDS (20) 79 1 3 83
Other cancers (46) 1 14 3 24 2 1 34 79
COPD (76) 1 2 2 3 3 2 3 54 2 5 77
Other digestive diseases (81) 3 1 2 2 1 2 1 16 17 1 1 27 74
Other respiratory diseases (77) 5 2 1 4 1 5 8 3 12 3 3 1 25 73
Other heart diseases (68) 1 1 1 4 15 14 4 1 4 1 1 5 1 18 71
Liver cancer (31) 58 2 1 3 4 68
Other infectious diseases (25) 18 1 3 1 5 1 1 1 1 3 17 52
Tuberculosis (5) 20 1 2 17 40
Other nervous system disorders (61) 10 2 1 4 1 10 28
Diabetes (52) 1 16 2 1 1 2 1 2 26
All other causes 14 8 9 8 5 3 18 1 1 9 4 6 2 336 424
Total 256 85 111 52 199 69 267 82 386 112 159 147 64 159 213 955 3316

The role of the coder
• ICD-10 has clear coding rules for processing cause of death information on the death certificate
• A correctly filled death certificate is easily coded by a trained mortality coder
• A poorly filled death certificate often results in a “garbage”/unusable COD; coders cannot work miracles!! Garbage in, garbage out!!
• Labelled as ‘unusable codes’ since they are of none, or very limited use for policymakers e.g. ‘heart failure’
• ANACONDA identifies these useless codes in the dataset and classifies them according to severity of their implications for policy, or by type of diagnostic error

Concept of ‘Garbage codes’ (unusable codes)
• The 1990 GBD study first identified ‘garbage codes’ and proposed rules to reallocate them to specific causes of death
• ‘Garbage codes’ defined them as ‘deaths assigned to causes that cannot or should not be considered underlying causes of death, e.g.
– Signs, symptoms and ill-defined conditions
– Impossible UCOD
– Intermediate and immediate causes
– Insufficiently specified within ICD chapters

Using GBD broad cause groups to screen for gross errors in COD data/plausibility of epidemiological transition
Group I: • Infections & Parasitic diseases (e.g. TB, pneumonia, diarrhoea,
malaria, measles) • Maternal/perinatal causes (e.g. maternal haemorrhage, birth
trauma) • Malnutrition Group II: • Non-communicable diseases (e.g. Cancer, diabetes, heart disease,
stroke) • Mental health conditions (e.g. Schizophrenia) Group III: • Injuries (e.g. Accidents, homicide, suicide) often referred to as
“external diseases” or “non-natural” COD
Classification of Garbage Codes based on severity of impact for guiding policy
– Level 1( Very High): codes where the misdiagnosis has serious implications for public health policies
– Level 2 (High): codes with substantial implications for guiding public health policy
– Level 3 (Medium): codes with important implications for policymaking
– Level 4 (Low): codes with limited implications for public health policies
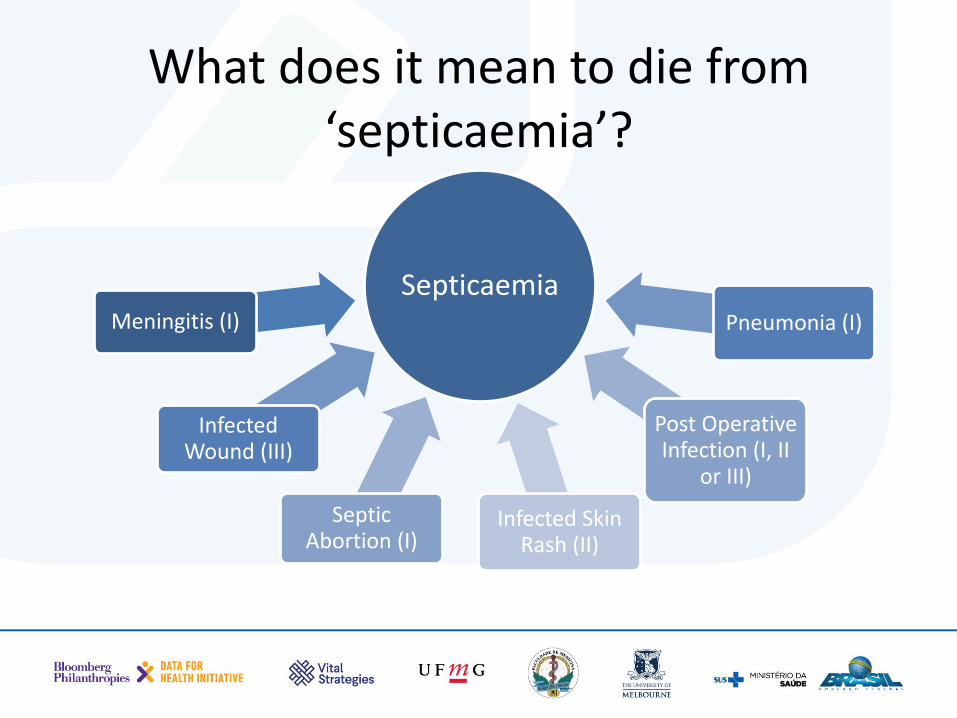
What does it mean to die from ‘septicaemia’?
Septicaemia Meningitis (I)
Infected Wound (III)
Septic Abortion (I)
Infected Skin Rash (II)
Post Operative Infection (I, II
or III)
Pneumonia (I)
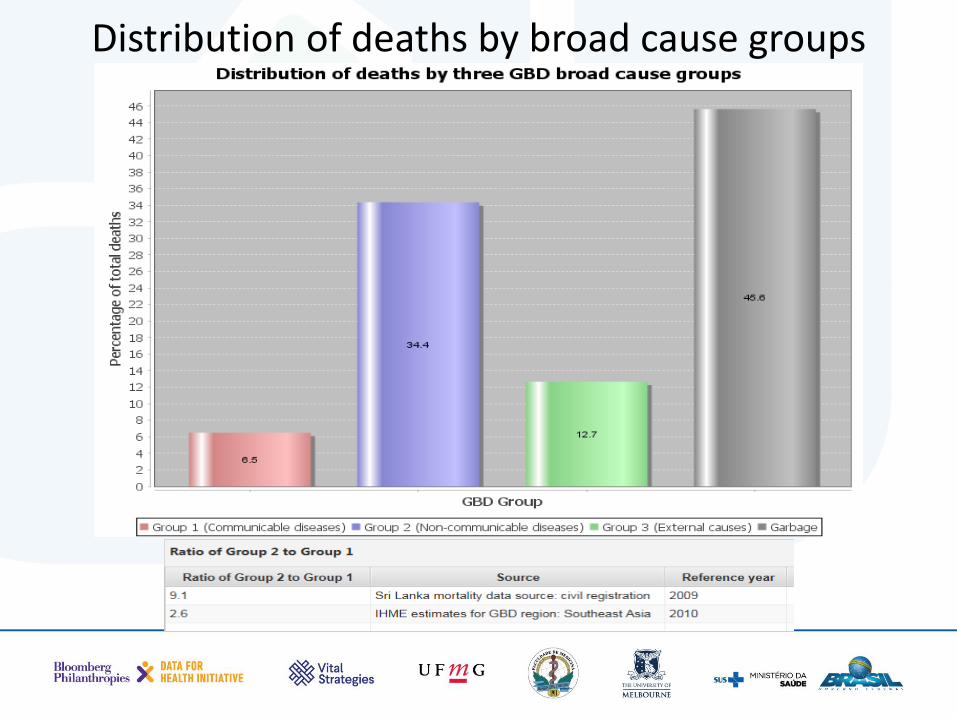
Distribution of deaths by broad cause groups

Tabulation lists
• Once the death certificates have been coded and compiled by age and sex, they need to be tabulated in a useful way
• Based on the 3-character ICD codes, WHO has proposed 4 tabulation lists which condense the categories into manageable number of items
• ANACONDA uses one of these with 103 disease categories to tabulate and rank CoD data

Global Burden of Disease (GBD) List
• Another standard tabulation used in ANACONDA comes from the GBD. GBD is a large, global collaborative study to estimate mortality and causes of death in 190 countries. First done in 1990, then 2000, 2012, 2013; annual updates since 2015
• GBD groups ICD causes of death into approx. 300 specific disease and injury categories considered to be of global public health importance
• GBD COD list is hierarchical: 3 broad groups (I,II,III) subdivided into 21 major disease/injury groups (A (e.g. Neoplasms),B,C, D, etc), most of which are further disaggregated into sub-categories 01 (e.g. stomach cancer), 02, 03, etc

Concept of leading causes of death
• These and other CoD lists are used in all countries to rank leading causes of death to guide health policies
• Usually the 10 to 20 diseases/categories that cause the highest number of deaths are ranked
• ANACONDA automatically calculates the 20 leading causes for males and females based on 3 digit ICD
• These are the diseases causing most (premature) deaths that policy makers want to try and prevent – but how can they if ‘garbage codes’ dominate leading cause of death lists??

Leading Causes of Death Top 10 Causes of Death Globally, 2013
-1% 1% 3% 5% 7% 9% 11% 13% 15%
Diabetes mellitus
HIV/AIDS
Road injuries
Tracheal, bronchus and lung cancer
Alzheimer disease and other dementias
HIV/AIDS and tuberculosis
Lower respiratory infections
Chronic obstructive pulmonary disease
Cerebrovascular disease
Ischemic heart disease
Percent of total deaths
Does my age pattern of causes of death look sensible?
• Causes of death should follow a well-established age pattern, e.g. higher infectious disease mortality at younger than older ages; higher NCD death rates among older adults; higher injury mortality among young adults
• True for each individual cause of death but checking age patterns of broad cause of death groups should identify any gross errors
• Male-female differences at broad cause group level provide additional check in plausibility; should be more male deaths at each age up to about 75, then more female deaths at the highest ages. WHY?

Typical age distribution of broad causes of death: 1-Comm. Dis., 2-NCDs, 3- Inj. Males
Summary index of vital statistics data quality: Vital Statistics Performance Index
• The overall policy utility of VS data can be assessed according five quality dimensions, plus timeliness of data
• Using a simulation environment, the relative weight of each has been empirically determined and they have been combined into a single metric, the Vital Statistics Performance Index (VSPI)
• For ANACONDA, we utilized the 5 data quality measures but not the dimension related to timeliness of data, since not assessed using ANACONDA. Defined a new metric: VSPI(Q)
• VSPI and VSPI(Q) scores range from 0 (poorest performance) to 1 (best possible performance)
• VSPI measures objectively, comprehensively and usefully whether data from a VS system are ‘fit-for-purpose’.

How do we assess CRVS system performance using the VSPI (Q)

VSPI Simulation

The Vital Statistics Performance Index for Data Quality – VSPI(Q)
• VSPI(Q) measures quality of mortality data on 5 dimensions: – completeness,
– CoD accuracy (i.e. pattern and extent of garbage coding),
– CoD detail available in tabulation lists,
– missing information (age/sex of decedent)
– biological plausibility of causes of death ( e.g. male pregnancy. deaths)
• The index (VSPI) was originally developed to assess the quality of the VS data used in the GBD and is rapidly becoming a global indicator to measure the performance and progress of vital statistics registration systems (see Mikkelsen et al, Lancet CRVS series, 2015)

Interpreting the VSPI(Q) in ANACONDA
• Provides detail about the relative contribution of each of the five dimensions to overall data quality of the CRVS system.
• A summary indicator will invariably obscure impact of specific problems on VS performance; hence important to examine scores for subcomponents to understand which improvement actions will have the biggest impact.
• ANACONDA shows the relative importance of each data quality component to the CRVS performance gap (compared with 100%) and highlights priority areas for improvement

Conclusions • All else being equal, completeness of a VS system is the single most
important aspect affecting performance (i.e. data quality)
• The two other most important factors affecting data quality are the use of abbreviated cause of death lists to report data, and widespread use of garbage codes to assign the underlying cause of death.
• Given the dominance of these three dimensions, national strategies to rapidly strengthen VS systems should focus on them (and any other dimensions identified by the VSPI).
• UoM working on a similar VSPI for births.
• Remember ANACONDA will help identify the pattern, extent and implications of errors/biases in your VR data, but will not fix’ them
• UoM has developed a ‘tool kit’ to guide and evaluate CRVS intervention strategies (which should be based/prioritized according to ANACONDA).

For more information, please contact:
www.mspgh.unimelb.edu.au/dataforhealth