analysis of booming pharmaceutical sector in india
TRANSCRIPT


HISTORY OF INDIAN PHARMACEUTICAL COMPANIES

22
Contents
� Growing Indian Economy
� Growing Middle Class with Higher Purchasing Power
� Changing Disease Profile
� Government Policies
� HealthCare Insurance
Strong Macro-Economics over the Next Decade

Growing Middle Class with Higher Purchasing Power• India’s population is currently around 1.2 billion and is projected to rise to 1.7 billion by 2050 – a 41.66% increase that will see it
outstrip China as the world’s most populous state. Besides, India has a huge middle class population (households with annual incomes of US$4762 to US$23,810 at 2001-02 prices), which has grown rapidly, from 25 million people in 1996 to 159 million people in 2013. If the economy continues to grow fast and literacy rates keep rising, around a third of the population (34%) is expected to join the middle class in the near future. The middle class population is rapidly acquiring the purchasing power necessary to afford quality western medicine due to an increase in disposable income.

The Indian population spent 7% of
its disposable income on healthcare
in 2005; this number is expected to
nearly double, to 13%, by 2025

Changing Disease ProfileThe Indian population is experiencing a shift in disease profilesTraditionally, the acute disease segment held a significant share ofthe Indian pharmaceutical market. This segment will continue togrow at a steady rate, due to issues relating to public hygiene andsanitation. But, with increase in affluence, rise in life expectancyand the onset of lifestyle related conditions, the disease profile isgradually shifting towards a growth in the chronic diseasessegment. India has the largest pool of diabetic patients in theworld, with more than 41 million people suffering from thedisease; this is projected to reach 73.5 million in 2025. IMS Healthindicates that some of the fastest growing therapeutic segmentsin the Indian Pharma space today are chronic disease-relatedtherapeutic segments. The anti-diabetic segment grew 29% in the12 months ending July 2010. Cardio-vascular medication andnervous system disorder medication grew at 22% for the sameperiod of time, indicating rapid growth. The growing size of theIndian geriatric population will be a key factor in influencing thegrowth of the chronic segment. By 2028, an estimated 199 millionIndians will be age 60 or older, up from about 91 million in2008.Along with chronic, in the last year there has been a reboundin sales in the acute diseases segment. This trend is likely tocontinue over the next few years, as we see companies wideningtheir reach into newer markets, which have a relatively highernumber of treatment naïve patients requiring basic treatment,thus, creating new demand for drugs of the acute therapiessegment.

• Government Policies
The Indian government has been making efforts toimprove nationwide provision of healthcare. It haslaunched policies that are aimed at:
• building more hospitals,
• boosting local access to healthcare,
• improving the quality of medical training,
• increasing public expenditure on healthcare to 2-3%of GDP, up from a current low of 1%.
Some of the significant government allocations onhealthcare spend include a five year tax break foropening hospitals anywhere in India, with an addedfocus on tier II and tier III markets, both in the 2008-09Union Budget plans to spend US$373 million on thepromotion of healthcare through programmes for theprevention and cure of diseases such as cancer,diabetes, heart ailments and stroke in 2014-15.
Diabetes, hypertension and non- communicabledisease patients will be screened under the NationalProgramme for Prevention and Control of Cancer,Diabetes, Cardiovascular Diseases and Stroke(NPCDCS). The programme is likely to cover more than70 million adults across 100 districts in 15 states andunion territories of the country
• Healthcare Insurance
India’s healthcare insurance industry is currently small and limited, but is expected to grow at a CAGR of 15% till 201. Around 80% of India’s healthcare expenditure is financed out of pocket. This limits the propensity of Indians to spend on healthcare, particularly in lower and middle income groups which comprise around 95% of population.The small percentage of Indians who do have some insurance, the main provider is the Government-run General Insurance Company (GIC). Private insurance only came into the market post 2007, when the Insurance Regulatory and Development Authority (IRDA) eliminated tariffs on general insurance. Apollo was the first private healthcare insurance provider in the country; other private entrants are ICICI Lombard, Tata AIG, Royal Sundaram, Star Allied Health Insurance, Cholamandalam DBS and Bajaj Allianz Apollo

$15.6 billionPharma Exports in FY13
$16.4 billionDomestic Pharma Market in FY13
60%Share of Urban Regions in the
Domestic Pharma Market in 2013
5%Pharma FDI as a Share of Total
FDI in India in FY14
73%Share of Indian Companies in
the Pharma Market in 2013
India‟s pharma sector at a glance
$84.9 billionEstimated Pharma Market Size
in 2020

STRUCTURE OF THE
PHARMA SECTOR
PHARMA
Active PharmaceuticalIngredients / Bulk Drugs Formulations
Pharma sector in India is broadly classified into two segments: Active Pharmaceutical
Ingredients/Bulk Drugs and Formulations
Branded Generic Chronic Acute
�Cardiovascular
�Neurological
�Anti-diabetes
�Gastro-intestinal
�Anti-infectives
�Respiratory
�Pain
�Gynecology
By therapeutic segments

Advantage India
AdvantageIndia
Cost Efficiency
• Lowcost of production and R&Dboosts efficiencyof Indianpharmacompanies
• Comparative cost advantageenhances Indianpharmaexports
EconomicDrivers
• Economicprosperity toimproveaffordabilityof drugs
• Increasingpenetration ofhealth insurance
Diversified Portfolio
• Accounts for over10per cent ofglobal pharmaceutical production
• Over60,000 generic brands across60 therapeutic categories
• Manufactures more than 400different APIs
Policy Support
• Government unveiled‘PharmaVision2020’aimedat makingIndiaagloballeader in end-to-enddrugmanufacture
• Reducedapproval time for newfacilities to boost investments
Market size:USD35.9billion
2016F
Market size:USD15.6billion
2011
Source: BMI, Aranca Research2016 revenueforecasts are estimates of BMI, United States Food and Drug
Association (USFDA), BMI stands for Business Monitor International,API stands for Active Pharmaceutical Ingredients

Evolution of the Indian pharmaceuticalsector
• Indiancompaniesincreasinglylaunchoperations in foreigncountries
• Indiaamajordestination forgeneric drugmanufacture
• Higher spendingon R&Ddueto theintroductionofproductpatents
• Liberalisedmarket• Domesticplayers
expandaggressively
• Increasedpropensity forR&D
• IndianPatent Actpassed in 1970
• Several domesticcompanies startoperations
• Development ofproductioninfrastructure
• Export initiativestaken
• Marketdominatedbyforeigncompanies,withlittledomesticparticipation
2005 onwards
1990-2005
1970-1990
Before 1970

Notable Trends in Indian Pharmaceutical sector
Research anddevelopment
• Indianpharma companies spend 2 per cent of their total turnover on R&D
• Expenditure on R&D is likely to increase due to the introduction of productpatents; companies need to develop new drugs to boost sales
Clinical trials
• Due to its cost advantage, India is increasingly becoming a hub for clinical trials. Clinical
trials market is estimated to be worth USD485million in 2010 and is projected to grow at 17
per cent CAGR over2009-15.
Export revenue
• The pharmaceutical export market in Indiais thrivingdue to strong presencein thegeneric
space
Joint ventures
• Several multinational companies are collaborating with Indian pharma firms to develop
new drugs
• Pfizer partnered with Aurobindo Pharmato developgeneric medicines
Product patents• The introduction of product patents in India in 2005 has boosted the discovery of new
drugs
• Indiahas reiterated its commitment to IP protection following the introduction of product
patents
• Due to its cost advantage, India is increasingly becoming a hub for clinical trials. Clinical trials
market is estimated to be worth USD585million in 2015 and is projected to grow at 17 per cent
CAGR over 2015-2020
• The pharmaceutical export market in India is thriving due to strong presence in
the generic space
• Several multinational companies are collaborating with Indian pharma firms to develop
new drugs
• Pfizer partnered with Aurobindo Pharmato develop generic medicines
• The introduction of product patents in India in 2005 has boosted the discovery of
new drugs
• India has reiterated its commitment to IP protection following the introduction of
productpatents
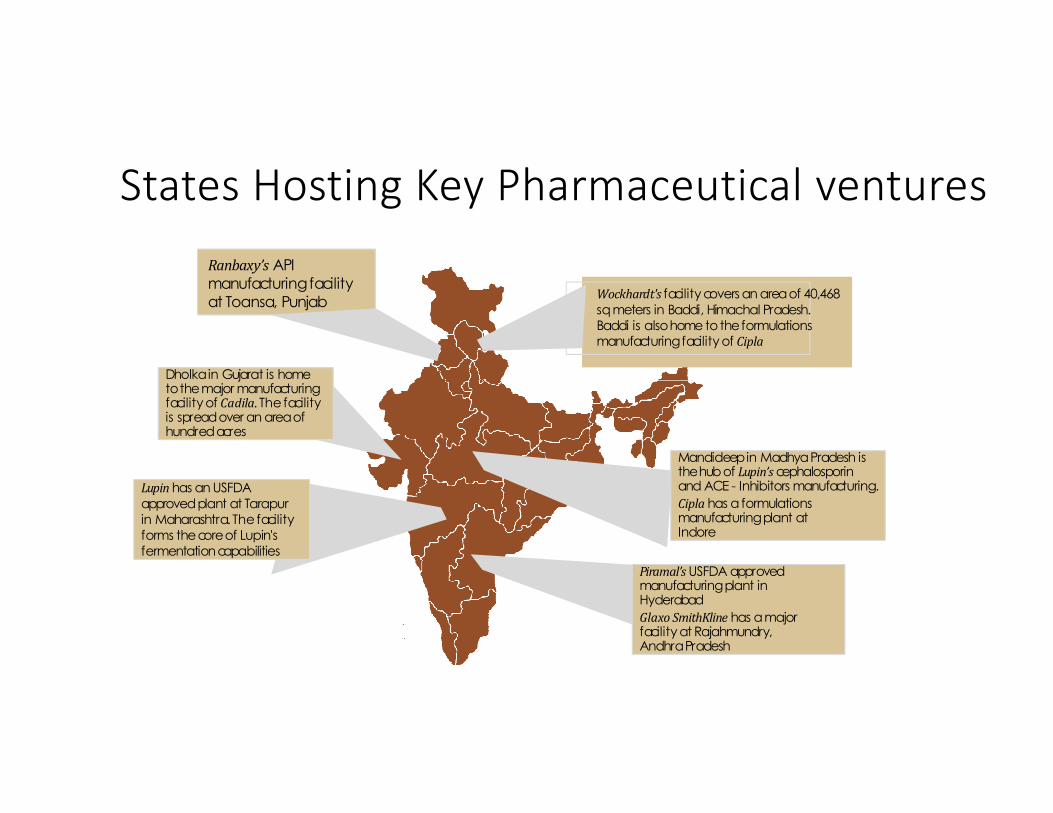
Dholkain Gujarat is hometothemajor manufacturingfacility of Cadila. The facilityis spreadover an areaofhundredacres
Wockhardt's facility covers an areaof 40,468sqmeters in Baddi, Himachal Pradesh.Baddi is alsohome totheformulationsmanufacturingfacility of Cipla
Ranbaxy’s APImanufacturingfacilityat Toansa, Punjab
Piramal’sUSFDA approvedmanufacturingplant in Hyderabad
Glaxo SmithKline has amajorfacility at Rajahmundry,AndhraPradesh
Mandideepin MadhyaPradesh isthehubof Lupin’scephalosporinand ACE - Inhibitors manufacturing.
Cipla has aformulationsmanufacturingplant atIndore
Lupinhas an USFDAapprovedplant at Tarapurin Maharashtra. Thefacilityforms thecoreof Lupin's fermentationcapabilities
States Hosting Key Pharmaceutical venturesStates hosting key pharmaceuticalventures
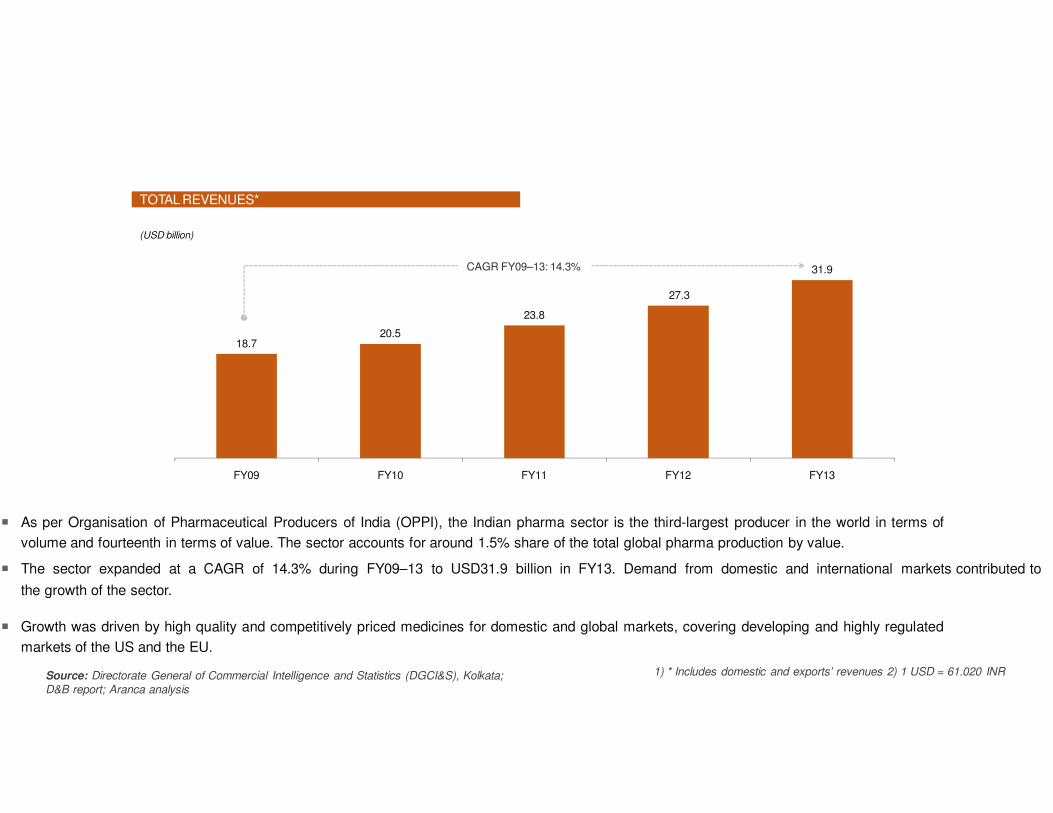
18.720.5
27.3
23.8
31.9
FY09 FY10 FY11 FY12 FY13
� As per Organisation of Pharmaceutical Producers of India (OPPI), the Indian pharma sector is the third-largest producer in the world in terms of
volume and fourteenth in terms of value. The sector accounts for around 1.5% share of the total global pharma production by value.
� The sector expanded at a CAGR of 14.3% during FY09–13 to USD31.9 billion in FY13. Demand from domestic and international markets contributed to
the growth of the sector.
� Growth was driven by high quality and competitively priced medicines for domestic and global markets, covering developing and highly regulated
markets of the US and the EU.
TOTAL REVENUES*
(USD billion)
India‟s pharma sector stood at USD31.9 billion in FY13, registering a CAGR of 14.3%
over FY09–13
CAGR FY09–13: 14.3%
Source: Directorate General of Commercial Intelligence and Statistics (DGCI&S), Kolkata;
D&B report; Aranca analysis
1) * Includes domestic and exports’ revenues 2) 1 USD = 61.020 INR

CAGR FY09–13: 10.8%
10.9
Source: DGCI&S, Kolkata; Department of Pharmaceuticals annual report 2011–12; Centre for Monitoring Indian Economy (CMIE) report; ICRA report
12.2
14.214.9
16.4
FY09 FY10 FY11 FY12 FY13
DOMESTIC REVENUES
(USD billion)
During FY09–13, domestic pharma market expanded at a CAGR of 10.8% to USD16.4
billion in FY13
� The domestic pharma market rose at a CAGR of 10.8% during
FY09–13, driven by increasing sales of generic medicines,
continued growth in chronic therapies, and greater
penetration in rural markets.
� Other key factors driving growth include favorable
demographics, rising income levels, growing health
awareness, increasing incidence of lifestyle diseases, and
insurance coverage.

EXPORT REVENUES EXPORT REVENUES – BY REGION
� The exports market performed well, with exports increasing from USD7.8 billion in FY09 to USD15.6 billion in FY13.
� The Americas accounted for ~34% of Indian pharma exports in FY13, followed by Europe (~26%) and Asia (~20%). The US had a ~26%
share, making it the single-largest export destination.
� Exports to Africa increased at a CAGR of 21% from FY09 to FY13, contributed mainly by export of anti-malarial and anti-retroviral drugs.
� Europe's share in Indian pharma exports has declined during FY09-13.
(USD billion)
Exports rose at 18.9% CAGR to USD15.6 billion; Americas had majority share in
India‟s exports, with US accounting for ~26%
7.88.3
12.4
9.6
15.6
FY09 FY10 FY11 FY12 FY13
CAGR FY09–13: 18.9%
Source: DGCI&S, Kolkata; CMIE report; India Ratings & Research (Ind-Ra) report, Aranca analysis
Year Americas Asia Europe Africa Oceania Others
FY09 28.8% 21.5% 31.6% 16.9% 1.1% 0.1%
FY10 31.6% 22.8% 27.3% 16.7% 1.5% 0.1%
FY11 32.5% 20.9% 27.0% 18.0% 1.5% 0.1%
FY12 33.6% 20.0% 26.4% 17.9% 1.7% 0.3%
FY13 34.3% 19.8% 25.5% 18.4% 1.6% 0.4%
CAGR
(FY09–13)
23.6% 15.9% 12.2% 21.1% 30.0% 71.9%

1.7
2.4� China has overtaken India as the main source of APIs for other
2.9
4.6
FY09 FY10 FY11 FY12
IMPORTS
(USD billion)
India imported APIs and intermediates at increased CAGR of 39.3% during FY09–12;
China has been its main source region
� Active pharmaceutical ingredients (APIs) and intermediates worth
USD4.6 billion were imported in FY12.
� The sector has been mainly importing from China as it provides low-
cost products which help the Indian formulation manufacturers to
mitigate rising production cost and increasing pressure on margins.
countries as well due to planned and sustained support from its
government in terms of infrastructure, subsidies, cheap
power, transportation, dedicated capacities in voluminous
manufacturing, effluent treatment facilities, industry-friendly labor
laws, etc.
CAGR FY09–12: 39.3%
Source: DGCI&S, Kolkata; Department of Pharmaceuticals annual report 2011–12; Business Standard; The Economic Times; Aranca analysis
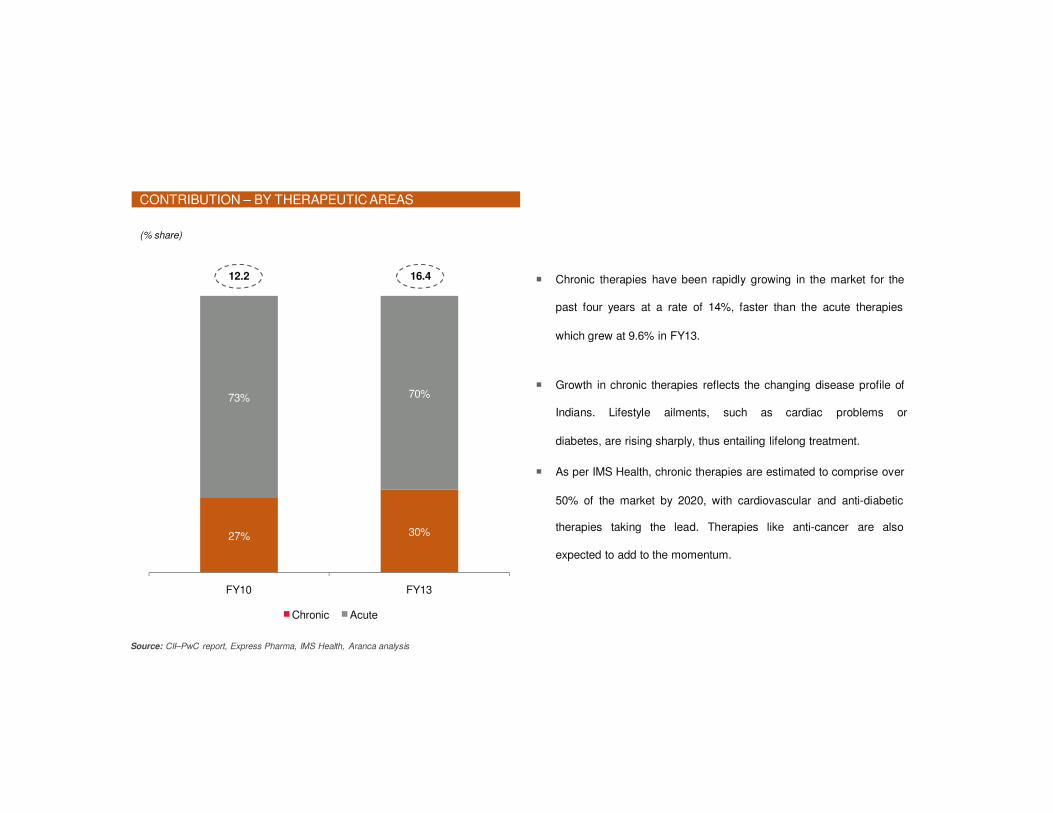
CONTRIBUTION – BY THERAPEUTIC AREAS
(% share)
Contribution by acute therapies decreased from FY10 to FY13 while that of chronic
therapies has risen during the same period
� Chronic therapies have been rapidly growing in the market for the
past four years at a rate of 14%, faster than the acute therapies
which grew at 9.6% in FY13.
� Growth in chronic therapies reflects the changing disease profile of
Indians. Lifestyle ailments, such as cardiac problems or
diabetes, are rising sharply, thus entailing lifelong treatment.
� As per IMS Health, chronic therapies are estimated to comprise over
50% of the market by 2020, with cardiovascular and anti-diabetic
therapies taking the lead. Therapies like anti-cancer are also
expected to add to the momentum.
27% 30%
73% 70%
FY10 FY13
Chronic Acute
12.2 16.4
Source: CII–PwC report, Express Pharma, IMS Health, Aranca analysis
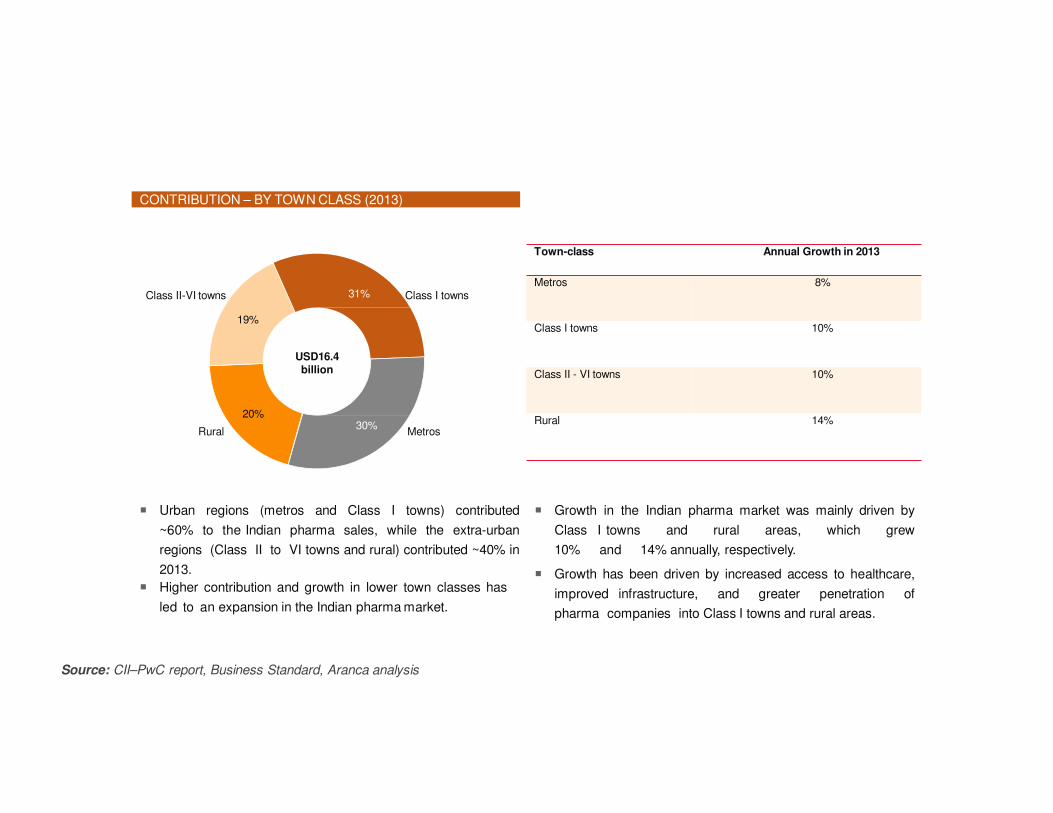
31%
Source: CII–PwC report, Business Standard, Aranca analysis
30%
19%
USD16.4billion
20%
CONTRIBUTION – BY TOWN CLASS (2013)
Metros and Class I towns account for a majority share (~60%) of the Indian pharma
market; rural areas have witnessed the highest growth in contribution
MetrosRural
Class II-VI towns Class I towns
� Urban regions (metros and Class I towns) contributed
~60% to the Indian pharma sales, while the extra-urban
regions (Class II to VI towns and rural) contributed ~40% in
2013.
� Higher contribution and growth in lower town classes has
led to an expansion in the Indian pharma market.
� Growth in the Indian pharma market was mainly driven by
Class I towns and rural areas, which grew
10% and 14% annually, respectively.
� Growth has been driven by increased access to healthcare,
improved infrastructure, and greater penetration of
pharma companies into Class I towns and rural areas.
Town-class Annual Growth in 2013
Metros 8%
Class I towns 10%
Class II - VI towns 10%
Rural 14%

GLOBAL BIOLOGICS SPENDING BIOLOGICS – SHARE OF SALES BY REGION (2012)
� According to IMS Health forecasts, the global biologics market is estimated to grow to USD250 billion by 2020 from USD169 billion in 2012.
� Biosimilars and non-original biologics would represent 4–10% (USD10–25 billion) of the market by 2020, depending on the number of new
biosimilars introduced, especially in the US.
� The global biologics market is largely driven by mature markets. The US constituted approximately 49%, while the European Union (EU) accounted for
approximately 22% of the market in 2012.
� The pharmerging markets accounted for only approximately 8% share.
(USD billion)
Global biologics market is estimated to expand at 5% CAGR to USD250 billion during
2012–20
2007 2012
Biosimilars/Non-Original Biologics
2020
Other Biologics
48.6%
7.5%21.6%
13.2%
9.1%
Pharmerging (Includes
Brazil, Russia, India, China, an d Mexico, Turkey, among
others)
European Union (EU)
Rest of World (ROW)
US
USD169billion
106
169
250
105.4
Source: IMS Health, MIDAS, MAT Dec 2012; Aranca analysis
166.5
225–239
0.6 2.5 10–25
Japan

Strengths Weaknesses Opportunities Threats
•Low cost of skilled
manpower
•Access to large pool of
highly trained scientists
•Strong marketing and
distribution network
•Proven track record in
design of high technology
manufacturing devices
•Low cost of innovation,
manufacturing and
operations
•Higher GDP growth leading
to increased disposable
income in the hands of
general public and their
positive attitude towards
spending on healthcare
•Stringent pricing
regulations
•Poor transport and medical
infrastructure
•Lack of data protection
•Very competitive
environment
•Poor health insurance
coverage
•Production of low quality
drugs tarnishes image of
industry abroad
•Low investment in
innovative R&D
•Increase in per capita
income
•Global demand for
generics rising
•Increasing population with
more sedentary lifestyle
•Increasing health
insurance sector
•Significant investment
from MNCs
•Medical tourism
•Cheap, diverse clinical
trials
•Global outsourcing hub
due to low cost of skilled
labor
•Other low cost countries
affecting demand
•Government regulations
changing
•Expanding of Drugs Price
Control Order
•Lack of investment in
infrastructure
•Wage inflation
•R&D restricted by lack of
animal testing and
outdated patient office
•Counterfeiting threat
SWOT Analysis Of Indian Pharmaceutical Industry

Indian pharma sector is highly fragmented; domestic players account for a lion‟s share
KEY PLAYERS IN THE INDIAN PHARMA SECTOR
73%
27%
Cipla
Ranbaxy
Dr. Reddy‟s
GlaxoSmithKline
Market share for 2013Key International Players
Key Domestic Players
Sun Pharma
Lupin Limited
Abbott Laboratories
GlaxoSmithKline
Pfizer
Source: Company websites, The Economic Times, Aranca analysis, PwC report
� Currently, Abbott Laboratories leads the
market in therapies with a 6.5% share.
� With Sun Pharma’s acquiring Ranbaxy in
2014, market share of Indian companies is
forecasted to increase to 77% from the
current 73%.
� The combined entity is estimated to replace
Abbott Laboratories’ market share by
holding a combined market share of ~9.3%.
Indian
companies
Multinational
Corporations


Key Recent Trends In Pharma Industries
Acquisition and MergerSo the question arises what these terms actually mean.
• A merger is said to occur when 2 or more companies combine to form a singlecompany. A very well known example is Glaxosmithkline(By merging ofGlaxoWellcome and Smithkline Beecham)
• Acquisition may be defined as an act of acquiring effective control by one companyover assets and management of other company. A recent is example of acquisition ofRanbaxy by Sun pharma
• Mergers and Acquisitions (M&A) seem to be the flavor of the season. Sun Pharmatook over Ranbaxy and Bayer acquired Merck's consumer healthcare business. Thefirst was the $3.2 billion deal in early April, by which Sun Pharma acquired Ranbaxy,making the combined entity the fifth-largest generics company in the world and thelargest in India. Sun Pharma had made 16 other acquisitions before, but this dealwas larger than all of them put together. Another one was the realignment ofbusiness interests by Novartis and GlaxoSmithKline (GSK) in late April, by whichNovartis sold almost its entire vaccine business to GSK, while buying up the latter'soncology drugs business

Source: Company websites, Grant Thornton, Business Standard, Thomson Banker, Aranca research Note: Only key deals for 2013 & 2014 mentioned
USD3.2 billion
2014
Acquires
The combined entity would be
India’s largest pharma company
and world’s fifth largest generic
drugs maker
NA
2014
Acquires
The acquisition helps Lupin
expand into the Latin American
market and build its global
specialty business
USD321.6 million
2013
Acquires
The transaction would
strengthen Torrent’s position in
the women healthcare, pain
management and
vitamins/nutrition segments
USD512 million
2013
Acquires
The deal with Medpro would
help Cipla to strengthen its
African operations
The acquisition would
strengthen Mylan’s global
injectables platform and create
a global injectables leader
USD 1.75 billion
2013
Acquires
2013
Acquires
Finoso would become Vivimed’s
research and development unit
to support innovators, generics
and licensing efforts
NA
2013
Acquires
With Indchem’s excellent
customer service and technical
support, IMCD would be able to
further strengthen its presence
in the Indian market
Recent Major Acquisition And Mergers
USD 2.8 million

Why India??• The answer to which is very simple. It is because Indian companies have strengths that are
hard to ignore for any global player seeking scale. India ranks very high in the third world, interms of technology, quality and range of medicines manufactured. From simple headachepills to sophisticated antibiotics and complex cardiac compounds, almost every type ofmedicine is now made indigenously. Playing a key role in promoting and sustainingdevelopment in the vital field of medicines,
• As the global blockbuster boom of the 1980s and 1990s ran out of steam and patentexpiries started accelerating, big pharma has been forced to cut down on inefficiencies andfocus on core competencies. Hence, there has been (and will continue to be) significantconsolidation in the global pharma industry. The pharma industry globally is going througha challenging time with increasing public scrutiny and immense pressure on pricing. Againstthe backdrop of subdued growth in developed markets such as the US and the Europe,pharma emerging markets continue to show a robust growth. Two categories of companieswould drive out the benefits .The first category would consist of Indian companies whohave low-cost and world-class R&D as well as manufacturing capabilities, such thatpotential bidders can leverage the Indian infrastructure as global (or regional) supply bases.The second category would consist of companies who have market-leading positions in thedomestic branded formulations market, in high-growth chronic specialties like cardiology,endocrinology, chronic pain, chronic respiratory and oncology

A Market dominated by Branded generics• In the global context, IMS Health, which began tracking and reporting on branded generics in 2002, defines
the category as including “prescription products that are either novel dosage forms of off-patent productsproduced by a manufacturer that is not the originator of the molecule, or a molecule copy of an off-patentproduct with a trade name.” This definition is used by both the United States of America’s Food and DrugAdministration (FDA) and the United Kingdom’s National Health Service (NHS). It does not include authorizedgenerics, which are drugs made by or under license from the innovator company and sold without a brand name.
• In India, any non patented molecule with a brand name other than the innovator’s name is termed as a brandedgeneric. Chemically, branded generics are identical, or bioequivalent to innovator drugs. It is the share of voicethe brand commands by getting repeatedly prescribed by the physicians, due to some degree of recall andpreference over the other brands. In the global context, substitution – whenan innovator product goes off-patent - is the key driver for generics. In India, it’s about driving a difference using the core equity of a brand,over a competitor’s product.
Patented Product• The market size for patented drugs as of today is very small. Only about 1-2% of the market is
made up of patented drugs, which are being sold by multinational innovators. There are multiple Indian companies that have drugs in the pipeline, with a greater focus on R&D, but estimates suggest that it would be at least 7 to 10 years before these begin to have a serious impact on the industry. Industry experts believe that the current size of the patented drug market is estimated at US$120-130 million. Due to weak patent laws in the past, and multiple, cheap generic versions of drugs present in the market, multinational players were hesitant to introduce their patented products. In the future, with growing affordability, deepening of health insurance and steady improvement in Intellectual Property Rights (IPR), patented product launches should increase.
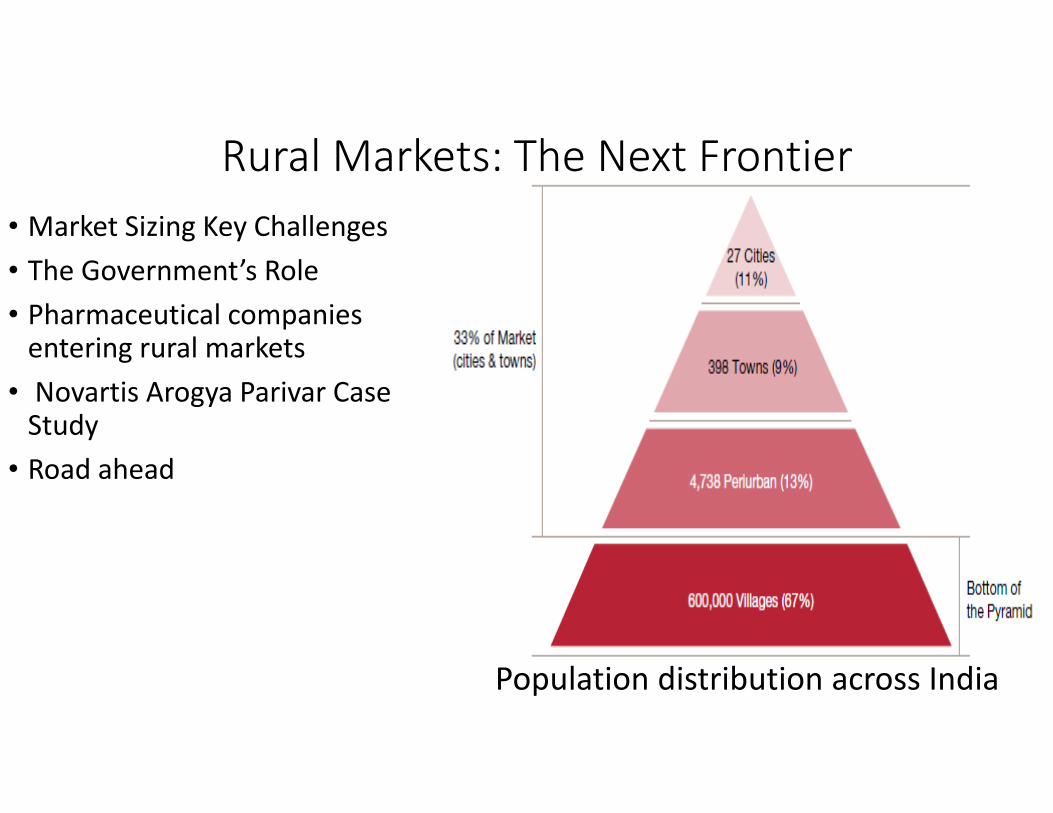
Rural Markets: The Next Frontier
• Market Sizing Key Challenges
• The Government’s Role
• Pharmaceutical companies entering rural markets
• Novartis Arogya Parivar Case Study
• Road ahead
Population distribution across India

Market Sizing• Majority of the Pharma market’s growth is
driven by the urban markets, that is, areas thatare classified as metros or tier I cities . Tier II totier VI is classified as peri urban, while rural isthe bottom of the pyramid, which constitutes67% of India’s population (600,000 villages). Asper IMS Health, peri-urban markets account for38% of total industry sales, being valued atUS$3.4 billion, while, rural markets account for17% of total industry sales, being valued atUS$2 billion, in 2010.
• PwC estimates that over the next ten years,rural markets will grow at a CAGR ranging froma conservative 15% to an aggressive 20%,reaching an expected valuation of betweenUS$8 billion and US$12 billion, depending onthe implementation of growth drivers
• The Opportunity
Around 742 million people reside in rural areas. There is a significant gap between the number of people residing in villages that require treatment, and quality treatment and medicines reaching these villages. Accessibility of medication in rural areas is very poor, with less than 20% of the population having access. This gap represents a huge opportunity for pharmaceutical companies to expand, and we believe that these markets will be the future volume drivers of the industry

Key Challenges of the Rural Market• Low government spend on healthcare
India has a low level of government spending on healthcare, at 1% of the GDP, putting the country in the lowest 20% of those that contribute significantly low levels of public spending to health. Business Monitor International reported that healthcare expenditure in India increased from US$49.7 billion to US$86.9 billion between 2009 and 2014, a rise of 75%.
• Poor Infrastructure
Healthcare infrastructure is poor, compared to urban areas. The doctor patient ratio in rural areas is 1:20,000, versus the urban ratio of 1:2000 [India requires 600,000 doctors in order to meet the statutory 1:250 ratio that is a World Health Organization (WHO) norm]. Doctors are not qualified, as most of them in villages have Bachelor of Health Sciences (BHS) & Bachelor of Ayurvedic Medicine and Surgery (BAMS) degrees. The quality and availability of medicines in rural areas is dubious, as there are many cases of counterfeiting and spurious drugs that have been exposed. Majority of the patients earn a basic daily wage, and affordability is very low.
• Limited affordability
Healthcare is a low priority when it comes to income allocation, with average consumer expenditure on healthcare at just 7%.(6) 80% of the rural population is on a daily wage, income levels are as low as <US$1.78 per day.
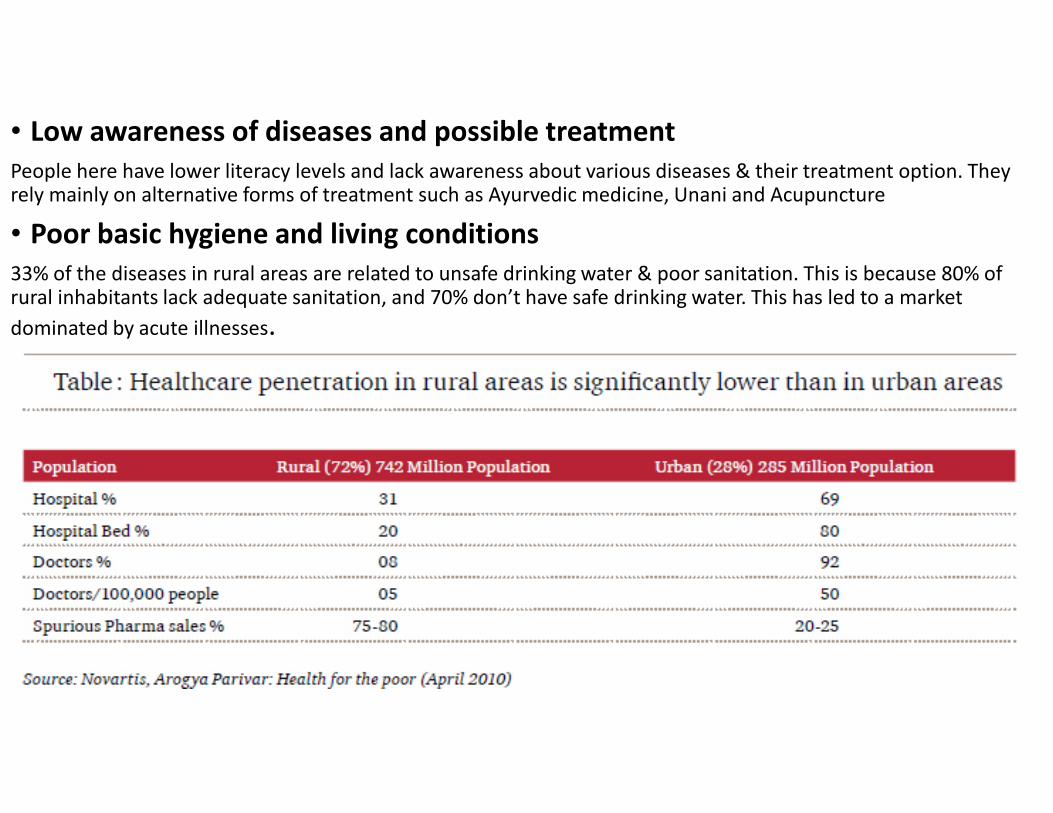
• Low awareness of diseases and possible treatment
People here have lower literacy levels and lack awareness about various diseases & their treatment option. They rely mainly on alternative forms of treatment such as Ayurvedic medicine, Unani and Acupuncture
• Poor basic hygiene and living conditions
33% of the diseases in rural areas are related to unsafe drinking water & poor sanitation. This is because 80% of rural inhabitants lack adequate sanitation, and 70% don’t have safe drinking water. This has led to a market
dominated by acute illnesses.
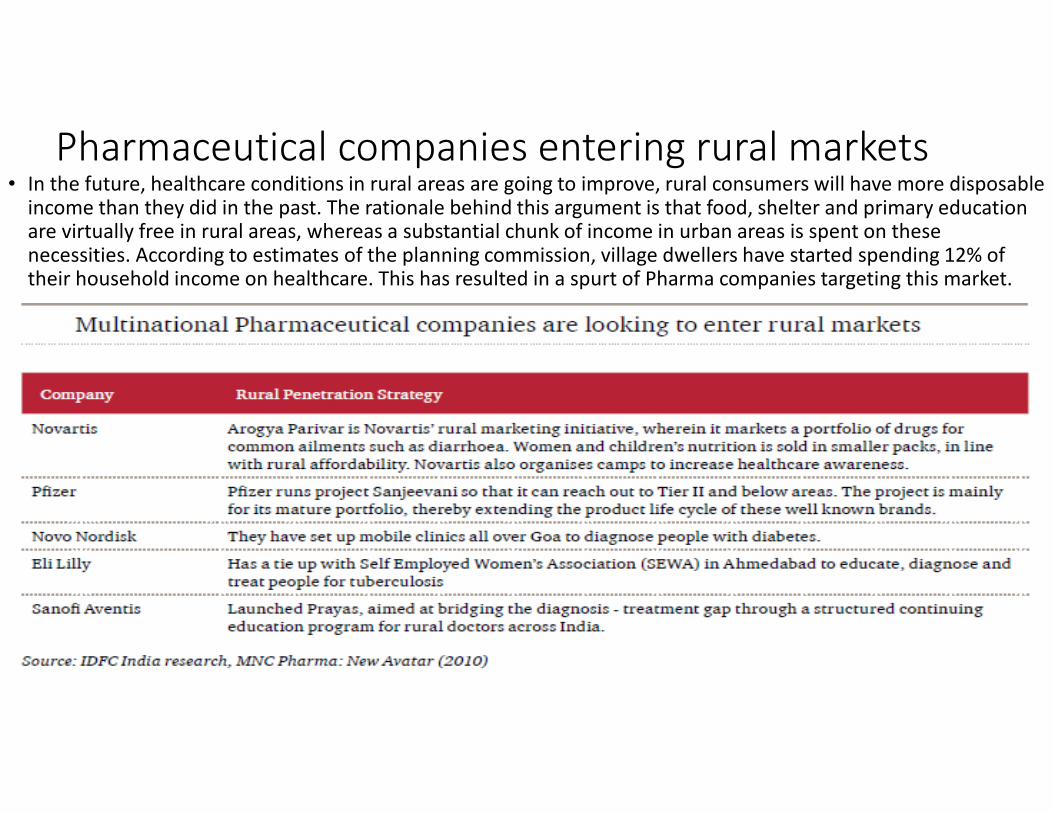
Pharmaceutical companies entering rural markets• In the future, healthcare conditions in rural areas are going to improve, rural consumers will have more disposable
income than they did in the past. The rationale behind this argument is that food, shelter and primary education are virtually free in rural areas, whereas a substantial chunk of income in urban areas is spent on these necessities. According to estimates of the planning commission, village dwellers have started spending 12% of their household income on healthcare. This has resulted in a spurt of Pharma companies targeting this market.

Novartis Arogya Parivar Case StudyArogya Parivar is a social innovation to improve healthcare for the poor in rural areas by promoting disease prevention through a healthy lifestyle and laying focus on Community Education & not ‘sell-in’ to stockists. It also aims to form partnerships with NGOs & healthcare companies to implement a complete healthcare program.Works
on 4 principles: Arogya uses the 4 A’s: awareness, affordability, availability (access), and adaptibility.
Awareness
Community Education meetings
Physician knowledge sharing [BAMS/BHMS]
Adaptability
Rural specific solutions [oral rehydration
solutions (ORS)/Zinc]
Vernacular communication [local
dialect]
Availability
Linkages to city supply points
Mobile Health camps
Affordability
Custom small packs
Arogya Parivar’s Business model

2004 2014
Source: Sun Pharma website
Among thetopfive
Indian pharma
companies
Strong presencein
generics market
Over half thesales fromNorth America
Market capitalisation of USD15.1billion
Revenuebaseof about
USD1.7 billion
Commencedoperations in
Calcutta
Nationwidemarketing
operations rolledout
Built thefirst APIplant
Firstinternationalacquisition:
NicheBrand intheUS
AcquiredRanbaxy for $3..2
bn
Organicgrowthphase
All-Indiaoperations begin
Focuson R&D
Acquisitions acrosstheglobe
1983 1987 1995
256 approvedproducts and 391filed for approval
23 manufacturingsites worldwide
Sun Pharma: Leveraging its genericmarket capabilities
44%
15%
41% USD1.4billion
India
US
Rest of the World
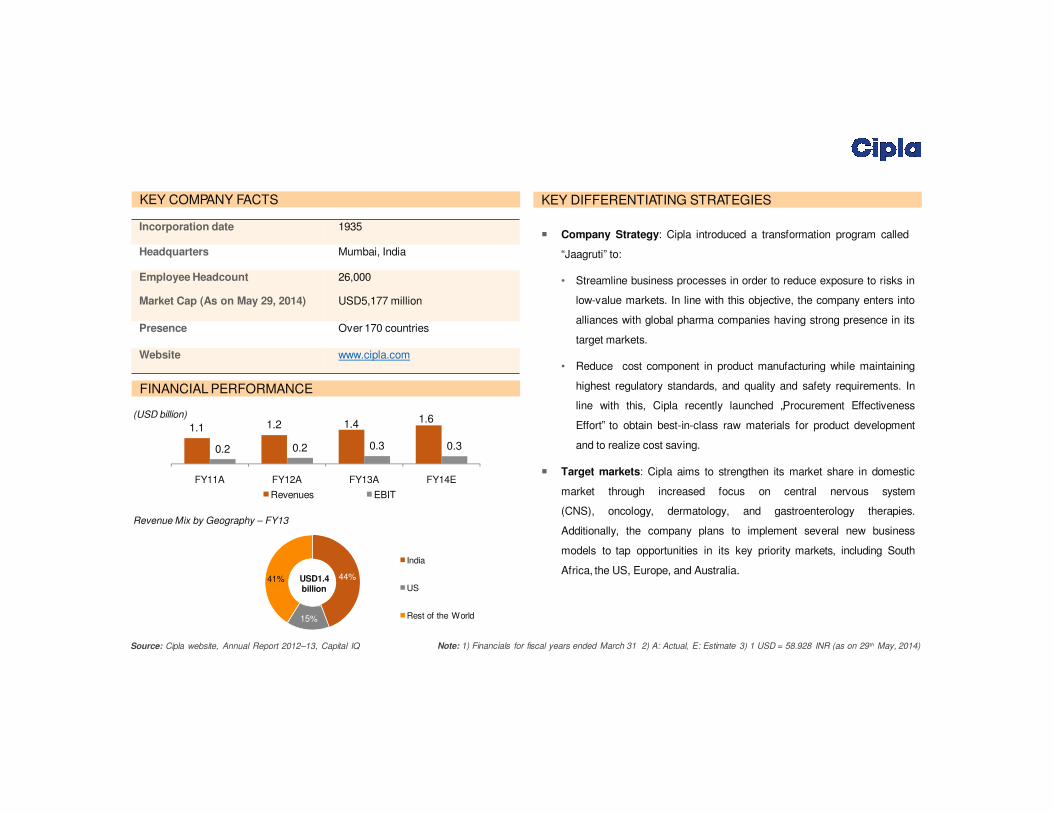
Case Study 1: Cipla Limited
Source: Cipla website, Annual Report 2012–13, Capital IQ
1.1 1.2 1.4
0.2 0.2 0.3 0.3
FY11A FY12A
Revenues
FY13A
EBIT
FY14E
(USD billion)
KEY COMPANY FACTS
FINANCIAL PERFORMANCE
KEY DIFFERENTIATING STRATEGIES
� Company Strategy: Cipla introduced a transformation program called
“Jaagruti” to:
• Streamline business processes in order to reduce exposure to risks in
low-value markets. In line with this objective, the company enters into
alliances with global pharma companies having strong presence in its
target markets.
• Reduce cost component in product manufacturing while maintaining
highest regulatory standards, and quality and safety requirements. In
line with this, Cipla recently launched „Procurement Effectiveness
Effort‟ to obtain best-in-class raw materials for product development
and to realize cost saving.
� Target markets: Cipla aims to strengthen its market share in domestic
market through increased focus on central nervous system
(CNS), oncology, dermatology, and gastroenterology therapies.
Additionally, the company plans to implement several new business
models to tap opportunities in its key priority markets, including South
Africa, the US, Europe, and Australia.
Revenue Mix by Geography – FY13
1.6
Note: 1) Financials for fiscal years ended March 31 2) A: Actual, E: Estimate 3) 1 USD = 58.928 INR (as on 29th May, 2014)
Incorporation date 1935
Headquarters Mumbai, India
Employee Headcount 26,000
Market Cap (As on May 29, 2014) USD5,177 million
Presence Over 170 countries
Website www.cipla.com

27%
39%
14%
20%India
US
Japan
Others
Case Study 2: Lupin Limited
Source: Lupin website, Annual Report 2012–13, Capital IQ
(USD billion)
KEY COMPANY FACTS
FINANCIAL PERFORMANCE
KEY DIFFERENTIATING STRATEGIES
� Competitive advantage: Lupin positions itself in the global pharma
market by leveraging opportunities in new markets, new therapies, new
businesses, and product mix. This has enabled the company to gain
competitive advantage over peers with singular focus market.
� Focus on innovative offerings: Lupin strives to offer innovative
products through R&D investments. The company‟s capacity to invest in
innovations and ability to remain invested for a long period of time
differentiates it from competitors.
licensing products and entering into strategic alliances with leading
product portfolio as well as tap the unaddressed demand.
� Creation of sales force: Lupin is committed to create and develop a
specialty product marketing and sales team with talented and
experienced professionals. This would enable the company to cater to
the complex needs of niche markets.
� Leveraging geographic reach: Lupin has combined the benefits of its
nationwide presence with a short mind-to-market cycle, enabling the
company to operate locally as well as benefit from local opportunities in
global markets.
Revenue Mix by Geography – FY14
USD 1.9
billion
1.0 1.2
0.2 0.2 0.3 0.5
FY11A FY12A
Revenues
FY13A
EBIT
FY14A
Note: 1) Financials for fiscal years ended March 31 2) A: Actual 3) 1 USD = 58.928 INR (as on 29th May, 2014)
1.91.6
Incorporation date 1968
Headquarters Mumbai, India
Employee Headcount 12,710
Market Cap (As on May 29, 2014) USD7,079 million
Presence Global
Website www.lupinworld.com
Source: Sun Pharma annual report 2013, PwC report, Aranca research
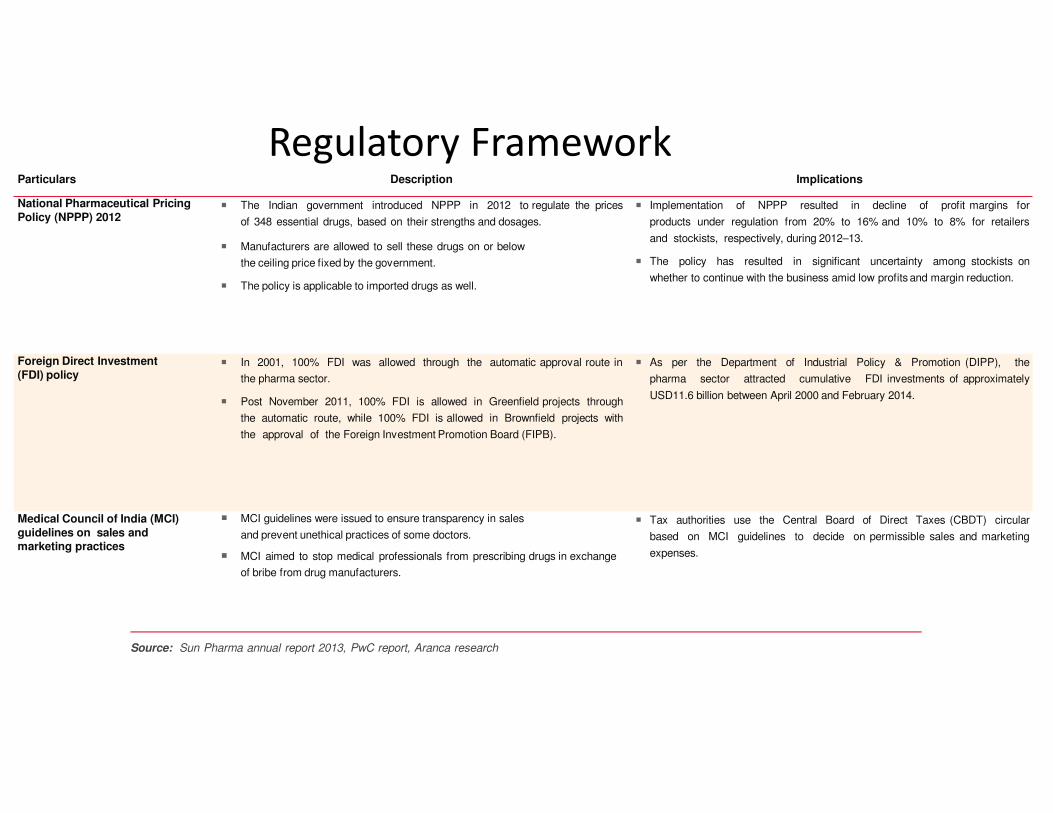
Particulars Description Implications
National Pharmaceutical Pricing
Policy (NPPP) 2012� The Indian government introduced NPPP in 2012 to regulate the prices
of 348 essential drugs, based on their strengths and dosages.
� Manufacturers are allowed to sell these drugs on or below
the ceiling price fixed by the government.
� The policy is applicable to imported drugs as well.
� Implementation of NPPP resulted in decline of profit margins for
products under regulation from 20% to 16% and 10% to 8% for retailers
and stockists, respectively, during 2012–13.
� The policy has resulted in significant uncertainty among stockists on
whether to continue with the business amid low profits and margin reduction.
Foreign Direct Investment
(FDI) policy� In 2001, 100% FDI was allowed through the automatic approval route in
the pharma sector.
� Post November 2011, 100% FDI is allowed in Greenfield projects through
the automatic route, while 100% FDI is allowed in Brownfield projects with
the approval of the Foreign Investment Promotion Board (FIPB).
� As per the Department of Industrial Policy & Promotion (DIPP), the
pharma sector attracted cumulative FDI investments of approximately
USD11.6 billion between April 2000 and February 2014.
Medical Council of India (MCI)
guidelines on sales andmarketing practices
� MCI guidelines were issued to ensure transparency in sales
and prevent unethical practices of some doctors.
� MCI aimed to stop medical professionals from prescribing drugs in exchange
of bribe from drug manufacturers.
� Tax authorities use the Central Board of Direct Taxes (CBDT) circular
based on MCI guidelines to decide on permissible sales and marketing
expenses.
Regulatory Framework

…in addition to DoP uniform code, compulsory licensing, and clinical trial regulationsParticulars Description Implications
Department of Pharmaceuticals
(DoP) uniform code on sales and marketing
� In 2011, DoP laid down a code of marketing practices for the pharma sector to
streamline marketing efforts.
� The DoP code lays down guidelines for exaggerated claims; audiovisual
promotions; activities of medical representatives; and provision of samples,
gifts, hospitality, and sponsorships by pharma companies.
� The adoption of DoP code is voluntary. However, in recent times, the pharma
sector has agreed to enforce the code.
� DoP would review its implementation and after a set interval of time if it
is discovered that the code has not been implemented by pharma
associations or companies, it would consider making it a statutory code.
Compulsory licensing � India has adopted compulsory licensing on the following grounds under
Section 84 of the Indian Patent Act: (1) the drug did not meet reasonable
requirements of the citizens,
(2) the drug was not reasonably priced, and (3) the patent was not locally
manufactured.
� The imposition of this regulation paved way for production of low-cost generic
medicines of the branded patent drugs. Thus, costly, branded life saving drugs
are available at a cheaper rates to the Indian population.
� The regulation affects the brand value of branded drugs manufactured by
MNCs, and thus has been opposed by them.
Clinical trial regulations � As per new regulations introduced in 2013, all clinical trials need to be
approved by a government committee and at least half of each trial needs to
be run in a government-run hospital.
� Pharma companies need to have the videotaped consent of each test subject.
� Stringent regulations increase the duration of the approval process; hence, the
number of clinical trials has dropped to 19 in 2013 from 500 in 2011.
� It also has projected India as a less favorable option to conduct clinical
trials.

Biosimilars in India are regulated by Central Drugs Standard Control Organization and
Department of BiotechnologyParticulars Description Implications
Biosimilar Guidelines � The “Guidelines on Similar Biologics” prepared by Central Drugs Standard
Control Organization and Department of Biotechnology in 2012 laid down the
regulatory pathway for a biologic claiming to be similar to an already authorized
reference biologic.
� The guidelines address the regulatory pathway regarding manufacturing
process and quality aspects for similar biologics.
� These guidelines also address the pre-market regulatory requirements
including comparability exercise for quality, preclinical and clinical studies, and
post-market regulatory requirements for similar biologics.
� The new guideline creates a pathway for local and international
companies to invest in biosimilar development with manufacturing in India.
� The introduction of a similar biologic or biosimilar into the market would result
in significant reduction in costs.
� This introduction would also help address local patients‟ access to expensive
drugs.

Reduction in approvaltimefor new facilities
• Steps taken toreduceapproval timefor new facilities
• NOCfor export license issued in twoweeks comparedto 12 weeks earlier
Collaborations• MOUs with USFDA, WHO,Health Canada, etc. to boost growth of the Indian
Pharmasector by benefitingfromtheir expertise
Support fortechnology upgrades
and FDIs
• Zeroduty for technology upgrades in the pharmaceutical sector through the
Export Promotion Capital Goods (EPCG)Scheme
• Government is planningto relax FDI norms in the pharmaceuticals sector
Industryinfrastructure
• Government of Indiaplans to set upaUSD640 million VCfund to boost drug
discoveryand strengthenthe pharmainfrastructure
Pharmavision 2020• PharmaVision 2020 by the government’s Department of Pharmaceuticals aims to
makeIndiaamajor hubfor end-to-enddrugdiscovery
Notes: NOC- No objection certificate; VC - Venture CapitalMOU - Memorandum of Understanding
Favourable policy measures supportgrowth
Favourable Policy Measures Support Growth
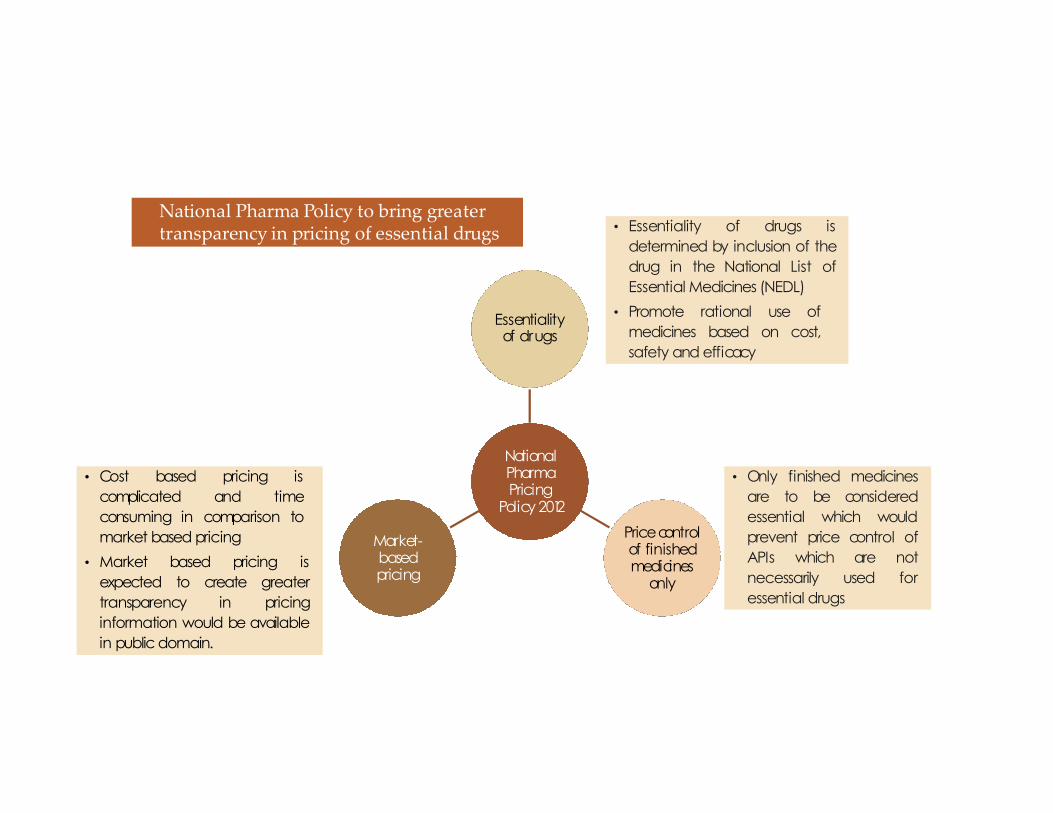
NationalPharmaPricing
Policy 2012
Essentialityof drugs
Pricecontrolof finishedmedicines
only
Market-basedpricing
• Cost based pricing is
complicated and time
consuming in comparison to
market based pricing
• Market based pricing is
expected to create greater
transparency in pricing
information would be available
in public domain.
• Essentiality of drugs is
determined by inclusion of the
drug in the National List of
Essential Medicines (NEDL)
• Promote rational use of
medicines based on cost,
safety and efficacy
• Only finished medicines
are to be considered
essential which would
prevent price control of
APIs which are not
necessarily used for
essential drugs
National Pharma Policy to bring greatertransparency in pricing of essential drugs
Challenges• Price Control
Price controls are broadly cited as the most critical challenge thatcompanies face in the Indian market. India is one of the mostprice-controlled markets in the world, as under the DPCO, pricesand margins are monitored carefully. The DPCO is beingsupervised by the NPPA. There were originally 347 pricecontrolled drugs included in 1979, which were then reduced to143 in 1987 (35) and currently, there are 76 bulk drugs under theDPCO.(36) Price controlled drugs are essential medicines, such asantibiotics and painkillers, and drugs used for the treatment ofdiseases such as cancer and asthma. Such medicines contain bulkdrugs, or raw materials, whose prices are controlled by the NPPA- manufacturers cannot hike prices on their own. However, 90%of drugs are currently outside of any price controls in India.Consumer organizations maintain their stance of urging thegovernment to continue to expand the umbrella of the DPCO,but the industry believes that there is enough competition for theprices to be modulated by the market itself. They believe thatprice caps would inhibit the development of R&D in the countryas companies would be less inclined to invest in R&D without thepossibility of high returns.
• Infrastructure
Infrastructure has always beenmentioned as a barrier to growth of thePharma industry in India. Poor energyand transport infrastructure hastraditionally posed a problem forcompanies. Some areas lack basic hotelfacilities, preventing reach andpenetration. With the governmentgradually increasing investment ininfrastructure, the situation isimproving, but it is still seen as aninvestment opportunity in India
• CounterfeitingCounterfeiting of drugs has been a major issue in the Indian Pharma space. The inherent nature of the Indian market makes it difficult for asystematic study that quantifies the extent of counterfeiting, to be carried out. There have been multiple reports suggesting various figures as therate of counterfeiting. A good indicator may be a large scale survey that was published in December 2009 by the health ministry that reportedthat spurious drug prevalence is much lower than otherwise suggested. The report found that only 0.046% of all medicines sold containedevidence of being spurious. This is in contrast to other reports, for example one conducted by the International Pharmaceutical Federation andfinanced by the WHO that said 3.1% of all drugs sold in India were spurious. These reports suggesting lower numbers than earlier ones may beencouraging, but leading players are still weary of the threat of spurious drugs. Steps taken by the industry to counter the threat of counterfeitinginclude investing in innovative packaging, using authenticity markers and sponsoring programmes to increase awareness amongst patients andhealthcare workers. The Organization of Pharmaceutical Producers of India (OPPI) has also carried out various initiatives to combat the situationlike organizing seminars and working with the Ministry of Health towards the development of policies against spurious drugs.
• LabourThere is an increasing concern in the domestic industry regarding a shortage of skilled labour in critical areas. This causes a demand-supplyimbalance, and has led to an increased rate of wage inflation
• Intellectual PropertyIndia has accepted and made a commitment to the Trade-Related Aspects of Intellectual Property Rights (TRIPS) in 1995, and keepingwith this commitment, implemented the Patent (Amendment) Act in 2005. Although this act does not apply for drugs patented before1995, it is a major step forward on the earlier patent scenario. Since then, recommendations have been made to the governmentregarding improvement and expansion of the Patent (Amendment) Act, by the Satwant Reddy committee and the Mashelkar report.These reports highlighted the need for data exclusivity and the prevention of ‘evergreening’. Domestic and global Pharma companies areshowing an increased confidence in the patent laws, and we expect an increase in the number of launches of patented products in theIndian market in the future. Resolution of data exclusivity laws and capacity building at patent offices will help in increasing confidenceamong foreign companies

India and USFDA(U.S. Food and Drug Administration)
• Since 2013 USFDA has banned 27 Indian units for violations. This year till now, USFDAhas already crackdown on 7 manufacturing units, the big name in the list being SunPharma’s 2 units Kharkadi plant and Halol plant in Gujarat and IPCA laboratoriesRatlam(API Division).Talking to a senior official at Ipca Laboratories said that the thiswould have impact on the company's formulations export business to the US marketsince it's formulations manufacturing units situated at Silvassa and SEZ Indore use theAPls manufactured from the Ratlam facility for manufacturing formulations for theAmerican market.
• Units of Ranbaxy Laboratories Ltd(Poanta Sahib in Himachal Pradesh and Dewas inMadhya Pradesh in 2009) and Wockhardt Ltd(Aurangabad Unit in 2013), were barredfrom exporting to the US.
• And one consistent problem that USFDA has been finding at almost all of the units isthat of data integrity, where USFDA has found instances of faking data, incompleterecords, retesting to match results. Experts say there is a need for Indianmanufacturers to keenly resolve these issues as even other regulators are likely totake a closer look at data integrity, besides GMP, in future
So is it that USFDA hates India!!!The answer is a straight no.• A closer look will reveal that it is not just Indian drug majors that are under the
US FDA scanner ,warning letters about violations have been sent out to drugcompanies in Australia, Canada, China, Austria, Germany, Netherlands, Ireland,and Spain
• In fact, the regulator has doled out the largest number of warning letters tohome-grown pharma companies; 114 US-based pharma companies were servedwith warnings and censured for marketing-related offences and nine for faultymanufacturing processes.
• Stating that the cost of compliance of Indian pharma companies has doubledover the past five years, the report noted that drug companies would have toinvest to ensure that compliance processes were up to speed. The large Indiandrug makers had the ability to bear the increased cost of compliance as well asthe financial flexibility to do so, and would continue to remain competitive inthe US market.

Lifestyle-related ailments, urbanization, and increasing health insurance are key drivers;
price control, low clinical trials, and fragmented supply chain are key concerns
Source: Sun Pharma Annual Report 2013, PwC, McKinsey & Company, Deloitte, Aranca research
KEY GROWTH ENGINES
� Changing disease profile and favorable demographics
• Change in patient demographics and increased lifestyle-related ailments are
likely to boost demand for quality and affordable drugs.
• Indian population‟s lifestyle has changed over the years due to socio-economic
factors and growing urbanization. This has led an increase in lifestyle-related
ailments such as obesity, heart disease, stroke, cancer, and diabetes.
• India is estimated to have a patient pool of 20% by 2020 due to ~1.3%
population growth per year and increased disease burden.
� Rapid urbanization
• The Indian pharma sector is poised to benefit from increased contribution from
metros and Class I towns, mainly due to growing urbanization and economic
development.
• According to McKinsey and BNP Paribas‟s estimates, India‟s urbanization is
projected to accelerate at a rate and scale comparable only to China, reaching
40% by 2030.
• Rapid urbanization would lead to growth in India's medical
infrastructure, thereby enabling companies to reach inaccessible and untapped
markets.
� Increasing health insurance coverage
• Increased penetration of health insurance in India is likely to solve the
affordability issue in the Indian pharma sector, thereby boosting demand.
• As of 2013, only 30% of population in India had health insurance coverage; the
remaining70% paid for healthcare expenses from their own savings.
• Health insurance penetration is estimated to reach ~45% by 2020.
KEY GROWTH INHIBITORS
� Drug price control
• The Indian government increased the number of drugs under price control
from 74 to 348 in 2013, thereby adversely impacting retail price of drugs.
• The move is said to have far-reaching implications on branded pharma
manufacturers with patented products rather than generics manufacturers
which are mostly domestic companies already selling products at relatively low
prices.
� Growing concern regarding clinical trials
• Clinical trials play a vital role in drug development. India accounts for less than
2% of global clinical trials.
• Growth in the number of clinical trials in India has been low primarily due to
regulatory uncertainty with regard to the conduct of clinical trials.
• Unethical practices, delay in approvals, corruption, etc., have led pharma
companies to shift their focus from India to other geographies like Malaysia
and East European countries like Poland for clinical trials.
� Fragmented supply chain
• The Indian pharma market is highly fragmented in manufacturing as well as
distribution. This has led to several inefficiencies in the sector.
• Fragmented supply chain leads to ineffective inventory management
systems, resulting in high inventory holding costs, thereby increasing
operating costs.
• On the distribution front, dominance of small chemists leads to lack of
economies of scale and consumers having to pay high prices.
Summing up the Entire Analysis
INDIA‟S COMPETITIVE EDGE
Source: Zephyr Peacock India report, India Ratings & Research report, Aranca research
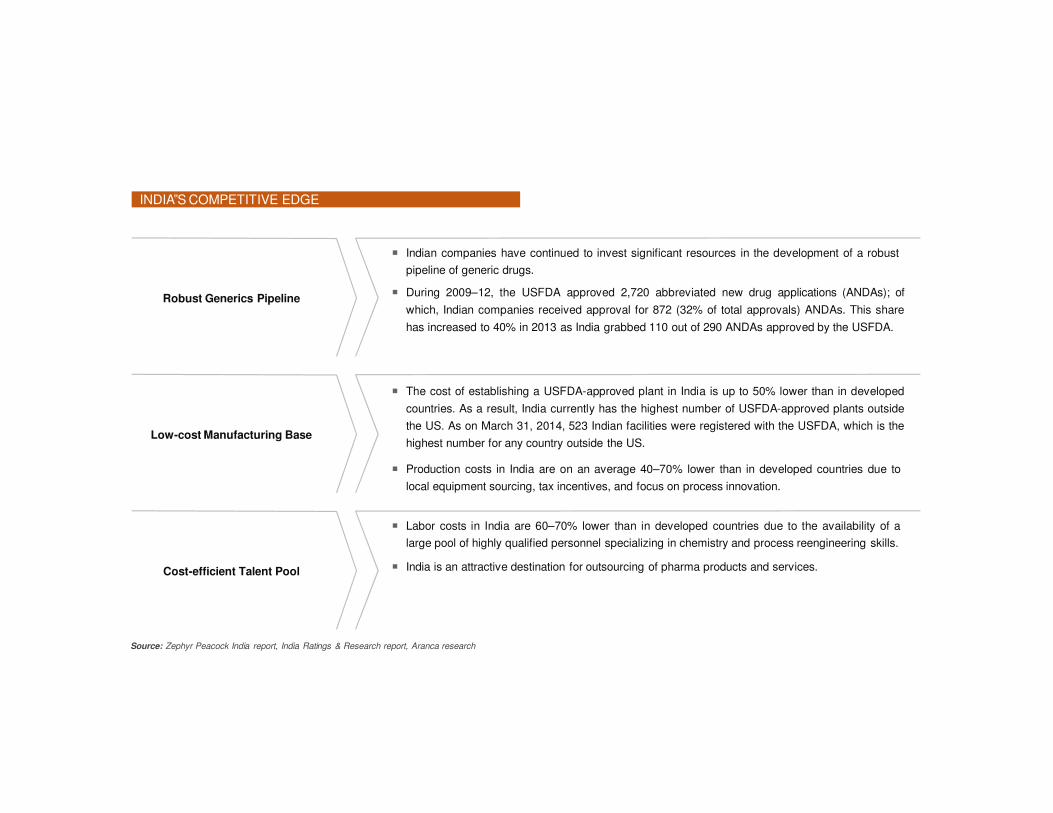
Robust generics pipeline, low cost production, and cost-efficient labor give India‟s
pharma sector a leading edge over peers
Robust Generics Pipeline
� Indian companies have continued to invest significant resources in the development of a robust
pipeline of generic drugs.
� During 2009–12, the USFDA approved 2,720 abbreviated new drug applications (ANDAs); of
which, Indian companies received approval for 872 (32% of total approvals) ANDAs. This share
has increased to 40% in 2013 as India grabbed 110 out of 290 ANDAs approved by the USFDA.
Low-cost Manufacturing Base
� The cost of establishing a USFDA-approved plant in India is up to 50% lower than in developed
countries. As a result, India currently has the highest number of USFDA-approved plants outside
the US. As on March 31, 2014, 523 Indian facilities were registered with the USFDA, which is the
highest number for any country outside the US.
� Production costs in India are on an average 40–70% lower than in developed countries due to
local equipment sourcing, tax incentives, and focus on process innovation.
Cost-efficient Talent Pool
� Labor costs in India are 60–70% lower than in developed countries due to the availability of a
large pool of highly qualified personnel specializing in chemistry and process reengineering skills.
� India is an attractive destination for outsourcing of pharma products and services.

Source: Express Pharma, Aranca research
Rural India
Exports
US
Contract research and manufacturing
services (CRAMS)
Generics
� Generic opportunities in the US would
continue to drive revenue growth for the
Indian pharma companies. This would be
an outcome of:
• sizeable generic opportunity (drugs with
brand value of USD80 billion are expected to
face generic competition) over 2013–15.
• strong product pipeline of pending
ANDAs, with high increasing proportion of
complex generics.
• market share improvement given the
relatively small base (share of leading Indian
companies is less than 10% in the US
generics market).
� Indian pharma companies havecapitalized on exports in regulated
and semi-regulated markets
� Currently India is the third-largestexporter of APIs.
� Indian pharma exports are expectedto grow and developed markets likethe US and Europe would act as the
growth drivers.
� The CRAMS industry is estimated to
generate USD850 millionannually.
� A large number of specialty hospitals with
state-of-the-art facilities, large English
speaking population and rich talent
pool, diverse population and gene
pool, and increasing number of chronic
diseases are expected to boost the
CRAMS industry.
� Pharma companies are shifting focus on rural
markets purely to ramp up volumes.
� Although urban markets are more lucrative and
would continue to be the focus for the
sector, untapped potential of Indian rural
markets is now seen as the next volume driver.
� Generics is opening up a stupendous
opportunity globally.
� The global generic spending is
estimated to increase to USD400–
430 billion by 2016 from USD242
billion in 2011, mainly due to patent
expiries and government efforts to
control healthcare costs across the
world.
� India is expected to become one of
the top three generic drug makers in
the world by 2020.
AttractiveOpportunities
Contract research and manufacturing services, exports, generics, rural India, and the
US market represent lucrative growth opportunities for Indian pharma sector