analysis of asset liability management data of...
TRANSCRIPT

Project trainee: Gujja Prashanth Kumar MBA 3rd semester
School of Management Studies University of Hyderabad
Guide: Dr. V. N. Sastry Professor
IDRBT Hyderabad
Date: 12 July 2012.
ANALYSIS OF
ASSET LIABILITY MANAGEMENT DATA
OF BANKS

Page 2
CERTIFICATE
This is to certify that Mr. Gujja Prashanth Kumar, pursuing MBA 3rd
semester at School of Management Studies (SMS) in University of Hyderabad
has done a project as an intern at the Institute for Development and Research in
Banking Technology (IDRBT), Hyderabad from May 2 to July 9, 2012.
He has completed the project entitled ―Analysis of Asset Liability
Management data of Banks‖ under my guidance. During the course of the
project he has done study of the ALM data of a bank and he has designed a Rule
Based System based on the analysis.
I wish him a bright future.
Dr. V. N. Sastry
(Project Guide)
Professor
IDRBT, Hyderabad.

Page 3
ACKNOWLEDGEMENT
I would like to express my sincere gratitude to the Institute for Development
and Research in Banking Technology (IDRBT) and particularly to Dr. V. N. Sastry,
Professor at IDRBT who was my guide in this project. I would not hesitate to add that
this short stint in IDRBT has added a different facet to my life as this is a unique
organization being a combination of academics, research, technology, communication
services, crucial applications, etc., and at the same time performing roles as an arm of
regulation, spread of technology, facilitator for implementing technology in banking
and non-banking systems.
I am extremely grateful to Dr. V. N. Sastry for his advice, innovative
suggestions and supervision.
I am thankful to University of Hyderabad for giving me this golden opportunity
to work in a high-end research institute. I am thankful for IDRBT for providing such
an amazing platform to work on real application oriented research. Finally, I thank
one and all who made this project successful either directly o r indirectly.
Gujja Prashanth Kumar
MBA 3rd
semester
School of Management Studies
University of Hyderabad
Hyderabad.

Page 4
ABSTRACT
Asset Liability Management (ALM) in banks is not only a regulatory
requirement in India but also an imperative for strategic bank management.
ALM brings to bear a holistic and futuristic perspective to the balance sheet
management. In this project we carried out Gap analysis of ALM data of
Andhra bank in two models and we identified strategies to minimise interest
rate risk and to improve bank net interest income. We designed a rule based
system based on the observation and strategies identified in above two models.

Page 5
CONTENTS
1. INTRODUCTION
1.1 Asset liability management 1.2 Need of ALM in banks 1.3 Market risk 1.4 Classification of assets and liabilities in banks 1.5 Time buckets
1.6 Liquidity risk management 1.7 Interest rate risk management 1.8 Organization of report
2. GAP ANALYSIS 2.1 Introduction to the Gap analysis
2.2 Model-1 Analysis of one year ALM data of a bank 2.3 Model-2 Analysis of multiple years ALM data of a bank
3. DESIGN OF RULE BASED SYSTEM
3.1 Introduction
3.2 Features
3.3 Input for Rule based system prototype
3.4 Output of Rule based system prototype Observations and Conclusions
References

Page 6
1. INTRODUCTION
1.1) ASSET LIABILITY MANAGEMENT(ALM):
Asset Liability Management (ALM) is defined as management of all
assets and liabilities (both off and on balance sheet items) of a bank. It involves in
assessment of various types of risks and altering the asset- liability portfolio in a
dynamic way in order to manage risk.
ALM is a part of the overall risk management in banks. It implies examination of all
the assets and liabilities simultaneously on a continuous basis with a view to ensuring
a proper balance between funds mobilization and their deployment with respect to
their maturity profiles, cost, yield, and risk exposure etc.ALM is basically a hedging
response to the risk in financial intermediation. It attempts to provide a degree of
protection to the institution from intermediation risk and makes such risk acceptable.
ALM integrated with:
Formulation and execution of business strategies
Articulation of strategies for overall balance sheet management
Management of risk adjusted returns
Allocation of capital
Product pricing and development etc.
The essence of ALM is identifying, measuring, monitoring and controlling risk in the
process of achieving the objectives of the institution with in the approved strategic
framework. The function of ALM is not just protection from risk. It also opens up
opportunities for enhancing the banks net worth.
1.2) NEED OF ALM IN BANKS:
Before 1970 in the industrial countries banks were heavily regulated. They
followed 3-6-3 banking.
3-6-3 banking: Accepting deposits at 3%, lending at 6% and leave for golf
club at 3pm.

Page 7
Due to high regulations and controls, at that time credit risk was the only
aspect management had to manage. But after 1970 due to deregulation of interest
rates market risks were came in to picture (especially interest rate risk).
Factors which caused changes in banking scenario:
Financial products starting from simple forward contracts to highly
complex instruments came into existence to transfer risk.
Invention of powerful machines to store and process data. The incredible
capacity of these machines raised analysis of information to very high
planes in tern leading to development of new products.
Deregulation of interest rates, technology changes provides both
opportunities and threats.
Banking business has been transformed from mere deposit taking and lending
into a complex world of innovations and risk management.
With the liberalization in Indian financial markets and growing integration of
domestic markets with external markets, the risk associated with banks operations
have become complex and large, requiring strategic management. Banks are now
operating in a fairly deregulated environment and are required to determine on their
own interest rates on deposits and advances in both domestic and foreign currencies
on a dynamic basis. The interest rates on banks investments in government and other
securities are also now market related. Intense competition for business involving both
the assets and liabilities together with increasing volatility in domestic interest rates as
well as foreign exchange rates has bought pressure on management of banks to
maintain a good balance among spreads, profitability and long term viability.
Imprudent liquidity management can puts banks earnings and reputation at great risk.
These pressures called for structured and comprehensive measures and not just add
hoc actions.
Banks need to address these risks in a structured manner by upgrading their risk
management and adopting more comprehensive ALM practices than that has been
done hitherto. ALM is concerned with risk management and provides a
comprehensive and dynamic framework for measuring, monitoring and managing
liquidity, interest rate, foreign exchange and commodity price risks of a bank that
needs to be closely integrated with the business strategy. ALM involves assessment of
various types of risks and altering the asset- liability portfolio in a dynamic way in
order to manage risk.
Page 8
1.3) Market risk
‗The risk that the value of on- or off – balance sheet positions will be
adversely affected by movements in equity and interest rate markets, currency
exchange rates and commodity prices’ (According to the bank for international
settlements (BIS))
Market risk management of a bank involves management of
1. Liquidity risk
2. Interest rate risk
3. Foreign exchange risk
4. Equity price risk
5. Commodity risk
ALM is mainly concerned with liquidity risk, interest rate risk and foreign
exchange risk.
1.3.1) Liquidity Risk
―Liquidity risk is the potential inability to meet the bank’s liabilit ies as they
become due.‖
It arises when the banks are unable to generate cash to cope with a decline in deposits
or increase in assets. It originates from the mismatches in the maturity pattern of
assets and liabilities. The liquidity risk in banks manifest in different dimensions:
Funding Risk: The need to replace net outflows due to unanticipated withdrawal/non-
renewal of deposits
Time Risk: The need to compensate for non-receipt of expected inflows of funds i.e.,
performing assets turning into NPAs
Call Risk: Due to crystallization of contingent liabilities and inability to undertake
profitable business opportunities when desirable.

Page 9
1.3.2) Interest Rate Risk
―Interest rate risk is the risk where changes in market interest rates might
adversely affect a bank’s financial condition.‖
The immediate impact of changes in interest rates is on the Net Interest Income (NII).
A long term impact of changing interest rates is on the bank‘s net worth since the economic value of a bank‘s assets, liabilities and off-balance sheet positions get
affected due to variation in market interest rates. The interest rate risk when viewed
from these two perspectives is known as ‗earnings perspective‘ and ‗economic value‘ perspective, respectively.
As specified, changes in market interest rates have dual impact for a bank: on its Net
Interest Income (NII) and on its net-worth. Management of interest rate risk aims at capturing the risks arising from the maturity and re-pricing mismatches and is
measured both from the earnings and economic value perspective.
Earnings perspective involves analyzing the impact of changes in interest rates
on accrual or reported earnings in the near term. This is measured by measuring
the changes in the Net Interest Income (NII) or Net Interest Margin (NIM) i.e. the difference between the total interest income and the total interest
expenditure.
Economic Value perspective involves analyzing the changes of impact of
interest on the expected cash flows on assets minus the expected cash flows on
liabilities plus the net cash flows on off-balance sheet items. It focuses on the risk to net-worth arising from all re-pricing mismatches and other interest rate
sensitive positions. The economic value perspective identifies risk arising from
long-term interest rate gaps.
1.3.3) Foreign exchange Risk
―The risk that a bank may suffer losses as a result of adverse exchange rate
movements during a period in which it has an open position, either spot or forward,
or a combination of the two, in an individual foreign currency.‖
.

Page 10
1.4) Classification of assets and liabilities in banks (referred from
Asset - Liability Management System in banks – Guidelines by RBI)
1.4.1) OUTFLOWS:
Capital
Reserves and surplus
Deposits
i. Current deposits
ii. Savings bank deposits
iii. Term deposits
iv. Certificates of deposits
Borrowings
i. Call and short notice
ii. Interbank(term)
iii. Refinances
iv. Others
Other liabilities and provisions
i. Bills payable
ii. Inter office adjustments
iii. Provisions for depreciation and unrecoverable loans etc
iv. Others
Lines of credit committed to
i. Institutions
ii. Customers
Letters of credit/ guarantees (contingent liabilities)
Repos
Bills rediscounted
Swaps (buy/sell) /maturing forwards
Interest payable
Others- if any
Page 11
1.4.2) INFLOWS:
Cash
Balances with RBI—for CRR
Balances with other banks
i. Current account
ii. Money at call and short notice, term deposits etc
Investments
i. Approved securities
ii. Corporate debentures and bonds, CDs, redeemable preference
shares, units of mutual funds
iii. Investments in subsidiaries/ joint ventures
Advances (performing)
i. Bills Purchased and Discounted (including bills under DUPN)
ii. Cash Credit/Overdraft (including TOD) and Demand Loan
component of Working Capital.
iii. Term Loans
NPAs
i. Sub-standard
ii. Doubtful and Loss
Fixed Assets
Other Assets
i. Inter-office Adjustment
ii. Others
Reverse repo
Interest receivable
Swaps (sell/buy)/ maturing forwards
Committed lines of credit
Bills rediscounted(DUPN)
Others

Page 12
1.5) TIME BUCKETS:
RBI was divided future cash flows into different time buckets. While
preparing structural liquidity statement and interest rate sensitivity statement cash
flows were placed in different time buckets based on their maturity period or repricing
period.
i) 1 to 14 days
ii) 15 to 28 days
iii) 29 days and upto 3 months iv) Over 3 months and upto 6 months
v) Over 6 months and upto 12 months
vi) Over 1 year and upto 2 years
vii) Over 2 years and upto 5 years viii) Over 5 years
The first time bucket (1-14 days at present) is further divided into three time buckets
for more granular approach to measurement of risk.
i. Next day
ii. 2-7 days
iii. 8-14 days
1.6) LIQUIDITY RISK MANAGEMENT
Measuring and managing liquidity needs are vital activities of commercial banks. By assuring a bank's ability to meet its liabilities as they become due, liquidity
management can reduce the probability of an adverse situation developing. The
importance of liquidity transcends individual institutions, as liquidity shortfall in one institution can have repercussions on the entire system. Bank management should
measure not only the liquidity positions of banks on an ongoing basis but also
examine how liquidity requirements are likely to evolve under crisis scenarios.
1.6.1) IMPORTANCE OF LIQUIDITY RISK MANAGEMENT:
It demonstrates to the market place that the bank is safe and therefore
capable of repaying its borrowings.
It enables the bank to meet its prior loan commitments and thus necessary
to nurture relationship.
It enables the bank to avoid unprofitable sale of assets.
It lowers the default risk premium the bank must pay for funds, as a bank
with strong balance sheet will be perceived by the market as being liquid
and safe.
Page 13
It reduces the need to resort to borrowings from the central bank.
Excessive use of central bank liquidity by a bank will be interpreted as
consequences of imprudent liquidity management by the bank.
Liquidity risk measured through constructing Structural liquidity statement
and observing mismatches.
1.6.2) Structural liquidity statement
The Statement of Structural Liquidity may be prepared by placing all cash inflows and outflows in the maturity ladder according to the expected timing of cash
flows. A maturing liability will be a cash outflow while a maturing asset will be a cash
inflow. Mismatches and cumulative mismatches will be calculated across all time buckets.
As a measure of liquidity management, banks are required to monitor their cumulative mismatches across all time buckets in their Statement of Structural
Liquidity by establishing internal prudential limits with the approval of the Board /
ALCO. As per the guidelines, the mismatches (negative gap) during the time buckets of 1-14 days and 15-28 days in the normal course are not to exceed 20 per cent of the
cash outflows in the respective time buckets.
The banks may adopt a more granular approach to measurement of liquidity risk by splitting the first time bucket (1-14 days at present) in the Statement of Structural
Liquidity into three time buckets viz. next day, 2-7 days and 8-14 days. The net
cumulative negative mismatches during the Next day, 2-7 days, 8-14 days and 15-28 days buckets should not exceed 5 %, 10%, 15 % and 20 % of the cumulative cash
outflows in the respective time buckets in order to recognize the cumulative impact on
liquidity.
In case the net cumulative negative mismatches during the Day 1, 2-7 days, 8-
14 days and 15- 28 days buckets exceed the prudential limit of 5 % ,10%, 15 % and
20% of the cumulative cash outflows in the respective time buckets, the bank may show by way of a foot note as to how it proposes to finance the gap to bring the
mismatch within the prescribed limits.
Page 14
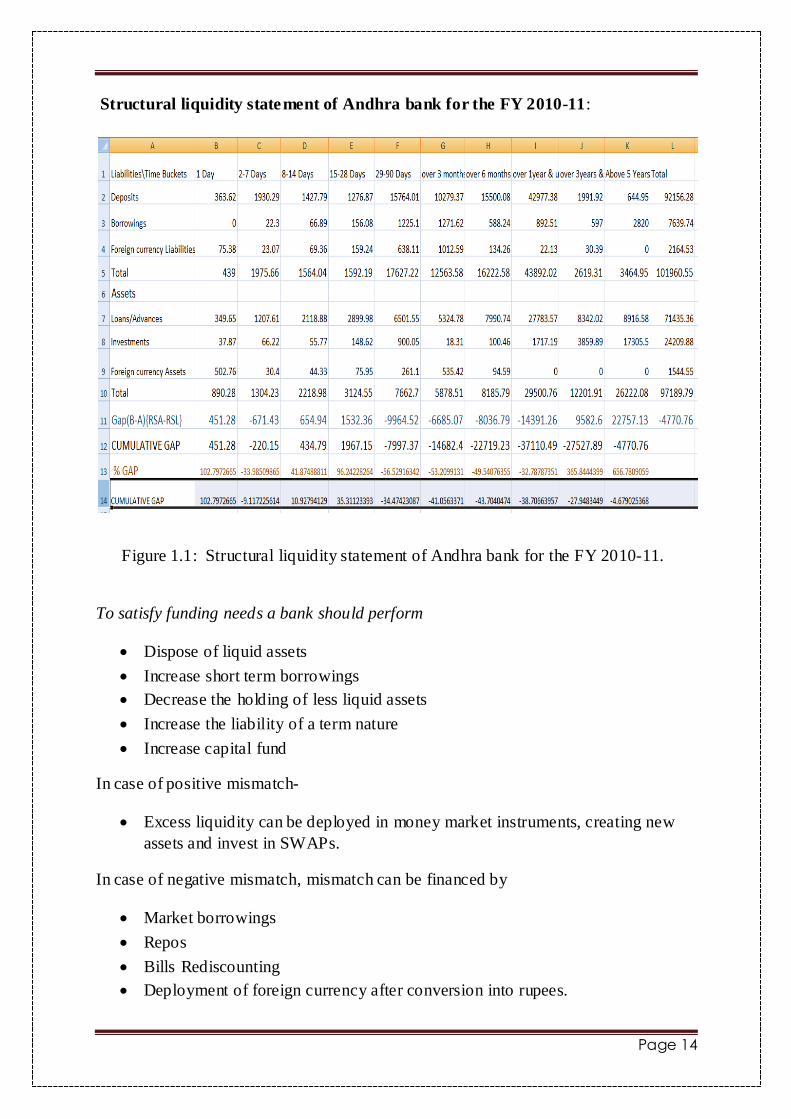
Structural liquidity statement of Andhra bank for the FY 2010-11:
Figure 1.1: Structural liquidity statement of Andhra bank for the FY 2010-11.
To satisfy funding needs a bank should perform
Dispose of liquid assets
Increase short term borrowings
Decrease the holding of less liquid assets
Increase the liability of a term nature
Increase capital fund
In case of positive mismatch-
Excess liquidity can be deployed in money market instruments, creating new
assets and invest in SWAPs.
In case of negative mismatch, mismatch can be financed by
Market borrowings
Repos
Bills Rediscounting
Deployment of foreign currency after conversion into rupees.

Page 15
1.7) Interest rate risk management
In interest rate risk changes in market interest rates might adversely
affect a bank‘s financial condition. Changes in interest rates affect both the current
earnings (earnings perspective) as also the net worth of the bank (economic value perspective). The risk from the earnings' perspective can be measured as changes in
the Net Interest Income (Nil) or Net Interest Margin (NIM). The risk from the
economic value perspective can be measured as changes in the Market Value Equity (MVE).
Figure 1.2: Diagram showing methods used for different perspectives in interest rate risk.
ALCO will prepare Interest rate sensitivity report by placing rate sensitive assets and
liabilities in different time buckets based on their maturity period or repricing period
and submit this report to RBI.
1.8) Organization of report
Objective
Identify the strategies to mitigate interest rate risk of banks.
Identify the effect of cumulative decisions of Banks on its current ALM
position.
Deliverables:
A rule based system which assist ALM analyst in decision making.
Interest rate risk
earnings perspective(changes
in NII/NIM)
Measured by using GAP analysis
method
economic value perspective(changes
in MVE)
Measured by using Duration GAP analysis
method

Page 16
2. GAP ANALYSIS
2.1) Introduction to GAP analysis
Gap analysis measures mismatches between rate sensitive liabilities and
rate sensitive assets (including off-balance sheet positions). The Gap Report
should be generated by grouping rate sensitive liabilities, assets and off-balance
sheet positions into time buckets according to residual maturity or next repricing
period, whichever is earlier. The difficult task in Gap analysis is determining rate
sensitivity. An asset or liability is normally classified as rate sensitive if:
i. Within the time interval under consideration, there is a cash flow.
ii. The interest rate resets/reprices contractually during the interval.
iii. RBI changes the interest rates (i.e. interest rates on Savings Bank
Deposits, advances upto Rs.2 lakhs, DRI advances, Export credit,
Refinance, CRR balance, etc.) in cases where interest rates are
administered.
iv. It is contractually pre-payable or withdrawable before the stated
maturities.
All investments, advances, deposits, borrowings, purchased funds etc. that mature/reprice within a specified timeframe are interest rate sensitive. Similarly,
any principal repayment of loan is also rate sensitive if the bank expects to
receive it within the time horizon. This includes final principal payment and interim instalments. Certain assets and liabilities receive/pay rates that vary with
a reference rate. These assets and liabilities are repriced at pre-determined
intervals and are rate sensitive at the time of repricing. While the interest rates on term deposits are fixed during their currency, the advances portfolio of the
banking system is basically floating. The interest rates on advances could be
repriced any number of occasions, corresponding to the changes in PLR.
The Gap is the difference between Rate Sensitive Assets (RSA) and Rate
Sensitive Liabilities (RSL) for each time bucket. The positive Gap indicates that
it has more RSAs than RSLs whereas the negative Gap indicates that it has more RSLs.
GAP(t) = RSA(t)-RSL(t)
RSA
Those assets which are mature or reprice in a given time period (t)

Page 17
RSL
Those liabilities which are mature or reprice in a given time period (t)
Gap Cause Interest Rate Profit(NII)
Positive RSA>RSL Rise Rise
(Asset) Fall Fall
Negative RSA<RSL Rise Fall
(Liability) Fall Rise
Zero RSA=RSL Rise No effect
Fall No effect
Figure 2.1: Table showing relationship between gap, interest rate and NII.
Net Interest Income (NII): It is the difference between interest income and interest expenditure.
NII=Interest income –interest expenditure
Net Interest Margin (NIM): It is a measure of the difference between the interest
income generated by banks and the amount of interest paid out to their lenders (for
example, deposits), relative to the amount of their (interest-earning) assets.
NIM=NII/RSA*100
We carried out Gap analysis in two models (model-1 and model-2). In model-1.
We did analysis of two years data (as two cases) and in model-2 we did analysis of
seven financial years data of Andhra bank. In each model we identified best
strategies for mitigation of interest rate risk.

Page 18
2.2) MODEL 1 –Analysis of one year data of a bank
2.2.1) Introduction
In this model we carried out analysis of Andhra bank 2010-11 ALM data by
preparing gap report using rate sensitive assets and liabilities. In this model we
followed a different procedure for preparing Gap report.
The procedure followed by Andhra bank in preparing Gap report
Andhra bank is doing TGA by adding RSA & RSL depending upon
their maturity patterns or repricing behaviours. Andhra bank was having complete
data of maturity patterns of different rate sensitive assets and liabilities and bank was
placing them into different time buckets based on their maturity patterns or repricing
patterns.
The procedure that we followed in preparing Gap report: We were taken asset and liabilities maturity patterns data from Andhra
bank annual sheet for preparing GAP report for measuring interest rate risk, but
this data also contains interest rate non sensitive deposits (current deposits). We
removed this non sensitive part by following RBI guidelines.
According to RBI guidelines 15% of current deposits (demand
deposits) are volatile in nature (withdrawable at any time) so it will come under 1-
14 days time bucket. Remaining 85% will comes under 1-3 years time bucket.
We deducted 15% of current deposits from 1-14 days time bucket
deposits and remaining 85% from 1-3 years time bucket deposits then we prepared
gap report.
2.2.2) Observations Bank having negative gap across 15 days to 36 months time buckets mainly due
to the term deposits.
Bank having positive gap in above 3 years time buckets mainly due to the high
amount of loans (especially infrastructure loans).
Bank will be benefited (in the short term) by fall in interest rates.
Interest rates were increased in the FY 2010-11.

Page 19
GAP report of Andhra bank for the FY 2010-11:
Figure 2.2: GAP report of Andhra bank for the FY 2010-11
2.2.3) Identified strategies
We identified that the following two strategies are the best strategies for
mitigation of interest rate risk.
Active management(restructuring the RSA and RSL)
Passive management(Hedging)
We were implemented these strategies for the FY 2010-11 and we observed increase
in NII of the bank.

Page 20
The implemented actions were as follows
Attract 1000cr deposits of 3-5 yr maturity and use in loans and advances of 3-
12 months maturity.
Take long term fixed rate borrowings of 150cr and use in loans and advances of
6-12 months maturities.
Increase long term fixed rate debt.
Make more loans on floating rate basis
SWAPS- for medium and long term loans/advances(6months to 3
years)(receiving floating rate basis and paying on fixed rate basis)
Futures and options
Attract current deposits and invest core portion of current deposits in short term
marketable securities. ( 270cr)
Reduce investment portfolio.
Note: Interest rates were increasing in the FY 2010-11.
Figure2.3: GAP report 2010-11 after implementing strategies

Page 21
2.2.4) Analysis of FY 2011-12 ALM data of Andhra bank
Figure 2.4: Gap report of Andhra bank for the FY 2011-12
Observations:
The NIM was decreased compared to previous FY. The reasons are
i. Percentage of NPAs was increased
ii. Interest expenditure was increased (the magnitude change of cost of
deposits and cost of borrowings was greater than magnitude change
of yield on loans and yield on investments).
Bank having negative gaps in the short term maturities so it was affected by
increase in interest rates.
Strength of the bank was increased even though NIM was decreased.

Page 22
2.3) MODEL 2 -Analysis of multiple years ALM data of a
bank
2.3.1) Introduction
We analysed asset liabilities maturities data of Andhra bank from 2005-06 to
2011-12 by taking data from annual reports of Andhra bank. We prepared Gap
report for each year and calculated net interest income and net interest margin
2.3.1) Observations
Andhra bank shifted from more liability sensitive to asset sensitive in shorter
maturity periods.
In 2007-08 there was a decrease in NIM mainly due to rise in the interest rates
where bank attracted more short term deposits.
NIM was decreased from 2005-06 to 2006-07 and also from 2006-07 to 2007-
08.
NII was increased every year except in FY 2007-08. NII between FY 2007-08
was almost same to the previous financial year NII.
In FY 2008-09 Andhra bank was maintained negative gap in ST maturities but
during these period interest rates were increased. Due to this reason bank was
faced more interest risk (151.7 cr).
In the FY 2009-10 Andhra bank ALM position was good. The main reason for
this was decrease of interest rates where Andhra bank had negative gap in the
short term maturities.
In the FY 2010-11 interest rates on loans and investments were increased as
well as interest rates on deposits and borrowings were decreased due to this
bank NII was increased by greater magnitude.
In FY 2011-12 NIM was decreased mainly due to increase in interest
expenditure as well as increase in percentage of NPAs. The magnitude change
(increase) of cost of deposits and cost of borrowings was greater than
magnitude change of yield on investments and yield on funds. This caused
decrease in NIM.

Page 23
Figure2.4: GAP report of Andhra bank for the financial year 2006-07.
Figure2.5: GAP report of Andhra bank for the financial year 2007-08.

Page 24
Figure 2.6: Graph showing trends of different interest rates.
Figure 2.7: Graph showing trend of NII from 2005-06 to 2011-12.
0.00%
2.00%
4.00%
6.00%
8.00%
10.00%
12.00%
14.00%
2005-06 2006-07 2007-08 2008-09 2009-10 2010-11 2011-12
cost of Deposits
cost of borrowings
yield on advances
yield on funds
1169
1418 1419.88 1626.91
2194.74
3220.97
3759.32
0
500
1000
1500
2000
2500
3000
3500
4000
2005-06 2006-07 2007-08 2008-09 2009-10 2010-11 2011-12
NII
NII

Page 25
Figure 2.8: Graph showing trend of NIM from 2005-06 to 2011-12.
Figure 2.9: Graph showing trend of capital requirement for interest rate risk.
3.32% 3.20%
2.86% 3.03%
3.21%
3.80% 3.67%
0.00%
0.50%
1.00%
1.50%
2.00%
2.50%
3.00%
3.50%
4.00%
2005-06 2006-07 2007-08 2008-09 2009-10 2010-11 2011-12
NIM
NIM
151.17
73.57
102.63
64.43
0
20
40
60
80
100
120
140
160
2008-09 2009-10 2010-11 2011-12
capital requiirement for interest rate risk
capital requiirement for
interest rate risk

Page 26
2.3.3) Strategies for minimising Interest Rate Risk
We identified that the following two strategies were the best strategies for mitigation
of interest rate risk
1. Hedging the risk using derivative instruments to close the gap.(Passive
management)
2. Constantly restructuring the assets and liabilities of balance sheet near neutral to
interest rate risk. (active management)
When Interest rates are decreasing
NII will deteriorate if banks have positive gap (RSA>RSL), banks may
therefore:
Reduce its RSA and should increase its RSL
Increase its fixed rate assets.
Increase floating rate Deposits
Increase short term Deposits
Increase fixed rate lending
Increase short term borrowings
Extend Investment portfolio maturities.
Banks may have Interest Rate SWAP (swap a portion of variable Interest
Payment Stream for Fixed Rate Interest Payment Stream).
When interest rates are increasing
NII will deteriorate if banks have negative gap(RSL>RSA), banks may
therefore:
Increase its rate sensitive assets and decrease its rate sensitive liabilities
Reduce Investment portfolio maturities
Increase long term Deposits
Increase fixed rate long term debt
Increase floating rate lending
Attract demand deposits and invest in securities
SWAP a fixed income stream for a variable rate stream enter into a rate capped SWAP Contract or SWAPTION

Page 27
3. DESIGN OF RULE BASED SYSTEM (RBS)
3.1) Introduction
Rule based systems are used as a way to store and manipulate knowledge to
interpret information in a useful way.
We designed a Rule based system based on the observations and strategies
identified through model -1 and model- 2 GAP analyses in order to manage
assets and liabilities effectively. We used MATLAB software in the design of
Rule Based System.
The structure of rule is
If (condition)
‗Action‘;
3.2) Features:
Rule based system contains all possible conditions and each and every
condition was given with most preferable action.
Time bucket concept was also inserted in this Rule Based System. This Rule
Based System will give preferable action for each time bucket depending upon
the gap and interest rate changes in respective time buckets.
The ALM analyst should just need to upload rate sensitive report in RBS then
it will automatically analyses the report and gives
Gap for each and every time buckets
Present NII for each time bucket
Total present NII
NII for each time bucket after changing interest rates
Total NII after change in interest rates
Change in the NII for each time bucket as well as total NII change
Present NIM for each time bucket
Total present NIM
NIM for each time bucket after changing interest rates
Total NIM after change in interest rates
Change in the NIM for each time bucket as well as total NIM change
Preferable actions for increasing NII for every time bucket.

Page 28
The actions were taken from mixed strategy (active and passive management)
which was identified as the best strategy for mitigation of interest rate risk.
3.3) Input for Rule based system prototype:
Figure 3.1: myfile -sheet 4
We have to upload Gap report in to the model and we have to enter interest rates of
deposits (id), borrowings (ib), loans/advances (il) and investments (in). We have to
enter present interest rates as well as interest rates of above four after change.

Page 29
Figure 3.2: code related to rule based system model showing input part
3.4) Output of Rule based system prototype
Figure 3.3: MATLAB page showing output

Page 30
Figure 3.4: MATLAB page showing output

Page 31
Figure 3.5: MATLAB page showing output

Page 32
4) Observations and Conclusions:
With the onset of liberalization Indian banks are now more exposed to
uncertainty and to global competition. This makes it imperative to have proper asset
liability management system in place.
Through effective liquidity risk management banks can avoid unprofitable sale of
assets and reduce borrowings from central bank and can demonstrate itself as a safe
bank.
Maintaining a good interest risk management is vital for Indian banks in the present
scenario. It enables the bank to reduce earnings volatility and gives opportunity to get
benefited from changing interest rates.
The rule based system will ease the work of ALM analyst and assist him/her in
effective decision making.
References:
1) ‗Risk management in Indian banks‘: DR.K.M.Bhattacharya, Himalaya
publishing house, 2006, Mumbai.
2) ‗Investment management (theory and practice)‘: R.P.Rustagi, Sultan chand &
sons, 2005, New Delhi.
3) RBI guidelines: Asset - Liability Management System in banks – Guidelines
rbidocs.rbi.org.in/rdocs/PressRelease/PDFs/3204.pdf
Websites:
http://www.scribd.com
http://www.iba.org.in
http://en.wikipedia.org
http://www.stcipd.com
http://www.rbi.org.in