analysis of acute-phase proteins, ahsg, c3, cli, hp and saa, reveals distinctive expression patterns...
TRANSCRIPT

Analysis of acute-phase proteins, AHSG, C3, CLI, HP and SAA,reveals distinctive expression patterns associated with breast,colorectal and lung cancer
Paul Dowling1, Colin Clarke1, Kim Hennessy1, Beatriz Torralbo-Lopez2, Jo Ballot3, John Crown3, Ingrid Kiernan4,
Kenneth J. O’Byrne4, M. John Kennedy5, Vincent Lynch1 and Martin Clynes1
1 National Institute for Cellular Biotechnology, Dublin City University, Dublin 9, Ireland2 The All-Ireland Cooperative Oncology Research Group (ICORG), Dublin 2, Ireland3 St Vincent’s University Hospital, Dublin 4, Ireland/Molecular Therapeutics for Cancer Ireland (MTCI)4 Department of Clinical Medicine, Translational Cancer Research Group, Institute of Molecular Medicine, Trinity Centre for Health Sciences,
St. James’ Hospital, Dublin, Ireland5 Academic Unit of Clinical and Molecular Oncology St James Hospital and the University of Dublin, Trinity College, Ireland
Early detection, clinical management and disease recurrence monitoring are critical areas in cancer treatment in which specific
biomarker panels are likely to be very important in each of these key areas. We have previously demonstrated that levels of
alpha-2-heremans-schmid-glycoprotein (AHSG), complement component C3 (C3), clusterin (CLI), haptoglobin (HP) and serum
amyloid A (SAA) are significantly altered in serum from patients with squamous cell carcinoma of the lung. Here, we report
the abundance levels for these proteins in serum samples from patients with advanced breast cancer, colorectal cancer (CRC)
and lung cancer compared to healthy controls (age and gender matched) using commercially available enzyme-linked
immunosorbent assay kits. Logistic regression (LR) models were fitted to the resulting data, and the classification ability of
the proteins was evaluated using receiver-operating characteristic curve and leave-one-out cross-validation (LOOCV). The most
accurate individual candidate biomarkers were C3 for breast cancer [area under the curve (AUC) 5 0.89, LOOCV 5 73%], CLI
for CRC (AUC 5 0.98, LOOCV 5 90%), HP for small cell lung carcinoma (AUC 5 0.97, LOOCV 5 88%), C3 for lung
adenocarcinoma (AUC 5 0.94, LOOCV 5 89%) and HP for squamous cell carcinoma of the lung (AUC 5 0.94, LOOCV 5 87%).
The best dual combination of biomarkers using LR analysis were found to be AHSG 1 C3 (AUC 5 0.91, LOOCV 5 83%) for
breast cancer, CLI 1 HP (AUC 5 0.98, LOOCV 5 92%) for CRC, C3 1 SAA (AUC 5 0.97, LOOCV 5 91%) for small cell lung
carcinoma and HP 1 SAA for both adenocarcinoma (AUC 5 0.98, LOOCV 5 96%) and squamous cell carcinoma of the lung
(AUC 5 0.98, LOOCV 5 84%). The high AUC values reported here indicated that these candidate biomarkers
have the potential to discriminate accurately between control and cancer groups both individually and in combination with
other proteins.
Despite the recent good news that cancer incidence anddeath rates for men and women continue to decline in devel-oped countries, cancer is projected to become the leadingcause of death worldwide this year.1 For women, breast can-cer is the most common, with lung cancer second and colo-rectal cancer (CRC) third.2 For men, prostate cancer is themost prevalent form of cancer, followed by lung cancer andthen CRC.3
The number of candidate biomarkers, which can be usedfor diagnosis, early detection or treatment monitoring, con-tinues to grow rapidly; however, few of these reach the clinicmainly because of low levels of sensitivity and specificity.4
Despite advances in new technologies, detection and routinemeasurement of low abundant tumor-specific proteinsremain a significant challenge. The detection limits of mod-ern mass spectrometers and conventional immunoassays arenow, however approaching the relevant levels in biofluidssuch as serum, although it is likely that some early stage dis-ease-specific biomarkers may still lie beyond current limits.5
Coupled with the added difficulties of high-abundance resi-dent proteins such as albumin masking the low abundant tu-mor-specific biomarkers and the fact that some biomarkersare rapidly degraded, and identification of low level proteinsremains difficult.6 Much of the focus on sample preparationfor biomarker discovery experiments has focused on theremoval of highly abundant proteins such as albumin andhaptoglobin, a strategy that results in relative enrichment of
Key words: acute-phase proteins, biomarkers, cancer, proteomics
Grant sponsors: Enterprise Ireland, Programme for Research in
Third-Level Institutions (PRTLI) Cycle IV
DOI: 10.1002/ijc.26462
History: Received 18 Apr 2011; Accepted 31 Aug 2011; Online 27
Sep 2011
Correspondence to: Paul Dowling, National Institute for Cellular
Biotechnology, Dublin City University, Glasnevin, Dublin 9, Ireland,
Tel.: þ353-1-7006245, Fax.: þ353-1-7005484, E-mail: paul.dowling@
dcu.ie
Early
Detection
andDiagn
osis
Int. J. Cancer: 000, 000–000 (2011) VC 2011 UICC
International Journal of Cancer
IJC

medium to low abundant potential biomarkers. Within thehigh abundant protein group reside the acute-phase proteins(APPs). APPs generally have a nonspecific rapid response tosuch processes as inflammation/infections, tissue damage,surgery, myocardial infarction or the presence of tumors. Therelationship between the APPs and cancer has been welldocumented in the literature with numerous investigationsreporting on altered levels of various APPs with differenttypes of cancers and evidence that many APPs are actuallyproduced directly by tumor tissue.7,8
It has been suggested that APPs were not likely to be specificfor any type of cancer and would be expected to be elevated inall malignancies and in inflammatory diseases. In addition,high-abundance proteins such as the APPs were thoughtunlikely to be tumor-derived and thus to represent cancer epi-phenomena rather than direct tumor-derived proteins. Recentprogress in proteomics studies, however, which profiled the se-rum proteins of patients with cancer and those of normal indi-viduals, indicated that the altered expression of APPs was dif-ferent for distinct types, subtypes, and even stages of cancer.9,10
It is likely that panels of biomarkers in the future will be com-prised of biomarkers that reflect tumor-specific proteins to-gether with proteins from the tumor microenvironment.
Our study focused on the measurement of five highlyabundant serum proteins from the APP class, which we havepreviously found to be altered in serum from patients withsquamous cell carcinoma of the lung,11 in advanced breast,CRC and lung cancer serum. Specifically, the levels of alpha-2-heremans-schmid-glycoprotein (AHSG), complement com-ponent C3 (C3), clusterin (CLI), haptoglobin (HP) and serumamyloid A (SAA) were measured.
Material and MethodsPatients and sample collection
Samples were collected through a collaborative project involv-ing participating sites (St Vincent’s University Hospital, Dub-lin 4, Ireland and St. James’s Hospital, Dublin 8, Ireland),coordinated through ICORG (the All Ireland Co-operativeOncology Research Group, www.icorg.ie). The samples werecollected according to standard phlebotomy procedures fromconsented patients. Ethical consent was granted from each ofthe respective Hospital Ethics Committees. A total of 10 mlof blood was collected into additive free (serum) blood tubesand was allowed to clot for 30 min to 1 hr at room tempera-ture. The serum was denuded by pipette from the clot andpoured into a clean tube. The tubes were centrifuged at 400gfor 30 min at 4�C. Serum was aliquoted in the cryovial tubes,labeled and stored at �80�C until time of analysis. The timefrom sample procurement to storage at �80�C was less than3 hr. Each serum sample underwent not more than threefreeze/thaw cycles prior to analysis.
Enzyme-linked immunosorbent assay
Enzyme-linked immunosorbent assay (ELISA)-based analysiswas carried out using raw unfractionated serum samples.
Each sample was analyzed in triplicate using the followingcommercially available kits, for the measurement of serumhaptoglobin (AssayPro), CLI (BioVendor R&D), complementC3 (AssayPro), SAA (Invitrogen) and alpha HS glycoprotein(AssayPro) kits were used. The ELISA assays were performedaccording to each manufacturer’s protocol and guidelines.The haptoglobin and complement C3 assays use a quantita-tive and competitive enzyme immunoassay technique thattakes 2–3 hr to perform. The assays for alpha HS glycopro-tein, CLI and SAA use a quantitative sandwich enzyme im-munoassay technique that takes 3–4 hr to perform. The opti-cal density (OD) was measured using a microplate reader(Bio-Tek), and the concentration of each protein in the se-rum samples was determined by comparing the OD of thesamples against the respective standard curve.
Statistical analysis
Box-and-whisker plots were generated through MicrosoftExcel using the values from the ELISA data. The plots displaya statistical summary including the median, quartiles andrange. Student t-test was used to identify statistically signifi-cant changes in abundance levels for specific proteinsbetween patient with cancer and control serum samples. Re-ceiver-operating characteristic (ROC) curve analysis was per-formed as it is a useful tool in assessment of biomarker accu-racy.12,13 The ROC plots were obtained by plotting allsensitivity values (true positive fraction) on the y-axis againsttheir equivalent (1-specificity) values (false positive fraction)for all available thresholds on the x-axis (MedCalc for Win-dows 8.1.1.0, Medcalc Software, Mariakerke, Belgium). Thearea under the curve (AUC) was calculated to provide a sum-mary of overall classifier effectiveness. In our study, we con-sider AUC values ranging from 0.5!0.7 as poor, 0.7!0.8 asaverage, 0.8!0.9 as good and >0.9 as outstanding.
For multivariate analysis of biomarker combinations,logistic regression (LR) analysis of the serum biomarker levelsin these patients groups was performed. As an additionalmeasure of the potential of these biomarkers to distinguishbetween control and cancer samples, a commonly used inter-nal validation technique known as leave-one-out cross-valida-tion (LOOCV) was performed.14,15 During the LOOCV pro-cedure data from a single observation is removed from thedataset, and the remaining samples are then utilized to con-struct a LR model. The ‘‘test’’ sample is presented to thetrained model and the performance assessed, LOOCV contin-ues until each observation is designated as the ‘‘test.’’ Thus,the LOOCV provides a more conservative estimate of modelperformance. LR, LR ROC curves and LOOCV evaluationwere carried out in the open source R statistical computingenvironment (http://www.r-project.org/).
ResultsClinical data
Table 1 shows that the mean age of the female control group(n ¼ 15) was 54 SD 6 8 years (range 35–81 years) and the
Early
Detection
andDiagn
osis
2 Analysis of acute-phase proteins
Int. J. Cancer: 000, 000–000 (2011) VC 2011 UICC
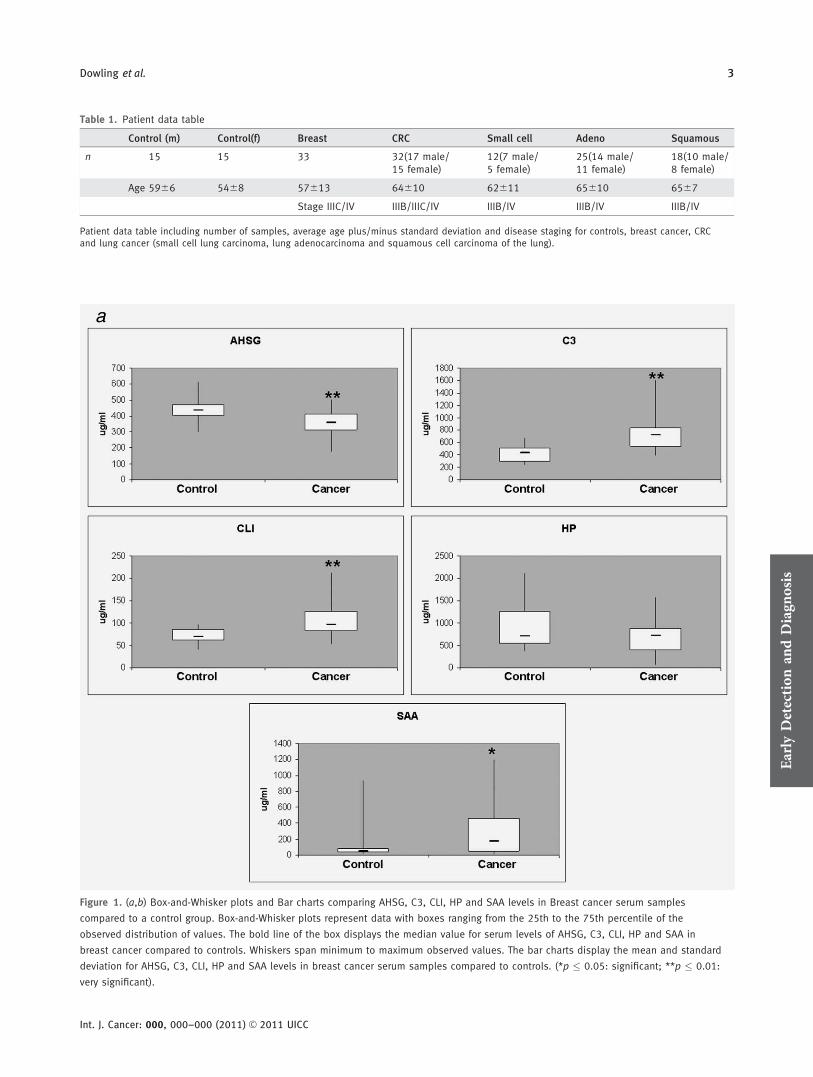
Table 1. Patient data table
Control (m) Control(f) Breast CRC Small cell Adeno Squamous
n 15 15 33 32(17 male/15 female)
12(7 male/5 female)
25(14 male/11 female)
18(10 male/8 female)
Age 5966 5468 57613 64610 62611 65610 6567
Stage IIIC/IV IIIB/IIIC/IV IIIB/IV IIIB/IV IIIB/IV
Patient data table including number of samples, average age plus/minus standard deviation and disease staging for controls, breast cancer, CRCand lung cancer (small cell lung carcinoma, lung adenocarcinoma and squamous cell carcinoma of the lung).
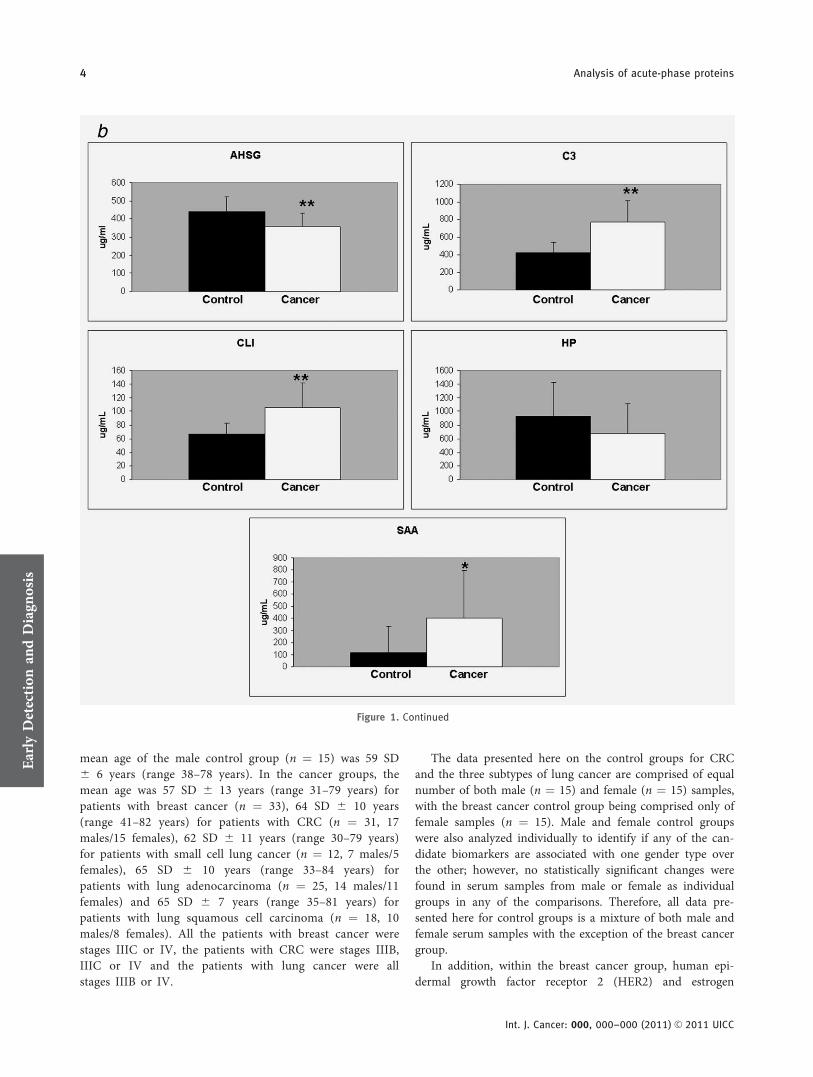
Figure 1. (a,b) Box-and-Whisker plots and Bar charts comparing AHSG, C3, CLI, HP and SAA levels in Breast cancer serum samples
compared to a control group. Box-and-Whisker plots represent data with boxes ranging from the 25th to the 75th percentile of the
observed distribution of values. The bold line of the box displays the median value for serum levels of AHSG, C3, CLI, HP and SAA in
breast cancer compared to controls. Whiskers span minimum to maximum observed values. The bar charts display the mean and standard
deviation for AHSG, C3, CLI, HP and SAA levels in breast cancer serum samples compared to controls. (*p � 0.05: significant; **p � 0.01:
very significant).
Early
Detection
andDiagn
osis
Dowling et al. 3
Int. J. Cancer: 000, 000–000 (2011) VC 2011 UICC
mean age of the male control group (n ¼ 15) was 59 SD6 6 years (range 38–78 years). In the cancer groups, themean age was 57 SD 6 13 years (range 31–79 years) forpatients with breast cancer (n ¼ 33), 64 SD 6 10 years(range 41–82 years) for patients with CRC (n ¼ 31, 17males/15 females), 62 SD 6 11 years (range 30–79 years)for patients with small cell lung cancer (n ¼ 12, 7 males/5females), 65 SD 6 10 years (range 33–84 years) forpatients with lung adenocarcinoma (n ¼ 25, 14 males/11females) and 65 SD 6 7 years (range 35–81 years) forpatients with lung squamous cell carcinoma (n ¼ 18, 10males/8 females). All the patients with breast cancer werestages IIIC or IV, the patients with CRC were stages IIIB,IIIC or IV and the patients with lung cancer were allstages IIIB or IV.
The data presented here on the control groups for CRCand the three subtypes of lung cancer are comprised of equalnumber of both male (n ¼ 15) and female (n ¼ 15) samples,with the breast cancer control group being comprised only offemale samples (n ¼ 15). Male and female control groupswere also analyzed individually to identify if any of the can-didate biomarkers are associated with one gender type overthe other; however, no statistically significant changes werefound in serum samples from male or female as individualgroups in any of the comparisons. Therefore, all data pre-sented here for control groups is a mixture of both male andfemale serum samples with the exception of the breast cancergroup.
In addition, within the breast cancer group, human epi-dermal growth factor receptor 2 (HER2) and estrogen
Figure 1. Continued
Early
Detection
andDiagn
osis
4 Analysis of acute-phase proteins
Int. J. Cancer: 000, 000–000 (2011) VC 2011 UICC
receptor (ER) status was available to us (from patient pa-thology reports) across the breast cancer cohort to identifyif any specific biomarkers are associated with these molecu-lar characteristics. Neither HER2 (n ¼ 19: 4 HER2-positive/15 HER2-negative; AHSG p ¼ 0.12, C3 p ¼ 0.57, CLI p ¼0.73, HP p ¼ 0.63, SAA p ¼ 0.23) nor ER (n ¼ 33: 21ER-positive/12 ER-negative; AHSG p ¼ 0.42, C3 p ¼ 0.46,CLI p ¼ 0.29, HP p ¼ 0.46, SAA p ¼ 0.77) status werestatistically significant in their association with any uniquechanges in abundance levels for the biomarkers discussedhere.
Expression of biomarker panel in breast cancer
To assess the levels of AHSG, C3, CLI, HP and SAA in con-trol and cancer samples, we assayed serum samples usingELISAs specific to each of these proteins for 33 patients withadvanced stage breast cancer and compared the results to acontrol group. Significant increases in abundance levels forC3, CLI and SAA in breast cancer sera compared to a controlgroup were observed. AHSG is shown to be significantlydecreased in cancer samples (Fig. 1a & 1b). Box plot analysis(Fig. 1a) showed that the median level of AHSG was signifi-cantly increased in control versus cancer samples (436.0 lg/
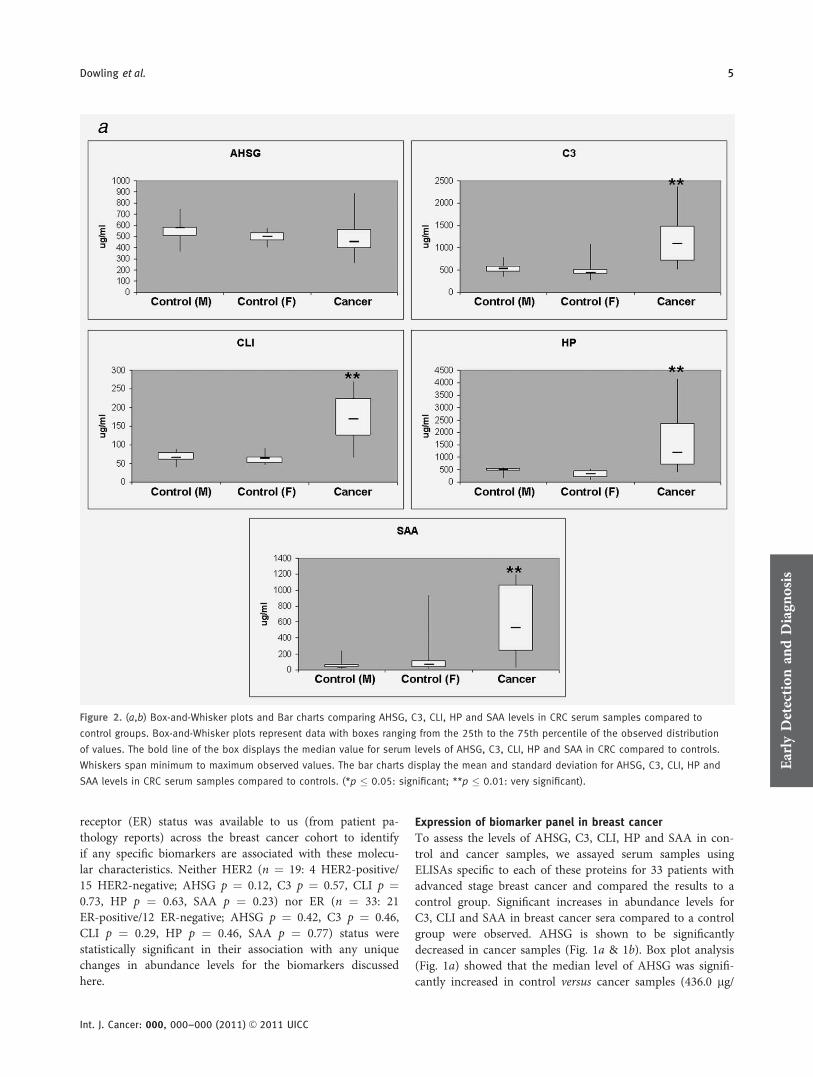
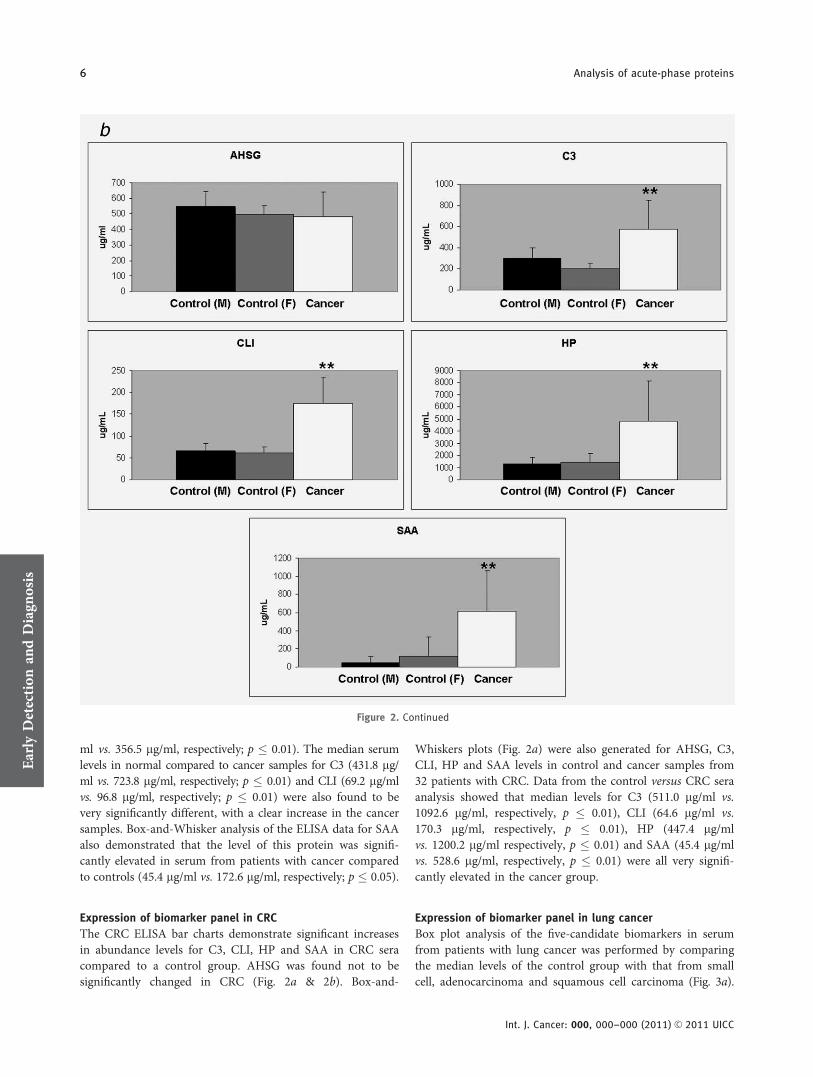
Figure 2. (a,b) Box-and-Whisker plots and Bar charts comparing AHSG, C3, CLI, HP and SAA levels in CRC serum samples compared to
control groups. Box-and-Whisker plots represent data with boxes ranging from the 25th to the 75th percentile of the observed distribution
of values. The bold line of the box displays the median value for serum levels of AHSG, C3, CLI, HP and SAA in CRC compared to controls.
Whiskers span minimum to maximum observed values. The bar charts display the mean and standard deviation for AHSG, C3, CLI, HP and
SAA levels in CRC serum samples compared to controls. (*p � 0.05: significant; **p � 0.01: very significant).Early
Detection
andDiagn
osis
Dowling et al. 5
Int. J. Cancer: 000, 000–000 (2011) VC 2011 UICC
ml vs. 356.5 lg/ml, respectively; p � 0.01). The median serumlevels in normal compared to cancer samples for C3 (431.8 lg/ml vs. 723.8 lg/ml, respectively; p � 0.01) and CLI (69.2 lg/mlvs. 96.8 lg/ml, respectively; p � 0.01) were also found to bevery significantly different, with a clear increase in the cancersamples. Box-and-Whisker analysis of the ELISA data for SAAalso demonstrated that the level of this protein was signifi-cantly elevated in serum from patients with cancer comparedto controls (45.4 lg/ml vs. 172.6 lg/ml, respectively; p � 0.05).
Expression of biomarker panel in CRC
The CRC ELISA bar charts demonstrate significant increasesin abundance levels for C3, CLI, HP and SAA in CRC seracompared to a control group. AHSG was found not to besignificantly changed in CRC (Fig. 2a & 2b). Box-and-
Whiskers plots (Fig. 2a) were also generated for AHSG, C3,CLI, HP and SAA levels in control and cancer samples from32 patients with CRC. Data from the control versus CRC seraanalysis showed that median levels for C3 (511.0 lg/ml vs.1092.6 lg/ml, respectively, p � 0.01), CLI (64.6 lg/ml vs.170.3 lg/ml, respectively, p � 0.01), HP (447.4 lg/mlvs. 1200.2 lg/ml respectively, p � 0.01) and SAA (45.4 lg/mlvs. 528.6 lg/ml, respectively, p � 0.01) were all very signifi-cantly elevated in the cancer group.
Expression of biomarker panel in lung cancer
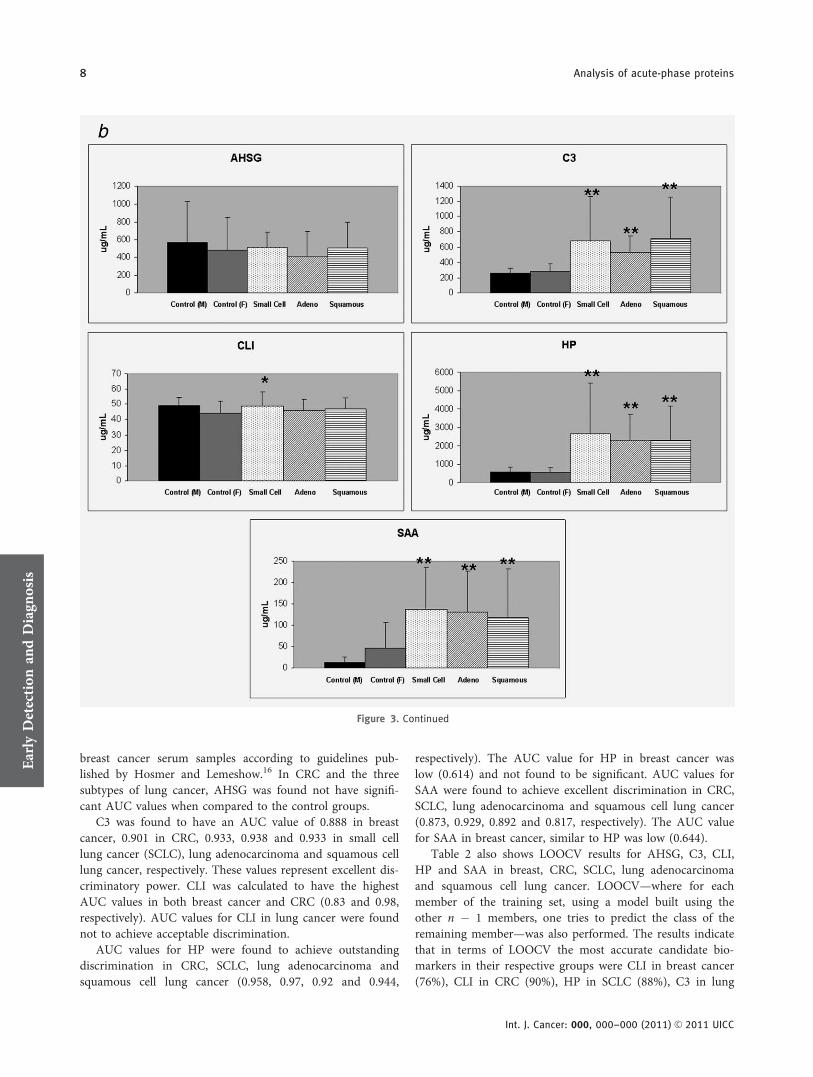
Box plot analysis of the five-candidate biomarkers in serumfrom patients with lung cancer was performed by comparingthe median levels of the control group with that from smallcell, adenocarcinoma and squamous cell carcinoma (Fig. 3a).
Figure 2. Continued
Early
Detection
andDiagn
osis
6 Analysis of acute-phase proteins
Int. J. Cancer: 000, 000–000 (2011) VC 2011 UICC

C3 (517.3 lg/ml vs. 1011.1 lg/ml, 873.8 lg/ml, 1043.4 lg/ml,respectively; p � 0.01), HP (539.3 lg/ml vs. 1838.6 lg/ml,2126.7 lg/ml, 1652.8 lg/ml, respectively; p � 0.01) and SAA(9.8 lg/ml vs. 172.2 lg/ml, 141.6 lg/ml, 53.8 lg/ml, respec-tively; p � 0.01) were all found to be very significantly ele-vated in all these lung cancer serum samples (Fig. 3). MedianCLI levels very also found to be significantly increased in ad-enocarcinoma serum samples compared to controls (47.1 lg/ml vs. 54.8 lg/ml, respectively, p � 0.05). In total, serumsamples of 55 patients with lung cancer (12 small cell, 25 ad-enocarcinoma and 18 squamous cell carcinoma) were ana-
lyzed. Bar charts representing data collected for lung cancersamples show significant increases in abundance levels forC3, HP and SAA for small cell, adenocarcinoma and squa-mous serum samples compared to their respective controlgroups (Fig. 3b).
AUC and LOOCV analysis of individual biomarkers
The area under the receiver-operator characteristic curve(AUC ROC) value for these five candidate biomarkers wascalculated (Table 2). The AUC for AHSG (0.764) was foundto have good discriminatory power between control and
Figure 3. (a,b) Box-and-Whisker plots and Bar charts comparing AHSG, C3, CLI, HP and SAA levels in Lung cancer serum samples
compared to control groups. Box-and-Whisker plots represent data with boxes ranging from the 25th to the 75th percentile of the observed
distribution of values. The bold line of the box displays the median value for serum levels of AHSG, C3, CLI, HP and SAA in lung cancer
(small cell lung carcinoma, lung adenocarcinoma and squamous cell carcinoma of the lung) compared to controls. Whiskers span minimum
to maximum observed values. The bar charts display the mean and standard deviation for AHSG, C3, CLI, HP and SAA levels in Lung cancer
serum samples compared to controls. (*p � 0.05: significant; **p � 0.01: very significant).Early
Detection
andDiagn
osis
Dowling et al. 7
Int. J. Cancer: 000, 000–000 (2011) VC 2011 UICC
breast cancer serum samples according to guidelines pub-lished by Hosmer and Lemeshow.16 In CRC and the threesubtypes of lung cancer, AHSG was found not have signifi-cant AUC values when compared to the control groups.
C3 was found to have an AUC value of 0.888 in breastcancer, 0.901 in CRC, 0.933, 0.938 and 0.933 in small celllung cancer (SCLC), lung adenocarcinoma and squamous celllung cancer, respectively. These values represent excellent dis-criminatory power. CLI was calculated to have the highestAUC values in both breast cancer and CRC (0.83 and 0.98,respectively). AUC values for CLI in lung cancer were foundnot to achieve acceptable discrimination.
AUC values for HP were found to achieve outstandingdiscrimination in CRC, SCLC, lung adenocarcinoma andsquamous cell lung cancer (0.958, 0.97, 0.92 and 0.944,
respectively). The AUC value for HP in breast cancer waslow (0.614) and not found to be significant. AUC values forSAA were found to achieve excellent discrimination in CRC,SCLC, lung adenocarcinoma and squamous cell lung cancer(0.873, 0.929, 0.892 and 0.817, respectively). The AUC valuefor SAA in breast cancer, similar to HP was low (0.644).
Table 2 also shows LOOCV results for AHSG, C3, CLI,HP and SAA in breast, CRC, SCLC, lung adenocarcinomaand squamous cell lung cancer. LOOCV—where for eachmember of the training set, using a model built using theother n � 1 members, one tries to predict the class of theremaining member—was also performed. The results indicatethat in terms of LOOCV the most accurate candidate bio-markers in their respective groups were CLI in breast cancer(76%), CLI in CRC (90%), HP in SCLC (88%), C3 in lung
Figure 3. Continued
Early
Detection
andDiagn
osis
8 Analysis of acute-phase proteins
Int. J. Cancer: 000, 000–000 (2011) VC 2011 UICC
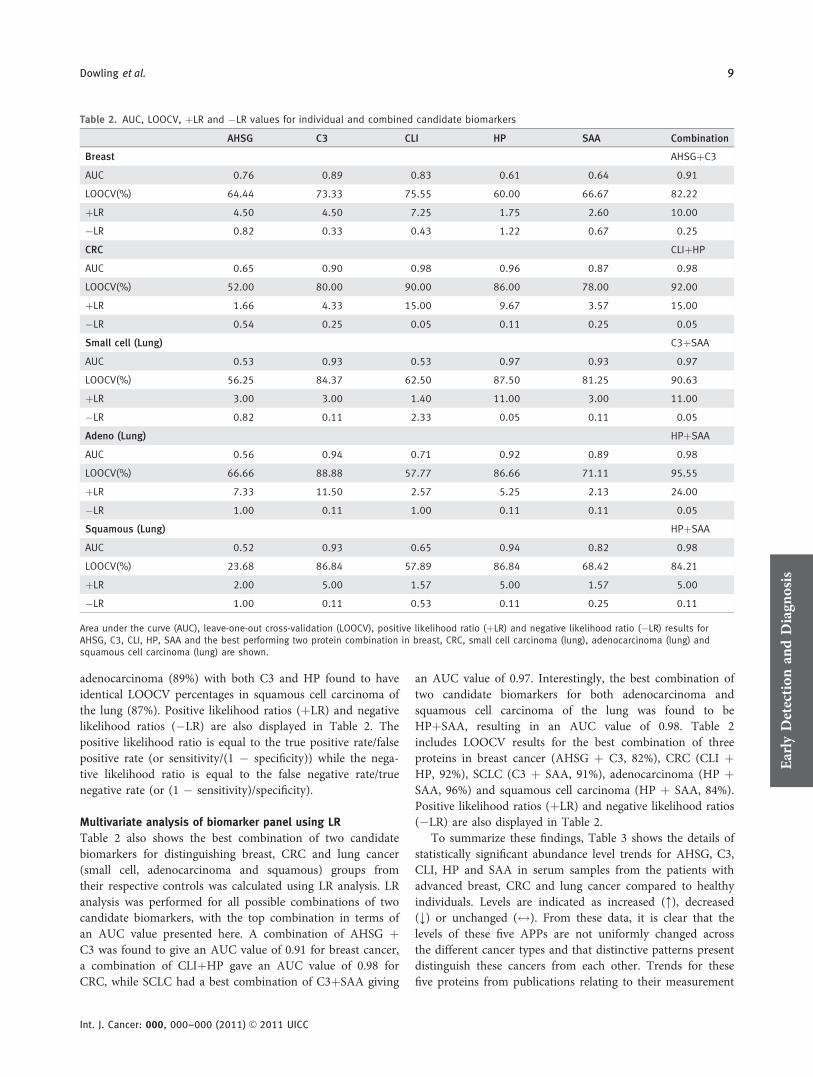
adenocarcinoma (89%) with both C3 and HP found to haveidentical LOOCV percentages in squamous cell carcinoma ofthe lung (87%). Positive likelihood ratios (þLR) and negativelikelihood ratios (�LR) are also displayed in Table 2. Thepositive likelihood ratio is equal to the true positive rate/falsepositive rate (or sensitivity/(1 � specificity)) while the nega-tive likelihood ratio is equal to the false negative rate/truenegative rate (or (1 � sensitivity)/specificity).
Multivariate analysis of biomarker panel using LR
Table 2 also shows the best combination of two candidatebiomarkers for distinguishing breast, CRC and lung cancer(small cell, adenocarcinoma and squamous) groups fromtheir respective controls was calculated using LR analysis. LRanalysis was performed for all possible combinations of twocandidate biomarkers, with the top combination in terms ofan AUC value presented here. A combination of AHSG þC3 was found to give an AUC value of 0.91 for breast cancer,a combination of CLIþHP gave an AUC value of 0.98 forCRC, while SCLC had a best combination of C3þSAA giving
an AUC value of 0.97. Interestingly, the best combination oftwo candidate biomarkers for both adenocarcinoma andsquamous cell carcinoma of the lung was found to beHPþSAA, resulting in an AUC value of 0.98. Table 2includes LOOCV results for the best combination of threeproteins in breast cancer (AHSG þ C3, 82%), CRC (CLI þHP, 92%), SCLC (C3 þ SAA, 91%), adenocarcinoma (HP þSAA, 96%) and squamous cell carcinoma (HP þ SAA, 84%).Positive likelihood ratios (þLR) and negative likelihood ratios(�LR) are also displayed in Table 2.
To summarize these findings, Table 3 shows the details ofstatistically significant abundance level trends for AHSG, C3,CLI, HP and SAA in serum samples from the patients withadvanced breast, CRC and lung cancer compared to healthyindividuals. Levels are indicated as increased (:), decreased(;) or unchanged ($). From these data, it is clear that thelevels of these five APPs are not uniformly changed acrossthe different cancer types and that distinctive patterns presentdistinguish these cancers from each other. Trends for thesefive proteins from publications relating to their measurement
Table 2. AUC, LOOCV, þLR and �LR values for individual and combined candidate biomarkers
AHSG C3 CLI HP SAA Combination
Breast AHSGþC3
AUC 0.76 0.89 0.83 0.61 0.64 0.91
LOOCV(%) 64.44 73.33 75.55 60.00 66.67 82.22
þLR 4.50 4.50 7.25 1.75 2.60 10.00
�LR 0.82 0.33 0.43 1.22 0.67 0.25
CRC CLIþHP
AUC 0.65 0.90 0.98 0.96 0.87 0.98
LOOCV(%) 52.00 80.00 90.00 86.00 78.00 92.00
þLR 1.66 4.33 15.00 9.67 3.57 15.00
�LR 0.54 0.25 0.05 0.11 0.25 0.05
Small cell (Lung) C3þSAA
AUC 0.53 0.93 0.53 0.97 0.93 0.97
LOOCV(%) 56.25 84.37 62.50 87.50 81.25 90.63
þLR 3.00 3.00 1.40 11.00 3.00 11.00
�LR 0.82 0.11 2.33 0.05 0.11 0.05
Adeno (Lung) HPþSAA
AUC 0.56 0.94 0.71 0.92 0.89 0.98
LOOCV(%) 66.66 88.88 57.77 86.66 71.11 95.55
þLR 7.33 11.50 2.57 5.25 2.13 24.00
�LR 1.00 0.11 1.00 0.11 0.11 0.05
Squamous (Lung) HPþSAA
AUC 0.52 0.93 0.65 0.94 0.82 0.98
LOOCV(%) 23.68 86.84 57.89 86.84 68.42 84.21
þLR 2.00 5.00 1.57 5.00 1.57 5.00
�LR 1.00 0.11 0.53 0.11 0.25 0.11
Area under the curve (AUC), leave-one-out cross-validation (LOOCV), positive likelihood ratio (þLR) and negative likelihood ratio (�LR) results forAHSG, C3, CLI, HP, SAA and the best performing two protein combination in breast, CRC, small cell carcinoma (lung), adenocarcinoma (lung) andsquamous cell carcinoma (lung) are shown.
Early
Detection
andDiagn
osis
Dowling et al. 9
Int. J. Cancer: 000, 000–000 (2011) VC 2011 UICC

in infection/inflammatory conditions are also shown in theTable 3, with these data serving as a good control to comparethe cancer-specific trends as well.
DiscussionAPPs are characterized by a nonspecific rapid response tostimuli such as inflammation (infections, autoimmune dis-eases, etc.) or tissue damage (trauma, surgery, myocardial in-farction or tumors). Some proteins (e.g., haptoglobin, C3 andSAA) will increase in response to an acute-phase reactionand are known as positive APPs. Others (e.g., AHSG)decrease and are known as negative APPs.
When APPs are found to be differentially expressedbetween disease and control populations in proteomicsexperiments, researchers often dismiss that these results asuninteresting because, by definition, these proteins have anincreased or decreased abundance level in many conditionsthat cause inflammation. Because these changes are not spe-cific for a condition or disease, they are often thought tohave little potential as conventional biomarkers for diagnosisor prognosis. However, the potential of APPs as biomarkersfor cancer may have been underestimated. All the APPs donot have an increased or decreased abundance level across allcancer types. A recent review by Pang et al. indicates thepresence of putative APP fingerprints in patients with can-cer.8 Data was compiled from many international biomarkerdiscovery studies and merged with data generated by Pangand colleges. From the overall pattern that was derived fromthe compiled data, the altered serum APP profiles of patientsappear to be unique for each type of cancer. For example,pancreatic cancer is associated with increased levels of seruma1-antitrypsin, a1-antichymotrypsin, complement factor Band Leucine-rich glycoprotein, whereas breast cancer is asso-ciated with enhanced levels of a1-antichymotrypsin, comple-ment factor B and CLI and decreased Kininogen.
In our study, based on earlier work analyzing serum frompatients with squamous cell carcinoma of the lung,11 weexamined the abundance levels for AHSG, C3, CLI, HP andSAA in serum samples from patients with advanced breast,CRC and lung cancer compared to healthy individuals.AHSG, C3, HP and SAA are considered APPs while CLI isalso called an APP but more often referred to as an abundant
secreted serum glycoprotein that may play a significant rolein tumor growth and metastatic progression.22
SAA is a major acute-phase reactant and has been demon-strated to mediate proinflammatory cellular responses.23 SAAis expressed mainly by hepatocytes in the liver. Bacterial lipo-polysaccharides and several cytokines (not only IL1, IL6 andTNF but also LIF, CNTF, oncostatin M, IL11 and cardiotro-phin-1) are involved in the induction of SAA synthesis.24 Inour investigation, we found that SAA levels were significantlychanged between control and cancer groups, particularly inadvanced CRC and subtypes of advanced lung cancer. Subse-quent ROC curve analysis demonstrated that the AUC valuewas high, achieving excellent or outstanding discriminatorypower. However, although the level of SAA in advanced breastcancer was also significant compared to the control group, theAUC value was low, indicating poorer discriminatory power.
AHSG and C3 are negative and positive APPs, respectively.AHSG is a 59 kDa glycoprotein predominantly synthesized inliver and has recently been shown to be involved in mediatinggrowth signalling in breast tumor cells.25 In our investigation, dif-ferential expression of AHSG was found to be significant only inbreast cancer, with decreased abundance levels compared to thecontrol group. Petrik and coworkers identified one peak usingSELDI-TOF as the AHSG that was less prominent with increas-ing tumor grade in patients with glioblastoma. AHSG was there-fore subsequently validated as a survival predictor in glioblas-toma using ELISA in an independent group of 72 patients withglioblastoma.26 C3 was found to be elevated in all cancer typesinvestigated in our study with high AUC values. C3 is a majorcomponent of the complement system and elevated levels of thisAPP have previously been reported associated with cancer.27 C3has previously been found to be elevated in sera from patientsdiagnosed with pancreatic adenocarcinoma compared to serafrom normal volunteers using gel electrophoresis.28
CLI is a pleiotropic protein with a broad range of func-tions including tumor growth and metastatic progression.The literature links expression levels of CLI (both nuclearand secreted forms) with CRC.28–31 In CRC, an increase ofsecreted CLI expression occurs, whereas the nuclear proapop-totic form is decreased.32 From the data presented here, it isalso clear based on AUC and LOOCV values that CLI is themost accurate candidate biomarker for distinguishing CRCfrom its control group.
Table 3. abundance level trends for AHSG, C3, CLI, HP and SAA
Protein Breast CRC Small cell (lung) Adeno (Lung) Squamous (Lung) Inflammation/Infection
AHSG ; $ $ $ $ ; [46]
C3 : : : : : : [47]
CLI : : $ : $ : [48]
HP $ : : : : : [49]
SAA : : : : : : [50]
Table showing statistically significant abundance level trends for AHSG, C3, CLI, HP and SAA in serum samples from patients with advanced breast,CRC and lung cancer compared to healthy individuals. Levels are indicated as increased (:), decreased (;) or unchanged ($). As a reference, levelsfor these five proteins are also included for general inflammatory conditions as indicated in the referenced literature.17–21.
Early
Detection
andDiagn
osis
Int. J. Cancer: 000, 000–000 (2011) VC 2011 UICC
10 Analysis of acute-phase proteins

Several studies have shown decreased CLI levels in pros-tate cancer.33,34 On the other hand, there are also reports onincreased expression of CLI in prostate cancer, specifically af-ter androgen ablation therapy.35 These opposing results havebeen explained by the different isoforms of CLI, for example,proapoptotic nuclear CLI being decreased, while antiapop-totic, prosurvival secreted CLI could be increased.
An interesting observation from this data is that CLI lev-els are increased at a very significant level in both CRC andbreast cancer. CLI was also found to be significantly elevatedin adenocarcinoma of the lung but not in squamous cell orsmall cell carcinomas. As the majority of both CRC andbreast cancers are adenocarcinomas, this data suggests a pos-sible link between higher levels of secreted CLI andadenocarcinomas.
Haptoglobin is a tetrameric plasma glycoprotein producedprimarily by hepatocytes but reports of extrahepatic site pro-duction have been reported.36 Its synthesis is induced by vari-ous cytokines, including IL1, IL6 and CNTF.37 Recently, somegroups have examined the individual HP chains (a and b) andalso various modified forms including glycosylated and deami-dated variants to establish how significant such isoforms are fordistinguishing between control and cancer groups,38 with initialresults indicate that specific HP isoforms may have a role toplay in the detection of cancer.39,40 Our data indicates that HPwas significantly increased in CRC and the three subtypes oflung cancer when compared to their respective control groups.In all cases, high AUC values were achieved indicating excellentdiscriminatory power for this individual protein. However, nosignificant change was found when advanced breast cancerserum samples were compared to the control group.
Elevated levels of APPs in the serum of patients withcancer are generally believed to be of liver origin rather than atumor cell product.41 However, there is also evidence in theliterature that APPs could also be directly produced by thedisease tissue. Expression studies show local production ofSAA proteins in histologically normal, inflammatory and tu-mor tissues.42 For example, Gutfeld and coworkers showed,using nonradioactive in situ hybridization on paraffin tissuesections from 26 patients with CRC, detectable SAA mRNAexpression in normal looking colonic epithelium. Expressionwas increased gradually as epithelial cells progressed throughdysplasia to neoplasia, with deeply invading colon carcinomacells showed the highest levels of SAA. Therefore, using APPsas part of a diagnostic panel may be more tumor specific thatinitially realized. Smeets and coworkers demonstrated that inhuman kidney tumors, both tumor and stromal cells producedhaptoglobin mRNA.43 Apparently, ectopic production of pro-teins is a frequent characteristic of tumors, with APPs provingto have functional roles in tumor development.43,44
Among the biomarkers most often used to monitorpatients with advanced cancer or to determine recurrence arecancer antigen 15-3 (CA 15-3), cancer antigen 27.29 (CA27.29), carcino-embryonic antigen (CEA) and neuron-specificenolase (NSE). CA 15-3 and CA27.29 are highly associated
with breast cancer and are derived from the MUC1 gene. CA15-3 is elevated in the serum/plasma of � 75% of women withmetastasized breast cancer; however, these levels can also beraised due to the presence of other conditions or cancers. Pec-tasides and coworkers found that patients with postsurgicalbreast cancer prospectively monitored with simultaneous se-rum level estimations for CA 15-3 and CEA, resulted in sensi-tivity values of 68.2 and 34.1% respectively.45 The markersmost often elevated in advanced CRC are CEA and CA 19-9,but neither of these is useful as a screening test for CRC. Morethan 70% of patients with advanced CRC have elevated CEAlevels.46 Some of the tumor markers that may be elevated inadvanced lung cancer are the carcinoembryonic antigen(CEA) in non-small cell lung cancer and the NSE in SCLC.
Molina and coworkers have recently published on serumlevels of ProGRP (Pro-Gastrin-Releasing Peptide), CEA,squamous cell carcinoma antigen (SCC), CA 125 (cancerantigen 125), CYFRA 21-1 (cytokeratin 19 fragments) andNSE in patients with lung cancer and how these measure-ments correlated with histology.47,48 It was concluded thatthese markers may be useful in the histological differentiationof non-small cell lung carcinoma (NSCLC) and SCLC.Patients with SCC serum levels >2 ng/ml were alwaysNSCLC, while those with SCC <2 ng/ml and ProGRP >100pg/ml and NSE >35 ng/ml were all patients with SCLC. Cor-rect classification has important implications for clinicalmanagement and panels of biomarkers that can be used incombination with histology to accurately diagnose the specifictype of lung cancer would have significant clinical utility.
From the literature, it is clear that while all these bio-markers are currently used in the clinic, these biomarkers stillsuffer from low levels of sensitivity and specificity, highlight-ing a need for additional biomarkers that will help to improvethe overall accuracy for these tests. One difficulty in interpret-ing serologic data is the potential for spikes in protein abun-dance levels due to the presence of infection and signaturesassociated with its presence. Therefore, combination of bio-markers such as CA 15-3 and CEA, which are commonly usedin the clinic together with some of the candidate biomarkersdiscussed in our study, may help improve the overall accuracyfor monitoring advanced patients with cancer and help over-come the problems associated with infection-mediated APPsignatures. Furthermore, the optimum pairs of biomarkersdescribed here are different in each of the cancer types, andthese cancer-related values should be persistent, whereas infec-tion-related values would be expected to spike and to be lessspecific for any pair of APPs. Additionally, in terms of clinicalmanagement, other symptoms of infection would be apparent.
Prostate-specific antigen (PSA), an FDA-approved bio-marker, has been found to be reasonably successful for pros-tate cancer diagnosis; however, false positives and negativesare common.49 However, generally single biomarkers lack thesensitivity and specificity required for them to be consideredworthwhile diagnostics. To overcome this problem, panels ofbiomarkers are now seen as providing that extra sensitivity
Early
Detection
andDiagn
osis
Int. J. Cancer: 000, 000–000 (2011) VC 2011 UICC
Dowling et al. 11
and specificity to increase the overall accuracy of diagnostictests.50 We investigated various combinations of two candi-date biomarkers using LR analysis, to examine if the AUCvalues for individual markers for each of the cancer typescould be improved upon. Our data revealed that specificcombinations of two candidate biomarkers outperformed(breast, lung adenocarcinoma and squamous cell carcinomaof the lung) or equalled (CRC and small cell lung carcinoma)their single counterpart. The combinations for breast cancer(AHSG þ C3), CRC (CLI þ HP) and SCLC (C3 þ SAA)were all found to be different from each other. Interestingly,the best combination of two candidate biomarkers for bothlung adenocarcinoma and squamous cell carcinoma of thelung was found to be HP þ SAA. This data supports thepossibility that patterns of altered serum APP in patientswith different cancers exist as the best combinations werefound to be different with the exception of lung adenocarci-noma and squamous cell carcinoma of the lung.
Counter-intuitively, combining the two candidate bio-markers with the best AUC values together using LR analysisdid not always results in the best combination in terms of ac-curacy. For example, the best individual candidate bio-markers in the breast cancer comparison were C3 (AUC ¼0.89, LOOCV ¼ 73%) and CLI (AUC ¼ 0.83, LOOCV ¼76%). However, after analysis of all possible combination oftwo biomarkers, it was found that AHSGþC3 (AUC ¼ 0.91,LOOCV ¼ 82%) was found to be the best combination. Thereasons for this antagonism are not entirely clear but thishighlights the fact that members of a biomarker panel neednot necessarily have the best individual score for distinguish-
ing between groups with the real value of these biomarkersbeing recognized when used in combination.
In our study, we included both AUC and LOOCV valuesfor all individual and combined biomarkers. ROC curves cansometimes present an overly optimistic result and the pres-ence of LOOCV values helps to balance the results and painta more realistic picture as regards the accuracy of candidatebiomarkers. For example, in the dataset presented here, theAUC and LOOCV values for CLI in CRC were 0.98 and 90%respectively, but it is likely that the 90% value based on theLOOCV calculation better reflects the true accuracy for thiscandidate biomarker.
A variety of cytokines, chemokines and growth factors areproduced by tumor cells and by different cells in the local tu-mor environment. This signature of active molecules is likely todiffer between tumor types and disease stages resulting in thestimulation of APPs that reflect the type and stage of the malig-nancy. Although individual APPs may not satisfactory diagno-sis biomarkers, in combination or with other serum biomarkersmay enable more sensitive and specific tests. Therefore APPsmay represent a worthwhile component in a panel of bio-markers that represent the tumor microenvironment. Our dataindicate that specific patterns of altered serum APPs exist inpatients with different cancers and further research is warrantedto assess the value of theses patterns in applications such asdiagnosis of recurrence and monitoring of therapy effectiveness.
AcknowledgementThe All-Ireland Cooperative Oncology Research Group (ICORG) assisted inthe provision of clinical samples.
References
1. Jemal A, Siegel R, Xu J, Ward E. CancerStatistics, 2010. CA Cancer J Clin 2010;60:277–300.
2. Higa GM. Breast cancer: beyond thecutting edge. Exp Opin Pharmacother 2009;10:2479–98.
3. Brooks DD, Wolf A, Smith RA, Dash C,Guessous I. Prostate cancer screening 2010:updated recommendations from theAmerican Cancer Society. J Natl Med Assoc2010;102:423–9.
4. Simpson RJ, Bernhard OK, Greening DW,Moritz RL. Proteomics-driven cancerbiomarker discovery: looking to the future.Curr Opin Chem Biol 2008;12:72–7.
5. Boja E, Hiltke T, Rivers R, Kinsinger CR,Rahbar A, Mesri M, Rodriguez H. Theevolution of clinical proteomics and its rolein medicine. J Proteome Res 2011;10:66–84.
6. Tu C, Rudnick PA, Martinez MA, CheekKL, Stein SE, Slebos RJ, Liebler DC.Depletion of abundant plasma proteins andlimitations of plasma proteomics. JProteome Res 2010;9:4982–91.
7. Wood SL, Rogers M, Cairns DA, Paul A,Thompson D, Vasudev NS, Selby PJ, Banks
RE. Association of serum amyloid Aprotein and peptide fragments withprognosis in renal cancer. Br J Cancer2010;103:101–11.
8. Pang WW, Abdul-Rahman PS, Wan-Ibrahim WI, Hashim OH. Can the acute-phase reactant proteins be used as cancerbiomarkers? Int J Biol Markers 2010;25:1–11.
9. Cho WC, Yip TT, Yip C, Yip V,Thulasiraman V, Ngan RK, Yip TT, LauWH, Au JS, Law SC, Cheng WW, Ma VW,et al. Identification of serum amyloid aprotein as a potentially useful biomarker tomonitor relapse of nasopharyngeal cancerby serum proteomic profiling. Clin CancerRes 2004;10:43–52.
10. Miyake H, Muramaki M, Furukawa J,Kurahashi T, Fujisawa M. Serum level ofclusterin and its density in men withprostate cancer as novel biomarkersreflecting disease extension. Urology 2010;75:454–9.
11. Dowling P, O’Driscoll L, Meleady P, HenryM, Roy S, Ballot J, Moriarty M, Crown J,Clynes M. 2-D difference gel
electrophoresis of the lung squamous cellcarcinoma versus normal serademonstrates consistent alterations in thelevels of ten specific proteins.Electrophoresis 2007;28:4302–10.
12. Petri AL, Simonsen AH, Hogdall E,Christensen IJ, Kjaer SK, Yip C, Risum S,Pedersen AT, Hartwell D, Fung ET,Hogdall C. Comparison of proteomicbiomarker panels in urine and serum forovarian cancer diagnosis. Proteomics ClinAppl 4:304–14.
13. Bitterlich N, Muley T, Schneider J. Centre-independent detection of non-small celllung cancer (NSCLC) by means ofclassification with receiver operatingcharacteristic (ROC)-based datatransformation. Anticancer Res30:1661–5.
14. Bloom GC, Eschrich S, Zhou JX, CoppolaD, Yeatman TJ. Elucidation of a proteinsignature discriminating six common typesof adenocarcinoma. Int J Cancer 2007;120:769–75.
15. Ragazzi E, Pucciarelli S, Seraglia R, MolinL, Agostini M, Lise M, Traldi P, Nitti D.
Early
Detection
andDiagn
osis
Int. J. Cancer: 000, 000–000 (2011) VC 2011 UICC
12 Analysis of acute-phase proteins
Multivariate analysis approach to theplasma protein profile of patients withadvanced colorectal cancer. J MassSpectrom 2006;41:1546–53.
16. Hosmer D, Lemeshow S. Applied logisticregression, Wiley Series in probability andstatistics, 2nd edn., Wiley, 2000.
17. Kazama JJ. What does the circulatingAHSG/fetuin-A level tell us? Clin ExpNephrol 2007;11:336–7.
18. Petersen NE, Elmgreen J, Teisner B,Svehag SE. Activation of classical pathwaycomplement in chronic inflammation.Elevated levels of circulating C3d and C4dsplit products in rheumatoid arthritis andCrohn’s disease. Acta Med Scand 1988;223:557–60.
19. Nuutinen T, Suuronen T, Kauppinen A,Salminen A. Clusterin: a forgotten playerin Alzheimer’s disease. Brain Res Rev 2009;61:89–104.
20. Quaye IK. Haptoglobin, inflammation anddisease. Trans R Soc Trop Med Hyg 2008;102:735–42.
21. dos Anjos BL, Grotto HZ. Evaluation of C-reactive protein and serum amyloid A inthe detection of inflammatory andinfectious diseases in children. Clin ChemLab Med 48:493–9.
22. Hardardottir I, Kunitake ST, Moser AH,Doerrler WT, Rapp JH, Grunfeld C,Feingold KR. Endotoxin and cytokinesincrease hepatic messenger RNA levels andserum concentrations of apolipoprotein J(clusterin) in Syrian hamsters. J Clin Invest1994;94:1304–9.
23. Malle E, Sodin-Semrl S, Kovacevic A.Serum amyloid A: an acute-phase proteininvolved in tumour pathogenesis. Cell MolLife Sci 2009;66:9–26.
24. Ganapathi MK, Rzewnicki D, Samols D,Jiang SL, Kushner I. Effect of combinationsof cytokines and hormones on synthesis ofserum amyloid A and C-reactive protein inHep 3B cells. J Immunol 1991;147:1261–5.
25. Sakwe AM, Koumangoye R, Goodwin SJ,Ochieng J. Fetuin-A (ahsg) is a majorserum adhesive protein that mediatesgrowth signaling in breast tumor cells.J Biol Chem.
26. Petrik V, Saadoun S, Loosemore A, HobbsJ, Opstad KS, Sheldon J, Tarelli E, HoweFA, Bell BA, Papadopoulos MC. Serumalpha 2-HS glycoprotein predicts survivalin patients with glioblastoma. Clin Chem2008;54:713–22.
27. Qiu Y, Patwa TH, Xu L, Shedden K, MisekDE, Tuck M, Jin G, Ruffin MT, TurgeonDK, Synal S, Bresalier R, Marcon N, et al.Plasma glycoprotein profiling for colorectalcancer biomarker identification by lectinglycoarray and lectin blot. J Proteome Res2008;7:1693–703.
28. Hanas JS, Hocker JR, Cheung JY, LarabeeJL, Lerner MR, Lightfoot SA, Morgan DL,Denson KD, Prejeant KC, Gusev Y, SmithBJ, Hanas RJ, et al. Biomarkeridentification in human pancreatic cancersera. Pancreas 2008;36:61–9.
29. Andersen CL, Schepeler T, Thorsen K,Birkenkamp-Demtroder K, Mansilla F,Aaltonen LA, Laurberg S, Orntoft TF.Clusterin expression in normal mucosa andcolorectal cancer. Mol Cell Proteomics2007;6:1039–48.
30. Pucci S, Bonanno E, Sesti F, Mazzarelli P,Mauriello A, Ricci F, Zoccai GB, Rulli F,Galata G, Spagnoli LG. Clusterin in stool: anew biomarker for colon cancer screening?Am J Gastroenterol 2009;104:2807–15.
31. Pucci S, Mazzarelli P, Nucci C, Ricci F,Spagnoli LG. CLU ‘‘in and out’’: lookingfor a link. Adv Cancer Res 2009;105:93–113.
32. Mazzarelli P, Pucci S, Spagnoli LG. CLUand colon cancer. The dual face of CLU:from normal to malignant phenotype. AdvCancer Res 2009;105:45–61.
33. Scaltriti M, Brausi M, Amorosi A, CaporaliA, D’Arca D, Astancolle S, Corti A,Bettuzzi S. Clusterin (SGP-2, ApoJ)expression is downregulated in low- andhigh-grade human prostate cancer. Int JCancer 2004;108:23–30.
34. Rauhala HE, Porkka KP, Saramaki OR,Tammela TL, Visakorpi T. Clusterin isepigenetically regulated in prostate cancer.Int J Cancer 2008;123:1601–9.
35. July LV, AkbariM, Zellweger T, Jones EC,Goldenberg SL, GleaveME. Clusterinexpression is significantly enhanced inprostate cancer cells following androgenwithdrawal therapy. Prostate 2002;50:179–88.
36. Smeets MB, Fontijn J, Kavelaars A,Pasterkamp G, De Kleijn DP. The acutephase protein haptoglobin is locallyexpressed in arthritic and oncologicaltissues. Int J Exp Pathol 2003;84:69–74.
37. Yoshioka M, Watanabe A, Shimada N,Murata H, Yokomizo Y, Nakajima Y.Regulation of haptoglobin secretion byrecombinant bovine cytokines in primarycultured bovine hepatocytes. Domest AnimEndocrinol 2002;23:425–33.
38. Shah A, Singh H, Sachdev V, Lee J,Yotsukura S, Salgia R, Bharti A.Differential serum level of specifichaptoglobin isoforms in small cell lungcancer. Curr Proteomics 7:49–65.
39. Chen CB, Su YC, Huang TT, Ho HC,Chang YT, Tung YT, Lee WC.Differentially expressed serum haptoglobinalpha chain isoforms with potentialapplication for diagnosis of headand neck cancer. Clin Chim Acta 2008;398:48–52.
40. Hamrita B, Chahed K, Trimeche M,Guillier CL, Hammann P, Chaieb A, KorbiS, Chouchane L. Proteomics-basedidentification of alpha1-antitrypsin andhaptoglobin precursors as novel serummarkers in infiltrating ductal breastcarcinomas. Clin Chim Acta 2009;404:111–8.
41. Kumar DM, Thota B, Shinde SV, PrasannaKV, Hegde AS, Arivazhagan A,Chandramouli BA, Santosh V,Somasundaram K. Proteomic identificationof haptoglobin alpha2 as a glioblastomaserum biomarker: implications in cancercell migration and tumor growth.J Proteome Res 9:5557–67.
42. Gutfeld O, Prus D, Ackerman Z, Dishon S,Linke RP, Levin M, Urieli-Shoval S.Expression of serum amyloid A, in normal,dysplastic, and neoplastic human colonicmucosa: implication for a role in colonictumorigenesis. J Histochem Cytochem 2006;54:63–73.
43. Lau SH, Sham JS, Xie D, Tzang CH, TangD,MaN, Hu L,Wang Y,Wen JM, Xiao G,ZhangWM, Lau GK, et al. Clusterin plays animportant role in hepatocellular carcinomametastasis.Oncogene 2006;25:1242–50.
44. Hsu SJ, Nagase H, Balmain A.Identification of Fetuin-B as a member of acystatin-like gene family on mousechromosome 16 with tumor suppressoractivity. Genome 2004;47:931–46.
45. Pectasides D, Pavlidis N, Gogou L,Antoniou F, Nicolaides C, Tsikalakis D.Clinical value of CA 15-3, mucin-likecarcinoma-associated antigen, tumorpolypeptide antigen, and carcinoembryonicantigen in monitoring early breast cancerpatients. Am J Clin Oncol 1996;19:459–64.
46. Moertel CG, O’Fallon JR, Go VL,O’Connell MJ, Thynne GS. Thepreoperative carcinoembryonic antigen testin the diagnosis, staging, and prognosis ofcolorectal cancer. Cancer 1986;58:603–10.
47. Molina R, Holdenrieder S, Auge JM,Schalhorn A, Hatz R, Stieber P. Diagnosticrelevance of circulating biomarkers inpatients with lung cancer. Cancer Biomark2010;6:163–78.
48. Molina R, Auge JM, Bosch X, EscuderoJM, Vinolas N, Marrades R, Ramirez J,Carcereny E, Filella X. Usefulness of serumtumor markers, including progastrin-releasing peptide, in patients with lungcancer: correlation with histology. TumourBiol 2009;30:121–9.
49. Schroder FH. PSA screening—a review ofrecent studies. Eur J Cancer 2009;45(Suppl1):402–4.
50. Hanash SM, Pitteri SJ, Faca VM. Miningthe plasma proteome for cancerbiomarkers. Nature 2008;452:571–9.
Early
Detection
andDiagn
osis
Int. J. Cancer: 000, 000–000 (2011) VC 2011 UICC
Dowling et al. 13