analysis of a putative cyclooxygenase from trypanosoma
TRANSCRIPT

Analysis of a putative cyclooxygenase from Trypanosoma brucei and
its eligibility as a possible drug target
Analyse einer putativen Cyclooxygenase aus Trypanosoma brucei
und ihrer Eignung als mögliches Medikamenten-Ziel
Dissertation
der Mathematisch-Naturwissenschaftlichen Fakultät
der Eberhard Karls Universität Tübingen
zur Erlangung des Grades eines
Doktors der Naturwissenschaften
(Dr. rer. nat.)
vorgelegt von
Célestin Nzanzu Mudogo
aus
Kinshasa, DR Kongo
Tübingen
2017

Tag der mündlichen Qualifikation: 28.07.2017
Dekan: Prof. Dr. Wolfgang Rosenstiel
1. Berichterstatter: Prof. Dr. Michael Duszenko
2. Berichterstatter: PD. Dr. Benjamin Mordmüller

I Dedicate this thesis
to my beloved parents Mudogo Virima and Vumilia Nsigayehe and
to Wolf and Batzner families in Würzburg & Mudogo´s family members in DRCongo
Acknowledgements
This thesis was a challenging and eventful journey. Numerous friends, family, and institutions have been
extremely supportive and have done well to keep me traveling in the right direction for the past five years.
First of all, I would like to express my sincere thanks and gratitude to my supervisor Prof. Dr. Michael
Duszenko for his guidance, encouragement and giving me the opportunity to carry out this research project in
his lab at the Interfaculty Institute of Biochemistry (IFIB) - Eberhard-Karls University of Tübingen. I am
extremely grateful for his guiding light spirit, suggestions and discussions.
I am very much indebted with gratitude to my second supervisor PD. Dr. Benjamin Mordmüller for his interest
upon my thesis and for accepting to be the second referee.
I am grateful to Professors: Dirk Schwarzer and Thilo Stehle for kindly accepting to serve on the evaluation
committee.
I am grateful to Prof. Dr. Dr. Christian Betzel for kindly welcome me in his lab at DESY-Hamburg and for
sharing knowledge and experience in vitro or in vivo protein crystallization. I would also like to express my
profound sense of gratitude to Dr. Tatyana Danyukova and Dr. Theresa Nuguid for protein crystal
characterization analysis and providing me the data.
I am thankful and grateful to DAAD (German academic exchange service) for granting Fellowship for the
German language course and funding the PhD.
I am extremely grateful to the Förderverein Uni Kinshasa e.V (fUNIKIN) for the Bourse d´Excellence
Bringmann aux Universités Congolaises (BEBUC) as PhD scholar since 2012 till the completion of my PhD
thesis. I am expressing my sincere gratitude to the BEBUC selection committee for their trust and support
endowed upon me.
I would take this opportunity to thank the people who helped me during this thesis; my entire research work
was performed at Duszenko lab group. First, my big thanks to all the former members of the group for the
friendly atmosphere and lot of brainstorming discussions. I have learned not just about the German culture but
also acquired the skills of doing great research work. Vielen Dank! Second, I am thankful to all the internship
and bachelor students for their hard work, contribution, and motivation during the running time of my
doctorate research project. Especial thanks to Salesia-Franciska Werner and Danyang Xu.
Sincere thanks to Dr. Stefan Mogk for all the helpful discussions, many English to German translations,
Additionally, I would like to express my thanks to Prof. Dr. Ariel Silber, Dr. Katherine Figarella, Dr. Néstor
Uzcátegui and Flavia Damasceno for their valuable suggestions and discussions during their research time
visits in our lab.

Lastly, my special grateful to my German family friends: Wolf and Batzner families in Würzburg for the care
and help. Vielen Dank! My great thanks also to my beloved Mudogo family in Kinshasa for their prayers,
affection, support and love. Aksanti sana na Mungu Asifiwe! Thanks to Christine Wolf and Virima Mudogo
for proofreading my PhD thesis.
Finally, I like to apologize to all those people and friends I have forgotten to mention here who made
contributions to not only towards this thesis and research but played a role in my life.

I
Contents
1 Introduction ................................................................................................................................................ 1
1.1 Human African Trypanosomiasis ........................................................................................................ 1
1.1.1 Epidemiology ............................................................................................................................... 1
1.1.2 Clinical Features .......................................................................................................................... 3
1.1.3 Diagnosis...................................................................................................................................... 6
1.1.4 Treatment ..................................................................................................................................... 7
1.2 Trypanosoma brucei as pathogen ........................................................................................................ 9
1.2.1 Taxonomy of trypanosomes ......................................................................................................... 9
1.2.2 Morphology and Cell structure .................................................................................................. 10
1.2.3 Life Cycle................................................................................................................................... 12
1.3 RNA interference in Trypanosoma brucei ........................................................................................ 15
1.4 In vivo Protein Crystallization .......................................................................................................... 17
1.5 Structure determination from in vivo grown crystals ........................................................................ 19
1.6 Aims of this study.............................................................................................................................. 20
2 Research thesis description ...................................................................................................................... 23
2.1 Statement of the problem .................................................................................................................. 23
2.2 Justification ....................................................................................................................................... 23
3 Materials and Methods ............................................................................................................................. 25
3.1 Materials ............................................................................................................................................ 25
3.1.1 Bacteria strains ........................................................................................................................... 25
3.1.2 Trypanosoma strains .................................................................................................................. 25
3.1.3 Spodoptera frugiperda (Sf9) insect cells .................................................................................... 26
3.1.4 Antibodies .................................................................................................................................. 26
3.1.5 Plasmids ..................................................................................................................................... 26
3.1.6 Primers/Oligonucleotides ........................................................................................................... 26
3.1.7 Enzymes ..................................................................................................................................... 27

II
3.1.8 General Chemicals ..................................................................................................................... 27
3.1.9 Kits ............................................................................................................................................. 31
3.1.10 Media ......................................................................................................................................... 32
3.1.11 Buffers and solutions ................................................................................................................. 34
3.1.12 Consumables .............................................................................................................................. 39
3.1.13 Equipments ................................................................................................................................ 40
3.1.14 Databank and Softwares............................................................................................................. 41
3.2 Methods and Protocols ...................................................................................................................... 42
3.2.1 Standard protocols for molecular biology.................................................................................. 42
3.2.2 Cultivation and handling of organisms ...................................................................................... 47
3.2.3 Quantitative Real-time PCR (qRT-PCR) ................................................................................... 54
3.2.4 DAPI staining of Trypanosoma brucei cells .............................................................................. 57
3.2.5 Electron Microscopy .................................................................................................................. 57
3.2.6 Standard protocols for protein biochemistry.............................................................................. 59
3.2.7 Biophysics Methods ................................................................................................................... 63
3.2.8 In vivo crystallization in Sf9 insect cells ................................................................................... 63
4 Results ...................................................................................................................................................... 65
4.1 Description of the pTbCOX gene (Tb427.10.13790/Tb927.10.13790/Tb10.61.3130) and pTbCOX
protein .......................................................................................................................................................... 65
4.2 Expression, refolding and purification of pTbCOX .......................................................................... 68
4.3 Cloning and expression of pTbCOX in Sf9 insect cells and in vivo protein crystallization ............ 72
4.4 pTbCOX RNA interference (RNAi) studies and phenotypes analysis ............................................. 82
4.5 Cloning, expression, and localization of an eGFP fused with pTbCOX protein in Trypanosoma
brucei 93
5 Discussion ................................................................................................................................................ 99
5.1 Bioinformatics analysis of the hypothetical protein pTbCOX .......................................................... 99
5.2 Heterologous expression, refolding and purification of pTbCOX .................................................. 100
5.3 Heterologous expression of pTbCOX in Sf9 insect cells and in vivo protein crystallization ........ 102

III
5.4 Characterization of pTbCOX crystals ............................................................................................. 102
5.5 Knockdown studies of pTbCOX gene and phenotypes analysis ..................................................... 104
5.6 Expression of pTbCOX protein fused with eGFP in Trypanosoma brucei .................................... 106
6 Future perspectives on pTbCOX as drug target ..................................................................................... 108
7 Summary ................................................................................................................................................ 110
8 Zusammenfassung.................................................................................................................................. 113
9 Bibliography .......................................................................................................................................... 115
10 CURRICULUM VITAE ........................................................................................................................ 127

IV
Abbreviations
AA Arachidonic acid
AP Alkaline phosphatase
APS Ammonium persulfate
BBB Blood-brain barrier
BCB Blood-CSF-barrier
BCIP 5-Bromo-4-chloro-3-indolyl phosphate
BCS Bathocuproine disulfonic acid
BF Bloodstream form
BME 2-ß-Mercarptoethanol
Bp Base pairs
BSA Bovine serum albumin
CATT Card agglutination test for trypanosomiasis
CD Circular dichroism
CGA Citrate glucose anticoagulant
CNS Central nervous system
COX Cyclooxygenase
CSF Cerebrospinal fluid
CVOs Circumventricular organs
DAPI 4´, 6-Diamidino-2-phenylindole
DDSA Dodecenylsuccinic Anhydride
DEAE Diethylaminoethyl
DFMO Difluoromethylornithine
dH2O Distilled water
DLS Dynamic light scattering
DMSO Dimethyl sulfoxide

V
DNA Deoxyribonucleic acid
DNDi Drugs for Neglected Diseases Initiative
dsRNA double-stranded RNA
EDTA Ethylenediaminetetraacetic acid
eGFP Enhanced green fluorescent protein
EGTA Ethyleneglycol-bis (ß-aminoethyl ether)-N,N,N´,N´-tetraacetic acid
ER Endoplasmic reticulum
FAZ Flagellum attachment zone
FBS Fetal bovine serum
FCS Fetal calf serum
FIND Foundation for Innovative New Diagnosis
FPLC Fast protein liquid chromatography
gDNA Genomic DNA
GPI Glycosylphosphatidylinositol
GSG L-Glutathione reduced
GSSG L-Glutathione oxidized
GuHCl Guanidine hydrochloride
HAT Human african trypanosomiasis
HEPES N-2-hydroxyethylpiperazine-N´-2-ethanesulfonic acid
HMI-9 Hirumi’s Modified Iscove’s medium
IBs Inclusions bodies
IFN-γ Interferon gamma
IMDM Iscove’s Modified Dulbecco’s Medium
IPTG Isopropyl ß-D-1-thiogalactopyranoside
KD Knockdown
KDa Kilodalton

VI
LAMP Loop-mediated isothermal amplification
MicroED micro-electronmicroscopy diffraction
MITat Molteno institute trypanozoon antigenic type
MOI Multiplicity of infection
mRNA Messenger RNA
MSP-B Major surface protease B
NADPH Nicotinamide adenine dinucleotide phosphate
NBT Nitro Blue tetrazolium
NECT Nifurtimox-Eflornithine combination therapy
NTD neglected tropical disease
ODC Ornithine decarboxylase
PBS Phosphate buffered saline
PCR Polymerase chain reaction
PDB Protein data bank
PEG Polyethylenglycol
PFR Paraflagellar rod
pfu/ml Plaque forming unit/ml
PG Prostaglandins
PGD2 Prostaglandin D2
PGE2 Prostaglandin E2
PGF2α Prostaglandin F2 alpha
pTbCOX putative Trypanosoma brucei Cyclooxygenase
pTbCOX-KD putative Trypanosoma brucei Cyclooxygenase knockdown
PTRE Post-treatment reactive encephalopathy
qRT-PCR quantitative real time polymerase chain reaction
RDT rapid diagnostic test

VII
RISC RNA-induced silencing (complex)
RNA Ribonucleic acid
RNAi RNA-Interference
rpm Revolutions per minute
RT Room temperature
SDS Sodium dodecylsulfate
SDS-PAGE Sodium dodecylsulfate polyacrylamide gel electrophoresis
SEM Scanning electron microscopy
Sf9 Spodoptera frugiperda insect cell
SFX Serial femtosecond crystallography
SIF Stumpy induction factor
siRNA Small interfering RNA
SMB Single marker bloodstream form
SOREM sleep-onset rapid eye movement
SSX Serial synchrotron crystallography
T. Trypanosoma
T. b. Trypanosoma brucei
TAE Tris acetate EDTA
Tb Trypanosoma brucei
TbMSP-B Trypanosoma brucei Major surface protease B
TbPGFS Trypanosoma brucei Prostaglandin 2 alpha synthase
TBS Tris buffered saline
TCID50 50% tissue-culture infection dose
TDB Trypanosoma dilution buffer
TEM Transmission electron microscopy
TEMED Tetramethylethylenediamine

VIII
TNF-α Tumor necrosis factor alpha
Tris Tris (hydroxymethyl) aminomethane
TrypanoFAN Trypanosoma brucei Functional Genomic Project
VSG Variant surface glycoprotein
WHO World Health Organization
XFEL X-free electron laser

IX
List of Figures
Figure 1.1: Distribution of human African trypanosomiasis with incidences and risk for travelers. ............... 3
Figure 1.2: (A) Symptoms of HAT (Enanga et al., 2002). (*) symptoms only observed in East African
trypanosomiasis, which is caused by T. brucei rhodesiense. Body scheme derived from Mikael Häggström
(University of Uppsala). (B) Suggested correlation between symptoms and infected organs in a three-stage
model of HAT infection (haemolymphatic, meningeal and encephalitic). (A) and (B) figures derived from
Mogk et al., 2016. .............................................................................................................................................. 5
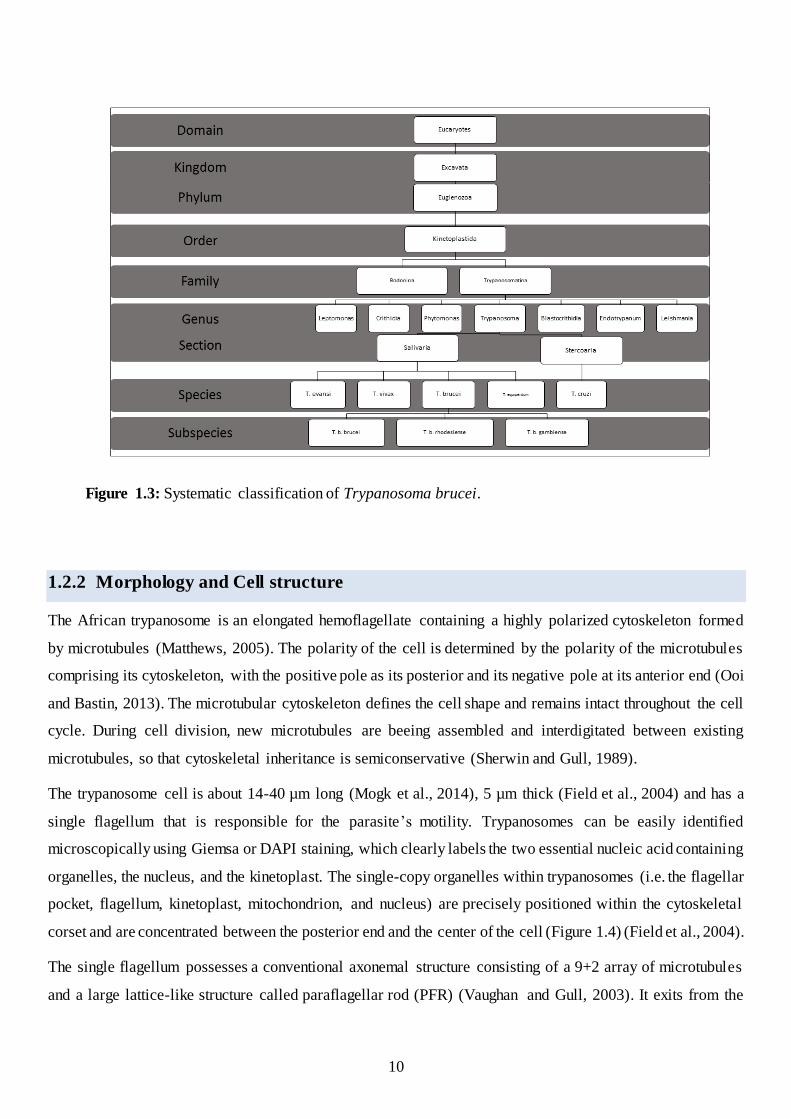
Figure 1.3: Systematic classification of Trypanosoma brucei. ....................................................................... 10
Figure 1.4: Morphologie of Trypanosoma brucei. The central image is a cartoon showing the location of the
major organelles and structures. The endoplasmic reticulum (ER) has been omitted for clarity as this structure
extends throughout the cell and forms the nuclear envelope. The structures shown are the basal body, the
flagellar pocket, the nucleus, supellicular microtubular array (spa), the flagellum, the kinetoplast, endosomes,
the Golgi apparatus, the mitochondrion, the endoplasmic reticulum (ER) and acidocalcisomes. Insets show
examples of these structures as seen by thin section transmission electron microscopy (Field et al., 2004). . 12
Figure 1.5: Trypanosomes within blood (A), and (B) the tsetse fly vector (Michael Duszenko, University of
Tübingen, Germany). ....................................................................................................................................... 14
Figure 1.6: Life cycle of African trypanosomes: In man, the bloodstream form shows a polymorphism (A)
dividing (black arrows) slender forms, (B) intermediate forms, and (C) stumpy forms. In the tsetse fly vector,
the stumpy form transforms to (D) the dividing midgut form, then to (E) the migrating epimastigote form,
which multiplies in the salivary glands to (F) the infective metacyclic form, which is injected during the next
blood meal into the mammalian host (Barrett et al., 2007).............................................................................. 15
Figure 1.7: Representation of the RNAi pathway in trypanosomes (Balaña-Fouce and Reguera, 2007). ..... 17
Figure 4.1: pTbCOX 680 amino acids sequence and protein structure prediction using LOMETS V.4 (Local
Meta-Threading-Server) software.. .................................................................................................................. 66
Figure 4.2: Phosphorylation sites prediction in pTbCOX sequence. .............................................................. 67
Figure 4.3: Kyte-Doolittle-Hydropathy Plot for pTbCOX. The hydropathy score is plotted on Y-axis and the
amino acids number on X-axis......................................................................................................................... 68
Figure 4.4: rpTbCOX expression in E. coli strain BL21 (DE3) and inclusion body preparation with
lauroylsarcosine. .............................................................................................................................................. 69

X
Figure 4.5: SDS-PAGE and Western blot analysis of rpTbCOX after the redox refolding procedure to
determine the approximate size and yield. The recombinant rpTbCOX was quite stable to be load onto a Ni-
NTA column after the refolding procedure under ÄKTA-FPLC. ................................................................... 70
Figure 4.6: IMAC purification of the GuHCl-denatured rpTbCOX after refolding of the protein from inclusion
bodies. (A) Chromatogram of the Ni-NTA chromatography illustrating the flow through (FT) and the Elution
peak (E) of rpTbCOX. ..................................................................................................................................... 71
Figure 4.7: PCR amplification of the pTbCOX gene from Trypanosome genomic DNA using Accu Prime
Tag DNA Polymerase. A 1% (w/v) agarose gel electrophoresis confirming the correct pTbCOX gene
amplification. ................................................................................................................................................... 72
Figure 4.8: Agarose gel electrophoresis after digestion of the pTbCOX-pCR 2.1 recombinant clone with
BamHI and HindIII. ......................................................................................................................................... 73
Figure 4.9: Agarose gel electrophoresis after digestion of pTbCOX-pFastBacHTb recombinant clones with
BamHI and HindIII. ......................................................................................................................................... 74
Figure 4.10: The results of the 1% (w/v) agarose gel electrophoresis showing the presence of the recombinant
bacmid band at the expected size of about 4500 bp (4509 bp) in all four pTbCOX-pFastBacHTb clones
analyzed by Bacmid PCR. ............................................................................................................................... 75
Figure 4.11: Light micrograph of Sf9 insect cells showing A) non-infected Sf9 cells as a negative control and
B) P3 infected Sf9 cells containing pTbCOX microcrystals 14 days post infection. (Black arrows: needle
shaped pTbCOX microcrystals). ...................................................................................................................... 76
Figure 4.12: Images are showing: (A) phase contrast microscopy picture of pTbCOX isolated and
concentrated crystals (arrowhead indicates pTbCOX crystals) and (B) Western blot analysis of pTbCOX
solubilized crystals at ca. 74.68 kDa. ............................................................................................................... 77
Figure 4.13: Scanning electron micrograph images of pTbCOX in vivo crystals protruding in /out Sf9 insect
cells. ................................................................................................................................................................. 77
Figure 4.14: Analysis of pTbCOX crystals by SONICC. From left to right: Comparison of visible, second
harmonic generation (SHG) and conventional UV-excited fluorescence (UV). The resulting signal of this
second harmonic generation (SHG) process can be detected at a wavelength of 532 nm with SHG exposure
time of 30 second. The tiny pTbCOX crystals and signal of SHG are shown inside the different circle. ...... 78
Figure 4.15: X-ray powder diffraction analysis of pTbCOX crystals. The pTbCOX crystals showed diffraction
patterns using powder diffraction. Lysozyme nanocrystals were used for comparison and control. .............. 79

XI
Figure 4.16: DLS measurement of pTbCOX crystals solubilized with 50 mM sodium acetate at pH 3.6 and
the respective histogram plot showing highly aggregated pTbCOX protein, Rh ca. 300 nm and MW between
1.923GDa to 1.578GDa. Sample concentration: 6 mg/ml. .............................................................................. 80
Figure 4.17: DLS measurement of pTbCOX crystals solubilized with 0.5 mM sodium acetate at pH 3.6 and
the respective histogram plot showing monomeric protein molecules with Rh 4.30 ± 0.50 nm and a MW of
approximately 89 kDa. Sample concentration 1 mg/ml................................................................................... 81
Figure 4.18: Circular Dichroism spectra of the pTbCOX crystals resolved in 16.7 mM sodium acetate pH 3.6.
(A) CD spectrum of pTbCOX and (B) Secondary Structure Estimation of pTbCOX using Yang’s reference
(Yang et al., 1986)............................................................................................................................................ 81
Figure 4.19: PCR amplification of a pTbCOX-KD fragment from trypanosome genomic DNA using Accu
Prime Tag DNA Polymerase. A 1% (w/v) agarose gel electrophoresis suggesting the pTbCOX-KD fragment
amplification. ................................................................................................................................................... 82
Figure 4.20: Agarose gel electrophoresis after digestion of the pTbCOX-KD-pCR 2.1 recombinant clones
with XhoI and BamHI.. .................................................................................................................................... 83
Figure 4.21: A) p2T7Ablue RNAi vector (6470 bp) picture from TrypanoFan; B) Validation of the pTbCOX-
KD-p2T7Ablue construct by colony PCR; and C) Restriction analysis of the pTbCOX-KD-p2T7Ablue
construct using XhoI and BamHI. A 1% (w/v) agarose gel electrophoresis confirms the pTbCOX-KD-
p2T7Ablue. ...................................................................................................................................................... 84
Figure 4.22: NotI linearization of the pTbCOX-KD-p2T7Ablue construct visualized by agarose gel
electrophoresis. Black narrow shows the 6473 bp size expected of the recombinant pTbCOX-KD-p2T7Ablue
construct after NotI single digestion. ............................................................................................................... 85
Figure 4.23: 5% (w/v) agarose gel electrophoresis for validation of the qRT-PCR products.. ...................... 86
Figure 4.24: Standard curves for qRT-PCR amplification efficiency. ........................................................... 87
Figure 4.25: qRT-PCR analysis of pTbCOX mRNA levels after 18 h, 42 h and 66 h of RNAi induction by
doxycycline, 1 µg/ml. Data were normalized to ß-tubulin mRNA expression. Data represent the means ± SD
of three independent experiments. ................................................................................................................... 87
Figure 4.26: Growth curves of RNAi cells lines following the presence (+ Doxy) or absence (- Doxy) of 1
µg/ml doxycycline, in comparison to non-transfected SMB cells lines. The data represent the means ± SD of
two biological replicates. ................................................................................................................................. 88
Figure 4.27: (A) Scanning electron micrographs of pTbCOX RNAi cells 24 h post-induction of RNAi
showing monster cells with multiples nuclei and multiple flagella. (B) Electron micrographs of whole-mount
XII
negative stained trypanosomes 96 h after doxycycline induction. The cells show 3 nuclei, 3 basal bodies and
3 flagella. (C) Transmission electron micrograph taken 42 h after doxycycline induction shows multiple nuclei
and flagella as well as protrusion of the cell body associated with peripheral flagella, corresponding to giant
cells. ................................................................................................................................................................. 90
Figure 4.28: (A) and (B) are representative images of DAPI-stained pTbCOX RNAi clone T1.1 at different
time points in the presence of doxycycline (1 µg/ml). (A) representative images of multinucleated and multi -
flagellated phenotypes observed after 6 h doxycycline induction; (B) shows mainly the “Big Eye” phenotype..
.......................................................................................................................................................................... 91
Figure 4.29: Representative images of the morphological changes of the pTbCOX depleted cells after RNAi
induction. (A) Electron micrographs are showing negative stained pTbCOX RNAi trypanosomes 6 h after
doxycycline induction and Transmission electron micrograph showing pTbCOX RNAi trypanosomes 42 h
after doxycycline induction. The flagellar pocket is significantly enlarged. (B) Scanning electron micrograph
of pTbCOX RNAi cells 24 h after doxycycline induction showing the “Big Eye” phenotype. ...................... 92
Figure 4.30: Kinetoplast-nucleus configurations of the pTbCOX-KD RNAi cell line at various time points
post-induction. Parasites with abnormal karyotypes are subcategorized into multi-nucleated flagellated cells
(˃2K2N) and other (0K1N, 1K0N, 1K2N, 0K2N). Fluorescence microscopy assessed the number of
kinetoplasts (K) and nuclei (N) following DNA-staining with DAPI. ............................................................ 93
Figure 4.31: PCR amplification of the pTbCOX gene from trypanosome genomic DNA using Accu Prime
Tag DNA Polymerase. A 1% (w/v) agarose gel electrophoresis confirming the pTbCOX gene amplification..
.......................................................................................................................................................................... 94
Figure 4.32: Colony PCR of pTbCOX-pCR 2.1 recombinant clones after chemical transformation in E. coli.
A 1% (w/v) agarose gel electrophoresis suggested the pTbCOX gene amplification.. ................................... 95
Figure 4.33: A) Illustration of restriction digestion analysis of pTbCOX-pCR 2.1 using DNAMAN software
and B) 1% (w/v) agarose gel electrophoresis of the pTbCOX-pCR 2.1 digested with HindIII and PvuII.. .... 96
Figure 4.34: A) 1% (w/v) agarose gel electrophoresis after digestion of the pTbCOX-pCO57 recombinant
clones with HindIII and PvuII.......................................................................................................................... 97
Figure 4.35: Fluorescence micrographs of SMB trypanosomes expressing pTbCOX fused with eGFP protein..
.......................................................................................................................................................................... 98

1
1 Introduction
1.1 Human African Trypanosomiasis
1.1.1 Epidemiology
Human African trypanosomiasis (HAT), also known as sleeping sickness, is one of the “neglected tropical
diseases” (Hotez and Kamath, 2009). The concept of neglected tropical diseases (NTDs) was first proposed
in the 1970s by Ken Warren (Keating, 2014; Croft, 2016). He brought attention to a significant proportion of
the human population that was poor, suffered from chronic, disabling but rarely fatal diseases, and who were
often stigmatized and unemployed (Croft, 2016). Also, these diseases are neglected by the pharmaceutical
companies, as affected low developed countries do not receive too many priorities for research funding and
field investigations.
HAT is a vector-borne parasitic disease which primarily affects poor rural populations in some of the least
developed countries of East and Central Africa (Berriman et al., 2005). Moreover, HAT is the world’s third
most important parasitic disease affecting human health after malaria and schistosomiasis as defined by the
global burden of parasitic disease, calculated as the disability-adjusted life years lost (Kennedy, 2008).
HAT is caused by two subspecies of Trypanosoma brucei, namely Trypanosoma brucei gambiense and
Trypanosoma brucei rhodesiense, which are transmitted to the human host by tsetse flies. Other parasites like
T. congolense or the subspecies (T. brucei brucei) are not human infective, but cause animal trypanosomiasis
in wild and domestic animals (http://www.who.int/mediacentre/factsheets/fs259/en/).
T. b. gambiense causes disease in Central and Western Africa that is called Gambian HAT (Figure 1.1). It is
a chronic illness that can take years or decades before fatality (Checchi et al., 2008). It is an anthroponotic
disease with a minor role for animal reservoirs. It is responsible for 98% of HAT cases reported in the last
decade (Franco et al., 2014). T. b. rhodesiense causes disease in Eastern and Southern Africa that is called
Rhodesian HAT (Figure 1.1). It is an acute disease causing death within weeks or months upon infection (Odiit
et al., 1997). It is a zoonotic disease, affecting mainly animals (livestock and wildlife) (Franco et al., 2014).
The prevalence of HAT is between 14o North and 29o South in many countries of sub-Saharan Africa.
Therefore, about 60 million people are estimated to be at the risk of getting infected (Kennedy, 2013).
Countries mostly affected are the Democratic Republic of Congo, Angola, and South Sudan, where it mainly
affects impoverished rural communities. Several human epidemics of HAT have been recorded in Africa over
the last century. The major one occurred between 1896 and 1906 and affected mostly Uganda and the Congo

2
basin. This outbreak was followed by one in 1920 which struck several African countries. The disease did
resurge in the 1970s and led to alarming epidemics in the 1990s. In the Central African Republic, Chad,
Democratic Republic of Congo, Cote d’Ivoire, Guinea, Malawi, Uganda and the United Republic of Tanzania
the threat of HAT remains a significant public health problem, with 50-1000 new cases reported every year
(www.who.int). Countries such as Burkina Faso, Cameroon, Equatorial Guinea, Gabon, Kenya, Mozambique,
Nigeria, Rwanda, Zambia, and Zimbabwe are reporting fewer than 50 new cases per year (Figure 1.1). In
countries such as Benin, Botswana, Burundi, Ethiopia, Gambia, Ghana, Guinea-Bissau, Liberia, Mali,
Namibia, Niger, Senegal, Sierra Leone, Swaziland and Togo transmission seems to have stopped and no new
cases have been reported for several decades (www.who.int).
The steady decrease of HAT cases reported during the last 10 years in Africa has led the World Health
Organization (WHO) to speculate about the elimination of HAT as a public health problem (defined as less
than 1 annual case/10.000 inhabitants in HAT endemic foci) being achieved by 2020. However, it is estimated
that a significant number of new cases are still unreported or undiagnosed (Brun et al., 2010; Fevre et al.,
2008; Kennedy, 2013). The non-diagnosed population has been recently explained by the discovery of healthy
carriers, i.e. infected but asymptomatic patients (Capewell et al., 2016; Casas-Sánchez and Acosta-Serrano,
2016; Sudarshi et al., 2014). This is supported by the recent description of skin or fat dwelling trypanosomes
(Capewell et al., 2016; Trindade et al., 2016) and the meningeal stage from which trypanosomes could invade
the brain via the Virchow-Robin space thereby bypassing the blood-brain barrier (Mogk et al., 2016). These
results provide strong arguments to raise up attention on potentially overlooked human and animal reservoirs.

3
Figure 1.1: Distribution of human African trypanosomiasis with incidences and risk for travelers.
The black line divides the areas in which Trypanosoma brucei gambiense prevails and those in
which Trypanosoma brucei rhodesiense predominates (Brun et al., 2010).
1.1.2 Clinical Features
The clinical presentation of HAT depends on the parasite species, the stage of the disease and the host. The
signs and symptoms that characterize sleeping sickness are mainly the same for both forms of the disease but
differ in their frequency, severity, and kinetics of appearance. Rhodesiense HAT is an acute illness, which
progresses to second-stage within a few weeks and usually to death within 6 months. Gambiense HAT is a
more chronic disease; the second stage is usually reached within weeks to months. Usually, both stages of the
illness are considered fatal if untreated. The human population living in HAT endemic countries could be
divided into different groups: susceptible (uninfected); infected asymptomatic and infected symptomatic. The
healthy carriers or infected asymptomatic HAT patients are defined as people living symptomless with the
4
disease with up to several decades (Sudarshi et al., 2014). This indicates that many more people might be
carrying the transmissible parasites and remained out of control in endemics countries.
So far it has been described that both forms of HAT progress in two stages, the first called haemolymphatic
stage and the second called meningo-encephalitic stage. The first stage starts when the parasite enters the
human blood and lymph vessels, they spread into the lymph node and systemic organs like spleen, liver, eyes
and endocrine organs. The second stage is when the parasite invades the CNS via crossing the blood-brain
barrier (BBB) or blood-CSF barrier (BCB).
During the first or haemolymphatic stage of the disease, Gambiense HAT patients can present intermittent
nonspecific symptoms such as fever, fatigue, headaches, arthralgies, and pruritus. Afterward, the cervical
lymph nodes in the neck may swell, an often observed symptom called “the Winterbottom sign”. This
observation was recognized as an alert sign for HAT long ago by Sir Thomas Masterman Winterbottom, who
noted that slave traders in the last 18th century used neck swelling as an indicator of sleepiness or abnormal
behavior that made particular slaves undesirable (Chappuis et al., 2005).
During the second stage, the sleep disorder is the main major symptom. It leads to sleep-wake cycle disruption
and sleep structure alterations (Buguet et al., 2005). The structure of sleep is altered and characterized by
episodes of sleep-onset rapid eye movement (SOREM) (Buguet et al., 2001, 2005). The hallmark of sleeping
sickness, i.e. changes of the sleep/wake cycles, leads to a profound polyphasic sleep-wake pattern,
characterized by SOREM episodes, which may appear earlier than the sleep-wake alterations (Kristensson et
al., 2010).
The sleep structure alterations, including SOREM episodes, have been shown to recede or disappear after
treatment of infection and improvements may take several months after treatment to unfold (Buguet, 1999). It
has been indicated that sleep-wake changes in HAT are not directly related to the presence of the parasite in
the brain, and points to slowly reversible functional alteration and/or to compensatory mechanisms over time,
rather than to severe structural damage of sleep-wake regulating regions during the disease (Kristensson et al.,
2010).
Based on our experimental findings that trypanosomes cannot survive in CSF, the cyclic appearance of the
parasite in CSF, location of the parasite in the pia mater (meningeal stage) and the variability of the time
interval from the initial infection (skin or blood stage) before brain invasion (encephalitic stage) are proof of
the exitence of trypanosome populations in other tisues playing important to sustain the cycle infection versus
transmission. Those findings reveal that the trypanosome must adapt itself for surviving at different selection
pressure area during the HAT infection progression. Afterward, the selected survived parasite will spread from
those various stages to susceptible tissues close to the ventricular system that does not have the blood-brain
barrier like the circumventricular organs (CVOs) and pia matter or basal meninges. The localization of basal

5
meninge or CVOs trypanosomes may impair the CVOs physiological functions and correspond to commonly
observed HAT symptoms. This lead us to recently propose a correlation between the symptoms and infected
organs in a three-stage model (Mogk et al., 2016) (Figure 1.2).
Figure 1.2: (A) Symptoms of HAT (Enanga et al., 2002). (*) symptoms only observed in East
African trypanosomiasis, which is caused by T. brucei rhodesiense. Body scheme derived from
Mikael Häggström (University of Uppsala). (B) Suggested correlation between symptoms and
infected organs in a three-stage model of HAT infection (haemolymphatic, meningeal and
encephalitic). (A) and (B) figures derived from Mogk et al., 2016.
It was reported that molecules produced by trypanosomes, especially the prostaglandins D2 (Duszenko et al.,
2006; Figarella et al., 2005, 2006), may also be involved in the dysfunction of sleep-wake cycles (Urade and
Hayaishi, 2011).
Moreover, cytokines such us TNF-α and IFN-γ released by the host immune response may also trigger the
sleep-wake deregulation during the HAT infection (Kristensson et al., 2010).
Neurological and psychological symptoms have been observed during second-stage HAT such as personality
changes, hallucination, and coma.

6
1.1.3 Diagnosis
In general, clinical signs and symptoms such as fever, swollen lymph nodes or neurological signs are not
unique to make HAT diagnosis specific. They just provide a hint for diagnosis but are not sufficient to start
treatment. The correct diagnosis of HAT is therefore field- and laboratory-based and consists of three steps
(Chappuis et al., 2005): screening, diagnosis confirmation, and staging of the disease.
For screening of the Gambiense HAT infection, a card agglutination test for trypanosomiasis (CATT) was
developed in the late 1970s that can be performed on blood and serum. CATT is a rapid, simple assay for the
detection of specific antibodies in blood of Gambiense HAT patients (Lejon et al., 1998). The CATT antigen
present on the card was raised against the complete bloodstream form of T. b. gambiense variable antigen type
LiTat 1.3, i.e. containing also the invariant cross-reacting determinant. The sensitivity of CATT is about 87-
98% and the specificity about 93-95% (Brun et al., 2010; Chappuis et al., 2005). CATT is the best adapted
and most efficient screening method and is widely used in endemics areas (Brun et al., 2010). However, the
CATT is not available in a single format, requires a cold chain for storage, and uses equipment that requires
electricity (Bisser et al., 2016).This challenge is ongoing to be solved by recent progress and development of
acurate and sensitive rapid diagnostic test (RDT) for HAT (Bisser et al., 2016; Sternberg et al., 2014).
For diagnostic confirmation, the demonstration of the parasite in body fluids provides explicit evidence of
trypanosome infection. This diagnosis is made by microscopic examination using a lymph node aspirate or a
blood sample. The delay between sampling and examination should be kept as short as possible to avoid lysis
of trypanosomes. The sensitivity of lymph node palpation and aspiration varies from 40% to 80% dependent
on parasite strains, stage of the disease (this test is more sensitive during the first stage) (Brun et al., 2010),
and prevalence of other diseases that cause lymphadenopathy.
Because examination of thin or thick blood films has very low sensitivity, concentration methods such as the
microhaematocrit centrifugation technique (Woo and others, 1970), the quantitative buffy coat test (Ancelle
et al., 1997; Truc et al., 1998), or the miniature anion-exchange centrifugation technique have been developed
and are widely used (Lutumba et al., 2006, 2007). Molecular tests such as polymerase chain reaction (PCR)
and loop-mediated isothermal amplification (LAMP) based on detection of the parasite’s nucleic acids (DNA
or RNA) are attractive alternatives for parasite detection (Deborggraeve and Büscher, 2010, 2012; Hayashida
et al., 2015).
For staging of the disease, the presence of parasites, more than five white blood cells per µl, or an increased
protein content (˃370 mg/L) within CSF defines the second stage according to WHO recommendations (Brun
et al., 2010). This recommendation is now subjected to controversy that may have some impact on the staging
decision.

7
Diagnosis of Rhodesiense HAT differs from that for Gambiense HAT in several ways. First, there is no
serological screening test for Rhodesiense infections, and second, the parasitological confirmation is easier
because the density of parasites in blood is usually higher than in Gambiense infections (Brun et al., 2010).
Research and development of methods for diagnosis and staging of HAT are still under investigation through
an initiative by WHO and the Foundation for Innovative New Diagnosis (FIND) (Brun et al., 2010).
1.1.4 Treatment
The chemotherapy of HAT has historical roots that date back to the pioneering work by Paul Ehrlich on dyes
and arsenicals (Fairlamb, 2003). The drugs currently used depend on the stage of the disease. Unfortunately,
they all have many adverse side effects.
For early stage HAT, pentamidine and suramin are used for treatment. Pentamidine was developed in the
1930s by the English chemist Arthur James Ewins, an employee of the May and Baker pharmaceutical
company (Steverding, 2008). It is administered by intramuscular or intravenous injection once daily for 7
days. The drug is effective but associated with pain at the injection site, hypo- or hyperglycemia, hypotension,
leukopenia, a prolonged QT interval on electrocardiograms, nephrotoxicity and gastrointestinal symptoms
(Nagle et al., 2014; Stein et al., 2014).
It binds to tissue proteins, thus contributing to a large application volume, and has a long terminal half-life
(Nagle et al., 2014). It does not cross the blood-brain barrier. It is concentrated in trypanosomes via uptake by
aminopurin (P2) and other surface transporters (Nagle et al., 2014). The mechanism by which pentamidine
kills the parasite is not well understood and nonspecific. It may act by binding to DNA or by disrupting
mitochondrial functions.
Suramin, introduced in 1922, is till today the first line drug to treat Rhodesiense HAT given by slow
intravenous infusion every 3-7 days for a 4 week period (Brun et al., 2011). It is highly protein bound and has
a very long terminal half-life of 41-78 days; it does not cross the blood-brain barrier (Nagle et al., 2014).
Suramine adverse effects include neuropathy, rash, fatigue, anemia, hyperglycemia, hypocalcemia,
coagulopathies, neutropenia, and nephrotoxicity (Stein et al., 2014).
For late stage HAT, the arsenical melarsoprol or a nifurtimox-eflornithine combination therapy (NECT) are
currently used for treatment. Arsenicals were the first drug group introduced in 1906 to treat HAT starting
with a drug called atoxyl. It was often fatally or caused blindness due to optic nerve atrophy (Stein et al.,
2014). Melarsoprol drug was effective for treatment of late stage HAT due to T. b. rhodesiense and T. b.
gambiense. It is extremely toxic with up to 10% of all patients developing a post-treatment reactive
encephalopathy (PTRE) that lead to death in about 50% of these cases (Blum et al., 2001). It is also associated

8
with pyrexia, headache, pruritus, thrombocytopenia and heart failure (Stein et al., 2014). It is concentrated in
trypanosomes via uptake by the aminopurin (P2) transporter and disrupts the redox environment within the
cell by interacting with the protein trypanothione (Fairlamb et al., 1989; Nagle et al., 2014).
Difluoromethylornithine (DFMO) (named: eflornithine) was repurposed from investigations as an anticancer
agent (Stein et al., 2014). It is a specific inhibitor of ornithine decarboxylase (ODC) and the first enzyme that
converts ornithine to its biogenic amine putrescine as the first step in polyamine biosynthesis. It acts on the
mammalian enzyme as well as on the trypanosomal ODC but owing to the rapid turnover to the mammalian
ODC; the drug exerts much less toxicity on host cells as compared to bloodstream trypanosomes (Stein et al.,
2014). DFMO is more efficient as melarsoprol and has a superior safety profile (Chappuis et al., 2005). It was
called “resurrection drug” due to its spectacular effect on comatose sleeping sickness patients (Stein et al.,
2014). The problems with eflornithine are the dose regimen (administration is intravenous: 100 mg/Kg every
6 h for 14 days) and the high cost of the production process (Stein et al., 2014). It is also associated with side
effects such as fever, headache, hypertension, macular rash, peripherical neuropathy, tremor and
gastrointestinal problems (Fairlamb, 2003; Stein et al., 2014).
A significant advancement in HAT chemotherapy was the introduction of eflornithine combined with
nifurtimox (NECT) to solve the problem of large dose intravenous infusion administration at 200 mg/Kg every
12 h for 7 days (rather than 100 mg/Kg every 6 h for 14 days as monotherapy) combined with nifurtimox
orally administered at 15 mg/Kg three times a day for 10 days (Priotto et al., 2009). Nifurtimox was repurposed
as a drug for treating American trypanosomiasis (Chagas disease). However, the need of intravenous infusion
coupled with the high cost of distribution remained the drawback of NECT. Therefore, more research efforts
must be made to develop a better suited drug that is ideally easy to administer (preferably orally) over a short
time course and effective against both, early and late stage HAT.
At the moment, Fexinidazole and Oxaboroles (SCYX-7158) are drug candidates in clinical trials of HAT.
Fexinidazole was initially identified through the screening of a collection of nitroheterocyclic molecules by
the Drugs for Neglected Disease initiative (DNDi) (Jones and Avery, 2015). It is available in an oral
formulation as nitroimidazole prodrug and has been shown to be active in vivo in both, acute T. b. rhodesiense
and T. b. brucei CNS murine models; the compound entered clinical trials in 2014 (Kaiser et al., 2011; Torreele
et al., 2010). For the phase I trials, it has been reported that Fexinidazole was well tolerated at doses up to
3600 mg with headache and vomiting (that resolved spontaneously) being the only adverse effects (Tarral et
al., 2014). Phase II/III (safety and efficacy) trials, evaluating this regimen in late-stage patient infections, are
still ongoing in the Democratic Republic of the Congo (DRCongo) and the Central African Republic (CAR)
under the direction of DNDi in collaboration with the Swiss Tropical and Public Health Institute (Swiss TPH).

9
The oxaborole (SCYX-7158) compound derived from a screening of a library of boron-based compounds
from Anacor Pharmaceuticals against T. brucei cultures (Ding et al., 2010). It entered Phase I clinical trials
for the treatment of HAT. Previous studies revealed that SCYX-7158 is an effective, safe, orally active
treatment in both acute and chronic murine models of HAT. Pharmacokinetic studies suggest that once a day
dosing would be sufficient due to the maintenance of drug concentrations above the minimum trypanocidal
concentration for 14 to 20 h (Jacobs et al., 2011; Jones and Avery, 2015). Like fexinidazole, phase II/III trials
evaluating the treatment are still ongoing in DRCongo and CAR. So far, preliminary outcomes from the trials
have not been reported.
1.2 Trypanosoma brucei as pathogen
1.2.1 Taxonomy of trypanosomes
Trypanosomes are flagellated protozoa that are classified as members of the kingdom of Excavata, the phylum
Euglenozoa, and the phylogenetic order Kinetoplastida (Figure 1.3).
Euglenozoa are cells with one or two flagella that emerge from an apical or subapical flagellar pocket.
Kinetoplastida are Euglenozoa that contain a kinetoplast, which is a large mass of fibrillar DNA in the
mitochondrion and closely associated with the flagellar bases.
The taxonomy of Kinetoplastida is divided into two groups: Bodoninae and Trypanosomatinae, which is based
on morphology and life cycles. The Bodoninae group is characterized by a large kinetoplast and two flagella.
This group is formed by free-living organisms and parasites of fish and snails. The Trypanosomatinae have a
smaller kinetoplast and a single flagellum. This group is formed by parasites of invertebrates.
The phylogenetic tree of Trypanosomatinae was generated using the comparison of nuclear small and large
ribosomal RNA gene sequences. It revealed that Trypanosoma is the most ancient Trypanosomatinae,
followed by Blastocrithida and Phytomonas lineages, some time later Crithida and Leptomonas separated
while Leishmania and Endotrypanum branched off after that. The genus Trypanosoma is divided into two
sections: Salivaria and Stercoraria according to the place where the parasite develops in the insect host.
Salivaria develop in the anterior portion of the digestive tract and within the salivary gland, while the
Stercoraria develop in the hindgut.
The section Stercoraria includes only the American trypanosome, T. cruzi, that causes Chagas disease. It is
transmitted via the feces of its reduviid vector. T. brucei belongs to the Salivaria section consisting of the
subspecies T. b. brucei that is not a human pathogen, as well as of T. b. gambiense and T. b. rhodesiense,
which induce HAT. The Salivaria are injected into the mammalian lymph and blood system via the bite of a
tsetse fly.
10
Figure 1.3: Systematic classification of Trypanosoma brucei.
1.2.2 Morphology and Cell structure
The African trypanosome is an elongated hemoflagellate containing a highly polarized cytoskeleton formed
by microtubules (Matthews, 2005). The polarity of the cell is determined by the polarity of the microtubules
comprising its cytoskeleton, with the positive pole as its posterior and its negative pole at its anterior end (Ooi
and Bastin, 2013). The microtubular cytoskeleton defines the cell shape and remains intact throughout the cell
cycle. During cell division, new microtubules are beeing assembled and interdigitated between existing
microtubules, so that cytoskeletal inheritance is semiconservative (Sherwin and Gull, 1989).
The trypanosome cell is about 14-40 µm long (Mogk et al., 2014), 5 µm thick (Field et al., 2004) and has a
single flagellum that is responsible for the parasite’s motility. Trypanosomes can be easily identified
microscopically using Giemsa or DAPI staining, which clearly labels the two essential nucleic acid containing
organelles, the nucleus, and the kinetoplast. The single-copy organelles within trypanosomes (i.e. the flagellar
pocket, flagellum, kinetoplast, mitochondrion, and nucleus) are precisely positioned within the cytoskeletal
corset and are concentrated between the posterior end and the center of the cell (Figure 1.4) (Field et al., 2004).
The single flagellum possesses a conventional axonemal structure consisting of a 9+2 array of microtubules
and a large lattice-like structure called paraflagellar rod (PFR) (Vaughan and Gull, 2003). It exits from the

11
flagellar pocket at the posterior end of the cell and attaches along exterior length of the trypanosome’s body
via a specialized cytoskeletal structure termed flagellum attachment zone (FAZ). The FAZ is composed of a
single protein filament and specialized four microtubules that associate with the smooth endoplasmic
reticulum (Kohl et al., 1999). The FAZ protein composition is still not known, but some proteins have been
localized to the FAZ filament. It has been shown that RNA interference (RNAi) inhibiting FAZ protein
biosynthesis causes a defective cytokinesis (Morriswood et al., 2013; Vaughan et al., 2008; Zhou et al., 2011).
In trypanosomatids, the flagellum beats from tip to the base, with anterior and posterior poles of the cell
defined according to their position during motility (Robinson et al., 1995).
The flagellar pocket is the only site of endo- and exocytosis (Engstler et al., 2004). Endocytosis is of great
significance in bloodstream form trypanosomes, because essential exchanges into and out of the cell and VSG
recycling occurs at the flagellar pocket (Ooi and Bastin, 2013).
The nucleus is located in the central region of the cell and contains 11 diploid pairs of megabase chromosomes,
1-5 intermediate chromosomes, and roughly 100 minichromosomes of unknown ploidy (Akiyoshi and Gull,
2013). These chromosomes are linear and have typical telomeres repeats (TTAGGG) at the ends. It has been
shown that all the trypanosome housekeeping genes are encoded mainly in the megabase chromosomes and
are transcribed as long polycistronic units (Ersfeld, 2011). The 26-Mb megabase chromosomes genomes
contain approximately 9000 genes, including 1000 non-expressed variant surface glycoproteins (VSG). The
VSG is a single surface coat protein, highly immunogenic and expresses by T. brucei from one of
approximately 15 expression sites (ESs), which are located to the telomeres of megabase or intermediate
chromosomes (Akiyoshi and Gull, 2013). T. brucei as extracellular protozoa manage to escape the host
immune system by switching the expression of VSG up to once per 100 cell divisions (Morrison et al., 2005;
Mugnier et al., 2016; Turner, 1999).
The kinetoplast is located at the posterior end of the cell. It is known to be the mitochondrial DNA that is
associated with the base of the flagellum. This structure is significantly larger than the mitochondrial genomes
in other eukaryotic cells. Hence it is prominently stainly with DNA-specific dyes. It comprises a series of
intercatenated circular DNA molecules, including maxi-circles that encode a small proportion of the
mitochondrial proteins and mini-circles that encode guide RNAs.

12
Figure 1.4: Morphologie of Trypanosoma brucei. The central image is a cartoon showing the
location of the major organelles and structures. The endoplasmic reticulum (ER) has been omitted
for clarity as this structure extends throughout the cell and forms the nuclear envelope. The
structures shown are the basal body, the flagellar pocket, the nucleus, supellicular microtubular
array (spa), the flagellum, the kinetoplast, endosomes, the Golgi apparatus, the mitochondrion, the
endoplasmic reticulum (ER) and acidocalcisomes. Insets show examples of these structures as
seen by thin section transmission electron microscopy (Field et al., 2004).
1.2.3 Life Cycle
Trypanosomes are transmitted by blood-feeding tsetse flies of the genus Glossinae (Figure 1.5). The life-cycle
is relatively complex, with various stages of distinctive morphology, biochemistry and physiology in the
mammalian hosts and in the insect vector (Figure 1.6). The transformation from bloodstream to insect forms
includes degradation and finally loss of the variant surface glycoprotein (VSG) by coordinated action of a
metalloprotease (named major metalloprotease B) MSP-B and the GPI-specific phospholipase C. Specifically,
TbMSP-B seems to be responsible for the remodeling of VSG during differentiation (Donelson, 2003).
The procyclic form expresses a different type of surface protein that has been named procyclin (Roditi et al.,
1989). Procyclic parasites replicate in the insect midgut before they migrate to the salivary gland. Here it
differentiates to the epimastigote form that attaches with part of its flagellum to epithelial cells of the organ
(Hendry and Vickerman, 1988; Vickerman et al., 1988).

13
The final differentiation step is the formation of the infectious free swimming metacyclic form, characterized
by the acquisition of the protective variant surface glycoprotein coat (VSG). Trypanosomes contain several
hundred VSG genes, out of which only one protein is expressed at a given time. This coat protects the parasite
from the cellular immune system response and seems to inhibit complement reactions. The VSG coat is
immunogenic and leads to the formation of specific antibodies that opsonize and eventually kill all parasites
that carry this specific VSG type. However, due to antigenic variation, new populations appeare spontaneously
carrying a different coat formed from VSG switch variants and escape the destruction by the immune system.
Thus, the trypanosomal infection is characterized by an oscillating population density in blood.
In addition to this host-induced density regulation, trypanosomes differentiate in blood from dividing long
slender to a non-dividing stumpy form that is preadapted to survive in the insect’s midgut. This differentiation
depends on the slender population density and is induced by a secreted low-molecular-weight factor (stumpy
inducing factor (SIF) ) (Vassella et al., 1997) of so far unknown chemical identity that enriches in conditioned
culture media (Hamm et al., 1990). SIF works like an autocrine mediator that is released from slender cells
and induces slender cells to differentiate to the stumpy form, which cannot proliferate within the mammalian
host but are needed for tsetse fly infection.
Metacyclic forms are injected during a tsetse blood-meal and trypanosomes, injected subdermally, initially
proliferate at the site of injection, often forming a reaction at the location of the tsetse fly bite called chancre,
but concomitantly they also appear in the blood and lymphatic vessel. It has been recently demonstrated that
infective metacyclic trypanosomes can be acquired from the dermis inoculation site immediately after the
initial transmission and that intradermal parasite expansion induced skin surface temperature elevation (Caljon
et al., 2016).
In man, the life cycle of trypanosomes proceeds and ends with infection of the central nervous system (CNS).
The parasite’s progression from the bloodstream to the CNS will take a latency of weeks (Rhodesiense HAT)
or months to years (Gambiense HAT). The parasite will travel to the brain either by crossing the blood-brain
barrier (BBB) and settle down in the brain parenchyma (Grab and Kennedy, 2008; Mulenga et al., 2001), or
by crossing the blood-CSF barrier (BCB) (Mogk et al., 2016). There still is considerable controversy by which
way trypanosomes invade the CNS: across the BBB or across the blood-CSF barrier (BCB)? Following the
literature on trypanosome brain invasion, there is much experimental evidence showing that trypanosomes
cross the BBB via different mechanisms, but it has been demonstrated that trypanosomes could not survive in
the brain parenchyma (Wolburg et al., 2012). It has been shown by electron microscopy studies that
trypanosomes first appear in the choroid plexus by crossing the fenestrated endothelium cell layer of plexus
vessels. Some of the parasites die within the plexus’s stroma, but some trypanosomes make their way to the
ventricle and move on to the sub-arachnoid space, where they finally settle between the cells of the pia mater
(Wolburg et al., 2012). The pia mater is the innermost layer of the meninges (dura mater, arachnoidea mater

14
and pia mater), which surround the brain and the spinal cord. Trypanosomes cannot survive within the stroma
of the plexus nor within the CSF as it contains a trypanocidal compound, the pia mater is safety place for
living at all time of the infection (Wolburg et al., 2012).
Mogk et al., 2014, showed that trypanosomes repeatedly cross the BCB depending on their cell density in the
blood. Thus, Mogk et coworkers suggested the existence of an additional distinct meningeal stage from where
the trypanosomes can invade the brain via the Virchow-Robin space thereby bypassing the blood-brain barrier.
This mechanism would lead to three instead of two steps: first, the haemolymphatic stage; second, the
meningeal stage; third, the encephalitic stage characterized by the invasion of the CNS and the occurrence of
encephalopathy (Mogk et al., 2016).
Figure 1.5: Trypanosomes within blood (A), and (B) the tsetse fly vector (Michael Duszenko,
University of Tübingen, Germany).

15
Figure 1.6: Life cycle of African trypanosomes: In man, the bloodstream form shows a
polymorphism (A) dividing (black arrows) slender forms, (B) intermediate forms, and (C) stumpy
forms. In the tsetse fly vector, the stumpy form transforms to (D) the dividing midgut form, then
to (E) the migrating epimastigote form, which multiplies in the salivary glands to (F) the infective
metacyclic form, which is injected during the next blood meal into the mammalian host (Barrett
et al., 2007).
1.3 RNA interference in Trypanosoma brucei
Fire et al. first described RNA interference (RNAi) during their research with the nematodes worm
Caenorhabditis elegans and described post-transcriptional gene silencing of a target gene sequence, mediated
by double-stranded RNA (dsRNA) (Fire et al., 1998).
It has also been discovered to occur in Trypanosoma brucei. T. brucei transient expression, or electroporation
of the dsRNA homologous to α-tubulin mRNA led to downregulation of α-tubulin synthesis because the

16
corresponding mRNA was degraded (Ngo et al., 1998). The silencing effect was not specific to α-tubulin
mRNA but could be obtained with dsRNA homologous to other mRNAs (Ullu et al., 2002).
After that, RNAi has been intensively studied in many other organisms, including the plant Arabidopsis
thaliana, the fruit fly Drosophila and the Zebrafish of the carp family. However, RNAi is notably absent in
protozoans closely related to T. brucei, such as T. cruzi and Leishmania major (Motyka and Englund, 2004).
The existence of the RNAi system in T. brucei was confirmed by the identification of endogenous small
interfering RNA (siRNAs) in T. brucei (Djikeng et al., 2001). Furthermore, two of the classical proteins
required for the RNAi pathway namely, TbAGO1, a member of the Argonaute family of proteins (Kolev et
al., 2011), and two Dicer-like homologs, TbDCL1 and TbDCL2 (Patrick et al., 2009; Shi et al., 2006) exist in
T. brucei.
Mechanistically, RNAi is a two-step process (Figure 1.7). During the first step, the dsRNA that triggers the
silencing response is cleaved into small interfering RNAs (siRNAs) of 21-25 nucleotides. It is accomplished
by Dicer, an RNase-III-family nuclease. In the second step, siRNAs are incorporated into a targeting complex,
known as RISC (RNA-induced silence complex), which destroys mRNAs that are homologous to the integral
siRNA (Balaña-Fouce and Reguera, 2007). The result is a suppression of the respective gene expression.
RNAi has become the method of choice to elucidate the function of individual genes in T. brucei (Tschudi et
al., 2003). It is relatively easy to apply and a fast option as compared to knockout experiments, on which
ablation eliminates all copies of the gene of interest.

17
Figure 1.7: Representation of the RNAi pathway in trypanosomes (Balaña-Fouce and Reguera,
2007).
1.4 In vivo Protein Crystallization
Protein crystallization is a mainstream research technique for the elucidation of protein function and structure
based drug design. Protein crystallization is a multi-parameter process that is very difficult to predict
(McPherson and Gavira, 2014).
In the last decades great efforts have been made by structural biologists for developing crystallization tools or
deciphering the mechanisms by which proteins crystallize and more to predict protein crystallizability based
on the protein sequence.
The formation of well-ordered protein crystals is still a challenge in X-ray crystallography. This is, in
particular, the case for glycoproteins, lipoproteins, membrane proteins and large protein complexes which are
attracting increasing interest due to their vital roles in biological process (McPherson and Gavira, 2014).
The general procedures used to determine the structures of proteins involve many intricate and handling steps:
1) cloning the target gene; 2) expressing of the protein in a suitable expression system; 3) purifying a good
yield of the pure protein for crystallization and structure determination. This so-called in vitro protein
crystallography is the major source of protein crystal structures in PDB database. Typically, in vitro

18
crystallization requires optimization of various conditions, including unphysiological pH values as well as
exposure to potent precipitating agents and salts (Kang et al., 2013).
It has been observed in the past that some proteins forms crystals in vivo (Doye and Poon, 2006). Prominent
examples are (i) storage proteins in plant seeds, (ii) insulin in secretory granules of pancreatic ß-cells, (iii)
alcohol oxidase in peroxisomes of methylotrophic yeast, (iv) insecticidal toxins in bacteria such as Bacillus
thuringiensis and (v) polyhedrin in various types of baculoviruses (Doye and Poon, 2006). As indicated herein,
intracellular crystallization is widely associated with cellular functions of protein storage and secretion, solid-
phase catalysis as well as environmental protection (Doye and Poon, 2006). Nevertheless, crystallization (and
protein aggregation) inside cells also appears to be linked to the pathology of several diseases, either as one
of the causes or as a harmful side effect of the disease (Doye and Poon, 2006). For this reason, crystal
formation in vivo has classically been perceived as an unusual or lucky event and was disregarded from
structural biology (Axford et al., 2014; Doye and Poon, 2006).
Recently, in vivo crystallization has been observed several times as a result of heterologous overexpression,
mostly within cell lines of insect or mammalian origin (Duszenko et al., 2015; Hasegawa et al., 2011). In this
manner, the phenomenon of intracellular crystallogenesis has shifted more and more into scientific awareness.
Nevertheless, the considerable small size of in vivo-grown crystals rendered them seemingly unsuitable for
conventional X-ray analysis (Sanishvili et al., 2011; Schlichting and Miao, 2012).
Only the advent of new X-ray sources and new data-processing tools such us XFEL/SFX opened the way for
protein structure determination from nano-micro-sized crystals. Numerous independent expert investigators
have already demonstrated the applicability of theses techniques (Axford et al., 2014; Gallat et al., 2014; Gati
et al., 2014a; Jakobi et al., 2016; Muniyappan et al., 2015; Redecke et al., 2013a; Sawaya et al., 2014),
underlining the potential of in vivo crystals to become a feasible source of structural biology (Koopmann et
al., 2012).
Despite great high technologie tools and increasing numbers of successful examples, the process of in vivo
crystallization itself is not yet understood in detail. Principally, the underlying mechanism is assumed to be
similar to crystal formation in vitro (Duszenko et al., 2015).
At first, a high local concentration of the recombinant protein is required to render crystallization
thermodynamically favorable and, to some extent, by protein sorting into subcellular compartments offering
only limited space (Duszenko et al., 2015). As a result of supersaturation, the equilibrium between liquid and
solid phase is reestablished via displacement of protein surrounding water. This, in turn, will favor the
formation of interprotein contacts, if suitably positioned interaction sites are accessible. Thereon, orderly
associated protein molecules may act as nucleation centers providing surfaces for crystal growth progression.
However, there are three examples known that challenge this presumption: (i) formation of in vivo crystals

19
from insecticidal Cry3A from Bacillus thuringiensis (Sawaya et al., 2014), (ii) insecticidal protein Cry1Ac
from Bacillus thuringiensis (Evdokimov et al., 2014), and (iii) µNS viral protein in baculovirus-infected Sf9
cells (Schönherr et al., 2015). The authors reported that in the former two cases a sporulation-like process
occurred, while the viral protein in the latter case was involved in virus production and initiated a nucleation
process within the host cell.
So far, most examples of in vivo crystallization from heterologously expressed genes were obtained using the
insect cell-baculovirus expression system (Duszenko et al., 2015).
This system utilizes site-specific transposition to introduce a foreign gene of interest into the polyhedrin locus
of baculoviral DNA. Thereby, the newly inserted gene substitutes the open reading frame of viral polh, placing
the transgene under direct control of the polh promoter. This polyhedrin promoter is very robust and efficient.
It induces a high concentration of intracellular protein, one the major prerequisite for in vivo crystallogenesis,
and spontaneous crystallization will take place within infected insect cells.
1.5 Structure determination from in vivo grown crystals
In conventional X-ray crystallography (beam size ˃10 µm), crystal sizes of at least 20-30 µm in all three
dimensions are required to obtain interpretable diffraction patterns and to withstand the large radiation dose
that accumulates during the collection of a complete rotation series from a single crystal (Holton and Frankel,
2010).
In the case of smaller crystal diameters, as obtained by in vivo crystallization, the X-ray beam may only
partially hit the mounted crystal. Thus, the proportion of the beam that does not intercept the sample
contributes anything but the background to the diffraction image, thereby reducing the signal-to-noise ratio
and, effectively, the resolution limit. The only way to overcome this bottleneck, the beam size need to be
decreased, placing a stringent demand on the technical set-up (Sanishvili et al., 2011). Furthermore, there is a
proportional relationship between crystal volume and observable spot intensities (Holton and Frankel, 2010),
forcing usage of a high radiation dose to obtain sufficiently strong diffraction signals from small crystals
(Chapman et al., 2011; Sliz et al., 2003).
As a consequence thereof, the extent of radiation damage increases (Chapman et al., 2011; Sanishvili et al.,
2011). Recently, three important strategies have been developed which can bypass these limitations.
Firstly, X-ray free-electron lasers (XFEL) combined with serial femtosecond crystallography (SFX) can
provide high-resolution diffraction data from small crystals. The high-intensity beam obliterates the crystal
after one exposure, but before the crystal is destroyed diffraction is collected. This avoids radiation damage
by making use of the “diffraction-before-destruction” principle (Barty et al., 2013; Neutze and Moffat, 2012;

20
Schlichting and Miao, 2012). At this moment, a liquid jet of protein crystals at room temperature is
continuously exposed to ultrashot X-ray FEL pulses, each of 10-100 fs duration (Neutze and Moffat, 2012)
and with a 1012 times stronger peak intensity than obtained by synchrotron radiation (Fromme, 2015). Delivery
of such high doses of photon energy ultimately destroys the sample. However, the pulse terminates before
damage occurs, allowing to collect millions of diffraction pattern snapshots of the individual, randomly
oriented crystals. Data sets are then applied to software algorithms for the three-dimensional structure model
resolution. The shortcomings of XFEL are that the cost of the experiment is prohibitively high, instrument
beam time availability is very low, and difficulties processing the large amount of data are considerable (Liu
et al., 2016). Furthermore, recent studies indicate that even SFX data are affected by radiation damage (Nass
et al., 2015). Additional complications arise from the variance in the exposed crystal volume during each shot
and fluctuations in the pulse intensity. Scaling is achieved by merging the reflections originating from
thousands of diffraction patterns (Kirian et al., 2010, 2011). In XFEL experiments, the sample delivery is
commonly achieved via a nozzle that sprays grams of crystalline material at the diffraction beam. Therefore
the sample requirement is high, and the delivery nozzle can quite frequently clog up, thus stopping the
experiments (Liu et al., 2016).
Secondly, serial synchrotron crystallography (SSX) used a third-generation synchrotron microfocus beamline
(beam size reduced to ˂10 µm) as X-ray source and cryogenic crystals mounted into a rotating loop are serially
illuminated with somewhat higher-than-conventional flux densities. In contrast to SFX, multiple diffraction
patterns of the same crystal are obtained, increasing the redundancy of the data set.
Thirdly, micro-electronmicroscopy diffraction (MicroED) is a recently developed method, which allows the
collection of high-resolution diffraction data from tiny protein microcrystals using electron cryo-microscopy
(cryo-EM) (Shi et al., 2016). MicroED has determined several protein structures. The first structure solved by
still diffraction was that of lysozyme at 2.9 Å resolution (Shi et al., 2013) and 2.5 Å resolution by continuous
rotation (Nannenga et al., 2014a). This was followed by the elucidation of the structures of catalyse at 3.2 Å
resolution (Nannenga et al., 2014b) and of Ca2+/ATPase at 3.4 Å resolution (Yonekura et al., 2015).
In late 2015, the toxic core of α-synuclein structure was determined at 1.4 Å resolution (Rodriguez et al.,
2015), and recently the structures of four prion peptides were solved at 1 Å resolution and direct phasing
methods (Sawaya et al., 2016).
1.6 Aims of this study
Trypanosoma brucei is an extracellular hemoflagellated kinetoplastid protozoon and the causative agent of
HAT. The genome sequence of T. brucei revealed that approximately 50% of genes which are uncharacterized
21
for their biochemical or cellular functions are identified as hypothetical proteins with no homologs in the
human host. The hypothetical or uncharacterized proteins validated as essential for parasitic survival and
infectivity opens possibilities for new target identification and drug discovery. Previous experiments
discovered that T. brucei produces PGD2 PGE2 and PGF2α from exogenous arachidonic acid (Kubata et al.,
2000, 2007).
It was also shown that PGD2 is one of the best-characterized sleep-inducing substances and PGD2 injected
stereotactically into rat brain parenchyma induced directly sleep phenomenon (Hayaishi, 2000, 2002).
This data joins the Pentreath et al. publication, 1990, showing that a high concentration of PGD2 is found in
CSF of late stage sleeping sickness patients. This motivated us to analyze the prostaglandin biosynthetic
pathways in detail and to search for biomolecules secreted by trypanosomes. Firstly, our group could show
that PGD2 induces an apoptotic cells death in stumpy parasites, thus being involved in the parasite’s cell
density regulation to sustain the infection within the host (Duszenko et al., 2006). Secondly, our group isolated,
crystallized, structurally solved and enzymatically characterized the NADPH-dependent PGF synthase
(TbPGFS) from T. brucei that catalyzes the reduction of PGH2 to PGF2 (Okano et al., 2002). Thirdly, we
hypothesized that T. brucei might well possess a unique cyclooxygenase (COX)-like enzyme, developed by a
co-evolution process, that is responsible for prostaglandins production. Based on literature searches, there is
so far only one identified COX-like enzyme from Entamoeba histolytica, which also shows no clear structural
similarity to other well-known cyclooxygenases in protein databases (PDB) (Dey et al., 2003).
In the meantime, a peroxidase activity was detected in our group using Amplex Red in total trypanosome
lysates, and a positive signal was obtained by Western bot analysis of total trypanosome lysates using a
polyclonal cyclooxygenase ovine antibody (Barth, 2013). The specific band was cut-off for SDS-PAGE and
mass spectrometry analysis to identify the proteins recognized by the above polyclonal antibody. This lead us
to a list of known and hypothetical genes as putative T. brucei genes encoding for a putative cyclooxygenase-
like enzyme candidate (Barth, 2013).
Among them, one gene (Tb427.10.13790/Tb927.10.13790/Tb10.61.3130), internally named putative
cyclooxygenase-like gene from T. brucei, is annotated as a hypothetical protein in T. brucei genome databases
(TriTrydb, Genedb & NCBI gene). Homologs of this gene are conserved in all three major kinetoplastids (T.
brucei, T. cruzi and L. major). This gene was chosen for further experimental investigation. So far, our
bioinformatic analyses using Pfam, Prosite, Swiss-Pro, InterPro, TMHHM and NetPhos databases revealed
no convincing homolog protein in any other organisms. Additionally, these analyses revealed that the
respective protein in trypanosomes carries no known signal peptide and no transmembrane domain, while
extensive coil-coiled structures and multiple putative phosphorylation sites showed up.

22
The main goals of this thesis were: 1) to clone and express this annotated hypothetical protein from T. brucei
using E. coli and Sf9 insect cells as expression systems; 2) to investigate whether this annotated hypothetical
protein could crystallize in vivo using Sf9 insect cells prior to structural analysis using serial-X-ray
crystallography or free-electron laser (XFEL); 3) to investigate and validate the physiological function of the
pTbCOX protein in the trypanosome SMB cell line using RNA interference; 4) to develop SMB trypanosomes
expressing pTbCOX fused with GFP for localization studies. Our hope was that once identified and
characterized, the pTbCOX protein may become a potential target for HAT therapy.

23
2 Research thesis description
2.1 Statement of the problem
Previous experiments on the prostaglandin (PG) metabolism have shown that trypanosomes produce PGD2,
PGE2, and PGF2α from exogenous arachidonic acid (Kubata et al., 2000, 2007).
Our group has previously shown that production of prostaglandin-like compounds was not inhibitable by the
classical inhibitors of prostaglandin synthesis (NSAID) such as aspirin and indomethacin (Rawer, 2004;
Duszenko, unpublished observation). PGD2 is known to induce sleep in mammals (Hayaishi, 2000, 2002).
Since PGD2 is highly elevated in the cerebrospinal fluid of late stage sleeping patients (Pentreath et al., 1990),
production of this molecule by trypanosomes would help to understand the sleeping induction mechanism
which is one of the main symptoms observed during sleeping sickness.
It is also known and well demonstrated that PGD2 induces a form of apoptosis in stumpy parasites for cell
density regulation to sustain the infection within the host (Duszenko et al., 2006; Figarella et al., 2006).
However, in view of the prostaglandin metabolism, structure and function of the COX-like enzyme is still
poorly understood, since blast analysis of mammalian cyclooxygenase in higher eukaryotes did not reveal any
sequences with significant homology. This fact is easily understood since the invention of prostaglandin
synthesis during evolution occurred after the appearance of protozoa. Based on our experimental data and the
fact that trypanosomes produce prostaglandins from arachidonic acid, we hypothesized that Trypanosoma
brucei may well possess a unique COX-like enzyme that is responsible for prostaglandin production.
However, if the hypothetical conserved pTbCOX protein would appear not to be a COX-like enzyme, we will
delete the gene of this protein in T. brucei using RNAi to investigate whether it is essential (or not) and is thus
a suitable or credible target for inhibitory drugs development against HAT.
2.2 Justification
Arachidonic acid (AA) metabolites are potent lipid mediators of physiological and pathological processes in
humans and animals. The enzymes that catalyze the metabolism of AA are scientifically interesting for two
major reasons: First, they can be a target of chemotherapeutic agents (specific inhibitors) used to control
response mechanisms during inflammation; second, in vitro studies of these enzymes may well shed light on
the biochemical pathways of AA metabolism and physiological relevance of the AA metabolites, namely the
control of cell death mechanisms.
Parasitic protozoa undergo complex transformations in specific environments during their life cycles. Such
activities frequently involve an insect vector and a mammalian host.

24
The proliferation of the parasite within the mammalian host can cause disease and sometimes death. However,
rapid death is not the preferred outcome of the infection, because the parasite depends on its host to complete
its life cycle and propagate its progeny. Therefore, pathogenic parasites must have evolved mechanisms to
regulate critical checkpoints in their developmental cycle and potentially modulate the local physiological
response of the host.
Successful pathogens must have erected platforms that allow crosstalk between developmental regulatory
molecules of the parasite and those that regulate host cellular and tissue function. For this to occur, the parasite
should employ similar regulators with “built-in” unique features that allow it to evade the detection and
ultimately subvert such host functions. Arachidonic acid metabolites, i.e., PG, are suited for such a role
because they are known to be strong local regulators of host cells and tissue functions.
Despite PG association with the genesis of fever, somnolence, headache, ovarian dysfunction and immune
suppression observed during parasitic protozoa infections, the etiologic agents have just recently been given
a direct role in the production of these molecules.
Furthermore, the biochemical pathways of AA metabolism in mammalian cells do exist. However, these
biochemical pathways have not been unequivocally demonstrated in parasitic protozoa. Indeed, the knowledge
that parasites actively synthesize and release molecules like PGs that potentially modulate host functions
ascribes to the pathogen a more active role in the pathophysiology of the disease. In fact, PG production
appears first in sponges during evolution, but not in protozoa. Accordingly, PG synthesis in trypanosomes is
a typical co-evolutionary process that was probably established because of its benefits for the parasites.
Hence, a better understanding of the basic biochemical pathways of the parasites may pave the road to establish
new strategies for the development of more effective and less toxic drugs. The finding that PG-producing
enzymes are distinct from their mammalian counterpart makes them a suitable drug target.
As soon as some of the enzymes involved in PG synthesis in this parasite are discovered, genetic manipulation
will allow a definitive understanding of the role of theses enzymes respectively in the pathogenesis of sleeping
sickness and the life cycle of Trypanosoma brucei.
The identification and purification of that putative COX-like enzyme from T. brucei would, therefore, be of
great interest because it will bring new insights into the understanding of its role during the cell cycle, cell
morphogenesis, and pathogenesis. On the other hand, as more crystal structures of this enzymatic system are
determined, it will be possible to rationally design specific inhibitors and better drugs against sleeping
sickness.

25
3 Materials and Methods
3.1 Materials
3.1.1 Bacteria strains
Bacteria strains Supplier
BL21-DE3 E. coli Invitrogen, Karlsruhe
NEB Turbo Competent E. coli (High Efficiency) New England Biolabs, Frankfurt
One Shot Top 10 Competent E. coli Invitrogen, Karlsruhe
Max Efficiency DH10BacTM Invitrogen, Karlsruhe
Rosetta Competent Cells Merck, Darmstadt
3.1.2 Trypanosoma strains
In this work, the monomorphic single marker bloodstream forms (BF SMB) strain EATRO 427 clone MITat
1.2 (Molteno Institute Trypanozoon antigenic type, Cambridge) with the VSG (Variable Surface
Glycoprotein) antigen variant 221 (Cross, 1975) were used for the pTbCOX knockdown and pTbCOX-eGFP
expression experiments. The bloodstream forms SMB cells line (BF SMB) was used as wild type strains to
generate all the transgenic cell line during this PhD project.
The BF SMB/wild type strain and the transgenic cell line listed below have been named according to the T.
brucei community nomenclature (Clayton et al., 1998). However, in some cases alternatives name will be
used in this thesis to facilitate reading.
1. BF SMB (WT)
Name according to nomenclature: MITat1.2 T7RNAP TETR NEO
Selection marker: Geneticin (2 µg/ml)
2. BF pTbCOX-Knockdown
Made by: Celestin Mudogo & Salesia Werner
Name according to nomenclature: MITat1.2 T7RNAP TETR NEO RDNA::T7PROTi pTbCOX HYG
Alternative name: pTbCOX-RNAi or pTbCOX-KD
Plasmid name: p2T7Ablue
Selection marker: Geneticin (2 µg/ml), Phleomycin (2.5 µg/ml)

26
3. BF pTbCOX eGFP
Made by: Celestin Mudogo & Danyang Xu
Name according to nomenclature:
MITat1.2 T7RNAP TETR NEO HYG RDNA::PGPEETTi pTbCOX-eGFPT7RNAP BLE
Alternative name: pTbCOX-pCO57
Plasmid name: pCO57
Selection marker: Geneticin (2 µg/ml), Phleomycin (2.5 µg/ml)
3.1.3 Spodoptera frugiperda (Sf9) insect cells
Insect cells Sf9 (fall armyworm) stabilates were bought from Invitrogen, Germany, stored at -70°C and
propagated at 27°C in an incubator.
3.1.4 Antibodies
Antibodies Supplier
Anti-rabbit IgG alkaline phosphate conjugate Sigma-Aldrich, Steinheim
Anti-His-Tag (6-histidine) rabbit Biomol, Hamburg
3.1.5 Plasmids
Plasmids Supplier
pCR 2.1 Invitrogen, Karlsruhe
pProExHTa Invitrogen, Karlsruhe
pFastBacHTb Invitrogen, Karlsruhe
p2T7Ablue George Cross, New York, USA
pCO57 George Cross, New York, USA
3.1.6 Primers/Oligonucleotides
Primers (oligonucleotides) were purchased from Invitrogen and stored as 100 μM stock solution at -20°C. For
the polymerase chain reactions (PCR), the stock solution was used in a dilution of 1:10.
1. Primers for pTbCOX in pProExHTa expression in E. coli
Fw-BamHI-pTbCOX: 5´- GGATCCACCACGTTCTTTGGCATTTACTGA- 3´
Rv-HindIII-pTbCOX: 5´- AAGCTTTGGCATCAATTTTACCTACCC- 3´

27
2. Primers for pTbCOX in pFastBacHTb expression and in vivo protein crystallization in Sf9 insect
cells
Fw-BamHI: 5´- GGATCCATGGCAACCATAGCGGAGT- 3´
Rv-HindIII: 5´- AAGCTTTGGCATCAATTTTACCTACC- 3´
3. Primers for pTbCOX RNAi experiments
Fw-XhoI-pTbCOX-KD: 5´- CTCGAGAGATACGGGGAACACACGAG- 3´
Rv-BamHI-pTbCOX-KD: 5´- GGATCCAACGTGGAGAGGAACAGTGG- 3´
4. Primers for qRT-PCR experiments
Fw-pTbCOX-qPCR: 5´- AGGATTTGGAGGACGCGAAG- 3´
Rv-pTbCOX-qPCR: 5´- TAAGCACCTCAAGCATCCGT- 3´
Fw-ß-Tubulin-qPCR: 5´- TTCCGCACCCTGAAACTGA- 3´
Rv-ß-Tubulin-qPCR: 5´ - TGACGCCGGACACAACAG- 3´
5. Primers for pTbCOXpCO57 or pTbCOX-eGFP expression in T. brucei
Fw-HindIII-pTbCOX: 5´- AAGCTTATGGCAACCATAGCGGAGT- 3´
Rv-PvuII-pTbCOX: 5´- CAGCTGACCTTCAACTCGCGCTAG- 3´
3.1.7 Enzymes
Enzymes Supplier
BamHI Thermo Fisher Scientific, Braunschweig
EcoRV Thermo Fisher Scientific, Braunschweig
HindIII Thermo Fisher Scientific, Braunschweig
PvuII Thermo Fisher Scientific, Braunschweig
NotI Thermo Fisher Scientific, Braunschweig
T4DNA Ligase Qiagen GmbH, Hilden
DNase I Thermo Fisher Scientific, Braunschweig
Accu Prime DNA Polymerase High Fidelity Thermo Fisher Scientific, Braunschweig
HotStar Tag DNA Polymerase Qiagen GmbH, Hilden
XhoI Thermo Fisher Scientific, Braunschweig
3.1.8 General Chemicals
Chemicals Supplier
Acetone Sigma-Aldrich, Steinheim

28
Acetic acid Carl Roth GmbH, Karlsruhe
Agar 100 Resin Agar Scientific Ltd., Stansted (UK)
Agar-Agar Carl Roth GmbH, Karlsruhe
Agarose Biozym Scientific GmbH, Oldendorf
Ampuwa Fresenius Kabi, Bad Homburg
10% APS Carl Roth GmbH, Karlsruhe
L-Arginine Sigma-Aldrich, Steinheim
Bathocuproinedisulfonic acid disodium salt (BCS) Sigma-Aldrich, Steinheim
Benzyldimethylamine (BDMA) Agar Scientific Ltd., Stansted (UK)
Bovine serum albumin (BSA) Sigma-Aldrich, Steinheim
Bradford protein assay reagent Bio-Rad, Munich
5-Bromo-4-chloro-3-indolyl phosphate (BCIP) Sigma-Aldrich, Steinheim
Calcium chloride Merck Eurolab GmbH, Darmstadt
Chloroform Merck Eurolab GmbH, Darmstadt
Coomassie brilliant blue R-250 Serva, Heidelberg
L-Cysteine Sigma-Aldrich, Steinheim
4´, 6-Diamidino-2-phenylindole (DAPI) Sigma-Aldrich, Steinheim
DEAE-Sephacel Sigma-Aldrich, Steinheim
Digitonin Sigma-Aldrich, Steinheim
Dimethyl formamide Sigma-Aldrich, Steinheim
Disodium hydrogen phosphate Merck Eurolab GmbH, Darmstadt
Dipotassium hydrogen phosphate Merck Eurolab GmbH, Darmstadt
6X DNA loading dye Thermo Fisher Scientific, Braunschweig
Dodecenylsuccinic Anhydride (DDSA) Agar Scientific Ltd., Stansted (UK)
Doxycycline hyclate Sigma-Aldrich, Steinheim
Epon Sigma-Aldrich, Steinheim
Ethylenediaminetetraacetic acid disodium salt (EDTA) Carl Roth GmbH, Karlsruhe
Ethyleneglycol-bis (ß-aminoethyl ether)-N,N,N´, N´-
tetraacetic acid (EGTA)
Sigma-Aldrich, Steinheim
Ethanol Carl Roth GmbH, Karlsruhe
EX-CELL 420 serum free medium w/L-Glutamine Sigma-Aldrich, Steinheim
Fetal calf serum (FCS) Invitrogen, Karlsruhe
Formaldehyde (37%) Sigma-Aldrich, Steinheim
GeneRuler 1 kb DNA Ladder Invitrogen, Karlsruhe
O´Gene Ruler Ultra Low Range DNA Ladder Thermo Fisher Scientific, Schwerte

29
Gentamicin Sigma-Aldrich, Steinheim
Geneticin (G-418) (50 mg/ml) Carl Roth GmbH, Karlsruhe
D-Glucose monohydrate Sigma-Aldrich, Steinheim
L-Glutamine Sigma-Aldrich, Steinheim
L-Glutamic acid Sigma-Aldrich, Steinheim
Glutaraldehyde 25% Carl Roth GmbH, Karlsruhe
L-Glutathione reduced (GSG) Sigma-Aldrich, Steinheim
L-Glutathione oxidized (GSSG) Sigma-Aldrich, Steinheim
Glycerin 87% or 100% Sigma-Aldrich, Steinheim
L-Glycine Sigma-Aldrich, Steinheim
Guanidine hydrochloride Sigma-Aldrich, Steinheim
Haemin Sigma-Aldrich, Steinheim
HEPES Sigma-Aldrich, Steinheim
L-Histidine Sigma-Aldrich, Steinheim
Hydrochloric acid Merck Eurolab GmbH, Darmstadt
Hygromycin B (50 mg/ml) Roche, Basel
Hypoxanthine Sigma-Aldrich, Steinheim
Imidazole Sigma-Aldrich, Steinheim
Iscove’s Modified Dulbecco’s Medium (IMDM) Sigma-Aldrich, Steinheim
L-Isoleucine Sigma-Aldrich, Steinheim
Isopropanol Merck Eurolab GmbH, Darmstadt
Kanamycin Merck Eurolab GmbH, Darmstadt
Leupeptin Merck Eurolab GmbH, Darmstadt
L-Lysine Sigma-Aldrich, Steinheim
Magnesium chloride Merck Eurolab GmbH, Darmstadt
Magnesium sulphate Merck Eurolab GmbH, Darmstadt
MEM vitamin solution Sigma-Aldrich, Steinheim
MEM amino acids Sigma-Aldrich, Steinheim
Mercaptoethanol Merck Eurolab GmbH, Darmstadt
Methanol Carl Roth GmbH, Karlsruhe
L-Methionine Sigma-Aldrich, Steinheim
Methyl-5-norbronene-2,3-dicarboxylic anhydride (MNA) Agar Scientific Ltd., Stansted (UK)
Midori Green Advance DNA Stain Nippon Genetics, Düren
Monopotassium phosphate Merck Eurolab GmbH, Darmstadt
N-Lauroylsarcosine sodium salt Sigma-Aldrich, Steinheim

30
Nitro Blue tetrazolium (NBT) Sigma-Aldrich, Steinheim
Nonidet P-40 Sigma-Aldrich, Steinheim
L-Ornithine Sigma-Aldrich, Steinheim
Osmium Tetroxide Carl Roth GmbH, Karlsruhe
Paraformaldehyde Fluka, Buchs
Penicillin/Streptomycin Sigma-Aldrich, Steinheim
Pepstatin Sigma-Aldrich, Steinheim
Pepton aus casein Carl Roth GmbH, Karlsruhe
Phenol red Sigma-Aldrich, Steinheim
L-Phenylalanine Sigma-Aldrich, Steinheim
Polyethyleneglycol 6000 (PEG) Sigma-Aldrich, Steinheim
Potassium acetate Merck Eurolab GmbH, Darmstadt
Potassium chloride Merck Eurolab GmbH, Darmstadt
Potassium dihydrogen phosphate Merck Eurolab GmbH, Darmstadt
Potassium hydroxide Carl Roth GmbH, Karlsruhe
Prestained protein ladder Thermo Fisher Scientific, Braunschweig
Protein molecular marker Thermo Fisher Scientific, Braunschweig
L-Proline Sigma-Aldrich, Steinheim
Propidium iodide Sigma-Aldrich, Steinheim
Propylene oxide Sigma-Aldrich, Steinheim
Protease Inhibitor Cocktail Sigma-Aldrich, Steinheim
Pyruvate Sigma-Aldrich, Steinheim
Roti® Load-1 Carl Roth GmbH, Karlsruhe
RNase away® Thermo Fisher Scientific, Braunschweig
Sodium azide Sigma-Aldrich, Steinheim
Sodium acetate Sigma-Aldrich, Steinheim
Sodium cacodylate trihydrate Sigma-Aldrich, Steinheim
Sodium chloride Fuka, Buchs
Sodium bicarbonate Sigma-Aldrich, Steinheim
Sodium citrate dihydrate Carl Roth GmbH, Karlsruhe
Sodium dihydrogen phosphate Merck Eurolab GmbH, Darmstadt
Sodium dihydrogen carbonate Merck Eurolab GmbH, Darmstadt
Sodium dodecyl sulphate Sigma-Aldrich, Steinheim
Sodium hydroxide Sigma-Aldrich, Steinheim
RNase away Fisher Thermo Scientific GmbH, Schwerte

31
Saccharose Sigma-Aldrich, Steinheim
Serum Plus SLBG4295 SAFC Biosciences, Hampshire (UK)
10% SDS Carl Roth GmbH, Karlsruhe
Sucrose Sigma-Aldrich, Steinheim
TEMED Carl Roth GmbH, Karlsruhe
Tetracycline Sigma-Aldrich, Steinheim
L-Threonine Sigma-Aldrich, Steinheim
Thymidine Sigma-Aldrich, Steinheim
Tris-HCl Carl Roth GmbH, Karlsruhe
Triton X-100 Carl Roth GmbH, Karlsruhe
L-Tryptophane Sigma-Aldrich, Steinheim
Tween 20 Carl Roth GmbH, Karlsruhe
L-Tyrosine Sigma-Aldrich, Steinheim
L-Valine Sigma-Aldrich, Steinheim
Uranyl acetate Plane GmbH, Wetzlar
Yeast extract Sigma-Aldrich, Steinheim
3.1.9 Kits
Kit Supplier
AccuPrime Tag DNA Polymerase high fidelity Kit Invitrogen, Karlsruhe
Bac-to-Bac Baculovirus Expression System Kit Invitrogen, Karlsruhe
HotStar Tag Master Mix Kit Qiagen GmbH, Hilden
Dneasy Blood & Tissue Kit Qiagen GmbH, Hilden
QIAquick gel extraction Kit Qiagen GmbH, Hilden
QIAquick PCR purification Kit Qiagen GmbH, Hilden
Qiagen Plasmid Midi Kit Qiagen GmbH, Hilden
QIAprep Spin Miniprep Kit Qiagen GmbH, Hilden
Power SYBR Green RNA-to CT 1-step Kit Thermo Fisher Scientific, Braunschweig
Rneasy Mini Kit Qiagen GmbH, Hilden
TOPO TA Cloning Kit Thermo Fisher Scientific, Braunschweig
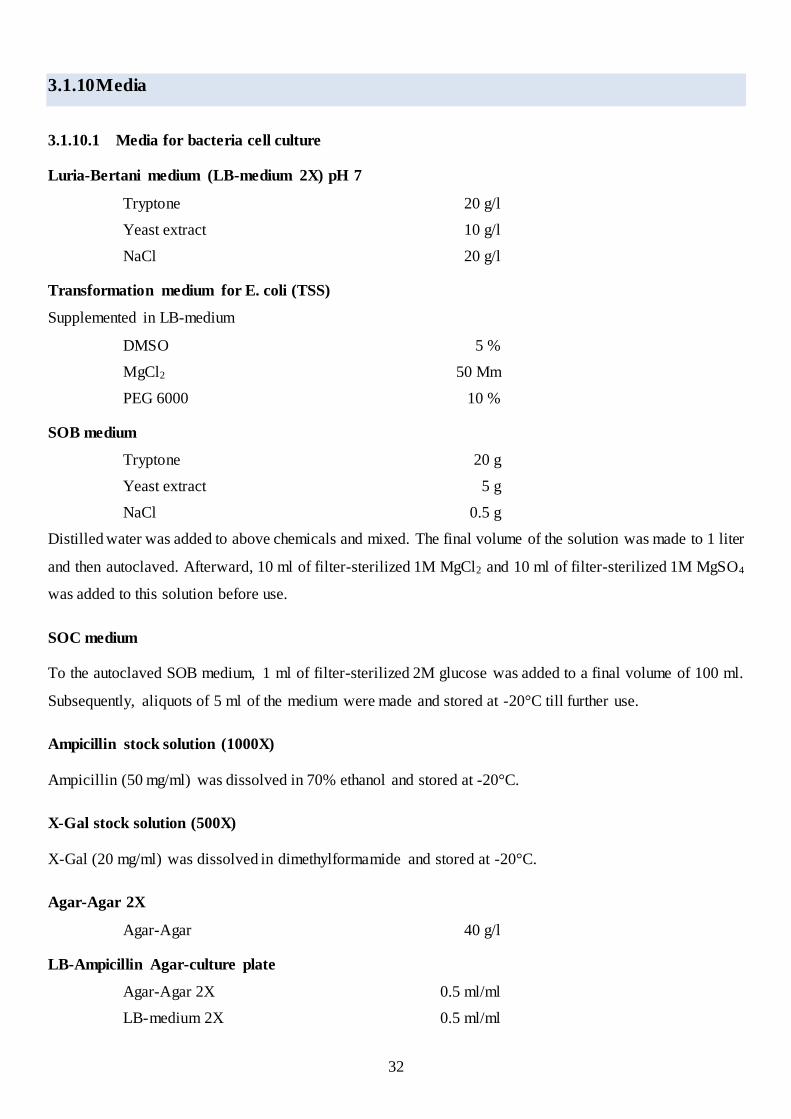
32
3.1.10 Media
3.1.10.1 Media for bacteria cell culture
Luria-Bertani medium (LB-medium 2X) pH 7
Tryptone 20 g/l
Yeast extract 10 g/l
NaCl 20 g/l
Transformation medium for E. coli (TSS)
Supplemented in LB-medium
DMSO 5 %
MgCl2 50 Mm
PEG 6000 10 %
SOB medium
Tryptone 20 g
Yeast extract 5 g
NaCl 0.5 g
Distilled water was added to above chemicals and mixed. The final volume of the solution was made to 1 liter
and then autoclaved. Afterward, 10 ml of filter-sterilized 1M MgCl2 and 10 ml of filter-sterilized 1M MgSO4
was added to this solution before use.
SOC medium
To the autoclaved SOB medium, 1 ml of filter-sterilized 2M glucose was added to a final volume of 100 ml.
Subsequently, aliquots of 5 ml of the medium were made and stored at -20°C till further use.
Ampicillin stock solution (1000X)
Ampicillin (50 mg/ml) was dissolved in 70% ethanol and stored at -20°C.
X-Gal stock solution (500X)
X-Gal (20 mg/ml) was dissolved in dimethylformamide and stored at -20°C.
Agar-Agar 2X
Agar-Agar 40 g/l
LB-Ampicillin Agar-culture plate
Agar-Agar 2X 0.5 ml/ml
LB-medium 2X 0.5 ml/ml

33
X-Gal (20 mg/ml) 2 µg/ml
Ampicillin (50 mg/ml) 1 µg/ml
3.1.10.2 Media for Sf9 cell culture
EX-CELL® 420 serum-free medium with L-glutamine (Sigma-Aldrich, Steinheim) was used for the insect
cell culture after the addition of 5 ml/l of a penicillin/ streptomycin stock solution.
3.1.10.3 Media for Trypanosoma brucei cell culture
1. Basic medium pH 7.2
IMDM 35.4 g/l
Sodium Bicarbonate 3.02 g/l
H2O distilled (d H2O) 900 ml/l
Add 1 l d H2O
2. 1X HMI-9 Medium/Complete bloodstream culture medium (BF-medium) pH 7.4
Basic medium 890 ml/l
L-Cysteine (18.2 mg/ml in d H2O) 11 ml/l
Pyruvate (110 mg/ml in d H2O) 1.11 ml/l
Thymidine (39 mg/ml in d H2O) 1.11 ml/l
Hypoxanthine (13.6mg/10ml with 0.1N NaOH) 10 ml/l
BCS (28.2 mg/ml in d H2O) 1.11 ml/l
2-Mercaptoethanol 15.5 µl/l
Penicillin/Streptomycin (100X) 11 ml/l
FBS (Heat inactivated: 30 min. 56°C) 110 ml/l
Serum Plus (No overheated) 110 ml/l
The BF-medium was adjusted to pH 7.4 using NaOH. Afterwards, it was sterile filtered and stored at 4°C and
can be used for up to 4 weeks.
3. Cytomix buffer
Cytomix buffer was prepared to be use for stable transfection in T. brucei experiments. At first, preparation
of the Phosphate buffer (8.66 ml/100 ml dH2O K2HPO4 (1M)/ 1.34 ml/100 ml dH2O KH2PO4 (1M) pH 7.6).
Cytomix buffer:
EGTA 0.76 g/l
KCl 8.88 g/l
CaCl2 x 2 H2O 19.2 mg/l

34
MgCl2 x 6 H2O 1.01 g/l
Glucose 5.00 g/l
Bovine Serum albumin 100 mg/l
HEPES 5.96 g/l
K2HPO4/KH2PO4 100 mg/l
Hypoxanthine (1.36 g in 100 ml NaOH) 10 ml/l
Add 1 l dH2O; adjust pH 7.6 and sterile filtration.
4. Trypanosome dilution buffer (TDB) pH 7.7
Na2HPO4 X 12 H2O (18 mM) 6.45 g/l
NaH2PO4 X H2O (2 mM) 0.28 g/l
KCl (5mM) 0.37 g/l
NaCl (80 mM) 4.67 g/l
MgSO4 X 7 H2O (1mM) 0.25 g/l
Glucose X H2O (20 mM) 3.96 g/l
5. Freezing medium for stabilates (TDB-Glycerin)
77 ml/100 ml TDB
23 ml/100 ml Glycerin 87% (20% end concentration)
3.1.11 Buffers and solutions
3.1.11.1 Buffers for agarose gel electrophoresis
Agarose gel electrophoresis (1%)
0.5 g/50 ml Agarose
Add 50 ml TAE buffer (50X) pH 8.0.
Heat the mixture in the microwave till the solution become clear without any particle.
Add 2.5 µl/50 ml Midori Green Advance.
TAE- buffer pH 8.0 (50X)
Tris 242 g/l
Na2EDTA 37.2 g/l
Acetic acid 57.1 ml/l
dH2O add to 1 l
3.1.11.2 Buffers and solutions for 10% SDS-PAGE and Gel staining
Running buffer pH 8.3

35
Tris 3.04 g/l
Glycine 14.42 g/l
SDS 1 g/l
dH2O add to 1 l
Resolving gel (for 4 gels)
1 M Tris-HCl (pH 8.8) 8.60 ml
dH2O 6.60 ml
Acrylamide 7.60 ml
10% SDS 228 µl
10% APS 78 µl
TEMED 24 µl
Stacking gel (for 4 gels)
1 M Tris-HCl (pH 6.8) 1.50 ml
dH2O 8.40 ml
Acrylamide 2.00 ml
10% SDS 120 µl
10% APS 60 µl
TEMED 12 µl
3.1.11.3 Coomassie staining
Staining solution
Coomassie Brilliant Blue R-250 1 g/l
Ethanol 400 ml/l
Acetic acid 100 ml/l
dH2O 500 ml/l
Coomassie Brilliant Blue R-250 was dissolved in ethanol. Subsequently, other solutions were added after
Coomassie was completely solubilized and the volume was made up to 1 liter.
Destaining solution
Ethanol 400 ml/l
Acetic acid 100 ml/l
dH2O 500 ml/l
3.1.11.4 Siver staining
Fixation solution

36
Acetic acid 12%
Ethanol 40%
Formaldehyde (37%) 0.05%
Wash solution
Ethanol 50%
dH2O 50%
Pretreatment
Na2S2O3 X 5H2O 0.2%
Impregnation
AgNO3 0.2%
Formaldehyde (37%) 0.075%
Development
Na2CO3 6%
Na2S2O3 X 5H2O (10% in dH2O) 0.004%
Formaldehyde (37%) 0.005%
Stop solution
Ethanol 40%
Acetic acid 12%
All Silver staining solutions were made in distilled water (dH2O).
Gel drying solution
Glycerol 87% 2.3%
Ethanol 25%
The gel drying olution was made in dH2O and volume made up to 1 liter.
3.1.11.5 Buffers and solutions for Western blot
Transfer buffer pH 9.2
Tris (48 mM) 5.82 g/l
Glycine (39 mM) 2.93 g/l
SDS (10%) 3.75 ml
Methanol (20%) 200 ml/l
Wash buffer pH 7.4
Tris (10 mM) 1.21 g/l
NaCl (150 mM) 8.766 g/l

37
Tween 20 (0.1%) 1 ml/l
Tris Buffered Saline (TBS) pH 7.4
Tris (25 mM) 5.82 g/l
KCl 0.2 g/l
NaCl 8 g/l
Blocking solution
Milk powder 10% in 2 X PBS
2X Phosphate Buffered Saline (PBS) pH 7.4
Na2HPO4 X 12H2O 7.26 g/l
KH2PO4 0.48 g/l
NaCl 16 g/l
KCl 0.40 g/l
Alkaline phospatase (AP buffer) pH 8.9
Tris (20 mM) 2.42 g/l
NaCl (150 mM) 8.77 g/l
MgCl2 (10 mM) 2.03 g/l
Color development solutions
BCIP, Toluidine salt (fresh solution in 100% DMF) (0.38 Mm) 7 mg/250 µl
NBT (fresh solution in 70% DMF) 16.25 mg/500 µl
The BCIP and NBT solutions were dissolved in 50 ml AP buffer for each blot.
Primary antibody (Anti-His (6x histidine) ) in TBS 1:1000
Secondary antibody (Anti-Rabbit IgG, alkaline phosphatase conjugated) in TBS 1:10 000
3.1.11.6 Buffers for transmission electron microscopy
Cacodylate buffer (2x)
Na-Cacodylate x 3 H2O 4.28 g
Sucrose 8.00 g
dH2O add to 100 ml
Glutaraldehyde in cacodylate buffer
2% or 2.5% Glutaraldehyde in 1x cacodylate buffer
Osmium tetroxide in cacodylate buffer
3% OsO4 1:1 in 2x cacodylate buffer

38
Osmium tetroxide solution (3%)
OsO4 0.25 g
dH2O 8.18 ml
Uranyl acetate (0.5%)
Uranyl acetate 5 mg
dH2O 1 ml
Epon
Agar 2 g
DDSA 1 g
MNA 1.08 g
BDMA 0.04 g
3.1.11.7 Buffers for Inclusions bodies (IBs) isolation and solubilization
Lysis buffer pH 7.5
Tris-HCl 20 mM
EDTA 15 mM
Triton X-100 1%
IBs solubilization buffer pH 8
Tris-HCl 50 mM
GuHCl 4 M
BME 10 mM
Additives used for Refolding procedure
L-Arginine 0.4 M and 0.1 M
L-Glutathione reduced 3 mM
L-Glutathione oxidized 0.3 mM
3.1.11.8 Buffers for Ni-NTA affinity chromatography using AKTA-FPLC
Equilibration & Wash buffer pH 8
Tris-HCl 20 mM
NaCl 1 M
Binding buffer pH 8
Tris-HCl 20 mM
NaCl 150 mM
Imidazole 10 mM

39
Triton X-100 0.1%
Elution buffer pH 8
Tris-HCl 20 mM
Imidazole 500 mM
3.1.12 Consumables
Materials Supplier
Balance Mettler PJ3000 Mettler-Toledo GmbH, Giessen
Balance OHAUS® Analytical plus Ohaus Corporation, Giessen
Beem - Blocks Plano GmbH, Wetzlar
Cover slip slides Carl Roth GmbH, Karlsruhe
Cryotubes Greiner Bio-One GmbH, Frickenhausen
Electroporation cuvette 0.2 cm Bio-Rad Laboratories Inc., München
Eppendorf cups (1.5 ml and 2 ml) Greiner Bio-One GmbH, Frickenhausen
Falcon tubes (15 ml and 50 ml) Greiner Bio-One GmbH, Frickenhausen
Flask cell culture T-25, T-75, T-150 Greiner Bio-One GmbH, Frickenhausen
Grids Plano GmbH, Marburg Brand, Wertheim
Hemocytometer (0.02 mm) Brand, Wertheim
Hybond-ECL Nitrocellulose membrane Amersham Biosciences, Freiburg
Nalgene Rapid-Flow 50 mm Bottle Top Filter Thermo Fisher Scientific, Karlsruhe
Negative Film KODAK 4488/Caresteam Plano GmbH, Wetzlar
Nitrocellulose Membrane GE Healthcare, Dornstadt
Millex-PES-Filter (0.22 µm) Carl Roth GmbH, Karlsruhe
Object slides Carl Roth GmbH, Karlsruhe
Object Polylysine slides Gerhard Menzel GmbH, Braunschweig
Parafilm American Can Go, Chicago (USA)
PCR-Tubes Greiner Bio-One GmbH, Frickenhausen
Petri dishes Greiner Bio-One GmbH, Frickenhausen
Sterile pipette Greiner Bio-One GmbH, Frickenhausen
Sterile filter (0.22 µm) Carl Roth GmbH, Karlsruhe
UV-Cuvette, Mikro Carl Roth GmbH, Karlsruhe
6/12/24/48 and 96 well platte Greiner Bio-One GmbH, Frickenhausen
96-well reaction plate (0.1 ml) Applied Biosystems, Fisher Scientific GmbH,
Schwerte
Whatman paper Whatman, Maidstone (USA)

40
3.1.13 Equipments
Equipments Supplier
ÄKTA FPLC GE Healthcare, München
Autoclave Münchner Mechanik, Stadlern
Beckmann Centrifuge Beckmann, München
Beckmann TI-100 Ultracentrifuge Beckmann, München
Centrifuge Heraus Multifuge 1L-R Heraus, Osterode
Centrifuge Sigma 3K12 Bachoder, Reutlingen
Incubator Hera Cell (37°C, 5% CO2) Heraus, Osterode
Incubator 37°C Infos AG, Bottmingen
Inverted Microscope ID02 Zeiss, Oberkochen
Light Microscope Axiostar plus Zeiss, Oberkochen
Light Microscope Leica DM IL LED Leica Microsystems CMS GmbH, wetzlar
Fluorescence Microscope (AG Dodt and AG
Jansen)
Carl Zeiss AG, Oberkochen
Fluorescence Microscope BH2 RFCA Olympus, Hamburg
Microscope-Camera U-PMTVC Olympus, Hamburg
Microprocessor pH-Meter Bachofer, Reutlingen
Microwave Panasonic, Wiesbaden
Micro centrifuge Pico17 Heraus, Osterode
Mini Centrifuge MiniStar Galaxy VWR International GmbH, Erlangen
Nanodrop ND-1000 (AG Thilo Sthele) PreqLab, VWR International GmbH, Erlangen
Oven drying machine BINDER GmbH, Tuttlingen
Pressure Cooker CS Solingen, Solingen
pH-Meter WTW, Weilheim
Photometer Ultraspec 3000 Pharmacia Biotech, Wien
Power Supply EPS301 for Gel electrophoresis Amersham pharmacia biotech, Freiburg
Pyramitome 11800 LKB Ultramicrotome Laboratory
Shaker Brau, Melsungen
Spectrophotometer GeneQuant 1300 GE Healthcare, München
Sterilbank LaminAir HLB 2248 GS Heraus, Osterode
SteOnePlus® Real-time PCR System Applied Biosystems, Thermo Fisher Scientific,
Braunschweig
Transmission electron microscope EM10 Zeiss, Oberkochen
Ultramicrotome OM U3C Reichert, Wien
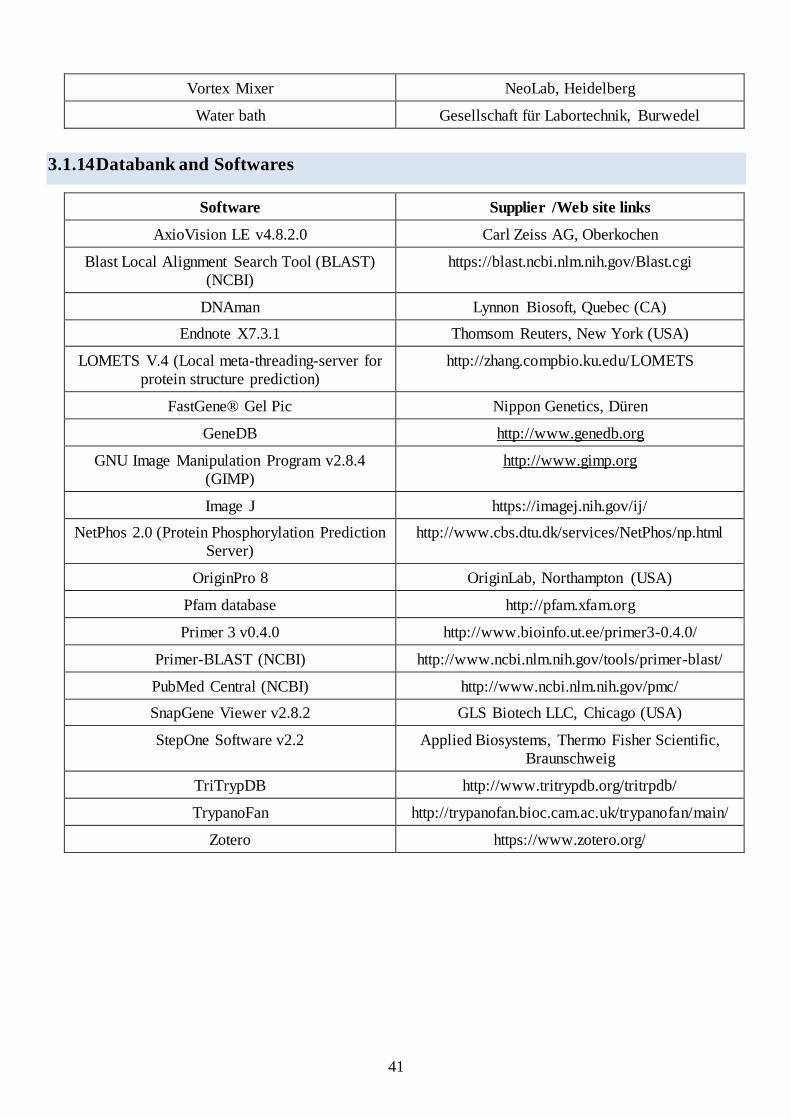
41
Vortex Mixer NeoLab, Heidelberg
Water bath Gesellschaft für Labortechnik, Burwedel
3.1.14 Databank and Softwares
Software Supplier /Web site links
AxioVision LE v4.8.2.0 Carl Zeiss AG, Oberkochen
Blast Local Alignment Search Tool (BLAST)
(NCBI)
https://blast.ncbi.nlm.nih.gov/Blast.cgi
DNAman Lynnon Biosoft, Quebec (CA)
Endnote X7.3.1 Thomsom Reuters, New York (USA)
LOMETS V.4 (Local meta-threading-server for
protein structure prediction)
http://zhang.compbio.ku.edu/LOMETS
FastGene® Gel Pic Nippon Genetics, Düren
GeneDB http://www.genedb.org
GNU Image Manipulation Program v2.8.4
(GIMP)
http://www.gimp.org
Image J https://imagej.nih.gov/ij/
NetPhos 2.0 (Protein Phosphorylation Prediction
Server)
http://www.cbs.dtu.dk/services/NetPhos/np.html
OriginPro 8 OriginLab, Northampton (USA)
Pfam database http://pfam.xfam.org
Primer 3 v0.4.0 http://www.bioinfo.ut.ee/primer3-0.4.0/
Primer-BLAST (NCBI) http://www.ncbi.nlm.nih.gov/tools/primer-blast/
PubMed Central (NCBI) http://www.ncbi.nlm.nih.gov/pmc/
SnapGene Viewer v2.8.2 GLS Biotech LLC, Chicago (USA)
StepOne Software v2.2 Applied Biosystems, Thermo Fisher Scientific,
Braunschweig
TriTrypDB http://www.tritrypdb.org/tritrpdb/
TrypanoFan http://trypanofan.bioc.cam.ac.uk/trypanofan/main/
Zotero https://www.zotero.org/

42
3.2 Methods and Protocols
3.2.1 Standard protocols for molecular biology
3.2.1.1 Extraction of genomic DNA from T. brucei bloodstream form (BF221)
Genomic DNA from T. brucei BF221 was extracted using a DNeasy Blood & Tissue Kit QIAGEN (Hilden,
Germany). The extraction procedure was accomplished according to the manufacturer’s instructions as
follows: Per column 1x10⁶ cells were added, the cells were centrifuged at 3000g for 5 min at 4°C. DNA was
eluted with 100 µl elution buffer per column and stored at -20°C.
3.2.1.2 Polymerase chain reaction (PCR)
The full length pTbCOX gene (Tb427.10.13790/Tb927.10.13790/Tb10.61.3130) was amplified from T.
brucei BF221 bloodstream form genomic DNA using AccuPrime Tag DNA Polymerase High Fidelity
(Thermo Fischer Scientific, Germany). The AccuPrime PCR reaction mixture and program used for the
pTbCOX amplification are described below:
AccuPrimeTM PCR reaction mixture AccuPrimeTM PCR -Program
10xAccuPrimeTM PCR Buffer 5.00 µl Denaturation 94°C 30 sec 1X
Fw-pTbCOX Primer, 10 µM 1.00 µl Denaturation 94°C 30 sec
Rv-pTbCOX Primer, 10 µM 1.00 µl Annealing 56°C 30 sec 30X
T. brucei gDNA (28 ng/µl) 1.00 µl Elongation 68°C 2 min
AccuPrimeTM DNA Polymerase (5 U/µl) 0.20 µl Cooling 4°C 24 h 1X
3.2.1.3 Agarose gel electrophoresis
The pTbCOX PCR product as well as products obtained by restriction digestion were subjected in 1% agarose
(w/v) (Biozym Scientific, Germany) dissolved in 1x TAE buffer (50x TAE: 242,0 g/l, 57,1 ml/l acetic acid,
37,2 g/l EDTA). After heating in the microwave until the solution became clear, Midori Green Advance DNA
stain (Nippon Genetics, Germany) was added to a ratio of 5 µl/100 ml gel. Samples were mixed with an
appropriate volume of 6x DNA Gel Loading Dye (Thermo Fischer Scientific, Germany) to reach an end
concentration of 1x DNA Gel Loading Dye. For size reference, 1 kb Gene Ruler (Thermo Fischer Scientific,
#SM0311, Germany) was used. Depending on the gel size, electrophoresis was performed for 45 min or 1
hour at 80-100 V. The gel was visualized using LED illuminator.
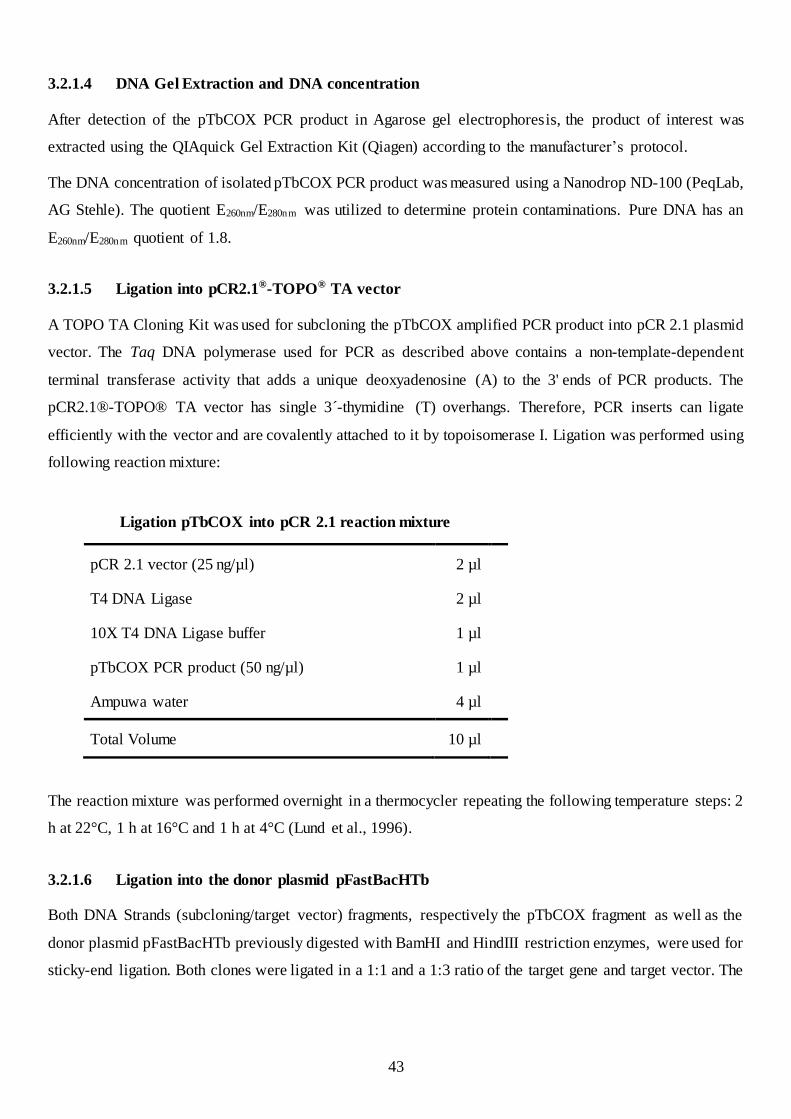
43
3.2.1.4 DNA Gel Extraction and DNA concentration
After detection of the pTbCOX PCR product in Agarose gel electrophoresis, the product of interest was
extracted using the QIAquick Gel Extraction Kit (Qiagen) according to the manufacturer’s protocol.
The DNA concentration of isolated pTbCOX PCR product was measured using a Nanodrop ND-100 (PeqLab,
AG Stehle). The quotient E260nm/E280nm was utilized to determine protein contaminations. Pure DNA has an
E260nm/E280nm quotient of 1.8.
3.2.1.5 Ligation into pCR2.1®-TOPO® TA vector
A TOPO TA Cloning Kit was used for subcloning the pTbCOX amplified PCR product into pCR 2.1 plasmid
vector. The Taq DNA polymerase used for PCR as described above contains a non-template-dependent
terminal transferase activity that adds a unique deoxyadenosine (A) to the 3' ends of PCR products. The
pCR2.1®-TOPO® TA vector has single 3´-thymidine (T) overhangs. Therefore, PCR inserts can ligate
efficiently with the vector and are covalently attached to it by topoisomerase I. Ligation was performed using
following reaction mixture:
Ligation pTbCOX into pCR 2.1 reaction mixture
pCR 2.1 vector (25 ng/µl) 2 µl
T4 DNA Ligase 2 µl
10X T4 DNA Ligase buffer 1 µl
pTbCOX PCR product (50 ng/µl) 1 µl
Ampuwa water 4 µl
Total Volume 10 µl
The reaction mixture was performed overnight in a thermocycler repeating the following temperature steps: 2
h at 22°C, 1 h at 16°C and 1 h at 4°C (Lund et al., 1996).
3.2.1.6 Ligation into the donor plasmid pFastBacHTb
Both DNA Strands (subcloning/target vector) fragments, respectively the pTbCOX fragment as well as the
donor plasmid pFastBacHTb previously digested with BamHI and HindIII restriction enzymes, were used for
sticky-end ligation. Both clones were ligated in a 1:1 and a 1:3 ratio of the target gene and target vector. The

44
ligation mixture for the proportion 1:1 was set up for a total volume of 20 µl, whereas the ligation mixes for
the ratio 1:3 were prepared for a total volume of 30 µl (see description below).
Components Volume for 1:2 ratio Volume for 1:3 ratio
Vector pFastBacHTb 5 µl 5 µl
pTbCOX 5 µl 15 µl
10X T4 DNA Ligase buffer 2 µl 3 µl
T4 DNA Ligase 1 µl 1 µl
Ampuwa water 7 µl 6 µl
Total Volume 20 µl 20 µl
The reaction was performed overnight in a thermocycler, repeating the following temperature steps: 2 h at
22°C, 1 h at 16°C and 1 h at 4°C (Lund et al., 1996).
3.2.1.7 Transformation of chemically competent E. coli
Immediately after ligation, the freshly ligated DNA construct was transformed into NEB® Turbo Competent
E. coli (New England Biolabs, Germany) or One Shot Top10 E. coli (Invitrogen, Germany) and in expression
grade BL21-DE3 competent cells using a protocol from Stratagene. The tubes of competent cells were thawed
on ice for 10 min. Then, 10 µl ligation product was gently added into pre-chilled 100 µl tubes of competent
bacteria cells. The tubes were incubated on ice for 30 min.
Afterward, a heat shock was applied for 30 sec at 42°C, using a prewarmed water bath. The duration of the
heat shock was critical for maximum efficiency. Thereon, the cells were supplemented with 200 µl of
prewarmed SOC medium and incubated for 1 h at 37°C at 225 rpm in a shaking incubator.
Finally, the cells were plated on LB agar plates containing appropriate antibiotic (and containing X-gal and
IPTG if blue-white screening was desired) for selection purposes.
After overnight incubation at 37°C, single colonies were picked and screened for true uptake of the transgene
by colony PCR, plasmid purification, and restriction digestion. Colonies validated to carry the desired
construct were used to prepare long-term cryostock stabilates.

45
3.2.1.8 Bacterial colony PCR
The PCR was performed using HotStarTaq® Master Mix Kit (Qiagen). A single bacterial colony was picked
with a sterile pipette tip and transferred into the prepared PCR mix.
The components of the PCR reaction mixture and the Master mix PCR program ran in the thermocycler are
shown below:
PCR reaction mixture Master mix PCR-Program
HotStarTag®Master Mix (5 U/µl) 10.00 µl Activation 95°C 15 min 1X
Fw-pTbCOX Primer, 10 µM 1.00 µl Denaturation 94°C 1 min
Rv-pTbCOX Primer, 10 µM 1.00 µl Annealing 56°C 1 min 30X
Bacteria from single colony - Elongation 68°C 2 min
Ampuwa water 0.20 µl Final Extension 4°C 24 h 1X
3.2.1.9 Plasmid purification from E. coli
Plasmid mini-preparation
After transformation, the colonies were selected and inoculated with a sterile pipette tip into respective 6 ml
LB medium with appropriate selective antibiotics (i.e. 50 mg/ml ampicillin). The cultures were propagated at
37°C with shaking at 225-250 rpm. After overnight incubation (17 h), the plasmid purification was done using
QIAprep Spin Miniprep Kit (Qiagen, Germany). The starter culture was harvested by centrifugation at 13000
rpm (Amicon microcentrifuge MC13) for 2 min. The supernatant was discarded, and the pellet was re-
suspended in 250 µl P1 buffer, incubated for 5 min at room temperature. The re-suspended cells were lysed
by adding 250 µl alkaline P2 buffer, gently inverting the solution 4-6 times and stand for 5 min. The solution
was neutralized with 350 µl N3 buffer.
The precipitate was spun down at 13000 rpm for 10 min. The supernatant was transferred to a QIAprep spin
column and centrifuged at 13000 rpm for 1 min. The column was washed with 0.5 ml buffer PB and 0.75 ml
buffer PE. DNA bound to the column was eluted with 50 µl H2O or elution EB buffer and stored at -20°C.
Plasmid midi-preparation
For plasmid midi-preparation, the QIAprep Spin Midiprep Kit (Qiagen, Germany) was utilized. 50 ml E. coli
overnight culture at 37°C respectively inoculated with the colonies and under specific antibiotics selection
pressure were centrifuged at 6000g for 15 min at 4°C and then the bacterial pellet resuspended in 4 ml P1
46
buffer (add RNase A solution to buffer P1 before to use, mix, and store at 2-8°C). The resuspended cells were
lysed by adding a 4 ml P2 buffer, mix thoroughly by vigorously inverting 4-6 times, and incubated for 5 min
at room temperature. The solution was neutralized with 4 ml prechilled P3 buffer, mix thoroughly by
vigorously inverting 4-6 times, and incubated for 15 min on ice. The precipitate was spin down at 14000-
18000g for 10 min at 4°C.
At the same time, the QIAGEN-tip column was equilibrated by applying 4 ml QBT buffer. The supernatant
was gently transferred to the QIAGEN-tip column and allowed it to enter the resin by gravity flow.
The column was washed 2 times with 10 ml QC buffer, and the DNA was eluted with 5 ml QF buffer into a
clean 15 ml vessel. The DNA was precipitated by adding 3.5 ml isopropanol at room temperature to the eluted
DNA and spin down by centrifugation at 15000g for 30 min at 4°C. The supernatant was carefully discarded,
and the pellet was washed with 70% ethanol at room temperature, centrifuged down at 15000g for 10 min.
The supernatant was again discarded and the pellet was air-dry or dried with a SpeedVac Vacuum
Concentrator and resolved in 150 µl appropriate buffer (e.g. sterile Ampuwa water, TE buffer, pH 8.0, or 10
mM Tris-Cl, pH 8.5).
3.2.1.10 Bacmid purification for Sf9 transfection (Minipreparation)
The bacmid purification was performed using the DNA Purification Kit (Qiagen). White colonies from
DH10Bac transformation were grown overnight at 37°C in 6 ml 1x LB under antibiotic selection (kanamycin,
50 µg/ml; gentamycin, 7 µg/ml; tetracycline, 10 µg/ml). On the next day, the bacterial suspension was
centrifuged at 17000g for 3 min. The supernatant was discarded, whereas the cell pellet was resuspended in
300 µl P1 buffer. By the addition of 300 µl P2 lysis and incubation at room temperature for 2-5 min, lysis was
induced. 300 µl N3 buffer was used to neutralize and, thus, to stop the lysis.
After 10 min incubation on ice, the sample was centrifuged at 17000g for 10 min. Bacmid precipitation was
achieved by mixing the supernatant with 800 µl 100% isopropanol. After 10 min incubation on ice,
centrifugation at 17000g for 10 min was performed. Further on, the pellet was washed with 500 µl 70% ice-
cold ethanol and dried at room temperature. Finally, the dry bacmid pellet was resuspended in sterilized water,
and the DNA concentration was measured at Nanodrop ND-1000 (PeqLab, AG Stehle). This experiment
produced a high yield of bacmid DNA (˃ 1000 ng/µl) which was stored at -20°C till further used.
3.2.1.11 Restriction digestion analysis
Different restriction enzymes and respective buffers were used to digest the pTbCOX-pCR 2.1 subcloning
(BamHI and HindIII), pTbCOX-pFastBacHTb constructs (BamHI and HindIII), pTbCOX-KD-pCR 2.1
subcloning (XhoI and BamHI) and pTbCOX-pCR 2.1 subcloning (HindIII and PvuII). According to required

47
analysis, the plasmid and plasmid constructs with the gene of interest (pTbCOX) were checked for suitable
restriction enzyme using DNAMAN software. The reaction mixture consisted of full DNA plasmid constructs,
a respective buffer for each enzyme, restriction enzyme and elution buffer to make up a volume of 35 µl. The
reaction mixture was incubated for 1 h or overnight at 37°C. Afterwards the restriction products were analyzed
by agarose gel electrophoresis and purified according to the instruction of the QIAquick gel extraction kit.
The reaction mixture as an example for the restriction digestion using BamHI and HindIII was done as
described below.
Double restriction digest with BamHI & HindIII
DNA (subcloning/target vector) 15.0 µl
10x Buffer BamHI 3.5 µl
BamHI (10 U/µl) 0.5 µl
HindIII (10 U/µl) 1 µl
Ampuwa water 15.0 µl
Total Volume 35 µl
3.2.1.12 DNA sequencing
The isolated plasmid constructs after verification on agarose gel electrophoresis and DNA concentration were
sent for sequencing to Eurofins Genomics or GATC Biotech in the concentration of 30-100 ng/µl.
The results of sequenced DNA were analyzed with DNAMAN software or NCBI blast by alignment with the
gene of interest or plasmid sequence.
3.2.2 Cultivation and handling of organisms
3.2.2.1 Escherichia coli
3.2.2.1.1 Cultivation on agar plates
The bacterial cells were cultivated on agar-agar with LB-medium and ampicillin. LB-medium was prepared
as 2X stock solution and mixed with pre-warmed 2X agar-agar under sterile conditions. After cooling to room
temperature, ampicillin (1 ml/l) and X-gal (2 ml/l) were immediately added and poured into culture plates.
The plates were left to solidify. When the agar was solidified, the plates were packed under sterile conditions
and stored at 4°C till further use.

48
3.2.2.1.2 Preparation of competent E. coli cells (Chung et al., 1989)
Competent E. coli cells were inoculated into 5 ml LB-medium with specific antibiotics selection pressure and
incubated at 37°C with shaking at 225 rpm for overnight (17 h). After the overnight incubation, 1 ml of the
starter culture was inoculated into 100 ml LB-medium with the right antibiotics selection and propagated at
37°C with shaking at 225 rpm till the absorbance reached 0.8 at 600 nm.
Then the cells were harvested at 5000 rpm for 5 min at 4°C, and the cell pellet was re-suspended in 10 ml TSS
medium. Subsequently, 100 µl aliquots were made in cryogenic vials which were immediately frozen in liquid
nitrogen and stored at -80°C.
3.2.2.1.3 Preparation of long term storage of E. coli – Cryostabilates
The new starter culture of tested clones and sterile 50% glycerol were added in volumes of 700 µl and 300 µl,
respectively in cryotubes. The tubes were immediately shock-frozen in liquid nitrogen and stored in the liquid
nitrogen tank.
3.2.2.2 Spodoptera frugiperda (Sf9 insect cells)
Insect cells Sf9 (fall armyworm) were bought from Novagene, Germany as frozen vials, stored in the liquid
nitrogen tank and propagated in adherent and suspension culture at 27°C in an incubator.
These cells were used for protein expression by following the Bac-to-Bac® Kit manual (Invitrogen, Germany)
as the basis for the cultivation, transfection of Spodoptera frugiperda (Sf9) insect cel ls and in vivo protein
crystallization experiments.
3.2.2.2.1 Culturing Sf9 insect cells
A cryo-stabilate of 2 × 10⁷ Sf9 insect cells was removed from the nitrogen tank and rapidly defrosted at 27°C
in a water bath. After the external disinfection of the cryotube, i t was opened under a sterile bank and
transferred to a 25 cm2 cell culture flask. Subsequently, 10 mL of pre-warmed EX-CELL 420 Serum-Free
Medium was added drop-by-drop. After an incubation period of one hour at 27°C, the vital cells had
accumulated to form a monolayer at the bottom of the cell culture flask so that the medium with the non-
adherent cells and the medium could be removed. Subsequently, a further 10 mL pre-warmed EX-CELL 420
Serum-Free Medium was carefully added to the cell culture flask. After that incubation was carried out at
27°C until the monolayer had a confluence of about 90%. Then the culture could be used to start and maintain
a Sf9 insect cells suspension culture.
Cultivation of Sf9 insect cell monolayer culture
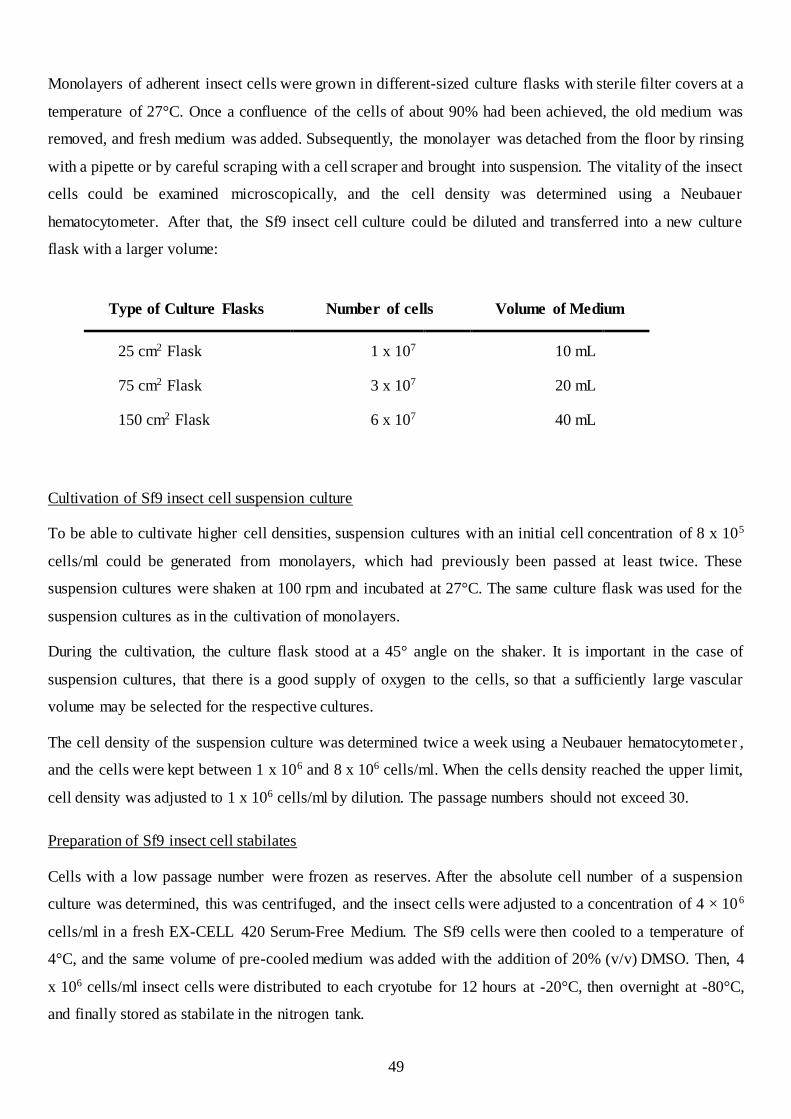
49
Monolayers of adherent insect cells were grown in different-sized culture flasks with sterile filter covers at a
temperature of 27°C. Once a confluence of the cells of about 90% had been achieved, the old medium was
removed, and fresh medium was added. Subsequently, the monolayer was detached from the floor by rinsing
with a pipette or by careful scraping with a cell scraper and brought into suspension. The vitality of the insect
cells could be examined microscopically, and the cell density was determined using a Neubauer
hematocytometer. After that, the Sf9 insect cell culture could be diluted and transferred into a new culture
flask with a larger volume:
Type of Culture Flasks Number of cells Volume of Medium
25 cm2 Flask 1 x 10⁷ 10 mL
75 cm2 Flask 3 x 10⁷ 20 mL
150 cm2 Flask 6 x 10⁷ 40 mL
Cultivation of Sf9 insect cell suspension culture
To be able to cultivate higher cell densities, suspension cultures with an initial cell concentration of 8 x 10⁵
cells/ml could be generated from monolayers, which had previously been passed at least twice. These
suspension cultures were shaken at 100 rpm and incubated at 27°C. The same culture flask was used for the
suspension cultures as in the cultivation of monolayers.
During the cultivation, the culture flask stood at a 45° angle on the shaker. It is important in the case of
suspension cultures, that there is a good supply of oxygen to the cells, so that a sufficiently large vascular
volume may be selected for the respective cultures.
The cell density of the suspension culture was determined twice a week using a Neubauer hematocytometer ,
and the cells were kept between 1 x 10⁶ and 8 x 10⁶ cells/ml. When the cells density reached the upper limit,
cell density was adjusted to 1 x 10⁶ cells/ml by dilution. The passage numbers should not exceed 30.
Preparation of Sf9 insect cell stabilates
Cells with a low passage number were frozen as reserves. After the absolute cell number of a suspension
culture was determined, this was centrifuged, and the insect cells were adjusted to a concentration of 4 × 10⁶
cells/ml in a fresh EX-CELL 420 Serum-Free Medium. The Sf9 cells were then cooled to a temperature of
4°C, and the same volume of pre-cooled medium was added with the addition of 20% (v/v) DMSO. Then, 4
x 106 cells/ml insect cells were distributed to each cryotube for 12 hours at -20°C, then overnight at -80°C,
and finally stored as stabilate in the nitrogen tank.

50
3.2.2.2.2 Transformation in DH10Bac competent cells
The purified validated pTbCOX-pFastBacHTb plasmid was used for transformation of DH10Bac E. coli
competent cells (Thermo Fisher Scientific). Aliquots of 100 µl competent DH10Bac E. coli (stored at -80°C)
were thawed on ice. Then, 5 µl of the pTbCOX-pFastBacHTb construct were added, followed by 30 min
incubation on ice.
Next, a heat shock was applied for 45 sec at 42°C using a pre-warmed water bath. Thereon, cells were
supplemented with 200 µl SOC medium. After 4 h incubation at 37°C, while shaking, the cells were plated
on LB-agar plates. The agar was previously prepared with various antibiotics (kanamycin, 50 µg/ml;
gentamycin, 7 µg/ml; tetracycline, 10 µg/ml); as well as X-Gal (100 µg/ml) and IPTG (40 µg/ml) which allows
selection of recombinant E. coli cells. The plates were incubated for 48-72 h at 37°C. Afterward, the white
DH10Bac colonies were used for Bacmid purification (see 3.2.1.10).
3.2.2.2.3 Transfection of Sf9 insect cells
The recombinant bacmid purified (see 3.2.1.10) and validated by Bacmid PCR analysis (Bac-to-Bac® Kit
manual) was used to transfect the Sf9 insect cells. The X-tremeGENE HP DNA Transfection Reagent (Sigma-
Aldrich, Germany) was used for the transfection of Sf9 insect cells experiments.
The transfection was performed by Bac-to-Bac® Kit manual (Invitrogen, Germany) with some minor
modifications. The numbers and volume given here are sufficient to transfect two wells of a standard 6-well
plate and to prepare two wells as negative controls.
The cell density of a Sf9 suspension culture was determined using a Neubauer hematocytometer. The first
requirement is that the cells should grow in the log-phase (1.5-2.5 x 10⁶ cells/ml) with greater than 95%
viability). Next step, the cell density was adjusted to 8 x 10⁵ cells/ml (10 ml in total, use medium without
antibiotics), and 2 ml/well were seeded thereof into four wells of the six-well plate. The cells were allowed to
attach for 15-45 min at room temperature.
In the meanwhile, the lipofection mixture was prepared: X-tremeGENE HP DNA Transfection Reagents was
carefully mixed, and 6-8 µl of this reagent were transferred into 100 µl of EX-CELL 420 serum-free medium
(without antibiotics). Thereupon, the mixture was briefly vortexed and kept at room temperature.
Next step, 5 µl recombinant bacmid DNA (1 µg DNA) was added to 100 µl of EX-CELL 420 serum-free
medium (without antibiotics) and gently mixed. Both, X-tremeGENE in medium and DNA in the medium
were then combined to give a total volume of ~209 µl. After the expiration of a 15-30 min incubation period
at room temperature, 150 µl of the mixture were added dropwise onto the cells in the first well. The remaining
50 µl were used to transfect the second well equally. Control wells were treated with the same volumina (150
51
µl and 50 µl) of the serum-free media. The plate was incubated for 4 h at 27°C, but before, it was slightly
wiggled to ensure even distribution of the DNA.
As soon as the incubation period was finished, the transfection mixture was carefully removed by pipetting
and subsequently replaced by 2 ml EX-CELL 420 serum-free medium (with or without antibiotics optionally).
After 72 h incubation at 27°C, the cells were daily inspected under a light microscope for signs of viral
infection, such as swollen cell bodies, increased cellular granularity, and reduction of confluence.
3.2.2.2.4 Isolation of virus stock
After the Sf9 cells had been transfected with the pTbCOX bacmid, the first virus generation (P1) was isolated
approximately 7-10 days post transfection, as soon as about 90% of the cells were lysed. Therefore, the
medium of infected cells was carefully collected, transferred into a sterile 15 ml tube and centrifuge at 3500
rpm for 5 min. The supernatant, now representing P1 viral stock, was then moved to a new tube, protected
from light, and stored at 4°C. Further virus stock generations were obtained in the same way.
The P1 viral stock will be used for the virus stock amplification as described in the protocol of Bac-to-Bac®
Kit manual (Invitrogen, Germany) by the manufacturer’s instructions.
3.2.2.2.5 Determination of the virus titer using the Reed-Muench method
The infectivity of the generated virus stock (plaque-forming units/ml) was estimated using an endpoint
dilution assay method developed by Reed and Muench (Reed and Muench, 1938), using adopted equations as
described by O’Reilly et al. (1994). In a 96 well plate, Sf9 insect cells were prepared monolayer cultures of
200 µl/well by letting the cells attach for 30 min.
The virus stock, whose titer should be determined, was diluted to achieve final concentrations of 10 -3, 10-4,
10-5, 10-6 and 10-7. For each dilution stage, seven technical replicates were prepared, and the monolayer cells
were infected. As a negative control, seven wells were left uninfected. The plate was incubated at 27°C. After
incubation of seven days, the cells were analyzed by light microscopy. Each well was assessed for signs
indicating a viral infection and based on this; it was scored either as infected (+ sign) or uninfected (- sign).
The total number of uninfected and infected cells were determined by summed up over all uninfected wells of
higher virus concentration (corresponding to lower dilution) (“top-down”). We assumed that all wells
uninfected at that dilution would also have stayed uninfected at all higher dilution rates (less virus).
Conversely, the total number of infected wells was obtained by summing up over all infected wells of lower
virus concentration (corresponding to higher dilution) (“bottom-up”), assuming that these wells would equally
have been infected at all lower dilutions. Further, the total percentage of infected wells for each dilution were
calculated.

52
Therefore, we estimated the dilution, which would give rise 50% infected cultures, by linear interpolation. In
doing so, we determined the next dilution above to 50% (termed A) and the next below 50% (termed B). Then,
calculation of the proportionate distance (PD) between these two dilutions (A and B) was done according to
equation (1).
(1) PD = % in A − 50%/% in B
The dose that would have given a 50% response (50% tissue culture infective dose, TCID50) is then calculated
using equation (2).
(2) TCID50 = 10((Exponent of dilution in A) – PD)
The TCID50 was converted to plaque forming units (pfu) per milliliter. According to Poisson distribution, the
mean distribution of infectious units at 50% infection rate is equal to ln(2) = 0.69.
(3) Virus titer = 1/TCID50 x ln(2) x 1000 µl/ml/µl of virus/well
Equation (4) was used to assess the number of particles that were available per cell (multiplicity of infection,
MOI) in retrospect.
(4) MOI = virus inoculum x virus titer / number of cells
For further used of the stock, the inoculum required to infect cells at a certain MOI was calculated according
to Equation (5).
(5) Inoculum (ml) = MOI (pfu/cell) x number of cells / virus titer (pfu/ml)
3.2.2.2.6 Trypanosoma brucei
Cultivation of monomorphic bloodstream form trypanosomes (SMB cell line) in vitro
Single marker bloodstream form (SMB) stored in the liquid nitrogen were used for axenic cultures of parasites.
The stabilates were quickly thawed under warm water; the thawed parasite suspension was then transferred to
a falcon tube containing 10 ml cold HMI-9 medium and then centrifuged (1500 g, 10 min, 4°C). The
supernatant was eliminated, and the cellular pellet was resuspended in 500 µl – 1 ml bloodstream medium
(HMI-9 medium) to determine cell density using a Neubauer hemocytometer. The cell suspension preculture
was started by adjusting the cell density to 1 x 10⁵ parasites per ml with pre-warmed bloodstream medium
(10-50 ml HMI-9 medium). The cultivation of trypanosomes was carried out at 37°C in a water-saturated
atmosphere containing 5% CO2. After the 8-16 h incubation period, the cell density of the preculture was
determined again to verify that the cells had entered the logarithmic growth phase. If the cells reached 2.5 x
105 cells/ml, the culture was adjusted by dilution to 1 x 10⁵ cells/ml to be sure that the cell will not exceed the
critical value of 8 x 10⁵ cells/ml after 24 h incubation time. Approximately after 24 h post incubation, the

53
started preculture was counted for the growth curves, cells doubling timing and maintained by daily dilution
to 1 x 10⁵ and 1 x 10⁶ cells/ml.
Depending on the daily cell counting results, the cells were placed in standard and synchronized cells density
for growth curves experiments. Others cell cultures vessels were maintained or prepared to reach the high cell
density cultivation required for further investigations. Geneticin G-418 2 µg/ml was systematically added to
the SMB trypanosomes cell line to prevent the loss of the T7 RNAP and encoding TetR genes. The stable
transfected SMB trypanosomes cells were cultivated with additionally selection pressure of 2 µg/ml
Hygromycin.
Stable electroporation of SMB trypanosomes cells
SMB trypanosomes at a cell density between 2.5 and 4 x 10⁷ cells/ml were harvested by centrifugation (1500
g, 10 min, RT). The supernatant was decanted, and the pellet was resuspended in 25 ml Cytomix. The
resuspension cell-Cytomix was centrifuged at 1500g for 10 min at room temperature, and the supernatant was
carefully discarded. The cell pellet was resuspended in 500 µl Cytomix.
The cell density of this suspension was dissolved in 1:100 dilution, counting using Neubauer hemocytometer
to prepare the required cells concentration for the transfection.
For each transfection approximately 1 x 10⁷ cells/ 400 or 440 µl in Cytomix were transferred into a sterile
cuvette together with 10 µg linearized plasmid DNA (1µg/µl). The electroporation was performed with Gene
Pulser Xcell using a single pulse at 1400 V, 25 µF, ∞ Ω for 0.3 ms. The number of surviving cells was
determined by counting in 1:100 dilution. After electroporation, cells were transferred immediately into 36 ml
pre-warmed HMI-9 medium, cells counted again and the culture was incubated for 6 h at 37°C in a water-
saturated atmosphere containing 5% CO2. 6 hours after incubation of the transfection the selection marker was
added in the appropriate concentration.
For the knockdown induction experiment, Geneticin (2 µg/ml) and Hygromycin (2 µg/ml) or Phleomycin
(2.5µg/ml) were used for the pTbCOX-pCO57 expression in SMB trypanosomes experiments. After added
those respective selective antibiotics to the 36 ml cells culture, the culture was distributed in 1 ml per well into
24-well plates and then incubated at 37°C and 5% CO2. After 4-6 days, the transfectants were usually analyzed
by light microscopy and counting surviving cells. Later, positive clonal transfectant cells were pooled and
transferred to large culture volume for subsequent experiments and production of transgenic stabilates for
long-term storage in liquid nitrogen.

54
3.2.3 Quantitative Real-time PCR (qRT-PCR)
3.2.3.1 RNA isolation
The first requirement before proceeding with RNA isolation, the RNA bench surfaces and equipment were
cleaned with potassium hydroxide (10 M) and RNase away®. Only the certified RNase-free materials and
chemicals were used and stored in separate RNA bench cabinets. The samples were always kept on ice during
all the practical steps procedure.
Isolation of the RNA from Trypanosoma brucei was carried out using the QIAGEN Rneasy kit according to
the manufacturer’s instructions. 5 x 10⁷ trypanosomes cells/ml were harvested by centrifugation (1500 g, 5
min, 4°C) and washed once with 20 ml TDB buffer. The supernatant was completely removed and the cell
pellet resuspended in 350 µl of buffer RLT (lysis buffer). For the completion of the lysis of the cells, the
samples were vortexed for about 1 min. 350 µl of 70% (v/v) ethanol was then added, and the lysate was
transferred to Rneasy ion exchange columns. After 15 seconds of centrifugation at 13000 rpm, the columns
were washed once with 700 µl of buffer RW1 and twice with 500 µl of buffer RPE.
The elution was done using 30 µl of RNase-free water. 3 µl of the eluates were transferred to PCR tubes for
RNA concentration determination. The RNA concentration determination was carried out on a Nanodrop ND-
1000 against RNase-free water as a blank.
The ratio 260/280 nm of the isolated RNA should be in the range between 2.0-2.2 to ensure a sufficiently high
degree of purity. The remaining 27 µl of the eluates were stored at -80°C for further experimentations.
3.2.3.2 DNAsing of RNA
To ensure that the RNA used for the qRT-PCR had no DNA contamination, the freshly isolated RNA (see
3.2.3.1) was digested with DNase I (Thermo Fisher Scientific, Germany). The DNAsing of RNA was
performed following the reaction mixture DNase I digestion: 25 µl of RNA eluate (Qiagen RNeasy Kit), 3 µl
of 10x reaction buffer, 1.5 µl of DNase-free water and 0.5 µl of DNase I (1 U/µl). The control was prepared
with 25 µl instead of RNA eluate which served as a blank for later RNA concentration determination. All
samples DNasing were incubated for 30 min at 37°C. Finally, 1.5 µl EDTA (50 mM) was added, and the
enzyme was inhibited by heating at 65°C for 10 min. The RNA concentration of the samples was determined
again as described above (see 3.2.3.1).
3.2.3.3 Quantitative Real-time PCR (qRT-PCR)
The Power SYBR® Green RNA-to-CTTM 1-Step Kit from Applied Biosystems (Thermo Fisher Scientific,
Schwerte) was used for quantitative RT-PCR. The reference gene for the quantification of the mRNA level of

55
the putative TbCOX gene (pTbCOX) was β-tubulin (TbTub) as housekeeping gene. Since the 1-Step Kit
already contains all reagents required for reverse transcription and subsequent PCR, the isolated RNA (see
3.2.3.1) could be used directly as a template. The RNA concentrations of all samples were adjusted to 20 ng/µl
by appropriate dilution with RNase-free water. A total of 60 ng RNA per reaction batch was used. Primer
stock solutions (100 μM) were diluted 2:100 with RNase-free water and adjusted to a final concentration of 2
μM. To ensure that the levels of all components (primers, enzymes, SYBR fluorescent dye) were identical in
all approaches, the next master mixes were prepared according to the manufacturer’s instructions. This
indicated quantity (52x) is sufficient for the investigation of 11 samples in triplicates in a total volume of 10
μl (including dilution series and negative controls).
Mix 1 (pTbCOX) Mix 2 (TbTub)
2x SYBR® Green RT-PCR-Mix 260,00 µl 260,00 µl
fw-Primer (2µM) 52,00 µl 52,00 µl
rv-Primer (2µM) 52,00 µl 52,00 µl
RT Enzyme Mix 4,16 µl 4,16 µl
A 96-well reaction plate (Applied Biosystems) was charged with 7 μl of the master mixes. Subsequently, 3 μl
of DNase I-digested RNA (20 µg/ml) were added each time, so that the final volume per well was 10 μl. To
the negative controls, 3 μl of RNase-free water was added instead of the RNA. Each RNA sample was
measured in triplicate in master mix 1 (amplification of pTbCOX mRNA) and also as triplicate in master mix
2 (amplification of β-tubulin mRNA).
An RNA sample (SMB, not transfected) was diluted in a dilution series by a factor of 1:5 to determine the
efficiency of the qRT-PCR (see 3.2.3.4), and the resulting amounts of RNA were added to both master mixes.
The reaction plate was sealed with an adhesive film and briefly centrifuged before the start of the reaction.
The reaction was carried out in a StepOnePlus™ Real-Time PCR System from Applied Biosystems.
The temperature profile is shown in the table below. The data were evaluated using the StepOne software v2.2
(see 3.1.14)
Cycles Programm Temperature Ramp Rate [°C/s] Time
1X Reverse Transcription 48°C 4,4 30 min

56
1X Activation 95°C 4,4 10 min
Denaturation 95°C 4,4 15 s
40X Annealing/Elongation 60°C 1,5 min
Measurement of fluorescence 72°C 4,4 10 s
Melting curve
1X Denaturation 95°C 4,4 5 s
1X Annealing 60°C 2,2 1 min
1X Measurement of fluorescence 95°C 0,11 -
1X Cooling 40°C 2,2 30 s
Melting curve analysis was used to verify the specificity of the PCR products. Also, agarose gel
electrophoresis in a 5% TAE agarose gel (see section 2.3.2.2) was used to determine whether the fragments
produced in the batches had the expected sizes of 165 bp (pTbCOX amplicons) or 76 bp (TbTub amplicons).
3.2.3.4 Determination of qRT-PCR efficiency
The analysis of the measured data was carried out with the help of the manufacturer software StepOne
Software v2.2 (Applied Biosystems). The software automatically calculates a CT value (threshold cycle) for
each sample – this value indicates the number of cycles at which the fluorescence of the sample increases
significantly over the background fluorescence (baseline) for the first time. The relative determination of the
transcript quantity was performed according to the efficiency-corrected relative quantification model
according to Pfaffl (Pfaffl, 2001, 2004).
1. For the determination of the qRT-PCR efficiency E, the CT values of the two-dilution series were first
plotted against the nanoprobes and subsequently logarithmized RNA quantity. E is obtained from the slope m
of the compensating straight line according to the following formula:
(𝟔) 𝐸𝐺𝑒𝑛 = 10−
1𝑚
2. The differences in the CT values (ΔCT) between induced samples and control samples (non-transfected
SMB cells) were calculated by differentiation according to the formula (7). To compensate for fluctuations
due to pipetting inaccuracies, the mean CT values of all three replicates of a sample were used for these
calculations.

57
(𝟕) ∆𝐶𝑇,𝐺𝑒𝑛 = 𝐶𝑇,𝐶𝑜𝑛𝑡𝑟𝑜𝑙 − 𝐶𝑇,𝑖𝑛𝑑𝑢𝑐𝑒𝑑
3. The relative expression difference was calculated by the formula (8), which correlates the PCR efficiencies
and the ΔCT values of the target gene (pTbCOX) and reference gene (TbTub).
(𝟖) 𝑅 =𝐸𝑇𝑏𝐶𝑂𝑋
𝛥𝐶𝑇,𝑇𝑏𝐶𝑂𝑋
𝐸𝑇𝑏𝑇𝑈𝐵
𝛥𝐶𝑇,𝑇𝑏𝑇𝑈𝐵
The values calculated in this way are to be understood as arbitrary units.
3.2.4 DAPI staining of Trypanosoma brucei cells
DAPI is a fluorescent dye that specifically binds to AT-rich regions of DNA. Its absorption maximum is in
the ultraviolet range; the emitted light has a blue color (maximum emission 453 nm) (Kapuscinski, 1995). As
DAPI can easily pass through an intact cell membrane, it was used to stain the nucleus and Kinetoplast of
noninduced and induced pTbCOX knockdown trypanosomes cells at different time post doxycycline
induction. Approximately 1 x 10⁶ cells/ml were harvested by centrifugation (1500g, 5 min, RT). The cell pellet
was washed twice with TDB buffer and then resuspended in 100 µl of TDB buffer. 50 µl of the cell suspension
were coated on a slide and dried in the air for 15-30 min. Subsequently, the cells were fixed by gently dropping
2-3 drops of ice-cold methanol (-20°C). After incubation at -20°C of the slide for 10 min, 50 µl of DAPI
staining solution (1 µg/ml) were dropped, distributed on the entire surface by pivoting the slide and incubated
for 5 min at RT in the dark.
The staining evaluation was carried out on an Olympus BH2 fluorescence microscope, equipped with a
ColorView12 digital camera and the analysis software from Soft Imaging System GmbH (Münster), by
counting Kinetoplast and nuclei from at least 100 cells.
3.2.5 Electron Microscopy
3.2.5.1 Transmission electron microscopy (TEM)
For TEM, SMB trypanosomes at a cell density between 2 x 10⁷ and 1 x10⁸ cells/ml were harvested after
different induction time (0 h, 6 h, 18 h, 24 h, 42 h) by centrifugation (1500g, 10 min). The supernatant was
removed, and the cell pellet was washed once with TDB or MEM salts. The cell pellet was fixed in 2%
glutaraldehyde (cross-linking fixative, dissolved in 1 x sodium cacodylate buffer, v/v) for 1 h at 4°C.
58
After washing four times (10 min each incubation on ice and termination by centrifugation 30 sec, RT,
Beckmann Microfuge E) and storage overnight in 1 x cacodylate buffer, cells were postfixed in osmium
tetroxide (1.5%, w/v) and stained with 0.5% uranyl acetate at RT for 60 min and washed with distilled water.
The fixed cells were dehydrated using ethanol solutions of increasing concentrations (50%, 70%, 95%, 100%,
5 min incubation, then 1 min centrifugation in Beckmann Microfuge E, RT) and washed 3 times 10 min each
with propylene oxide. The samples were incubated with Epon: propylene oxide (1:1, 60 min, RT), infiltrated
with pure Epon (60 min, RT) and transferred to Beem®-cups. The polymerization was carried out for 12 h at
45°C and 24 h at 60°C.
After polymerization, the sample was removed from the Beem®-cups using a scalpel and was trimmed into
trapezium shape on LKB 11800 Pyramitone. The sample was sectioned using an Ultramicrotome OM U3 and
fished with the copper grids. The grid was contrasted on a 100 µl 0.5% uranyl acetate drop (60 min, RT, face
down) (Lewis and Knight, 1977). The grid was washed with distilled water and incubated in lead citrate
solution (30 sec, RT) and again washed and dried.
TEM images were collected at a Zeiss EM 10 transmission electron microscope, and the photographs were
developed using an automated Konica SRX-101A developer machine.
3.2.5.2 Scanning Electron Microscopy (SEM)
The SEM procedures were used to prepare the pTbCOX in vivo micro-sized crystals with Sf9 insect cells and
pTbCOX SMB knockdown trypanosomes (5 x 10⁷ – 2 x 10⁸ cells/ml) post-induced with doxycycline (1 µg/ml)
at the different time point (0 h, 6 h, 24 h). TEM procedures above described were followed for SEM pTbCOX
micro-sized crystals with Sf9 insect cells samples preparation. For the pTbCOX SMB knockdown
trypanosomes, SEM sample was fixed using 4% (w/v) glutaraldehyde and 4% (w/v) paraformaldehyde in 1 x
cacodylate buffer overnight at 4°C. After washing four times (10 min each incubation on ice and termination
by centrifugation 30 sec, RT, Beckmann Microfuge E), the cells were treated with 1.5% (w/v) osmium
tetroxide with 70 Mm HgCl2 in 1 x cacodylate buffer for 1 h at 4°C. Next step, the cells were washed one time
with 1 x cacodylate buffer and three-time with distilled water. SEM samples were dehydrated up to 70%
ethanol and stored overnight at 4°C. The subsequent steps for the preparation of SEM samples as well as SEM
picture were carried out by Mrs. Meinert in the laboratory of Prof. Oliver Betz (Institute of Evolution and
Ecology, University of Tübingen).

59
3.2.5.3 Negative staining
Approximately 5 x 10⁷ cells (absolute) from a main culture in the logarithmic growth phase were harvested
by centrifugation (1500g, 5 min, 4°C). The resulting cell pellet was washed twice in TDB (1500g, 5 min, 4°C)
and subsequently resuspended in 0.2-1 ml TDB.
The cell density was examined by light microscopy. Depending on this, approximately 10-100 μl of the cell
suspension were pipetted onto the bright side of a mold-coated copper grid. For this and all subsequent steps,
a petri dish lined with parafilm served as a support. The grid was dried for at least 10 min at room temperature
and then transferred to a drop of PEME + Nonidet P-40 (1%) with the shiny side facing downwards. After 2
min incubation, it was transferred to a drop of PEME + glutaraldehyde (2%) and incubated to fix the cells for
5 min. Subsequently, the grid was dried by carefully dabbing the liquid on filter paper and immediately
transferred to a drop of 0.5% uranyl acetate for 30 s.
The preparation was terminated by washing in 3-5 drops of distilled water. After complete drying of the grids,
they were analyzed and photographed on the Zeiss EM10 transmission electron microscope.
3.2.6 Standard protocols for protein biochemistry
3.2.6.1 Expression of rpTbCOX in BL21-DE3 E. coli strains as inclusion bodies
The pTbCOX-pProExHTa construct was transformed into the BL21-DE3 strain of E. coli. A 100 ml culture
using LB medium containing ampicillin (50 µg/ml) and chloramphenicol (34 µg/ml) in the ratio of 1:1000
was grown overnight shaking at 37°C and used to inoculate 500 ml or 1 L of LB medium in a 2L flask.
The experiments on isopropyl ß-D-1-thiogalactopyranoside (IPTG) concentration and induction time were
performed for better expression of the rpTbCOX. It was found that addition of 2Mm IPTG at a culture optical
density (600 nm) of 0.6 – 0.8 and subsequent culturing for 4 hours at 37°C yielded the highest expression of
the putative rpTbCOX in bacterial inclusion bodies (IBs). The cells were harvested by centrifugation at 10000
rpm or 4500g at 4°C for 10 min and stored frozen at -20°C.
3.2.6.2 Isolation of inclusion bodies and dialysis for protein refolding
Cells were resuspended in 25 ml or 50 ml of lysis buffer (20 mM Tris-HCl, pH 7.5, 15 mM EDTA, 1% Triton
X-100 with the addition of Complete Protease Inhibitor Tablet (Roche)).
The cells were mechanically disrupted by sonication using short pulses of 20 seconds on ice in a Sonifer cell
disruptor B-30. Protein refolding by stepwise dialysis was performed with slight modifications following the
protocol developed by Buchner and Rudolph (Buchner and Rudolph, 1991) for refolding Fab fragment and
by Tsumoto (Tsumoto et al., 1998) for the refolding of two scFv constructs. The inclusion bodies were isolated

60
from the cell supernatant by centrifugation at 10000 rpm at 4°C for 20 min. Inclusion bodies were solubilized
in resuspension buffer (50 mM Tris-HCl, pH 8, 4 M GuHCl, 10 mM BME), incubated 10 min on ice, to allow
denaturation and solubilization, and then centrifuge again at 10000 rpm at 4°C for 20 min to remove any
residual insoluble material.
The resuspended protein solution was dialyzed against buffers containing decreasing amounts of guanidine
hydrochloride (GuHCl) by stepwise dialysis, as well as adding additives like L-Arginine and the redox pair of
oxidized and reduced glutathione (3 mM reduced glutathione (GSH)/ 0.3 mM oxidized glutathione (GSSG))
during 4 days.
The resuspended protein was dialyzed overnight at 4°C in snakeskin dialysis tubing against 1 L (10 ml vol.
protein solution) or 2 L (30-40 ml vol. protein solution) of buffer # 1 (50 mM Tris-HCl, pH 8, 2 M GuHCl).
The following day the dialysis buffer was changed to 1 or 2 L of dialysis buffer # 2 (50% dilution buffer # 1
with water, 0.4 M L-Arginine, 3 mM GSH, 0.3 mM GSSG) for overnight dialysis at 4°C.
The following day the dialysis buffer was diluted 50% with water (buffer # 3), and dialysis continued
overnight. Any insoluble material was centrifuged at 10000 rpm at 4°C for 20 min and the protein solution
dialyzed overnight at 4°C against 1 L or 2 L of buffer # 4 (50 mM Tris-HCl, pH 8, 300 mM NaCl, 0.1 M L-
Arginine, 3 mM GSH, 0.3 mM GSSG) to remove the remaining GuHCl. The following day, the protein
solution was centrifuged at 3000 rpm for 10 or 20 min to remove any insoluble material and then run a 10%
SDS-Page and Western blot analysis. The remaining final protein solution after step-wise dialysis was stored
at 4°C and ready to be used for Ni-NTA purification under AKTA-FPLC system.
3.2.6.3 Purification of (His)6 – tagged rTbCOX by Ni-NTA affinity chromatography
The final dialyzed protein solution (5 ml) was loaded onto a Protino® Ni-NTA (Macherey-Nagel, Germany)
His-tag affinity column pre-equilibrated with an equilibration buffer (20 mM Tris-HCl, pH 8, 1 M NaCl) using
an AKTA-FPLC system. The column was loaded with binding buffer (20 mM Tris-HCl, pH 8, 500 mM NaCl,
10 mM Imidazole, 0.1% Triton X-100) followed by a wash with equilibration buffer to remove the Triton X-
100 for 30-45 min. The pTbCOX was eluted and collected in 1 ml different fractions from the resin column
using a 100% linear gradient (0-500 mM) elution buffer (20 mM Tris-HCl, pH 8, 500 mM Imidazole). The
equilibration-washing and elution steps were done respectively at a flow rate of 0.2 ml/min and 0.5 ml/min.
Each eluted fraction was quickly analyzed by SDS-PAGE, gel silver staining and western blot analysis to
identify the target fraction after the one step Ni-NTA affinity chromatography. Those fractions containing the
eluted pTbCOX were pooled, dialyzed overnight at 4°C against 20 mM Tris-HCl, pH 8, 300 mM NaCl and
concentrated using centricon filter MWCO 10 kDa.

61
3.2.6.4 Radioactive thin layer chromatography (TLC) cyclooxygenase activity assay
To determine the activity of the purified pTbCOX thin layer chromatography and C-14 arachidonic acid (2.5
µCi) as substrate were used. For this purpose, the solvent system containing 98.5:1:0.5 vol/vol/vol Diethyl
ether/Methanol/Acetic acid was prepared and allowed to stand in a close chromatography tank at -20°C. Then
497 µl of the purified rTbCOX (200 ng) was incubated with 3 µl C-14 arachidonic acid (2.5 µCi) in COX
activity buffer (see 3.1.11.3) at room temperature for 1 h. The reaction mixture was stopped by the addition
of 100 µl of 1 M HCl and cold ethyl acetate. After vortex for 10 sec, the reaction mixture was centrifuged at
1000g at 4°C for 10 min. After that, the aqueous phase and the ethyl acetate phase were clearly separated from
one another.
The ethyl acetate phase was transferred to an Eppendorf vessel, and the aqueous phase was extracted again
with ethyl acetate. The collected extracted samples were then dried in speed vacuum centrifuge. The pellet
was dissolved in 50 µl of ice-cold ethanol and place on ice for 30 min.
10 µl of sample was applied to the thin layer chromatography on a silica gel plate (20x20 cm) under an a ir
stream and placed directly into the chromatography tank containing the solvent system at -20°C. After 45 min,
the dry silica plate was exposed to X-ray film (KODAK MR Film) and radioactive products will be visualized
after 7 days by autoradiography.
3.2.6.5 Protein concentration determination using Bradford assay
The protein concentration was determined by Bradford protein assay (Bradford, 1976). Therefore, Bio-Rad
Protein Assay was utilized and diluted 1/5 with deionized water. The diluted reagent was pipetted in a volume
of 900 µl in each cuvette. As a reference, 100 µl deionized water for standards or buffer for samples was used.
All measurements were performed in duplicate. The reaction mixtures were incubated for 5 min in the dark at
room temperature, and then the protein concentration was determined by photometric measurement at 595 nm.
The protein concentration was determined by comparison of the measured extinction values to a standard
curve.
3.2.6.6 SDS-Polyacrylamide gel electrophoresis (SDS-PAGE)
At first, the glass plates, assembly, comb, and spacers were cleaned with ethanol. The glass plates with spacers
were fixed inside the assembly. As mentioned above in section 3.1.11.2, separating gel mixture was poured
carefully in between glass plates taking care not to let air bubbles in the solution and the gel was polymerized
(polymerization time was for 30 min) with an overlay of deionized water. After the gel had polymerized,
stacking gel mixture was poured above the gel carefully and immediately added comb on top of it till
completely immersed between plates.

62
The polymerization time was 45 min, and during this time, protein samples were prepared after protein
estimation from Bradford method from 10 to 60 µg protein concentration per sample. The reducing sample
diluting buffer was added to samples and adjusted the volume accordingly. The samples were heat denatured
by boiling at 100°C for 5 min and loaded into respective wells with Page Ruler Prestained Ladder as molecular
protein marker.
The water cooling system was attached to the assembly, and running buffer was added in upper and lower
reservoir.
The electrodes were attached accordingly into the power supply, and SDS-PAGE was run at the voltage of 80
V, and then after the sample has moved into the stacking gel, the voltage was increased to 160 V till the
bromophenol boundary reached the bottom of the gel. The gel was removed carefully from the plates and
placed in Coomassie solution for 1 h and then destained or in fixation solution for silver staining (see 3.1.11.3
and 3.1.11.4) or followed immediately for Western blotting.
3.2.6.7 Western blot analysis
The protein samples were resolved in SDS-PAGE and immediately blotted. The gel was placed on an anode
plate in Semi-Dry apparatus.
It was overlaid onto blotting paper (Hybond-ECL nitrocellulose membrane) sandwiched between three layers
of Whatman filter papers soaked with transfer buffer (see 3.1.11.5) on each side respectively. It was carefully
assembled to remove any air bubbles in between the membrane, gel and filter papers. The electrotransfer was
carried out at about 20 V (400 mA) for 45 min.
After that protein transfer from SDS gel to a nitrocellulose membrane, the membrane was blocked with 10%
milk powder in 2 X PBS for 1 h at room temperature or overnight at 4°C with gentle shaking.
After the blocking step, the membrane was washed 5 times for 5 min in washing buffer and then incubated
the first antibody diluted in TBS (1:1000) for 1 h at room temperature in new disposable bags with gently
shaking. The membrane was washed again as above and incubated with the second antibody (coupled with
alkaline phosphatase) diluted in TBS (1:10000) for 1 h at room temperature. After that, the membrane was
washed 5 times for 5 min with gently shaking using TBS. Finally, the developing solution containing BCIP
and NBT was added to the membrane and color development was observed carefully. When the bands
appeared, the reaction was stopped with PBS and blot was scanned after drying on filter paper.

63
3.2.6.8 Gel staining
Following the SDS-PAGE run, the gels were stained with 1 mg/ml Coomassie blue R for at least 1 h at room
temperature or overnight at 4°C. The gels were destained in destaining solution (10% acetic acid, 40% ethanol)
till the respective bands appeared clear on the gels.
Silver staining also was performed as more sensitive than the staining by Coomassie blue dye. The gels were
fixed in fixative solution (see 3.1.11.4) for 10 min at room temperature, washed with 50% ethanol 3 times for
10 min and then incubated in impregnation solution (see 3.1.11.4) for 3 min at room temperature with gently
shaking.
The gels were washed 3 times for 1 min with water and then incubated with silver stain solution for 20 min
(in the dark). The gels were further washed 2 times for 2 min with water. After that, the gels were soaked in
developing solution (see 3.1.11.4) until the bands or protein spots appeared.
The gels were treated with stop solution (see 3.1.11.4) for 10 min at room temperature and were washed with
50% ethanol for 20 min. Later the gels were preserved by “sandwiching” the gels between two sheets of wet
cellophane in gel storage solution (gel drying system) (see 3.1.11.4). Excess solution and air bubbles between
the cellophane sheets and the gels were expelled by applying pressure using a ruler.
3.2.7 Biophysics Methods
3.2.7.1 Second Order Nonlinear Imaging of Chiral Crystals (SONICC)
Second order nonlinear imaging of chiral crystals (SONICC) was used to detect the isolated pTbCOX crystals.
Using the SONICC method, the isolated pTbCOX crystals are irradiated with a 1064 nm fs laser pulse, which
leads to a frequency doubling of the photon in the case of a chiral crystal.
The resulting signal of this second harmonic generation (SHG) process can thus be detected at a wavelength
of 532 nm. The experiments were done using SONICC benchtop device (formatrix) with an SHG exposure
time of 30 seconds. SONICC measurement, Dynamic Light Scattering (DLS) and CD spectroscopy on the
pTbCOX crystals samples were carried out as cooperation project in the laboratory of Prof. Christian Betzel
(Institute of Biochemistry and Molecular Biology, DESY – Hamburg).
3.2.8 In vivo crystallization in Sf9 insect cells
3.2.8.1 pTbCOX crystals production and isolation
The pTbCOX P3 virus stocks with respectively MOI 0.1 pfu/cell and 0.2 pfu/cell were used to infect the Sf9
insect cells for crystals production. For this experiment, 1 x 10⁶ Sf9 cells/ml (monolayer culture, 60%

64
confluent) were infected in 6-well plate or 10 ml in T-flask 25 cm2 for crystals production (virus dilution
1:1000). The infected Sf9 insect cells were incubated at 27°C for 2-3 weeks. The cells and crystals were
visualized using an optical light microscope.
The produced pTbCOX crystals were isolated in principle by separation of crystals and cells by centrifugation.
The Sf9 insect cells and crystals suspensions were centrifuged at 1500g for 10 min. The supernatant was
collected and check for crystals under the light microscope.
The supernatant containing the tiny pTbCOX crystals was overnight dialyzed against water at 4°C using
membrane filter 12-14 kDa cut-off membrane. The next day the crystals sample was visualized and counted
under the light optical microscope using Neubauer chamber.
The crystals samples were concentrated using 10 kDa centricon (Millipore) at 15000g at room temperature
until the desired concentration is reached.
The concentrated pTbCOX samples were then solubilized with sodium acetate pH 3.6 for SDS-PAGE and
Western blot analysis.

65
4 Results
4.1 Description of the pTbCOX gene
(Tb427.10.13790/Tb927.10.13790/Tb10.61.3130) and pTbCOX protein
The genome database of T. brucei contains the annotated gene Tb927.10.13790/Tb427.10.13790 that encodes
a hypothetical conserved protein and is located on chromosome 10. This gene showed up in our search for a
putative cyclooxygenase like enzyme in Trypanosoma brucei using Western blot analysis with a polyclonal
anti-cyclooxygenase antibody from ovine, an enzyme assay for peroxidase activity with Amplex Red reagent,
mass spectrometry analysis of the protein bands detected by Western blotting and a bioinformatic search
(Barth, 2013). It was selected and postulated as a putative cyclooxygenase-like enzyme from Trypanosoma
brucei (pTbCOX) to be further characterized in this thesis. The pTbCOX gene has a length of 2043 base pairs
(bp) and has ortholog and paralog genes within the kinetoplastid family, however, all of them are still
annotated as hypothetical conserved proteins. The pTbCOX gene encodes a pTbCOX protein which contains
680 amino acids and has a predicted molecular weight of 74.68 kDa. Bioinformatic analyses using Pfam,
Prosite, Swiss-Pro, InterPro, TMHMM, Signal P, LOMET and NetPhos did not reveal any putative signal
peptide or a transmembrane domain and no convincing homolog proteins in any other organism. The analyses
revealed, however, the presence of -helices, ß-strands and considerable coiled-coil structures and a large
number of putative phosphorylation sites (Ser/Thr/Tyr) (Figure 4.1 and Figure 4.2).
Furthermore, the hydrophobicity or hydrophilicity of pTbCOX was evaluated using the Expasy ProtScale
software. The Kyte-Doolittle scale revealed the hydrophobic amino acid within the pTbCOX sequence (Figure
4.3).

66
Figure 4.1: pTbCOX 680 amino acids sequence and protein structure prediction using
LOMETS V.4 (Local Meta-Threading-Server) software. This analysis revealed the presence of
Helix, ß strand and more coiled-coil structure within the pTbCOX protein sequence.

67
Figure 4.2: Phosphorylation sites prediction in pTbCOX sequence. The image is showing the
numbers and position of Serine-Threonine-Tyrosine phosphorylation sites within the pTbCOX
amino acid sequence using the NetPhos 2.0 bioinformatic software tool.

68
4.2 Expression, refolding and purification of pTbCOX
Following the T. Barth dissertation, the pTbCOX gene was successfully cloned into a pProExHTa plasmid
(Invitrogen). This plasmid was introduced into the E. coli strain BL21(DE3) for heterologous protein
expression as a recombinant His-tagged protein (rpTbCOX).
The rpTbCOX was found almost entirely in an insoluble form inside inclusion bodies (IBs) after gene
induction with isopropyl ß-D-1-thiogalactopyranoside (IPTG) (see details in section 3.2.6.1). I first solubilized
the inclusion bodies using N-lauroylsarcosine detergent. However, many different attempts to purify this
rpTbCOX by a native purification strategy or by using a lauroylsarcosine-triton X-100 mix in the buffer system
throughout the purification were not successful. The inclusion bodies were finally solubilized using 4 molar
guanidine hydrochloride (GuHCl) and the protein was re-folded step-wise by GuHCl gradient dialysis with
Figure 4.3: Kyte-Doolittle-Hydropathy Plot for pTbCOX. The hydropathy score is plotted on
Y-axis and the amino acids number on X-axis. The positive score of the hydropathy indicated
the hydrophobic segment within the pTbCOX protein sequence.

69
the introduction of a redox agent (reduced and oxidized glutathione) and L-arginine, following the protocol
described in section 3.2.6.2. Following the refolding procedure, rpTbCOX was subjected to 10% SDS-PAGE
and Western blot analysis using the ovine anti His-tag antibody (Figure 4.4 and Figure 4.5).
Figure 4.4: rpTbCOX expression in E. coli strain BL21 (DE3) and inclusion body preparation
with lauroylsarcosine.
(A) Following induction with IPTG, the bacteria were lysed by sonication and the cell supernatant
was separated from the pellet by centrifugation. Shown is the 10% reducing SDS-PAGE analysis
of uninduced and induced cell lysates. The subsequent pellet fractions were used for inclusion
body preparation with lauroylsarcosine. Lane M: prestained molecular weight marker; lane 1:
pellet fraction from uninduced cells; lane 2: pellet fraction from induced cells; lane 3: supernatant
fraction from inclusion body preparation with lauroylsarcosine; lane 4: inclusion body preparation
with lauroylsarcosine. The gel was stained with Coomassie Brilliant Blue.
(B) Shown is the Western blot analysis of the former SDS PAGE gel using the antiHis-tag
antibody. Upon addition of IPTG (+), the cells efficiently express the rpTbCOX protein. Lane M:
prestained molecular weight marker; lane 1: protein extract from uninduced cells; lane 2: protein
extract from induced cells; lane 3: supernatant from inclusion body preparation with
lauroylsarcosine; lane 4: inclusion body preparation with lauroylsarcosine.

70
Figure 4.5: SDS-PAGE and Western blot analysis of rpTbCOX after the redox refolding
procedure to determine the approximate size and yield. The recombinant rpTbCOX was quite
stable to be load onto a Ni-NTA column after the refolding procedure under ÄKTA-FPLC. Lane
M: protein molecular weight marker; lane 1: inclusion bodies solubilized with GuHCl, ß-
mercaptoethanol and step-wise dialysis with GSH/GSSH plus L-arginine.
The rpTbCOX was successfully purified by one-step affinity chromatography using a Ni-NTA column on the
ÄKTA-FPLC system following the protocol described in section 3.2.6.3. The protein profile (of the
rpTbCOX) as eluted from the Ni-NTA column after the ÄKTA-FPLC run is presented in Figure 4.6. The flow
through and elution fractions were immediately analyzed by SDS-PAGE and silver staining (Figure 4.6 B).
Mass spectrometry confirmed the identity of the purified protein.

71
Figure 4.6: IMAC purification of the GuHCl-denatured rpTbCOX after refolding of the protein
from inclusion bodies. (A) Chromatogram of the Ni-NTA chromatography illustrating the flow
through (FT) and the Elution peak (E) of rpTbCOX. The Y-axis shows arbitrary absorbance units
at 280 nm; the X-axis shows different fractions collected. The green solid line represents the
imidazole gradient from 0 to 500 mM, passing through the elution peak (E).

72
The fractions A1 to A12 were pooled and loaded onto the gel as shown in Figure 4.4 B. (B) Silver
stained SDS-PAGE gel, indicating the identity of the purified rpTbCOX. Lane M: protein
molecular weight marker; lane 1: pooled eluted fractions A1 to A12; lane 2: pooled eluted fractions
A1 to A12 after concentration using centricon with a molecular weight cut-off (MWCO) of 10 kDa
(Millipore).
The pooled and concentrated elution fractions did not show any cyclooxygenase activity after performing a
thin layer cyclooxygenase activity assay (section 3.2.6.4) (data not shown).
4.3 Cloning and expression of pTbCOX in Sf9 insect cells and in vivo
protein crystallization
The pTbCOX gene sequence (Tb427.10.13790/Tb927.10.13790) was obtained from the T. brucei genome
databank (Tritrypdb or Genedb). For PCR amplification of the pTbCOX, specific forward and reverse primers
with BamHI and HindIII restriction sites were designed using Primer 3 software (see section 3.1.6). The
pTbCOX gene was amplified by PCR using the above primers, AccuPrime Tag DNA polymerase (Invitrogen)
and the trypanosome genomic DNA as a template (see section 3.2.1.1), following the protocol described in
section 3.2.1.2. The TbCOX gene was successfully amplified and visualized in 1% agarose gel electrophoresis.
The expected size of the TbCOX PCR product was 2079 bp and a band was seen at 2 kb. The respective gel
is presented in Figure 4.7.
Figure 4.7: PCR amplification of the pTbCOX gene from Trypanosome genomic DNA using
Accu Prime Tag DNA Polymerase. A 1% (w/v) agarose gel electrophoresis confirming the correct
pTbCOX gene amplification. Lane M: molecular marker, 1 kb Gene Ruler; lane 1: pTbCOX PCR

73
product at 2 kb.
The pTbCOX PCR product was excised and extracted from the agarose gel and the DNA concentration was
determined following the protocol described in section 3.2.1.4. The excised PCR product was first ligated into
pCR 2.1-TOPO TA as a subcloning vector (see section 3.2.1.5) and then transformed using chemically
competent E. coli cells (see section 3.2.1.7). The pTbCOX-pCR 2.1 recombinant clone was digested with
BamHI and HindIII restriction enzymes (see section 3.2.1.11) and validated to be the correct construct by
DNA sequencing analysis (see section 3.2.1.12).
The sample obtained by restriction digestion analysis was loaded on a 1% (w/v) agarose gel and subjected to
electrophoresis. The result is shown in Figure 4.8.
Figure 4.8: Agarose gel electrophoresis after digestion of the pTbCOX-pCR 2.1 recombinant
clone with BamHI and HindIII. Lane M: Molecular weight marker, 1 kb Gene Ruler; lane 1:
sample run, the upper band corresponds to the size of the vector pCR 2.1 (3929 bp), the lower
band corresponds most likely to the size of pTbCOX (2079 bp).
The digested product was then ligated into the target vector pFastBacHTb previously prepared and digested
with the same restriction enzymes (BamHI and HindIII). Formation of the pTbCOX-pFastBacHTb construct
was done following the protocol described in section 3.2.1.6.
After ligation of the excised DNA into the donor plasmid pFastBacHTb, each ligation product was used for
transformation of competent E. coli cells (see section 3.2.1.7). The clones were analyzed by bacterial colony
PCR (see section 3.2.1.8) using specific pTbCOX primers. The clone containing the pTbCOX insert was
subjected to restriction digestion analysis using BamHI and HindIII after plasmid mini -preparation (see
section 3.2.1.9) and submitted for DNA sequencing. The sequencing results were analyzed with the NCBI

74
blast 2 sequence program, which showed that the sequence of pFastBacHTb was correct and that pTbCOX-
pFastBacHTb had no mutations.
Figure 4.9 shows the result of the agarose gel electrophoresis for the pTbCOX-pFastBacHTb recombinant
clones after digestion with BamHI and HindIII restriction enzymes.
Figure 4.9: Agarose gel electrophoresis after digestion of pTbCOX-pFastBacHTb recombinant
clones with BamHI and HindIII. Lane M: Molecular marker, 1 kb Gene Rule; lane 1 and 2: sample
run, the upper band corresponds to the size of the vector pFastBacHTb (3930 bp), the lower band
corresponds most likely to the size of pTbCOX (2079 bp).
In the next step, DH10Bac E. coli cells were transformed with pTbCOX-pFastBacHTb recombinant clones to
generate a recombinant bacmid following the protocol described in section 3.2.2.2.2. After transformation, 4
white clones of the putative TbCOX-pFastBacHTb vector were picked and used for overnight cultures.
Bacmid PCR analyzed the selected clones with M13 reverse and forward primers for the right clone selection
containing the recombinant bacmid. Bacmid PCR was done following the Bac-to-Bac baculovirus expression
system manual (Invitrogen, Germany). Figure 4.10 shows the results of the Bacmid PCR product analyzed
with agarose gel electrophoresis. Obviously, the pTbCOX-pFastBacHTb clones contained the recombinant
bacmid, since a band appeared at the expected size of 4509 bp (2430 bp + 2079 bp).

75
Figure 4.10: The results of the 1% (w/v) agarose gel electrophoresis showing the presence of the
recombinant bacmid band at the expected size of about 4500 bp (4509 bp) in all four pTbCOX-
pFastBacHTb clones analyzed by Bacmid PCR.
In the next step, the recombinant bacmid was isolated from overnight cultures of pTbCOX-pFastBacHTb
clones following the protocol described in section 3.2.1.10. Then, the isolated bacmid containing the inserted
pTbCOX encoding gene was used for the transfection of Sf9 insect cells (see section 3.2.2.2.3) and consecutive
infections to produce three virus generations (P1, P2, P3). Sf9 insect cells showed first signs of infection 72 h
after the transfection (increased cell diameter, bigger cell nuclei). 120 h or 5 days after transfection, late signs
of infection in 80% of Sf9 insect cells were apparent (cessation of cell growth, granular appearance,
detachment from substrate, cell lysis).
The pTbCOX-pFastBacHTb P1 viral stock was isolated and used to generate a high titer P2 stock. 120 h after
infection 80% of Sf9 cells showed late signs of the infection. Therefore pTbCOX-pFastBacHTb P2 viral stock
was isolated and used to generate a high titer P3 virus stock. The above process of virus stock isolation and
amplification was performed following the protocol described in section 3.2.2.2.4. Afterward, the virus titer
of the P3 virus stock was determined using the Reed-Muench method (section 3.2.2.2.5).
In the next experiment, Sf9 insect cells in 6-well plates were infected with a pTbCOX P3 virus with a MOI of
0.1 pfu/cell and 0.2 pfu/cell for crystal production and pTbCOX protein expression (section 3.2.8.1). Figure
4.11 showing the pTbCOX microcrystal structure obtained after 14 days post infection with pTbCOX P3 virus
stock.

76
Figure 4.11: Light micrograph of Sf9 insect cells showing A) non-infected Sf9 cells as a negative
control and B) P3 infected Sf9 cells containing pTbCOX microcrystals 14 days post infection.
(Black arrows: needle shaped pTbCOX microcrystals).
The pTbCOX crystals were isolated by centrifugation (section 3.2.8.1), concentrated (3x10⁶ crystals/ml),
solubilized using sodium acetate pH 3.6 (section 3.2.8.1) and identified by Western blot analysis using Anti-
His Tag antibody (section 3.2.6.7) and scanning electron microscopy (section 3.2.5.2) (Figure 4.12 and Figure
4.13).

77
Figure 4.12: Images are showing: (A) phase contrast microscopy picture of pTbCOX isolated and
concentrated crystals (arrowhead indicates pTbCOX crystals) and (B) Western blot analysis of
pTbCOX solubilized crystals at ca. 74.68 kDa. Lane M: protein molecular weight marker (Page
Ruler Prestained from Thermo Scientific); lane 1: pTbCOX crystals isolated non-concentrated;
lane 2: pTbCOX crystals isolated and concentrated using centricon 30 kDa (Millipore).
Figure 4.13: Scanning electron micrograph images of pTbCOX in vivo crystals protruding in /out
Sf9 insect cells. Blue arrowhead indicates normal Sf9 insect cells without crystals, and the white
arrowhead indicates pTbCOX in vivo crystals.
The pTbCOX isolated crystals (1 x 10⁶ crystals/ml) were analyzed by second order nonlinear optical imaging
of chiral crystals (SONICC), based on second harmonic generation (SHG) microscopy as an approach for

78
detection and characterization of protein crystals (section 3.2.7.1). Figure 4.14 presenting the results of
SONICC and conventional optical methods for protein crystal detection of pTbCOX.
Figure 4.14: Analysis of pTbCOX crystals by SONICC. From left to right: Comparison of visible,
second harmonic generation (SHG) and conventional UV-excited fluorescence (UV). The
resulting signal of this second harmonic generation (SHG) process can be detected at a wavelength
of 532 nm with SHG exposure time of 30 second. The tiny pTbCOX crystals and signal of SHG
are shown inside the different circle.

79
Figure 4.15: X-ray powder diffraction analysis of pTbCOX crystals. The pTbCOX crystals
showed diffraction patterns using powder diffraction. Lysozyme nanocrystals were used for
comparison and control.
The pTbCOX isolated in vivo crystals were solubilized with 200 µl 50 mM sodium acetate at pH 3 and
concentrated using centricon 30 kDa centrifugal filter units (Millipore) at a centrifugation speed of 15000g at
room temperature till approximately 30 µl volume was left. Immediately afterwards, the DLS measurement
and CD spectroscopy were performed using Spectro Light 300 (Xtal-Concepts, Hamburg, Germany) and CD
spectrometer J-815 (Jasco, UK) at DESY – Hamburg (Prof. Christian Betzel Laboratory). DLS measurement
was performed with 15 µl at 20°C for 20 times 30-second measurements and CD spectroscopy was done over
a wavelength area of 190-260 nm (15 measurements were accumulated and the buffer signal subtracted).
The DLS measurement of sample 1 performed after pTbCOX crystals solubilization with 200 µl 50 mM
sodium acetate pH 3.6 using a sample concentration of 6 mg protein per ml showed highly aggregated protein
molecules (Rh around 300 nm) (Figure 4.16).

80
Figure 4.16: DLS measurement of pTbCOX crystals solubilized with 50 mM sodium acetate at
pH 3.6 and the respective histogram plot showing highly aggregated pTbCOX protein, Rh ca. 300
nm and MW between 1.923GDa to 1.578GDa. Sample concentration: 6 mg/ml.
The DLS measurement of sample 2 was done by resolving pTbCOX crystals with 200 µl 50 mM sodium
acetate at pH 3.6 using the same purification procedure as before until a volume of 30 µl was left. Then 300
µl of 5 mM sodium acetate buffer (1:10 dilution of 50 mM sodium acetate buffer in bidistilled water) was
added. The above sample was centifuged again at 15000g at RT using the centrion until a volume of 30 µl left
and then diluted 1:10 with bidistilled water. The final solution containing the pTbCOX crystals in 0.5 mM
sodium acetate at pH 3.6 was transferred to a new Eppendorf vessel and centrifuged for 1 h at 15000g to get
rid of any remaining precipitate. The final sample concentration was 1 mg protein per ml and showed
monomeric protein molecules with Rh 4.30 ± 0.50 nm and a MW of approximately 89 kDa (Figure 4.17). The
CD spectroscopy was performed by resolving the pTbCOX crystals in 50 mM sodium acetate pH 3.6 after 1:3
dilution with bidistilled water (16.7 mM sodium acetate pH 3.6). The CD spectra showed that pTbCOX protein
is stable and properly folded in the above optimal buffer condition (Figure 4.18 A). The pTbCOX protein
secondary structure estimated by using Yang’s reference (Yang et al., 1986) revealed 25.7% helix, 27.7% beta
sheet, 16.4% beta turn and 30.2% random (Figure 4.18 B).

81
Figure 4.17: DLS measurement of pTbCOX crystals solubilized with 0.5 mM sodium acetate at
pH 3.6 and the respective histogram plot showing monomeric protein molecules with Rh 4.30 ±
0.50 nm and a MW of approximately 89 kDa. Sample concentration 1 mg/ml.
Figure 4.18: Circular Dichroism spectra of the pTbCOX crystals resolved in 16.7 mM sodium
acetate pH 3.6. (A) CD spectrum of pTbCOX and (B) Secondary Structure Estimation of pTbCOX
using Yang’s reference (Yang et al., 1986).

82
4.4 pTbCOX RNA interference (RNAi) studies and phenotypes analysis
To investigate and validate the physiological function of the pTbCOX hypothetical protein (Tb427.10.13790)
in T. brucei, a pTbCOX-knockdown (pTbCOX-KD) fragment of the encoding gene (position 427 bis 991,
size: 565 bp) was cloned into an RNAi expression vector (p2T7Ablue) (Figure 4.21 A) which contained two
opposing promoters and allowed transcription of the double-stranded RNA upon doxycycline or tetracycline
induction.
For PCR amplification of the pTbCOX-KD fragment, specific forward and reverse primers with XhoI and
BamHI restriction sites were designed using TrypanoFAN (Trypanosoma brucei Functional Genomic Project)
(see 3.1.14).
The pTbCOX-KD fragment was amplified by PCR using the above primers, high proofreading AccuPrime
Tag DNA polymerase (Invitrogen) and the trypanosome genomic DNA as a template following the protocol
described in section 3.2.1.2.
The pTbCOX-KD fragment was successfully amplified and visualized by 1% agarose gel electrophoresis. The
expected size of the TbCOX-KD PCR product is 577 bp. The results of the gel for pTbCOX-KD fragment
amplification from trypanosome genomic DNA as template are presented in Figure 4.19.
Figure 4.19: PCR amplification of a pTbCOX-KD fragment from trypanosome genomic DNA
using Accu Prime Tag DNA Polymerase. A 1% (w/v) agarose gel electrophoresis suggesting the
pTbCOX-KD fragment amplification. Lane M: Molecular marker, 1 Kb Gene Ruler (Thermo
Fisher Scientific); lane 1: pTbCOX-KD PCR product sized range of about 577 bp.
The pTbCOX-KD fragment was excised and extracted from the agarose gel and the DNA concentration was
determined following the protocol described in section 3.2.1.4.
The pTbCOX-KD PCR product was first ligated into pCR 2.1-TOPO TA as a subcloning vector (see section
3.2.1.5) and transformed using chemically competent E. coli cells (see section 3.2.1.7). The pTbCOX-KD-

83
pCR 2.1 recombinant clones were digested with XhoI and BamHI restriction enzymes (see section 3.2.1.11)
and validated to be the correct construct by DNA sequencing analysis (see section 3.2.1.12).
The sample from the restriction digestion was analyzed by agarose gel electrophoresis. Figure 4.20 shows the
result of the agarose gel electrophoresis.
Figure 4.20: Agarose gel electrophoresis after digestion of the pTbCOX-KD-pCR 2.1
recombinant clones with XhoI and BamHI. Lane M: Molecular marker, 1 Kb Gene Ruler (Thermo
Fisher Scientific); lane 1: Clone 1; lane 2: Clone 2. The upper band corresponds to the size of the
vector pCR 2.1 (3929 bp), and the lower band corresponds to the size of pTbCOX-KD (577 bp).
The pTbCOX-KD digest product was then ligated into the RNAi vector p2T7Ablue (6740 bp) (see Figure
4.21) previously prepared and digested with the same restriction enzymes (XhoI and BamHI). The production
of the pTbCOX-KD-p2T7Ablue construct was done following the protocol described in section 3.2.1.5. After
ligation of the pTbCOX-KD fragment into the RNAi vector p2T7Ablue, each ligation product was used for
transformation of competent E. coli cells (see section 3.2.1.7) and the clones were analyzed by bacterial colony
PCR (see section 3.2.1.8) using specific pTbCOX-KD fragment primers (Figure 4.21).
The clone that contained the pTbCOX-KD insert was subjected to restriction digestion analysis using XhoI
and BamHI after plasmid mini-preparation (see section 3.2.1.9) (Figure 4.21) and submitted for DNA
sequencing. The results were analyzed with the NCBI blast 2 sequence program. The pTbCOX-KD-
p2T7Ablue construct contained one single point mutation, which was not relevant for the further experiments
in respect to RNAi mechanisms consisting of the depletion of mRNA of the target gene using the RNAi
enzymatic machinery to cleave the translated dsRNA into small interfering RNA (25 nt).

84
Figure 4.21: A) p2T7Ablue RNAi vector (6470 bp) picture from TrypanoFan; B) Validation of
the pTbCOX-KD-p2T7Ablue construct by colony PCR; and C) Restriction analysis of the
pTbCOX-KD-p2T7Ablue construct using XhoI and BamHI. A 1% (w/v) agarose gel
electrophoresis confirms the pTbCOX-KD-p2T7Ablue. Lane M: Molecular marker, 1 Kb Gene
Ruler (Thermo Fisher Scientific); Lanes 1, 2 and 3 represent different pTbCOX-KD-p2T7Ablue
recombinant clones.
After the cloning strategy of the pTbCOX RNAi construct (pTbCOX-KD-p2T7Ablue construct) was
successful, bloodform SMB trypanosomes were prepared in cell culture as described in section 3.2.2.2.6. SMB
trypanosomes were transfected with the pTbCOX-KD-p2T7Ablue construct (10 µg), afore linearized with
NotI restriction enzyme, by electroporation following the SMB transfection protocol (see 3.2.2.2.6).
The NotI linearization of pTbCOX RNAi construct was confirmed and visualized by agarose gel
electrophoresis (Figure 4.22).

85
Figure 4.22: NotI linearization of the pTbCOX-KD-p2T7Ablue construct visualized by agarose
gel electrophoresis. Black narrow shows the 6473 bp size expected of the recombinant pTbCOX-
KD-p2T7Ablue construct after NotI single digestion.
The transfected pTbCOX-KD SMB cells were selected and maintained by in vitro cultivation as described in
section 3.2.2.2.6 under Geneticin (2 µg/ml) and Hygromycin (2 µg/ml) antibiotics selection pressure for
further experiments. During this investigation, two different clones of pTbCOX-KD SMB cells were generated
and cryopreserved, named pTbCOX RNAi clone T1.1 and pTbCOX RNAi clone T2.2, respectively. Both cell
lines were picked from different electroporation experiments 2 and 5 days post electroporation.
After selection of transgenic clones, post-transcriptional silencing of the pTbCOX target gene was validated
and confirmed by quantitative real-time PCR (qRT-PCR) as a standard gold method for measuring the steady
state of mRNA levels (see 3.2.3). For the qRT-PCR experiments, specific primers were designed respectively
for pTbCOX (target gene-sized 165 bp) and for ß-tubulin (reference gene-sized 76 bp) using Primer 3 and
Primer NCBI blast software (see 3.1.6).
The “Power SYBR® Green RNA-to-CTTM” 1-Step Kit from Applied Biosystems, which combines reverse
transcription and qPCR in a buffer system, was used to perform the qRT-PCR as described in section 3.2.3.3.
Since the SYBR® Green fluorescence signal, which is used to quantify the amplified amount of DNA, does
not allow any conclusions to be drawn about the quality and specificity of the qRT-PCR amplification, these
parameters had to be examined separately.
The specificity and the degree of purity of the PCR products were carried out immediately following the qRT-
PCR by melting curve analysis. The melting curve showed symmetrical peaks with identical peak maxima.
This symmetrical peak is an indication of the quality of primers and confirms the emergence of a single PCR
product. The resulting qR-PCR products were validated for pTbCOX (target gene) and ß-tubulin (reference

86
gene) by gel electrophoresis analysis. The observed bands (Figure 4.23) are approximately the same as the
expected product sizes.
Therefore, these results suggested the correct and specific amplification of the designated cDNA sequence
regions for both the β-tubulin (reference gene) and the pTbCOX (target gene).
Figure 4.23: 5% (w/v) agarose gel electrophoresis for validation of the qRT-PCR products. Lane
M: O’GeneRuler Ultra Low Range DNA Ladder. Expected product sizes were 76 bp for ß-tubulin
and 165 bp for the pTbCOX.
The evaluation of the qRT-PCR was carried out as described under 3.2.3.4, according to the method of Pfaffl
(2001). From the CT values of the dilution series, a standard curve was created for each primer pair (Figure
4.24).
The qRT-PCR amplification efficiency could be determined from the resulting slope of the compensating
straight lines. For pTbCOX, the efficiency was E pTbCOX of 2.11, and for β-tubulin, an E β-tubulin of 2.16
was obtained.

87
Figure 4.24: Standard curves for qRT-PCR amplification efficiency.
Figure 4.25 presents the results of pTbCOX mRNA levels following 18 h, 42 h and 66 h of RNAi induction
of the pTbCOX RNAi clone T1.1 and pTbCOX RNAi clone T2.2. The concentration of pTbCOX-mRNA
decreased in both clones to approximately 50% after 18 h and 42 h post-induction by doxycycline and in clone
T2.2 to about 25% 66 h post-induction in comparison to the 100% SMB non-transfected cells.
Figure 4.25: qRT-PCR analysis of pTbCOX mRNA levels after 18 h, 42 h and 66 h of RNAi
induction by doxycycline, 1 µg/ml. Data were normalized to ß-tubulin mRNA expression. Data
represent the means ± SD of three independent experiments.

88
Next, both clones (T1.1 and T2.2) were characterized individually to assess the effects of the pTbCOX gene
depletion on the proliferation of T. brucei bloodstream forms.
RNAi was induced by addition of doxycycline (1 µg/ml), and the cell growth was monitored daily using a
hemocytometer (Neubauer). Cells culture densities were maintained between 2.5 x 10⁴ and 1 x 10⁶ cells/ml
for keeping the cell growing by daily dilution. The results shown in Figure 4.26 reveal that the pTbCOX RNAi
progressively decreases the proliferation of T. brucei bloodstreams forms in both, clone T1.1 and T2.2, as
compared to the non-transfected SMB trypanosomes (WT).
Figure 4.26: Growth curves of RNAi cells lines following the presence (+ Doxy) or absence (-
Doxy) of 1 µg/ml doxycycline, in comparison to non-transfected SMB cells lines. The data
represent the means ± SD of two biological replicates.
After the in vitro proliferation experiments of RNAi cells lines after doxycycline induction, the RNAi-
mediated knockdown of the pTbCOX gene caused dramatic changes in the morphology of T. brucei
bloodstreams forms. We thus moved forward to fully characterize the morphology of the pTbCOX depleted
cells using light, fluorescence and electron microscopy. The control SMB trypanosomes cells (without RNAi
induction) and the cells depleted of pTbCOX by RNAi were fixed, either DAPI stained or negative stained
and examined by light or electron microscopy at different times (0 h, 6 h, 24 h, 48 h, and 72 h) after induction
of RNAi by 1 µg/ml doxycycline.
Interestingly, the functional analyses of the pTbCOX gene by RNAi resulted in the appearance of two major
phenotypes:

89
(i) Monster cells with multiple nuclei and multiple flagella, thus suggesting a direct or indirect role in cell
division coordination. Those cells progress through multiple rounds of organelle replication but were not able
to complete cytokinesis (see Figure 4.27 and Figure 4.28).
(ii) Trypanosomes either multi-nucleated or not, displaying a massive enlargement of the flagellar pocket (“big
eye” phenotype) (see Figure 4.28 and Figure 4.29).
Afterward, we produced real time videos of pTbCOX knockdown trypanosomes (data not shown). Our live
videomicroscopy showed representatives pTbCOX-KD trypanosomes monster cells and big eye phenotypes.
Trypanosomes showing a knockdown of pTbCOX were fixed and DAPI stained to analyze the kinetoplast-
nucleus configuration at various times post doxycycline induction (0 h, 24 h, 48 h, and 72 h). Figure 4.30
shows the result of the pTbCOX silencing. Obviously, the knockdown causes a partial cell cycle arrest and
led to accumulation of bloodstream cells with abnormal karyotypes.

90
Figure 4.27: (A) Scanning electron micrographs of pTbCOX RNAi cells 24 h post-induction of
RNAi showing monster cells with multiples nuclei and multiple flagella. (B) Electron micrographs
of whole-mount negative stained trypanosomes 96 h after doxycycline induction. The cells show
3 nuclei, 3 basal bodies and 3 flagella. (C) Transmission electron micrograph taken 42 h after
doxycycline induction shows multiple nuclei and flagella as well as protrusion of the cell body
associated with peripheral flagella, corresponding to giant cells. Abbreviations: N, nucleus; F,
flagellum; FT, flagellar pocket; M, mitochondrion and BB, basal bodies.
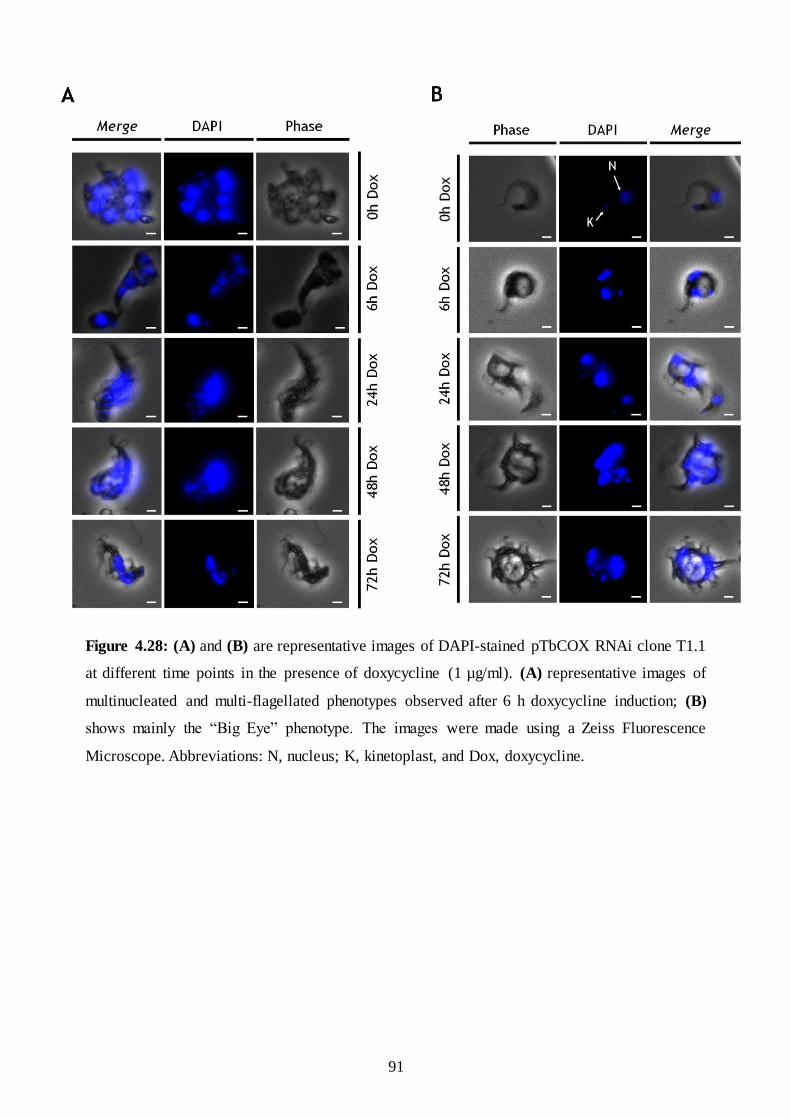
91
Figure 4.28: (A) and (B) are representative images of DAPI-stained pTbCOX RNAi clone T1.1
at different time points in the presence of doxycycline (1 µg/ml). (A) representative images of
multinucleated and multi-flagellated phenotypes observed after 6 h doxycycline induction; (B)
shows mainly the “Big Eye” phenotype. The images were made using a Zeiss Fluorescence
Microscope. Abbreviations: N, nucleus; K, kinetoplast, and Dox, doxycycline.
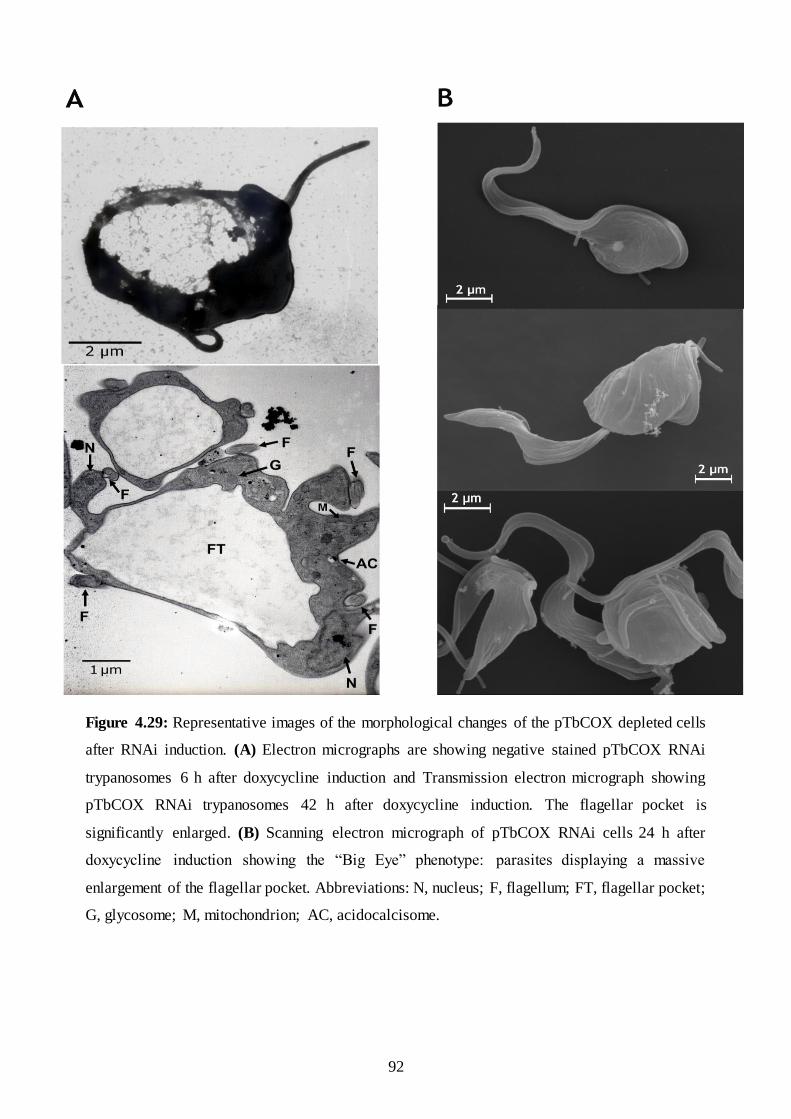
92
Figure 4.29: Representative images of the morphological changes of the pTbCOX depleted cells
after RNAi induction. (A) Electron micrographs are showing negative stained pTbCOX RNAi
trypanosomes 6 h after doxycycline induction and Transmission electron micrograph showing
pTbCOX RNAi trypanosomes 42 h after doxycycline induction. The flagellar pocket is
significantly enlarged. (B) Scanning electron micrograph of pTbCOX RNAi cells 24 h after
doxycycline induction showing the “Big Eye” phenotype: parasites displaying a massive
enlargement of the flagellar pocket. Abbreviations: N, nucleus; F, flagellum; FT, flagellar pocket;
G, glycosome; M, mitochondrion; AC, acidocalcisome.

93
Figure 4.30: Kinetoplast-nucleus configurations of the pTbCOX-KD RNAi cell line at various
time points post-induction. Parasites with abnormal karyotypes are subcategorized into multi-
nucleated flagellated cells (˃2K2N) and other (0K1N, 1K0N, 1K2N, 0K2N). Fluorescence
microscopy assessed the number of kinetoplasts (K) and nuclei (N) following DNA-staining with
DAPI. At least 100 individual cells were analyzed at each time point. Non-transfected SMB cell
line (NT) served as a control.
4.5 Cloning, expression, and localization of an eGFP fused with pTbCOX
protein in Trypanosoma brucei
For PCR amplification of the pTbCOX, specific forward and reverse primers with HindIII and PvuII restriction
sites were designed using Primer 3 software (see section 3.1.6). The pTbCOX gene was amplified by PCR
using high fidelity AccuPrime Tag DNA polymerase (Invitrogen) and the trypanosome genomic DNA as a
template (see section 3.2.1.1) following the protocol described in section 3.2.1.2. The TbCOX gene was
successfully amplified and visualized in 1% agarose gel electrophoresis. The expected size of the TbCOX
PCR product is 2079 bp (2 kb). Figure 4.31 shows the results of the pTbCOX gene amplification from
trypanosomal genomic DNA as template.
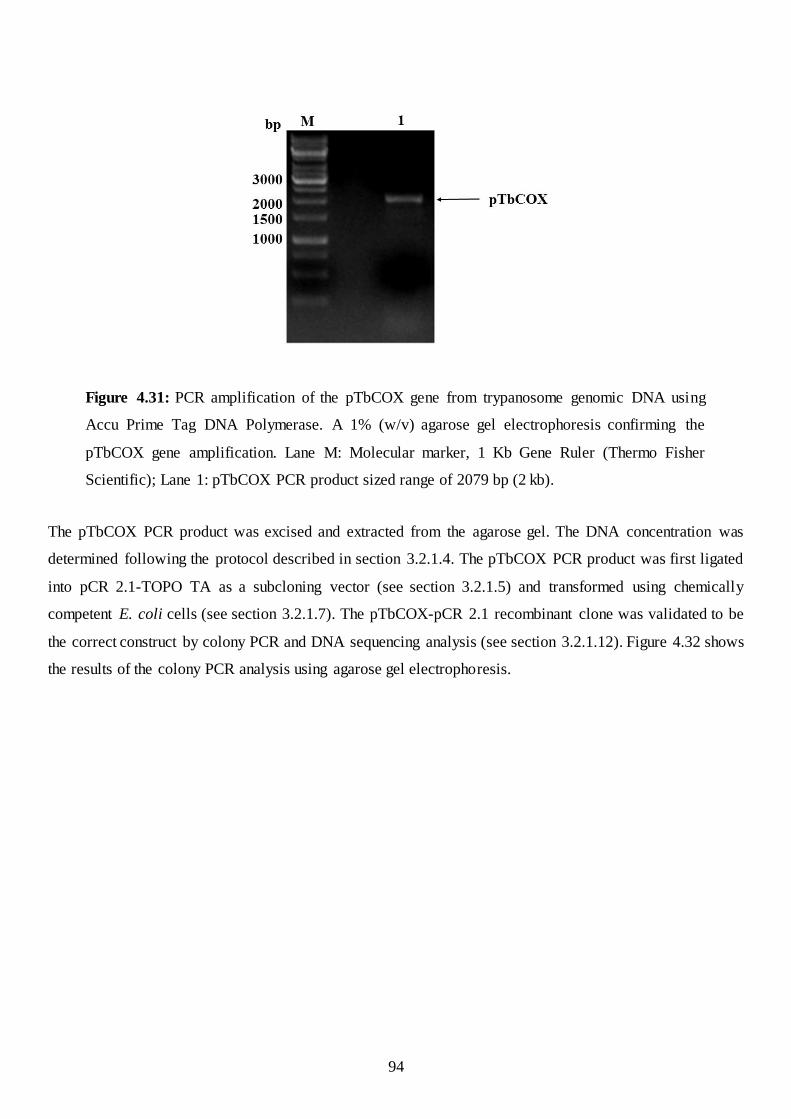
94
Figure 4.31: PCR amplification of the pTbCOX gene from trypanosome genomic DNA using
Accu Prime Tag DNA Polymerase. A 1% (w/v) agarose gel electrophoresis confirming the
pTbCOX gene amplification. Lane M: Molecular marker, 1 Kb Gene Ruler (Thermo Fisher
Scientific); Lane 1: pTbCOX PCR product sized range of 2079 bp (2 kb).
The pTbCOX PCR product was excised and extracted from the agarose gel. The DNA concentration was
determined following the protocol described in section 3.2.1.4. The pTbCOX PCR product was first ligated
into pCR 2.1-TOPO TA as a subcloning vector (see section 3.2.1.5) and transformed using chemically
competent E. coli cells (see section 3.2.1.7). The pTbCOX-pCR 2.1 recombinant clone was validated to be
the correct construct by colony PCR and DNA sequencing analysis (see section 3.2.1.12). Figure 4.32 shows
the results of the colony PCR analysis using agarose gel electrophoresis.
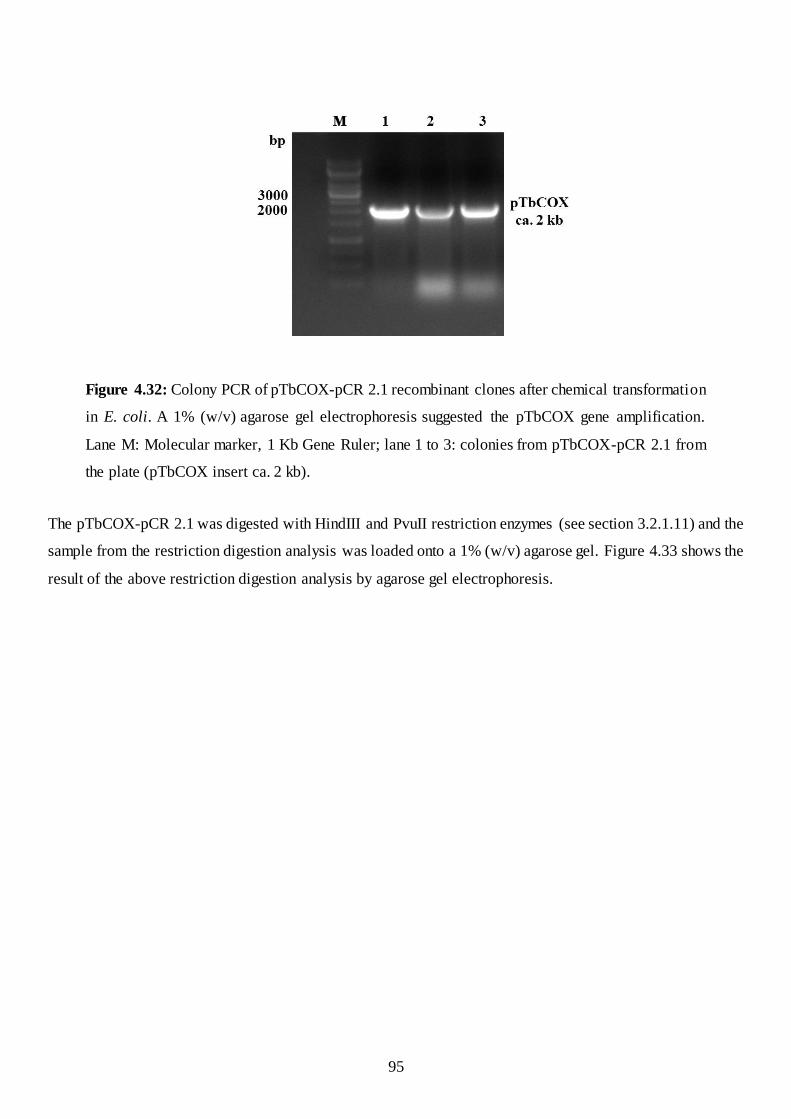
95
Figure 4.32: Colony PCR of pTbCOX-pCR 2.1 recombinant clones after chemical transformation
in E. coli. A 1% (w/v) agarose gel electrophoresis suggested the pTbCOX gene amplification.
Lane M: Molecular marker, 1 Kb Gene Ruler; lane 1 to 3: colonies from pTbCOX-pCR 2.1 from
the plate (pTbCOX insert ca. 2 kb).
The pTbCOX-pCR 2.1 was digested with HindIII and PvuII restriction enzymes (see section 3.2.1.11) and the
sample from the restriction digestion analysis was loaded onto a 1% (w/v) agarose gel. Figure 4.33 shows the
result of the above restriction digestion analysis by agarose gel electrophoresis.

96
Figure 4.33: A) Illustration of restriction digestion analysis of pTbCOX-pCR 2.1 using
DNAMAN software showing in lane 1: pTbCOX-pCR 2.1 single digests with HindIII; lane 2:
pTbCOX-pCR 2.1 single digest with PvuII; and lane 3: pTbCOX-pCR 2.1 digests with HindIII
and PvuII. B) 1% (w/v) agarose gel electrophoresis of the pTbCOX-pCR 2.1 digested with HindIII
and PvuII. Lane 1: pTbCOX-pCR 2.1 digests with HindIII and PvuII like predicted in A lane 3.
C) 1% (w/v) agarose gel electrophoresis of the band ca. 2000 bp lane 1 in B excised and extracted
showing a single band of pTbCOX at the right bp size.
The pTbCOX gene was ligated into the pCO57 vector. This vector allows the expression of eGFP fusion to
the c-terminus of the desired protein and contains an inducible T7 expression site, which is regulated by a
tetracycline operator. Figure 4.34 A shows the results of the ligation and double digestion analysis of the
pTbCOX-pCO57 construct with HindIII and PvuII restriction enzymes by agarose gel electrophoresis
analysis.
The right and validated pTbCOX-pCO57 construct was linearized with EcoRV (Figure 4.34 B) and then
electroporated into SMB cells, which express a T7RNA polymerase and a tetracycline repressor. The
electroporated pTbCOX-pCO57 SMB cells line were selected and maintained in in vitro culture as described
in section 3.2.2.2.6 under Geneticin (2 µg/ml) and Phleomycin (2.5 µg/ml) antibiotics selection pressure for
expression of the pTbCOX fused with eGFP in Trypanosoma brucei.

97
I observed that the expression of the green fluorescence pTbCOX protein was leaky and resulted in the death
of the electroporated SMB cells 4 days after transfection. Using Zeiss fluorescence microscopy, live imaging
of SMB trypanosomes produced single or multi punctuated green fluorescent signals (see Videos).
Next, the electroporated pTbCOX-pCO57 SMB cells line were fixed in 2.5% glutaraldehyde and DAPI stained
for fluorescence microscopy analysis. This experiment showed that the pTbCOX green fluorescent protein
was not located in the cytosol but appeared as a single dot near the kinetoplast or between kinetoplast and
nucleus (Figure 4.35). The pTbCOX fused eGFP overexpression was extremely fast lethal for bloodstream
form parasites.
Figure 4.34: A) 1% (w/v) agarose gel electrophoresis after digestion of the pTbCOX-pCO57
recombinant clones with HindIII and PvuII. Lane M: Molecular marker, 1 Kb Gene Ruler; lane 1:
Non-digested pTbCOX-pCO57 plasmid; lane 2: digested pTbCOX-pCO57 construct. The upper
band corresponds to the pTbCOX-pCO57 HindIII & PvuII digested (ca. 6000 bp), and the lower
band corresponds to the size of pTbCOX (ca. 2000 bp). B) 1% (w/v) agarose gel electrophoresis
of EcoRV linearization the pTbCOX-pCO57 construct prior to electroporation in SMB
trypanosomes cells. Lane 1: pTbCOX-pCO57 plasmid and lane 2: pTbCOX-pCO57 EcoRV
linearized.

98
Figure 4.35: Fluorescence micrographs of SMB trypanosomes expressing pTbCOX fused with
eGFP protein. A) The image is showing green dot signal near the kinetoplast and B) Image
showing green dot signal between the kinetoplast and nucleus. The images were made from Zeiss
Fluorescence Microscope (exposure time: DAPI: 50ms, GFP: 200ms and BF: 100ms) and
prepared using image J software. Abbreviations: N, nucleus and K, kinetoplast.

99
5 Discussion
5.1 Bioinformatics analysis of the hypothetical protein pTbCOX
A hypothetical protein from T. brucei was found in our search for a putative COX-like enzyme (pTbCOX)
using Western blot analysis, peroxidase activity assay and mass spectrometry analysis.
We were interested to analyze pTbCOX using different bioinformatic tools. No hit was found in terms of
specific motif domains, such as signal peptides or membrane anchors. More importantly, however, no
homolog proteins have been detected in human or other organisms, except kinetoplastida. pTbCOX is a 74.68
KDa protein encoded by a 2043 bp gene. Blast analysis using NCBI showed 100% identity with other
conserved hypothetical proteins of other kinetoplastid species. The facts that, firstly, no homolog proteins
seem to exist in other organisms, secondly, pTbCOX seems to be a well conserved protein expressed in the
whole kinetoplastids family, and thirdly, it is essential for T. brucei, renders this protein into an interesting
target for new drugs against kinetoplastid diseases. However, this protein remains to be assessed against other
drug target validation criteria such as structure information, assayability, druggability, selectivity/ toxicity and
resistance potential (Agüero et al., 2008; Field et al., 2017).
Furthermore, the bioinformatic analysis of pTbCOX revealed the presence of -helices and ß-strands,
considerable coiled-coil structures and a large number of putative phosphorylation sites (Ser/Thr/Tyr) (Figure
4.1 and Figure 4.2). Cellular signaling is driven mainly by protein phosphorylation and de-phosphorylation
events, which are controlled by protein kinases and protein phosphatases (Batista et al., 2017). It has been
shown that protein phosphorylation is a key regulator of signal transduction pathways that, thus far, has been
studied in T. brucei principally through the knockdown of putative kinases and the observation of resulting
phenotypes (Nett et al., 2009).
Unfortunately, our blast analysis of pTbCOX with well known protein kinases or other kinase-like proteins in
T. brucei genome did not reveal any similarity in terms of specific or characterized kinase catalytic domains.
To the best of our knowledge, pTbCOX is so far not listed in any research study attempted to identify
trypanosomal phosphoprotein using phosphoproteomics approaches (Jones et al., 2015; Marchini et al., 2014;
McAllaster et al., 2015; Nett et al., 2009; Urbaniak et al., 2013).
The fact that pTbCOX possesses several phosphorylation sites (Ser/Thr/Tyr) may suggest that a cellular
activity associated with cell proliferation and differentiation is at work, and this shall be addressed in the future
by using mass-spectrometry based phosphoproteomics and RNA-Sequencing.

100
5.2 Heterologous expression, refolding and purification of pTbCOX
The pTbCOX was amplified and successfully cloned in E. coli. Heterologous expression of pTbCOX was
clearly achieved, but the protein formed inclusion bodies (IB). Inclusion bodies are insoluble protein
aggregates that often occur during high level expression of hydrophobic proteins. Recombinant protein
synthesis in E. coli, especially when driven by a strong promoter such as the T7 promoter, happens at a faster
rate which leads to misfolding and accumulation of insoluble protein within the cells (Lebendiker and Danieli,
2014; Rosano and Ceccarelli, 2014). In this study, cloning of the pTbCOX gene was done in a pProExHTa
vector system. The protein was highly expressed, but always found in the pellet fraction despite the use of
different IPTG concentrations and induction times. Multiple attempts were made to modify the level of protein
expression and to promote the solubility of pTbCOX in E. coli. Many studies showed that growing host cells
at lower temperatures, co-expressing the protein of interest with chaperones and foldases and using other
solubilizing Tag-fusion partners (MBP, NusA and GST) might improve the solubility of the protein expression
in bacteria (Deller et al., 2016; Lebendiker and Danieli, 2014; Walls and Loughran, 2011).
A number of host cells are available which have been reported to be efficient in soluble protein expression. In
this study, the host strains used were E. coli BL21 (DE3). This strain was designed to enhance the expression
of eukaryotic proteins that either may be toxic to the host cell or may be cleaved by endogenous proteases.
For this purpose, it contains the T7 polymerase that is activated only after IPTG induction, and this strain is
deficient of Lon and omp-t proteases and is therefore suitable for protein expression (Deller et al., 2016).
Many factors have been reported to lead to protein instability and aggregation. First, once the recombinant
protein is expressed in a new E. coli microenvironment which may differ from that of the original source in
terms of pH, redox potential, osmolarity, cofactors, and folding mechanisms (Deller et al., 2016). Second, the
recombinant protein contains a considerable number of hydrophobic amino acids that may co-interact thus
leading to protein aggregation and inclusion body formation (Baneyx and Mujacic, 2004). This last scenario
fits well with pTbCOX, because the hydrophobicity plot analysis revealed a high content of hydrophobic
amino acids within the sequence (Figure 4.3). It has been demonstrated that the high numbers of aromatic and
aliphatic residues (ala, cys, val, ile, leu, met, phe, and tryp) are thought to decrease the solubility of proteins
during refolding and contribute to the aggregation of protein folding intermediates (Burgess, 1996, 2009).
Since the commonly used methods to express soluble protein were not successful with pTbCOX, a more
laborious technique known as inclusion body solubilization and refolding was performed to obtain soluble
pTbCOX, properly fold and in its active forms.
This technique is time consuming and often yields a poor recovery (Yamaguchi and Miyazaki, 2014), but
many studies have shown that it is possible to successfully refold inclusion body proteins to their biologically

101
active states. The inclusion body form of pTbCOX was solubilized first using the weak ionic detergent
lauroylsarcosine, which was reported to effectively reduce hydrophobic aggregation and allow the recovery
of monomeric, active protein molecules from inclusion bodies (Burgess, 1996, 2009). The results of this first
approach are presented in chapter 4 (Figure 4.4).
In a second approach, strong denaturants such as guanidine hydrochloride and step-wise dialysis was used as
refolding strategy. Many studies have shown that protein refolding from denatured protein is influenced by
several factors, including solubility of the respective protein, removal of denaturants, and assistance of
refolding by a co-solute or by other additives (Yamaguchi and Miyazaki, 2014).
Unfortunately, all the afore mentioned attempts to purify pTbCOX using affinity chromatography on the
ÄKTA FPLC system from the lauroylsarcosine approach were unsuccessful, because the pTbCOX was not
binding to the Ni-NTA column and appeared always in the flow through.
The final approach, i.e. treating the pTbCOX inclusion bodies with high grade strong denaturant GuHCl plus
the reducing agent ß-mercaptoethanol and a step wise dialysis refolding by adding GSH/GSSH and L-arginine
were reasonably effective for refolding pTbCOX. This step wise dialysis technique included denaturation,
reduction of the disulphide bonds and then generation of the corrected bond configuration by includi ng
GSH/GSSH to prevent protein aggregation of partially folded intermediates by addition of L-arginine. This
technique has been used previously for the refolding of two ScFv antibodies constructions (Arakawa and
Ejima, 2014).
Arginine hydrochloride or arginine has been applied for refolding of a variety of proteins from inclusion
bodies, such as casein kinase (Lin and Traugh, 1993), gamma interferon (Arora and Khanna, 1996), p53 tumor
suppressor protein (Bell et al., 2002), and interleukin-21 (Asano et al., 2002). The exact molecular mechanism
of arginine is still not well understood. Arginine hydrochloride has a guanidinium group (Gdn) at the distal
end of its side chain, similar to GuHCl. The Gdn strongly interacts with hydrophobic amino acids in hen egg-
white lysozyme (Mande and Sobhia, 2000) and act as a strong chaotropic agent. The crystal structure of the
lysozyme-arginine complex showed that arginine bound at sites different from those of Gdn, and mildly
interacted with nearby hydrophobic amino acid of the protein surface (Ito et al., 2011). These interactions
included electrostatic, hydrophobic and cation-π interactions. Compared with Gdn, the amino and carboxyl
groups of arginine form weaker hydrogen bonds with the denatured protein and water. Thus, arginine might
act as an aggregation inhibitor due to its moderate binding to protein (Matsuoka et al., 2009).
In addition, proline has also been reported to enable proteins to refold to their native (active) conformations.
It was proposed that proline inhibits protein aggregation by binding to the folding intermediate in the
supramolecular assembly with proline (Samuel et al., 2000).
102
The pTbCOX refolding strategy using the second approach was successful to purify the protein applying a
one-step Ni-NTA affinity chromatography on an ÄKTA FPLC. The results are presented in Figure 4.5 and
Figure 4.6.
The purified pTbCOX was than dialyzed overnight and checked for stability. DLS measurement, however,
demonstrated that the purified pTbCOX was highly aggregated (data not shown) and the COX activity test
performed using sensitive TLC radioactive assay on the pTbCOX was negative (data not shown).
5.3 Heterologous expression of pTbCOX in Sf9 insect cells and in vivo
protein crystallization
In order to produce a proper folded and active pTbCOX with post-translational modifications, a new construct
was generated using the baculovirus expression vector pFastBacHTb for production of this protein in Sf9
insect cells and in vivo protein crystallization. In vivo protein crystallization has been mostly reported by using
a heterologous expression system based on the polyhedrin promoter (Koopmann et al., 2012; Redecke et al.,
2013a; Schönherr et al., 2015). Using this system, several proteins with unrelated functions, structure and
physico-chemical properties have now been reported to crystallize in vivo, suggesting that this strategy could
be routinely used for structure determination alongside classical crystallographic approaches (Boudes et al.,
2016; Duszenko et al., 2015). We have employed this baculovirus system in the past to produce in vivo protein
crystals of cathepsin B and inosine monophosphate dehydrogenase from T. brucei (Duszenko et al., 2015).
TbCatB in vivo crystals have been subjected to free-electron laser based serial femtosecond crystallography
(SFX), performed in collaboration with Prof. Christian Betzel and Prof. Henry Chapman (DESY, Hamburg)
and yielded the TbCatB structure at a resolution of 2.8 Å (Gati et al., 2014b; Redecke et al., 2013b)
The pTbCOX was expressed in the pellet fraction or insoluble fraction (membrane-attached protein like the
expression experiment using bacteria BL21(DE3) system) at different days post-infection and led us to
observe an in vivo crystal-like structure inside cells after 14 days after transfection with the P3 virus stock
(Figure 4.11 B).
5.4 Characterization of pTbCOX crystals
The pTbCOX crystals were first confirmed to consist solely of pTbCOX by Western blot analysis. For this
purpose, in vivo crystals were isolated, concentrated, solubilized and run on SDS gels. For detection a
polyclonal anti-his antibody was used after transfer of the protein to a nitrocellulose membrane (Figure 4.12
B). Unfortunately, we were not able to obtain positive mass spectrometry signals of the pTbCOX because of

103
its low concentration and weak signal in the SDS-PAGE even after multiple concentration efforts using either
Coomassie or silver staining.
The pTbCOX was then analyzed by scanning electron microscopy. We observed the micro sized needle shaped
crystals progressed from the Sf9 insect cells or on top of Sf9 insect cells. The mechanism by which protein
crystallize at a specific location within the cell is still not yet clear understood. So far it has been well
demonstrating that high local concentration of the recombinant in baculovirus-infected insect cells is the prior
requirement to induce in vivo crystallogenesis within an organelle (Duszenko et al., 2015; Koopmann et al.,
2012).
SONICC based SHG imaging (Figure 4.14) and X-ray powder diffraction (Figure 4.15) in Prof. Christian
Betzel’s group at DESY were performed to confirm the crystallinity of the pTbCOX crystals. The SONICC
revealed positive signals of the pTbCOX crystals. It has been demonstrated that the SONICC measurement is
a selective and sensitive method for detection and characterization of protein crystals. SHG identifies protein
crystals by imaging the samples with infrared light and detecting the frequency-doubled response specific of
chiral crystals (Boudes et al., 2014). The SHG signals revealed the proteinaceous nature of the pTbCOX
crystals because it has been shown that amorphous aggregation or salt crystals do not produce SHG signals.
It should be noted that SHG imaging has its limitations: it can give false-negative results in rare instances
when the crystal packing is of high symmetry and it can generate false-positive results if, for example, a salt
crystal appears (Wampler et al., 2008). Subsequently, the pTbCOX crystals vs lysozyme crystals as positive
control analyzed by powder diffraction showed diffraction ring up to 4-5 Å resolution (Figure 4.15),
confirming a crystalline state of pTbCOX crystals. Both experiments support preliminary characterization of
the pTbCOX in vivo crystals prior to XFEL beam or MicroED for data collection. The success of a XFEL or
MicroED experiment is highly dependent on crystal quality, size, density and quantity.
The solubilized pTbCOX crystals were used to assess the stability of the pTbCOX protein at the level of
secondary structure using DLS and CD spectroscopy methods. Interestingly, DLS measurement of the
pTbCOX crystals solubilized with different concentrations of sodium acetate buffer revealed the aggregation
tendency behaviors of the pTbCOX protein. This screening step demonstrated the optimal condition or
treatment by which the pTbCOX switch from a large oligomer or aggregate (Figure 4.16) to monodisperse
molecules with a radius corresponding to the monomeric pTbCOX protein (Figure 4.17). Due to our
observation of the pTbCOX expression in bacteria as an insoluble protein and multiple rescue procedures
developed during this thesis including: such as refolding of denatured pTbCOX using lauroylsarcosine and
guanidine hydrochloride plus L-arginine, alternative expression systems such as yeast, decreasing the culture
temperature have proven not effective in producing soluble pTbCOX from T. brucei because of its high
tendency to aggregate.

104
This result could be proposed as a new way to rescue pTbCOX so far insolubly expressed in bacteria into
inclusion bodies to be easily solubilized by the addition of sodium acetate during bacteria cell lysis. Thus, this
protocol should allow us to recover pTbCOX in a soluble and correctly folded form for conventional
crystallography and structure determination.
CD spectroscopy of pTbCOX was also done and confirmed the stability of the pTbCOX properly folded at
12.5 mM sodium acetate buffer pH 3.6. Using this buffer, the secondary structure was estimated for the first
time and identified the percentage of helix, sheet, turn and random-coiled of the pTbCOX using Yang’s
reference (Figure 4.18). Therefore, the sodium acetate buffer pH 3.6 stabilizes pTbCOX and can be used for
conventional crystallography trials and for biological assays of pTbCOX.
5.5 Knockdown studies of pTbCOX gene and phenotypes analysis
RNAi was employed to investigate the essentiality of pTbCOX in the trypanosome SMB cell line. Therefore,
the pTbCOX-KD fragment from the encoding gene was successfully cloned into the p2T7 expression vector
which contains two opposing promoters and, hence, allowed transcription of double stranded RNA upon
doxycyclin induction (Figure 4.21). The recombinant vector construct was then transfected into bloodstream
form T. brucei by electroporation. This resulted in the production of two different transgenic clones named
pTbCOX RNAi clone T1.1 and pTbCOX RNAi clone T2.2 for further investigations.
RNAi knockdown was efficiently and effectively confirmed by quantitative real time PCR (qRT-PCR). The
pTbCOX mRNA levels decreased in both clones to approximately 50% after 18 h and 42 h post-induction by
doxycycline and in clone T2.2 to about 25% 66 h post-induction in comparison to the 100% SMB non-
transfected cells (Figure 4.25). Quantitative real-time PCR demonstrated that the doxycycline mediated
induction of RNAi resulted in a significant reduction of the pTbCOX mRNA level compare to the WT mRNA
level. It has been observed in T. brucei knockdown experiment that reduction of mRNA level measured by
qRT-PCR does not necessarily have to be correlated with the protein level measured by Western blot analysis
(Clayton and Shapira, 2007). Since the level protein were not measured because of the lack of specific
antibody against pTbCOX, we can assume that the pTbCOX was decreased more significantly in our pTbCOX
RNAi cell lines that showed apparition of phenotypes.
However, the use of very accurate tools such as Northern blot analysis or RNA-Sequencing are still necessary
to be performed for the validation of the efficiency of the pTbCOX knockdown study at the RNA and pTbCOX
expression level in T. brucei.
Interestingly, depletion of the pTbCOX mRNA produced a progressively decrease of growth (Figure 4.26),
gross morphological defects including multiflagellated and big eye phenotypes which was observed within 6
105
h post doxycycline induction by fluorescence microscopy (Figure 4.28). Furthermore, analysis of
kinetoplast/nucleus progression in the pTbCOX-KD RNAi cell line revealed a partial cell cycle arrest and
failure to initiate cytokinesis. Thus, accumulation of cells with abnormal karyotypes have been regularly
detected (Figure 4.30).
SEM and TEM microscopy showed that the cell periphery was highly twisted; multiple nuclei and multiple
flagella were attached to the outside of the cell, while other cells possessed a highly enlarged flagellar pocket
(Figure 4.27 and Figure 4.29). Taken together, these data clearly suggest that pTbCOX is essential for the
bloodstream form of the parasite in vivo. Knockdown of pTbCOX rapidly produces “monster” cells with
multiple nuclei and multiple flagella, thus suggesting a direct or indirect role of pTbCOX in cell cycle
coordination. At the same time, we observed also the presence of parasites with an enlarged flagellar pocket,
the so called big eye phenotype, after RNAi induction by doxycycline. It has been shown that both phenotypes
generally appeared when the function of an essential flagellum protein is perturbed in bloodstream form T.
brucei (Broadhead et al., 2006; Ralston and Hill, 2008).
The mainly described defects incriminate after the appearance of pTbCOX KD lethal phenotypes were
cytokinesis for the multiflagellated phenotype (Brasseur et al., 2013; Broadhead et al., 2006; Hutchings et al.,
2002; Olego-Fernandez et al., 2009; Ralston and Hill, 2008) and endocytosis for the big eye phenotype
(Adung’a et al., 2013; Allen et al., 2003; Field and Carrington, 2009; Manna et al., 2017; Morriswood and
Schmidt, 2015). So far, we have been unable to detect which defect appear as primary event. We found that
both phenotypes were consistently observed 6 h post doxycycline induction.
A possible explanation for the lethal phenotype in bloodstream cells is that cytokinesis failure results as a
primary event from the absence of correct flagellar motility. This situation will induce a multiple round of cell
division without cytokinesis leading to new flagella and pockets formed at inappropriate location. The lack of
the precise morphogenetic axes in the resulting “monster cells” leads to pleiotropic effects compromising
membrane-cytoskeleton balance during morphogenesis of the pocket structure (Broadhead et al., 2006). It has
been suggested that the monster cells phenotype will have a perturbation of endocytosis combined with the
secretory pathways, thus will lead to the enlargement of the flagellar pocket result on big eye phenotype as
secondary event (Broadhead et al., 2006). Another possible scenario will be that the cytokinesis failure is not
the one inducing the endocytosis defect producing the big eye phenotype observed during the pTbCOX
knockdown study.
Since pTbCOX is still not fully characterized and remains a hypothetical protein, our detailed results of the
morphological changes induced by pTbCOX knockdown give strong light on its essentiality for the parasite.
However, further investigations are needed to reveal the precise cellular process by which pTbCOX contribute

106
to maintain cytokinesis or the endocytic system in T. brucei in balance. Thus, we hypothesized that pTbCOX
might participate in multiple cellular processes in T. brucei.
5.6 Expression of pTbCOX protein fused with eGFP in Trypanosoma
brucei
In this last experiment, we tried to identify the subcellular localization of pTbCOX inside the bloodstream
forms of T. brucei. The pTbCOX gene was successfully cloned in the pCO57 vector. This vector allows the
expression of eGFP fusion to the C-terminus of the desired protein and contains an inducible T7 expression
site, which is regulated by a tetracycline operator. This system is well suited to be inserted into SMB cells,
which express T7 RNA polymerase and a tetracycline repressor. The pTbCOX-pCO57 construct was
successfully generated and transfected into SMB cells. Surprisingly, the pTbCOX-eGFP was firstly leaky
expressed and secondly was readily lethal, because no transfected clones were obtained despite many attempts
of repeated transfections with or without tetracycline or doxycycline induction, and all transfected parasite
cultures died 4 days post transfection. We initially hypothesized that the autoinduction phenomenon might be
linked to the pCO57 vector, the fetal bovine serum with tetracycline, or so far unknown effects of pTbCOX.
The strategy used to decipher the autoinduction mechanism was based firstly on the expression of pTbCOX
in SMB trypanosomes using a commercially available tetracycline-free fetal bovine serum. However, since
overexpression of pTbCOX in SMB trypanosomes was still lethal for transfected parasites following
tetracycline or doxycycline induction, we ruled out the autoinduction phenomenon was due to fetal bovine
serum with tetracycline.
However, we consistently observed a fast-lethal process of the transgenic clones expressing the pTbCOX-
eGFP fusion protein within the 4 days postinduction. One reason of this lethal phenomenon could be that the
pTbCOX protein is tightly regulated in T. brucei.
Video fluorescence microscopy showed different morphologies in pTbCOX-eGFP transfected bloodstream
form parasites including: stumpy forms, intermediate forms, long slender forms and multiflagellated cells.
This fusion protein was not homogenously distributed, but appeared as single or multiple punctate within the
transfected bloodstream form parasites. The fluorescence imaging obtained after cell fixation and DAPI
staining localized the pTbCOX-eGFP fusion protein as a single dot near the kinetoplast or in between the
kinetoplast and nucleus (Figure 4.35). The biological relevance of pTbCOX localization remained
unanswered. We could speculate that the fact that knockdown of pTbCOX induce an impairment of
cytokinesis and endocytosis requires further investigation to proof the connection of pTbCOX with the
flagellar apparatus of T. brucei.

107

108
6 Future perspectives on pTbCOX as drug target
HAT is one of the deadly neglected tropical diseases affecting people living in sub-Saharan Africa. It is caused
by T. brucei parasites transmitted to the human host by tsetse flies. HAT therapy still relies upon drugs which
use is limited by toxicity and rigorous treatment regimes, while development of vaccines remains up highly
unlikely, due to the effectiveness of antigenic variation. There is an eminent need to identify and develop
better drugs against HAT.
Currently, efforts have been made to identify better drugs or new lead compounds for the treatment of HAT
using phenotypic screening or target-based approaches. Unfortunately, there is no increase of new drug
discovery because of the lack of a defined target that is both essential and druggable validated in the
trypanosomatids (Field et al., 2017). Therefore, identification of novel targets which are unique and different
to the human host must be given priorities for future genetic validation and structure determination.
A major problem with the genome sequence of T. brucei is the failure to predict the function of the gene
encoding hypothetical proteins, that comprise approximately 50% of the total genome. Analysis of these
hypothetical proteins could identify new drug targets, since these genes have no equivalent in the human
genome and may, as in the case of pTbCOX, be essential for the parasite’s survival. In addition, new protein
structures revealing new domains or motifs, and even novel metabolic pathways may appear and contribute
to the drug discovery pipeline.
In this thesis, I have analyzed an annotated hypothetical protein of the T. brucei genome, called pTbCOX that
lacks human homologs, is well conserved among kinetoplastids and was demonstrated to be essential for cell
division and morphogenesis in bloodstream form T. brucei. Our endeavors were the move forward to
comprehensively elucidate the structure-function of pTbCOX by cloning, expressing the pTbCOX gene using
different expression systems.
The first challenge of this thesis was that pTbCOX expression in bacteria led consistently to the formation of
inclusion bodies. From those, pTbCOX was extracted using strong denaturant guanidine hydrochloride and
finally refolded by step-wise dialysis using additives like GSH/GSSH and L-arginine. Afterwards, pTbCOX
was purified by affinity chromatography on a Ni-NTA column using the ÄKTA FPLC system.
The second challenge was to get a better understanding of the aggregation of pTbCOX after purification and
to obtained a correctly folded and stable pTbCOX. For this purpose, I move forward and produced a new
construct of pTbCOX for baculovirus expression and in vivo protein crystallization.

109
Luckily, pTbCOX seems to crystallize inside Sf9 insect cells and I was able to preliminary characterize the
pTbCOX crystals before XFEL or MicroED beam data collection.
Interestingly, analysis of the solubilized pTbCOX crystals from Sf9 insect cells by DLS and CD spectroscopy,
point into the possible direction how to solve pTbCOX aggregation problem. Firstly, treatment of the pTbCOX
expressing bacteria before cell lysis or harvesting the inclusion bodies with sodium acetate as a proposed
mechanism to obtain the soluble recombinant protein. Or, secondly, treatment of the purified recombinant
pTbCOX in vivo crystals via the one-step purification described in this thesis with sodium acetate by overnight
dialysis.
Anyway, further work needs to be done to complete the full characterization of the attractive target pTbCOX
in the future:
(a) Identification of the signaling pathway where pTbCOX might play a crucial role in T. brucei. As
bioinformatic tools revealed the presence of multiple phosphorylation sites within the pTbCOX sequence,
mass-spectrometry-based phosphoproteomics and RNA-sequencing using a pTbCOX knockdown cell line
will shed light on the phosphorylation patterns and gene expression levels of these cells.
(b) Elucidating the structure of pTbCOX using conventional or in vivo protein crystallography approaches is
also important to answer the remained question “what is the function of pTbCOX?”. The discovery of the
pTbCOX structure will shed light on its function and to explore whether or not pTbCOX is a suitable drug
target candidate for HAT therapy. It will also make it possible to evaluate new domain motifs or to reveal new
biochemical pathways and cascades in the Trypanosoma biochemistry.
In Summary, pTbCOX is well conserved and expressed in Trypanosomatids and lacks human homologs.
Genetic knockdown studies demonstrated that it is essential for cell division and morphogenesis in
bloodstream form T. brucei. Therefore, pTbCOX seems to be a suitable drug target candidate to be added to
the drug discovery pipeline for HAT therapy. However, the challenge is still ongoing to obtain native
pTbCOX, solving its X-ray crystals structure for druggability and assayability studies.

110
7 Summary
Trypanosoma brucei comprises a group of extracellular kinetoplastid protozoa including the causative agent
of Human African Trypanosomiasis (HAT). Sequencing of their genomes revealed approximately 50% of
genes which are so far uncharacterized regarding their biochemical or cellular functions but are identified as
hypothetical proteins with no homologs in the human host. This opens possibilities for new target
identification and drug discovery. With the initial aim of identifying the gene encoding a putative T. brucei
cyclooxygenase (pTbCOX), Western blot and mass spectrometry analyses were used to identify a protein that
is recognized by a cyclooxygenase ovine polyclonal antibody in trypanosome lysates. This led to a list of
hypothetical genes, encoding a cyclooxygenase-like enzyme candidate. Among them, a gene
(Tb427.10.13790/Tb927.10.13790) encoding a hypothetical conserved protein was immunologically
identified at 74.68 kDa using cyclooxygenase ovine polyclonal antibody during protein expression, and it
contained highly hydrophobic amino acids. Therefore, this protein was chosen for further experimental
investigations.
In the first part of this work, the bioinformatic analyses of pTbCOX were performed using BLAST/NCBI,
Pfam, Prosite, Swiss-Pro, InterPro, TMHMM, Signal P, Hydrophobicity Plot and NetPhos to describe the
pTbCOX gene/protein. These analyses revealed no convincing homolog proteins in human or any other
organism, except in kinetoplastida. No hit was found regarding specific domains, signal peptides or membrane
anchors. However, blast analysis using NCBI showed 100% identity with conserved hypothetical proteins of
other kinetoplastid species. The hydrophobicity plot analysis revealed a high content of hydrophobic amino
acids within the sequence. Therefore, the pTbCOX is a prime example of a protein annotated as “hypothetical
protein” in T. brucei genome which fulfilled the above criteria, i.e., no homologs in human or any other
organisms to be selected as an attractive target for validation. In the further work, its essentiality in T. brucei
was analyzed.
In the second part of this work, the full-length coding sequence of the pTbCOX gene was cloned and expressed
as a recombinant protein in E. coli BL21 (DE3). The pTbCOX was found most entirely in an insoluble form
inside inclusion bodies. These inclusion bodies were solubilized using 4 molar guanidine hydrochloride and
refolded step-wise by decreasing concentrations of guanidine hydrochloride, and the introduction of redox
agents, i.e. reduced and oxidized glutathione as well as L-arginine. Expressed and refolded pTbCOX was
purified using a Ni-NTA column on ÄKTA-FPLC system. The attempt to demonstrate the cyclooxygenase
activity of the purified pTbCOX by radioisotope thin layer chromatography enzymatic assay using C-14
arachidonic acid as the main substrate to produce prostaglandins was not successful.

111
This result, however, does not necessarily mean that pTbCOX is not a cyclooxygenase because the lack of
enzyme activity might also be due to a refolding failure to produce a correct folded and active protein. In
addition, pTbCOX was obtained in low amounts showing a high tendency to aggregate, as revealed by size
exclusion chromatography and DLS experiments.
In the third and fourth part of this work, the pTbCOX gene was cloned in the pFastBacHTb baculovirus
expression vector to produce properly folded pTbCOX for in vivo crystallization experiments. The protein
was expressed in Sf9 insect cells and produced in vivo crystals which appeared as micro-sized needle-shaped
forms 14 days after transfection using the P3 virus stock. The isolated pTbCOX crystals were identified by
Western blotting and scanning electron microscopy analysis. Isolated pTbCOX crystals showed diffraction
patterns using powder diffraction and a positive signal by second harmonic generation (SONICC) analysis.
These experiments present a preliminary characterization of the pTbCOX crystals before XFEL beam or
MicroED for data collection. Furthermore, pTbCOX in vivo crystals were solubilized using sodium acetate
buffer to assess the stability of the pTbCOX at the level of secondary structure using DLS and CD
spectroscopy methods. This screening revealed optimal condition for treatment by which pTbCOX switch
from large oligomeric aggregates to monodisperse molecules with a radius corresponding to the monomeric
pTbCOX protein. CD spectroscopy of solubilized pTbCOX confirmed stability of the (properly) folded
protein in 12.5 mM sodium acetate buffer at pH 3.6. Therefore, this result may also lead to a new way to
rescue pTbCOX so far insolubly expressed in bacteria, to be easily solubilized by the addition of sodium
acetate during bacteria cell lysis. Thus, this protocol should allow recovering pTbCOX in a soluble and
correctly folded form for biological assays, conventional crystallography trials and structure determination of
pTbCOX.
In the fifth part of this work, RNAi was used to investigate and validate the physiological function of pTbCOX
in the trypanosome SMB cell line. Therefore, a fragment of the pTbCOX gene was cloned into an RNAi
expression vector which contained two opposing promoters and, hence, allowed transcription of double-
stranded RNA upon doxycycline induction. The recombinant vector construct was then transfected into
bloodstream form T. brucei by electroporation. Two different transgenic clones were produced and
quantitative real-time PCR confirmed post-transcriptional silencing of the pTbCOX gene. The level of
TbCOX-mRNA decreased to approximately 50% and 25% respectively for each clone in comparison to the
untreated SMB trypanosomes at various times post induction. Interestingly, the functional analysis of
pTbCOX gene depletion resulted to a progressive decrease of growth, morphological defects including
multiflagellated and big eye phenotypes observed by fluorescence, SEM and TEM microscopy. Furthermore,
analysis of kinetoplast/nucleus progression in the pTbCOX RNAi cell line revealed a partial cell cycle arrest
and failure to initiate cytokinesis.

112
These results are a genetical validation that pTbCOX is essential for cytokinesis and cell morphogenesis in
trypanosome. However, further investigations are needed to reveal the precise cellular processes by which
pTbCOX contribute to maintain the cytokinesis/endocytosis system in T. brucei in balance.
Thus, we hypothesize that pTbCOX might participate in multiple cellular processes in T. brucei cell division
and cell morphogenesis.
In the last part of this work, the pTbCOX gene was cloned in the pCO57 vector. This vector allows the
expression of eGFP fusion to the C-terminus of the desired protein and contains an inducible T7 expression
site, which is regulated by a tetracycline operator. Surprisingly, pTbCOX-eGFP was expressed leaky and
resulted in the death of the transfected cells after four days post transfection. Our data showed, that pTbCOX-
eGFP expression is lethal for bloodstream form parasites and appeared as a single dot near the kinetoplast or
in between kinetoplast and nucleus.
Altogether, this thesis identified a novel hypothetical protein which is essential for the bloodstream
trypanosomes. Thus, pTbCOX could participate in multiple cellular processes in T. brucei cell division and
cell morphogenesis. The elucidation of structure and detailed mechanism of action of this protein might
provide valuable insight, and pTbCOX might become a suitable drug target candidate for future anti-
trypanosomatid therapy.
113
8 Zusammenfassung
Bei den Erregern der afrikanischen Schlafkrankheit handelt es sich um extrazelluläre Protozoen der
Trypanosoma brucei-Gruppe. Rund 50% der sequenzierten Gene sind bislang bezüglich ihrer biochemischen
oder zellulären Eigenschaften nicht charakterisiert und kodieren für hypothetische Proteine ohne bekannte
Homologe im Menschen. Dies eröffnet zahlreiche potentielle Möglichkeiten zur Entwicklung neuer
Medikamente. Eines dieser Proteine, das von Antikörpern gegen ovine Cyclooxygenase im Western Blot
detektiert und mittels Massenspektrometrie identifiziert wurde, sollte hier untersucht werden. Es handelt sich
um eine putative T. brucei Cyclooxygenase (pTbCOX, Tb427.10.13790/Tb927.10.13790) mit einem hohen
Anteil hydrophober Aminosäuren.
Im ersten Teil dieser Arbeit wurde pTbCOX bioinformatisch mittels BLAST/NCBI, Pfam, Proseite, Swiss-
Pro, InterPro, TMHMM, SignalP, Hydrophobizitätsplot und NetPhos untersucht. Hierbei konnten keine
Homologe im Menschen oder in anderen Organismen (außer Kinetoplastida) gefunden werden. Weiterhin
konnten keine spezifischen Domänen, Signalsequenzen oder Membrananker identifiziert werden. Allerdings
konnte gezeigt werden, dass pTbCOX zu 100% identisch zu konservierten hypothetischen Proteinen anderer
Kinetoplasten ist. Damit ist pTbCOX ein potentiell geeigneter Kandidat für die Entwicklung neuer
Medikamente. Im Folgenden sollte untersucht werden, ob das Gen für Trypanosoma brucei essentiell ist.
Im zweiten Teil wurde die kodierende Sequenz von pTbCOX kloniert und in E. coli BL21(DE3) heterolog
exprimiert; das Protein wurde fast ausschließlich in inclusion bodies gefunden. Diese wurden mit
4M Guanidinium-HCl solubilisiert und durch schrittweise Reduktion des Guanidinium-HCl und Zuführung
von Glutathion und L-Arginine renaturiert. pTbCOX wurde danach mittels ÄKTA-FPLC an Ni-NTA-Säulen
aufgereinigt. Es konnte keine Cyclooxygenaseaktivität durch Umsetzung von C-14-markierter
Arachidonsäure zu Prostaglandinen über Dünnschichtchromatographie nachgewiesen werden. Dies könnte
auf eine unzureichende Rückfaltung, die geringe Ausbeute oder die hohe Tendenz zur Aggregation des
Proteins (wie durch Gelpermeationschromatographie und DLS nachgewiesen) zurückzuführen sein.
Im dritten und vierten Teil wird beschrieben, wie pTbCOX in pFastBacHTb kloniert wurde, um nativ
gefaltenes Protein für in vivo Kristallisationsexperimente mit einem Baculovirussystem zu erhalten. Zur
Expression wurden SF9 Insektenzellen genutzt. 14 Tage nach der Infektion mit dem P3 Virusstock wurden
nadelförmige Mikrokristalle erhalten. Diese wurden mittels Western Blot, Rasterelektronenmikroskopie und
SONICC analysiert. Somit wurde eine vorläufige Charakterisierung als Grundlage für
Röntgenkristallstrukturanalysen (XFEL oder MicroED) durchgeführt.

114
Weiterhin wurden pTbCOX Kristalle mit Natriumacetatpuffer solubilisiert und eine Sekundärstrukturanalyse
mit DLS und CD-Spektroskopie durchgeführt. Dabei wurden geeignete Bedingungen gefunden, bei denen
oligomere Proteinaggregate zu monodispersen pTbCOX-Molekülen dissoziieren. Mittels CD-Spektroskopie
konnte gezeigt werden, dass das solubilisierte und renaturierte Protein in 12,5mM Natriumacetatpuffer bei pH
3,6 stabil war. Diese Methode ließe sich zukünftig nutzen, um Proteine, die in inclusion bodies exprimiert
werden, bereits während der Zelllyse durch Zugabe von Natriumacetatpuffer zu lösen.
Im fünften Teil dieser Arbeit wurde die physiologische Funktion von pTbCOX durch RNA Interferenz in
SMB (single marker bloodstream form) Trypanosomen untersucht. Ein Fragment des Gens wurde in einen
Vektor mit zwei gegenläufigen Promotorsequenzen kloniert, so dass doppelsträngige RNA nach Doxycyclin-
Induktion transkribiert wird. SMB Zellen wurden durch Elektroporation transfiziert und zwei transgene Klone
erhalten. Der knockdown von pTbCOX wurde durch qPCR bestätigt. Verglichen mit unbehandelten SMB
Zellen sank das Expressionslevel auf 25-50% (je nach Klon). Die Zellen zeigten ein verlangsamtes Wachstum,
morphologische Defekte mit Multiflagellenbildung, einen big eye Phänotyp und einen partiellen
Zellzyklusarrest.
Diese Ergebnisse bestätigten auf genetischer Ebene die Bedeutung von pTbCOX für Zytokinese und
Morphogenese in Trypanosomen. Weitere Untersuchungen sind nötig, um die zugrundeliegenden
molekularen Mechanismen aufzuklären.
Im letzten Teil wurde pTbCOX in den Vektor pCO57 kloniert, um ein C-terminales eGFP-Fusionsprotein in
SMB-Zellen induzierbar zu exprimieren. Das Fusionsprotein war als solitärer Punkt in der Nähe des
Kinetoplasten (bzw. zwischen Kinetoplast und Zellkern) lokalisierbar. Überraschenderweise war auch die
Überexpression innerhalb von vier Tagen letal.
Zusammenfassend wurde in dieser Arbeit ein hypothetisches Protein identifiziert, das essentiell für Blutform-
Trypanosomen ist. pTbCOX könnte in multiplen zellulären Prozessen (wie Zellteilung und Morphogenese)
eine Rolle spielen. Die Strukturaufklärung und die Aufklärung der molekularen Funktionsweise könnten
vielversprechende Ansätze für die Entwicklung neuer Medikamente gegen afrikanische Schlafkrankheit
liefern.

115
9 Bibliography
Adung’a, V.O., Gadelha, C., and Field, M.C. (2013). Proteomic analysis of clathrin interactions in
trypanosomes reveals dynamic evolution of endocytosis. Traffic 14, 440–457.
Agüero, F., Al-Lazikani, B., Aslett, M., Berriman, M., Buckner, F.S., Campbell, R.K., Carmona, S.,
Carruthers, I.M., Chan, A.E., Chen, F., et al. (2008). Genomic-scale prioritization of drug targets: the TDR
Targets database. Nat. Rev. Drug Discov. 7, 900–907.
Akiyoshi, B., and Gull, K. (2013). Evolutionary cell biology of chromosome segregation: insights from
trypanosomes. Open Biol. 3, 130023.
Allen, C.L., Goulding, D., and Field, M.C. (2003). Clathrin-mediated endocytosis is essential in Trypanosoma
brucei. EMBO J. 22, 4991–5002.
Ancelle, T., Paugam, A., Bourlioux, F., Merad, A., and Vigier, J. P. (1997). Détection des trypanosomes dans
le sang par la technique du quantitative buffy coat (QBC): évaluation expérimentale. Médecine Trop. 57, 245–
248.
Arakawa, T., and Ejima, D. (2014). Refolding technologies for antibody fragments. Antibodies 3, 232–241.
Arora, D., and Khanna, N. (1996). Method for increasing the yield of properly folded recombinant human
gamma interferon from inclusion bodies. J. Biotechnol. 52, 127–133.
Asano, R., Kudo, T., Makabe, K., Tsumoto, K., and Kumagai, I. (2002). Antitumor activity of interleukin-21
prepared by novel refolding procedure from inclusion bodies expressed in Escherichia coli. FEBS Lett. 528,
70–76.
Axford, D., Ji, X., Stuart, D.I., and Sutton, G. (2014). In cellulo structure determination of a novel cypovirus
polyhedrin. Acta Crystallogr. D Biol. Crystallogr. 70, 1435–1441.
Balaña-Fouce, R., and Reguera, R.M. (2007). RNA interference in Trypanosoma brucei: a high-throughput
engine for functional genomics in trypanosomatids? Trends Parasitol. 23, 348–351.
Baneyx, F., and Mujacic, M. (2004). Recombinant protein folding and misfolding in Escherichia coli. Nat.
Biotechnol. 22, 1399–1408.
Barrett, M.P., Boykin, D.W., Brun, R., and Tidwell, R.R. (2007). Human African trypanosomiasis:
pharmacological re-engagement with a neglected disease. Br. J. Pharmacol. 152, 1155–1171.
Barth, T. (2013). Untersuchungen zum Apoptosemechanismus bei Trypanosoma brucei: Effekte von
Staurosporin im Vergleich zu Prostaglandin D2 und die Rolle der Endonuklease G. Universitat Tübingen.
Barty, A., Küpper, J., and Chapman, H.N. (2013). Molecular imaging using X-ray free-electron lasers. Annu.
Rev. Phys. Chem. 64, 415–435.
Batista, M., Kugeratski, F.G., de Paula Lima, C.V., Probst, C.M., Kessler, R.L., de Godoy, L.M., Krieger,
M.A., and Marchini, F.K. (2017). The MAP kinase MAPKLK1 is essential to Trypanosoma brucei
proliferation and regulates proteins involved in mRNA metabolism. J. Proteomics 154, 118–127.
Bell, S., Hansen, S., and Buchner, J. (2002). Refolding and structural characterization of the human p53 tumor
suppressor protein. Biophys. Chem. 96, 243–257.

116
Berriman, M., Ghedin, E., Hertz-Fowler, C., Blandin, G., Renauld, H., Bartholomeu, D.C., Lennard, N.J.,
Caler, E., Hamlin, N.E., Haas, B., et al. (2005). The genome of the African trypanosome Trypanosoma brucei.
Science 309, 416–422.
Bisser, S., Lumbala, C., Nguertoum, E., Kande, V., Flevaud, L., Vatunga, G., Boelaert, M., Büscher, P.,
Josenando, T., Bessell, P.R., et al. (2016). Sensitivity and Specificity of a Prototype Rapid Diagnostic Test for
the Detection of Trypanosoma brucei gambiense Infection: A Multi-centric Prospective Study. PLoS Negl
Trop Dis 10, e0004608.
Blum, J., Nkunku, S., and Burri, C. (2001). Clinical description of encephalopathic syndromes and risk factors
for their occurrence and outcome during melarsoprol treatment of human African trypanosomiasis. Trop. Med.
Int. Health 6, 390–400.
Boudes, M., Garriga, D., and Coulibaly, F. (2014). Reflections on the many facets of protein
microcrystallography. Aust. J. Chem. 67, 1793–1806.
Boudes, M., Garriga, D., Fryga, A., Caradoc-Davies, T., and Coulibaly, F. (2016). A pipeline for structure
determination of in vivo-grown crystals using in cellulo diffraction. Acta Crystallogr. Sect. Struct. Biol. 72,
576–585.
Bradford, M.M. (1976). A rapid and sensitive method for the quantitation of microgram quantities of protein
utilizing the principle of protein-dye binding. Anal. Biochem. 72, 248–254.
Brasseur, A., Rotureau, B., Vermeersch, M., Blisnick, T., Salmon, D., Bastin, P., Pays, E., Vanhamme, L.,
and Pérez-Morga, D. (2013). Trypanosoma brucei FKBP12 differentially controls motility and cytokinesis in
procyclic and bloodstream forms. Eukaryot. Cell 12, 168–181.
Broadhead, R., Dawe, H.R., Farr, H., Griffiths, S., Hart, S.R., Portman, N., Shaw, M.K., Ginger, M.L.,
Gaskell, S.J., McKean, P.G., et al. (2006). Flagellar motility is required for the viability of the bloodstream
trypanosome. Nature 440, 224–227.
Brun, R., Blum, J., Chappuis, F., and Burri, C. (2010). Human african trypanosomiasis. The Lancet 375, 148–
159.
Brun, R., Don, R., Jacobs, R.T., Wang, M.Z., and Barrett, M.P. (2011). Development of novel drugs for human
African trypanosomiasis. Future Microbiol. 6, 677–691.
Buchner, J., and Rudolph, R. (1991). Renaturation, purification and characterization of recombinant Fab-
fragments produced in Escherichia coli. Nat. Biotechnol. 9, 157–162.
Buguet, A. (1999). Is Sleeping Sickness a Orcadian Disorder? The Serotonergic Hypothesis. Chronobiol. Int.
16, 477–489.
Buguet, A., Bourdon, L., Bouteille, B., Cespuglio, R., Vincendeau, P., Radomski, M.W., and Dumas, M.
(2001). The duality of sleeping sickness: focusing on sleep. Sleep Med. Rev. 5, 139–153.
Buguet, A., Bisser, S., Josenando, T., Chapotot, F., and Cespuglio, R. (2005). Sleep structure: a new diagnostic
tool for stage determination in sleeping sickness. Acta Trop. 93, 107–117.
Burgess, R.R. (1996). [12] Purification of overproduced Escherichia coli RNA polymerase σ factors by
solubilizing inclusion bodies and refolding from Sarkosyl. Methods Enzymol. 273, 145–149.
Burgess, R.R. (2009). Refolding solubilized inclusion body proteins. Methods Enzymol. 463, 259–282.

117
Caljon, G., Van Reet, N., De Trez, C., Vermeersch, M., Pérez-Morga, D., and Van Den Abbeele, J. (2016).
The Dermis as a Delivery Site of Trypanosoma brucei for Tsetse Flies. PLoS Pathog. 12, e1005744.
Capewell, P., Cren-Travaillé, C., Marchesi, F., Johnston, P., Clucas, C., Benson, R.A., Gorman, T.-A., Calvo-
Alvarez, E., Crouzols, A., Jouvion, G., et al. (2016). The skin is a significant but overlooked anatomical
reservoir for vector-borne African trypanosomes. eLife 5, e17716.
Casas-Sánchez, A., and Acosta-Serrano, Á. (2016). Skin deep. eLife 5, e21506.
Chapman, H.N., Fromme, P., Barty, A., White, T.A., Kirian, R.A., Aquila, A., Hunter, M.S., Schulz, J.,
DePonte, D.P., Weierstall, U., et al. (2011). Femtosecond X-ray protein nanocrystallography. Nature 470, 73–
77.
Chappuis, F., Loutan, L., Simarro, P., Lejon, V., and Büscher, P. (2005). Options for field diagnosis of human
African trypanosomiasis. Clin. Microbiol. Rev. 18, 133–146.
Checchi, F., Filipe, J.A., Haydon, D.T., Chandramohan, D., and Chappuis, F. (2008). Estimates of the duration
of the early and late stage of gambiense sleeping sickness. BMC Infect. Dis. 8, 1.
Clayton, C., and Shapira, M. (2007). Post-transcriptional regulation of gene expression in trypanosomes and
leishmanias. Mol. Biochem. Parasitol. 156, 93–101.
Clayton, C., Adams, M., Almeida, R., Baltz, T., Barrett, M., Bastien, P., Belli, S., Beverley, S., Biteau, N.,
Blackwell, J., et al. (1998). Genetic nomenclature for Trypanosoma and Leishmania. Mol. Biochem. Parasitol.
97, 221–224.
Croft, S.L. (2016). Neglected tropical diseases in the genomics era: re-evaluating the impact of new drugs and
mass drug administration. Genome Biol. 17, 1.
Cross, G.A.M. (1975). Identification, purification and properties of clone-specific glycoprotein antigens
constituting the surface coat of Trypanosoma brucei. Parasitology 71, 393–417.
Deborggraeve, S., and Büscher, P. (2010). Molecular diagnostics for sleeping sickness: what is the benefit for
the patient? Lancet Infect. Dis. 10, 433–439.
Deborggraeve, S., and Büscher, P. (2012). Recent progress in molecular diagnosis of sleeping sickness. Expert
Rev. Mol. Diagn. 12, 719–730.
Deller, M.C., Kong, L., and Rupp, B. (2016). Protein stability: a crystallographer’s perspective. Acta
Crystallogr. Sect. F Struct. Biol. Commun. 72, 72–95.
Dey, I., Keller, K., Belley, A., and Chadee, K. (2003). Identification and characterization of a cyclooxygenase-
like enzyme from Entamoeba histolytica. Proc. Natl. Acad. Sci. 100, 13561–13566.
Ding, D., Zhao, Y., Meng, Q., Xie, D., Nare, B., Chen, D., Bacchi, C.J., Yarlett, N., Zhang, Y.-K., Hernandez,
V., et al. (2010). Discovery of novel benzoxaborole-based potent antitrypanosomal agents. ACS Med. Chem.
Lett. 1, 165–169.
Djikeng, A., Shi, H., Tschudi, C., and Ullu, E. (2001). RNA interference in Trypanosoma brucei: cloning of
small interfering RNAs provides evidence for retroposon-derived 24–26-nucleotide RNAs. Rna 7, 1522–1530.
Donelson, J.E. (2003). Antigenic variation and the African trypanosome genome. Acta Trop. 85, 391–404.

118
Doye, J.P., and Poon, W.C. (2006). Protein crystallization in vivo. Curr. Opin. Colloid Interface Sci. 11, 40–
46.
Duszenko, M., Figarella, K., Macleod, E.T., and Welburn, S.C. (2006). Death of a trypanosome: a selfish
altruism. Trends Parasitol. 22, 536–542.
Duszenko, M., Redecke, L., Mudogo, C.N., Sommer, B.P., Mogk, S., Oberthuer, D., and Betzel, C. (2015). In
vivo protein crystallization in combination with highly brilliant radiation sources offers novel opportunities
for the structural analysis of post-translationally modified eukaryotic proteins. Acta Crystallogr. Sect. F Struct.
Biol. Commun. 71, 929–937.
Enanga, B., Burchmore, R.J.S., Stewart, M.L., and Barrett, M.P. (2002). Sleeping sickness and the brain. Cell.
Mol. Life Sci. CMLS 59, 845–858.
Engstler, M., Thilo, L., Weise, F., Grünfelder, C.G., Schwarz, H., Boshart, M., and Overath, P. (2004).
Kinetics of endocytosis and recycling of the GPI-anchored variant surface glycoprotein in Trypanosoma
brucei. J. Cell Sci. 117, 1105–1115.
Ersfeld, K. (2011). Nuclear architecture, genome and chromatin organisation in Trypanosoma brucei. Res.
Microbiol. 162, 626–636.
Evdokimov, A.G., Moshiri, F., Sturman, E.J., Rydel, T.J., Zheng, M., Seale, J.W., and Franklin, S. (2014).
Structure of the full-length insecticidal protein Cry1Ac reveals intriguing details of toxin packaging into in
vivo formed crystals. Protein Sci. Publ. Protein Soc. 23, 1491–1497.
Fairlamb, A.H. (2003). Chemotherapy of human African trypanosomiasis: current and future prospects.
Trends Parasitol. 19, 488–494.
Fairlamb, A.H., Henderson, G.B., and Cerami, A. (1989). Trypanothione is the primary target for arsenical
drugs against African trypanosomes. Proc. Natl. Acad. Sci. 86, 2607–2611.
Fevre, E.M., Wissmann, B. v, Welburn, S.C., and Lutumba, P. (2008). The burden of human African
trypanosomiasis. PLoS Negl Trop Dis 2, e333.
Field, M.C., and Carrington, M. (2009). The trypanosome flagellar pocket. Nat. Rev. Microbiol. 7, 775–786.
Field, M.C., Allen, C.L., Dhir, V., Goulding, D., Hall, B.S., Morgan, G.W., Veazey, P., and Engstler, M.
(2004). New approaches to the microscopic imaging of Trypanosoma brucei. Microsc. Microanal. Off. J.
Microsc. Soc. Am. Microbeam Anal. Soc. Microsc. Soc. Can. 10, 621–636.
Field, M.C., Horn, D., Fairlamb, A.H., Ferguson, M.A., Gray, D.W., Read, K.D., De Rycker, M., Torrie, L.S.,
Wyatt, P.G., Wyllie, S., et al. (2017). Anti-trypanosomatid drug discovery: an ongoing challenge and a
continuing need. Nat. Rev. Microbiol. 15, 217–231.
Figarella, K., Rawer, M., Uzcategui, N.L., Kubata, B.K., Lauber, K., Madeo, F., Wesselborg, S., and
Duszenko, M. (2005). Prostaglandin D2 induces programmed cell death in Trypanosoma brucei bloodstream
form. Cell Death Differ. 12, 335–346.
Figarella, K., Uzcategui, N.L., Beck, A., Schoenfeld, C., Kubata, B.K., Lang, F., and Duszenko, M. (2006).
Prostaglandin-induced programmed cell death in Trypanosoma brucei involves oxidative stress. Cell Death
Differ. 13, 1802–1814.
119
Fire, A., Xu, S., Montgomery, M.K., Kostas, S.A., Driver, S.E., and Mello, C.C. (1998). Potent and specific
genetic interference by double-stranded RNA in Caenorhabditis elegans. Nature 391, 806–811.
Franco, J.R., Simarro, P.P., Diarra, A., and Jannin, J.G. (2014). Epidemiology of human African
trypanosomiasis. Clin. Epidemiol. 6, 257.
Fromme, P. (2015). XFELs open a new era in structural chemical biology. Nat. Chem. Biol. 11, 895–899.
Gallat, F.-X., Matsugaki, N., Coussens, N.P., Yagi, K.J., Boudes, M., Higashi, T., Tsuji, D., Tatano, Y.,
Suzuki, M., Mizohata, E., et al. (2014). In vivo crystallography at X-ray free-electron lasers: the next
generation of structural biology? Philos. Trans. R. Soc. Lond. B. Biol. Sci. 369, 20130497.
Gati, C., Bourenkov, G., Klinge, M., Rehders, D., Stellato, F., Oberthür, D., Yefanov, O., Sommer, B.P.,
Mogk, S., Duszenko, M., et al. (2014a). Serial crystallography on in vivo grown microcrystals using
synchrotron radiation. IUCrJ 1, 87–94.
Gati, C., Bourenkov, G., Klinge, M., Rehders, D., Stellato, F., Oberthür, D., Yefanov, O., Sommer, B.P.,
Mogk, S., Duszenko, M., et al. (2014b). Serial crystallography on in vivo grown microcrystals using
synchrotron radiation. IUCrJ 1, 87–94.
Grab, D.J., and Kennedy, P.G.E. (2008). Traversal of human and animal trypanosomes across the blood-brain
barrier. J. Neurovirol. 14, 344–351.
Hamm, B., Schindler, A., Mecke, D., and Duszenko, M. (1990). Differentiation of Trypanosoma brucei
bloodstream trypomastigotes from long slender to short stumpy-like forms in axenic culture. Mol. Biochem.
Parasitol. 40, 13–22.
Hasegawa, H., Wendling, J., He, F., Trilisky, E., Stevenson, R., Franey, H., Kinderman, F., Li, G., Piedmonte,
D.M., Osslund, T., et al. (2011). In vivo crystallization of human IgG in the endoplasmic reticulum of
engineered Chinese hamster ovary (CHO) cells. J. Biol. Chem. 286, 19917–19931.
Hayaishi, O. (2000). Molecular mechanisms of sleep–wake regulation: a role of prostaglandin D2. Philos.
Trans. R. Soc. Lond. B Biol. Sci. 355, 275–280.
Hayaishi, O. (2002). Invited Review: Molecular genetic studies on sleep-wake regulation, with special
emphasis on the prostaglandin D2 system. J. Appl. Physiol. 92, 863–868.
Hayashida, K., Kajino, K., Hachaambwa, L., Namangala, B., and Sugimoto, C. (2015). Direct blood dry
LAMP: a rapid, stable, and easy diagnostic tool for Human African Trypanosomiasis. PLoS Negl Trop Dis 9,
e0003578.
Hendry, K.A., and Vickerman, K. (1988). The requirement for epimastigote attachment during division and
metacyclogenesis in Trypanosoma congolense. Parasitol. Res. 74, 403–408.
Holton, J.M., and Frankel, K.A. (2010). The minimum crystal size needed for a complete diffraction data set.
Acta Crystallogr. D Biol. Crystallogr. 66, 393–408.
Hotez, P.J., and Kamath, A. (2009). Neglected tropical diseases in sub-saharan Africa: review of their
prevalence, distribution, and disease burden. PLoS Negl Trop Dis 3, e412.
Hutchings, N.R., Donelson, J.E., and Hill, K.L. (2002). Trypanin is a cytoskeletal linker protein and is required
for cell motility in African trypanosomes. J. Cell Biol. 156, 867–877.

120
Ito, L., Shiraki, K., Matsuura, T., Okumura, M., Hasegawa, K., Baba, S., Yamaguchi, H., and Kumasaka, T.
(2011). High-resolution X-ray analysis reveals binding of arginine to aromatic residues of lysozyme surface:
implication of suppression of protein aggregation by arginine. Protein Eng. Des. Sel. 24, 269–274.
Jacobs, R.T., Nare, B., Wring, S.A., Orr, M.D., Chen, D., Sligar, J.M., Jenks, M.X., Noe, R.A., Bowling, T.S.,
Mercer, L.T., et al. (2011). SCYX-7158, an orally-active benzoxaborole for the treatment of stage 2 human
African trypanosomiasis. PLoS Negl Trop Dis 5, e1151.
Jakobi, A.J., Passon, D.M., Knoops, K., Stellato, F., Liang, M., White, T.A., Seine, T., Messerschmidt, M.,
Chapman, H.N., and Wilmanns, M. (2016). In cellulo serial crystallography of alcohol oxidase crystals inside
yeast cells. IUCrJ 3, 88–95.
Jones, A.J., and Avery, V.M. (2015). Future treatment options for human African trypanosomiasis. Expert
Rev. Anti Infect. Ther. 13, 1429–1432.
Jones, D.C., Foth, B.J., Urbaniak, M.D., Patterson, S., Ong, H.B., Berriman, M., and Fairlamb, A.H. (2015).
Genomic and Proteomic Studies on the Mode of Action of Oxaboroles against the African Trypanosome.
PLoS Negl Trop Dis 9, e0004299.
Kaiser, M., Bray, M.A., Cal, M., Trunz, B.B., Torreele, E., and Brun, R. (2011). Antitrypanosomal activity of
fexinidazole, a new oral nitroimidazole drug candidate for treatment of sleeping sickness. Antimicrob. Agents
Chemother. 55, 5602–5608.
Kang, H.J., Lee, C., and Drew, D. (2013). Breaking the barriers in membrane protein crystallography. Int. J.
Biochem. Cell Biol. 45, 636–644.
Kapuscinski, J. (1995). DAPI: a DNA-specific fluorescent probe. Biotech. Histochem. 70, 220–233.
Keating, C. (2014). Ken Warren and the Rockefeller Foundation’s Great Neglected Diseases Network, 1978–
1988: The Transformation of Tropical and Global Medicine. Mol. Med. 20, S24–S30.
Kennedy, P.G. (2008). The continuing problem of human African trypanosomiasis (sleeping sickness). Ann.
Neurol. 64, 116–126.
Kennedy, P.G. (2013). Clinical features, diagnosis, and treatment of human African trypanosomiasis (sleeping
sickness). Lancet Neurol. 12, 186–194.
Kirian, R.A., Wang, X., Weierstall, U., Schmidt, K.E., Spence, J.C.H., Hunter, M., Fromme, P., White, T.,
Chapman, H.N., and Holton, J. (2010). Femtosecond protein nanocrystallography-data analysis methods. Opt.
Express 18, 5713–5723.
Kirian, R.A., White, T.A., Holton, J.M., Chapman, H.N., Fromme, P., Barty, A., Lomb, L., Aquila, A., Maia,
F.R.N.C., Martin, A.V., et al. (2011). Structure-factor analysis of femtosecond microdiffraction patterns from
protein nanocrystals. Acta Crystallogr. A 67, 131–140.
Kohl, L., Sherwin, T., and Gull, K. (1999). Assembly of the paraflagellar rod and the flagellum attachment
zone complex during the Trypanosoma brucei cell cycle. J. Eukaryot. Microbiol. 46, 105–109.
Kolev, N.G., Tschudi, C., and Ullu, E. (2011). RNA interference in protozoan parasites: achievements and
challenges. Eukaryot. Cell 10, 1156–1163.

121
Koopmann, R., Cupelli, K., Redecke, L., Nass, K., Deponte, D.P., White, T.A., Stellato, F., Rehders, D.,
Liang, M., Andreasson, J., et al. (2012). In vivo protein crystallization opens new routes in structural biology.
Nat. Methods 9, 259–262.
Kristensson, K., Nyg\a ard, M., Bertini, G., and Bentivoglio, M. (2010). African trypanosome infections of
the nervous system: parasite entry and effects on sleep and synaptic functions. Prog. Neurobiol. 91, 152–171.
Kubata, B.K., Duszenko, M., Kabututu, Z., Rawer, M., Szallies, A., Fujimori, K., Inui, T., Nozaki, T.,
Yamashita, K., Horii, T., et al. (2000). Identification of a novel prostaglandin F2α synthase in Trypanosoma
brucei. J. Exp. Med. 192, 1327–1338.
Kubata, B.K., Duszenko, M., Martin, K.S., and Urade, Y. (2007). Molecular basis for prostaglandin
production in hosts and parasites. Trends Parasitol. 23, 325–331.
Lebendiker, M., and Danieli, T. (2014). Production of prone-to-aggregate proteins. FEBS Lett. 588, 236–246.
Lejon, V., Büscher, P., Sema, N.H., Magnus, E., and Van Meirvenne, N. (1998). Human African
trypanosomiasis: a latex agglutination field test for quantifying IgM in cerebrospinal fluid. Bull. World Health
Organ. 76, 553.
Lin, W.-J., and Traugh, J.A. (1993). Renaturation of casein kinase II from recombinant subunits produced in
Escherichia coli: purification and characterization of the reconstituted holoenzyme. Protein Expr. Purif. 4,
256–264.
Liu, S., Hattne, J., Reyes, F.E., Sanchez-Martinez, S., Jason de la Cruz, M., Shi, D., and Gonen, T. (2016).
Atomic resolution structure determination by the cryo-EM method MicroED. Protein Sci. Publ. Protein Soc.
Lund, A.H., Duch, M., and Pedersen, F.S. (1996). Increased cloning efficiency by temperature-cycle ligation.
Nucleic Acids Res. 24, 800–801.
Lutumba, P., Robays, J., Miaka, C., Kande, V., Mumba, D., Büscher, P., Dujardin, B., and Boelaert, M. (2006).
[Validity, cost and feasibility of the mAECT and CTC confirmation tests after diagnosis of African of sleeping
sickness]. Trop. Med. Int. Health TM IH 11, 470–478.
Lutumba, P., Meheus, F., Robays, J., Miaka, C., Kande, V., Büscher, P., Dujardin, B., and Boelaert, M. (2007).
Cost-effectiveness of algorithms for confirmation test of human African trypanosomiasis.
Mande, S.C., and Sobhia, M.E. (2000). Structural characterization of protein–denaturant interactions: crystal
structures of hen egg-white lysozyme in complex with DMSO and guanidinium chloride. Protein Eng. 13,
133–141.
Manna, P.T., Obado, S.O., Boehm, C., Gadelha, C., Sali, A., Chait, B.T., Rout, M.P., and Field, M.C. (2017).
Lineage-specific proteins essential for endocytosis in trypanosomes. J Cell Sci 130, 1379–1392.
Marchini, F.K., de Godoy, L.M.F., Batista, M., Kugeratski, F.G., and Krieger, M.A. (2014). Towards the
Phosphoproteome of Trypanosomatids. In Proteins and Proteomics of Leishmania and Trypanosoma,
(Springer), pp. 351–378.
Matsuoka, T., Hamada, H., Matsumoto, K., and Shiraki, K. (2009). Indispensable structure of solution
additives to prevent inactivation of lysozyme for heating and refolding. Biotechnol. Prog. 25, 1515–1524.
Matthews, K.R. (2005). The developmental cell biology of Trypanosoma brucei. J. Cell Sci. 118, 283–290.

122
McAllaster, M.R., Ikeda, K.N., Lozano-Núñez, A., Anrather, D., Unterwurzacher, V., Gossenreiter, T., Perry,
J.A., Crickley, R., Mercadante, C.J., Vaughan, S., et al. (2015). Proteomic identification of novel cytoskeletal
proteins associated with TbPLK, an essential regulator of cell morphogenesis in Trypanosoma brucei. Mol.
Biol. Cell 26, 3013–3029.
McPherson, A., and Gavira, J.A. (2014). Introduction to protein crystallization. Acta Crystallogr. Sect. F
Struct. Biol. Commun. 70, 2–20.
Mogk, S., Meiwes, A., Boßelmann, C.M., Wolburg, H., and Duszenko, M. (2014). The lane to the brain: how
African trypanosomes invade the CNS. Trends Parasitol. 30, 470–477.
Mogk, S., Boßelmann, C.M., Mudogo, C.N., Stein, J., Wolburg, H., and Duszenko, M. (2016). African
trypanosomes and brain infection - the unsolved question. Biol. Rev. Camb. Philos. Soc.
Morrison, L.J., Majiwa, P., Read, A.F., and Barry, J.D. (2005). Probabilistic order in antigenic variation of
Trypanosoma brucei. Int. J. Parasitol. 35, 961–972.
Morriswood, B., and Schmidt, K. (2015). A MORN Repeat Protein Facilitates Protein Entry into the Flagellar
Pocket of Trypanosoma brucei. Eukaryot. Cell 14, 1081–1093.
Morriswood, B., Havlicek, K., Demmel, L., Yavuz, S., Sealey-Cardona, M., Vidilaseris, K., Anrather, D.,
Kostan, J., Djinovic-Carugo, K., Roux, K.J., et al. (2013). Novel bilobe components in Trypanosoma brucei
identified using proximity-dependent biotinylation. Eukaryot. Cell 12, 356–367.
Motyka, S.A., and Englund, P.T. (2004). RNA interference for analysis of gene function in trypanosomatids.
Curr. Opin. Microbiol. 7, 362–368.
Mugnier, M.R., Stebbins, C.E., and Papavasiliou, F.N. (2016). Masters of disguise: antigenic variation and
the VSG coat in Trypanosoma brucei. PLoS Pathog 12, e1005784.
Mulenga, C., Mhlanga, J.D., Kristensson, K., and Robertson, B. (2001). Trypanosoma brucei brucei crosses
the blood-brain barrier while tight junction proteins are preserved in a rat chronic disease model. Neuropathol.
Appl. Neurobiol. 27, 77–85.
Muniyappan, S., Kim, S.O., and Ihee, H. (2015). Recent Advances and Futur e Prospects of Serial
Crystallography using XFEL and Synchrotro n X-Ray Sources. Bio Des. 3, 98–110.
Nagle, A.S., Khare, S., Kumar, A.B., Supek, F., Buchynskyy, A., Mathison, C.J., Chennamaneni, N.K.,
Pendem, N., Buckner, F.S., Gelb, M.H., et al. (2014). Recent developments in drug discovery for leishmaniasis
and human African trypanosomiasis. Chem. Rev. 114, 11305–11347.
Nannenga, B.L., Shi, D., Leslie, A.G.W., and Gonen, T. (2014a). High-resolution structure determination by
continuous-rotation data collection in MicroED. Nat. Methods 11, 927–930.
Nannenga, B.L., Shi, D., Hattne, J., Reyes, F.E., and Gonen, T. (2014b). Structure of catalase determined by
MicroED. eLife 3, e03600.
Nass, K., Foucar, L., Barends, T.R.M., Hartmann, E., Botha, S., Shoeman, R.L., Doak, R.B., Alonso-Mori,
R., Aquila, A., Bajt, S., et al. (2015). Indications of radiation damage in ferredoxin microcrystals using high-
intensity X-FEL beams. J. Synchrotron Radiat. 22, 225–238.

123
Nett, I.R., Martin, D.M., Miranda-Saavedra, D., Lamont, D., Barber, J.D., Mehlert, A., and Ferguson, M.A.
(2009). The phosphoproteome of bloodstream form Trypanosoma brucei, causative agent of African sleeping
sickness. Mol. Cell. Proteomics 8, 1527–1538.
Neutze, R., and Moffat, K. (2012). Time-resolved structural studies at synchrotrons and X-ray free electron
lasers: opportunities and challenges. Curr. Opin. Struct. Biol. 22, 651–659.
Ngo, H., Tschudi, C., Gull, K., and Ullu, E. (1998). Double-stranded RNA induces mRNA degradation in
Trypanosoma brucei. Proc. Natl. Acad. Sci. 95, 14687–14692.
Odiit, M., Kansiime, F., and Enyaru, J.C. (1997). Duration of symptoms and case fatality of sleeping sickness
caused by Trypanosoma brucei rhodesiense in Tororo, Uganda. East Afr. Med. J. 74, 792–795.
Okano, Y., Inoue, T., Kubata, B.K., Kabututu, Z., Urade, Y., Matsumura, H., and Kai, Y. (2002).
Crystallization and Preliminary X-Ray Crystallographic Studies of Trypanosoma brucei Prostaglandin F2α
Synthase1. J. Biochem. (Tokyo) 132.
Olego-Fernandez, S., Vaughan, S., Shaw, M.K., Gull, K., and Ginger, M.L. (2009). Cell morphogenesis of
Trypanosoma brucei requires the paralogous, differentially expressed calpain-related proteins CAP5. 5 and
CAP5. 5V. Protist 160, 576–590.
Ooi, C.-P., and Bastin, P. (2013). More than meets the eye: understanding Trypanosoma brucei morphology
in the tsetse. Front. Cell. Infect. Microbiol. 3, 71.
Patrick, K.L., Shi, H., Kolev, N.G., Ersfeld, K., Tschudi, C., and Ullu, E. (2009). Distinct and overlapping
roles for two Dicer-like proteins in the RNA interference pathways of the ancient eukaryote Trypanosoma
brucei. Proc. Natl. Acad. Sci. U. S. A. 106, 17933–17938.
Pentreath, V.W., Rees, K., Owolabi, O.A., Philip, K.A., and Doua, F. (1990). The somnogenic T lymphocyte
suppressor prostaglandin D2 is selectively elevated in cerebrospinal fluid of advanced sleeping sickness
patients. Trans. R. Soc. Trop. Med. Hyg. 84, 795–799.
Pfaffl, M.W. (2001). A new mathematical model for relative quantification in real-time RT–PCR. Nucleic
Acids Res. 29, e45–e45.
Pfaffl, M.W. (2004). Real-time RT-PCR: neue Ansätze zur exakten mRNA Quantifizierung. BIOspektrum 1,
92–5.
Priotto, G., Kasparian, S., Mutombo, W., Ngouama, D., Ghorashian, S., Arnold, U., Ghabri, S., Baudin, E.,
Buard, V., Kazadi-Kyanza, S., et al. (2009). Nifurtimox-eflornithine combination therapy for second-stage
African Trypanosoma brucei gambiense trypanosomiasis: a multicentre, randomised, phase III, non-inferiority
trial. The Lancet 374, 56–64.
Ralston, K.S., and Hill, K.L. (2008). The flagellum of Trypanosoma brucei: new tricks from an old dog. Int.
J. Parasitol. 38, 869–884.
Rawer, M. (2004). Prostaglandinstoffwechsel in Trypanosoma brucei: Klonierung und Characterizierung der
Prostaglandin F2α Synthase und der PGD2 induzierte Zelltod. Universität Tübingen.
Redecke, L., Nass, K., DePonte, D.P., White, T.A., Rehders, D., Barty, A., Stellato, F., Liang, M., Barends,
T.R.M., Boutet, S., et al. (2013a). Natively inhibited Trypanosoma brucei cathepsin B structure determined
by using an X-ray laser. Science 339, 227–230.

124
Redecke, L., Nass, K., DePonte, D.P., White, T.A., Rehders, D., Barty, A., Stellato, F., Liang, M., Barends,
T.R., Boutet, S., et al. (2013b). Natively inhibited Trypanosoma brucei cathepsin B structure determined by
using an X-ray laser. Science 339, 227–230.
Robinson, D.R., Sherwin, T., Ploubidou, A., Byard, E.H., and Gull, K. (1995). Microtubule polarity and
dynamics in the control of organelle positioning, segregation, and cytokinesis in the trypanosome cell cycle.
J. Cell Biol. 128, 1163–1172.
Roditi, I., Schwarz, H., Pearson, T.W., Beecroft, R.P., Liu, M.K., Richardson, J.P., Bühring, H.J., Pleiss, J.,
Bülow, R., and Williams, R.O. (1989). Procyclin gene expression and loss of the variant surface glycoprotein
during differentiation of Trypanosoma brucei. J. Cell Biol. 108, 737–746.
Rodriguez, J.A., Ivanova, M.I., Sawaya, M.R., Cascio, D., Reyes, F.E., Shi, D., Sangwan, S., Guenther, E.L.,
Johnson, L.M., Zhang, M., et al. (2015). Structure of the toxic core of α-synuclein from invisible crystals.
Nature 525, 486–490.
Rosano, G.L., and Ceccarelli, E.A. (2014). Recombinant protein expression in Escherichia coli: advances and
challenges. Recomb. Protein Expr. Microb. Syst. 7.
Samuel, D., Ganesh, G., Yang, P.-W., Chang, M.-M., Wang, S.-L., Hwang, K.-C., Yu, C., Jayaraman, G.,
Kumar, T.K.S., Trivedi, V.D., et al. (2000). Proline inhibits aggregation during protein refolding. Protein Sci.
9, 344–352.
Sanishvili, R., Yoder, D.W., Pothineni, S.B., Rosenbaum, G., Xu, S., Vogt, S., Stepanov, S., Makarov, O.A.,
Corcoran, S., Benn, R., et al. (2011). Radiation damage in protein crystals is reduced with a micron-sized X-
ray beam. Proc. Natl. Acad. Sci. U. S. A. 108, 6127–6132.
Sawaya, M.R., Cascio, D., Gingery, M., Rodriguez, J., Goldschmidt, L., Colletier, J.-P., Messerschmidt,
M.M., Boutet, S., Koglin, J.E., Williams, G.J., et al. (2014). Protein crystal structure obtained at 2.9 Å
resolution from injecting bacterial cells into an X-ray free-electron laser beam. Proc. Natl. Acad. Sci. U. S. A.
111, 12769–12774.
Sawaya, M.R., Rodriguez, J., Cascio, D., Collazo, M.J., Shi, D., Reyes, F.E., Hattne, J., Gonen, T., and
Eisenberg, D.S. (2016). Ab initio structure determination from prion nanocrystals at atomic resolution by
MicroED. Proc. Natl. Acad. Sci. U. S. A. 113, 11232–11236.
Schlichting, I., and Miao, J. (2012). Emerging opportunities in structural biology with X-ray free-electron
lasers. Curr. Opin. Struct. Biol. 22, 613–626.
Schönherr, R., Klinge, M., Rudolph, J.M., Fita, K., Rehders, D., Lübber, F., Schneegans, S., Majoul, I.V.,
Duszenko, M., Betzel, C., et al. (2015). Real-time investigation of dynamic protein crystallization in living
cells. Struct. Dyn. Melville N 2, 041712.
Sherwin, T., and Gull, K. (1989). Visualization of detyrosination along single microtubules reveal s novel
mechanisms of assembly during cytoskeletal duplication in trypanosomes. Cell 57, 211–221.
Shi, D., Nannenga, B.L., Iadanza, M.G., and Gonen, T. (2013). Three-dimensional electron crystallography
of protein microcrystals. eLife 2, e01345.
Shi, D., Nannenga, B.L., de la Cruz, M.J., Liu, J., Sawtelle, S., Calero, G., Reyes, F.E., Hattne, J., and Gonen,
T. (2016). The collection of MicroED data for macromolecular crystallography. Nat. Protoc. 11, 895–904.

125
Shi, H., Tschudi, C., and Ullu, E. (2006). Functional replacement of Trypanosoma brucei Argonaute by the
human slicer Argonaute2. RNA N. Y. N 12, 943–947.
Sliz, P., Harrison, S.C., and Rosenbaum, G. (2003). How does radiation damage in protein crystals depend on
X-ray dose? Struct. Lond. Engl. 1993 11, 13–19.
Stein, J., Mogk, S., Mudogo, C.N., Sommer, B.P., Scholze, M., Meiwes, A., Huber, M., Gray, A., and
Duszenko, M. (2014). Drug development against sleeping sickness: old wine in new bottles? Curr. Med.
Chem. 21, 1713–1727.
Sternberg, J.M., Gierliński, M., Biéler, S., Ferguson, M.A., and Ndung’u, J.M. (2014). Evaluation of the
diagnostic accuracy of prototype rapid tests for human African trypanosomiasis. PLoS Negl Trop Dis 8, e3373.
Steverding, D. (2008). The history of African trypanosomiasis. Parasit. Vectors 1, 1.
Sudarshi, D., Lawrence, S., Pickrell, W.O., Eligar, V., Walters, R., Quaderi, S., Walker, A., Capewell, P.,
Clucas, C., Vincent, A., et al. (2014). Human African trypanosomiasis presenting at least 29 years after
infection—what can this teach us about the pathogenesis and control of this neglected tropical disease? PLoS
Negl Trop Dis 8, e3349.
Tarral, A., Blesson, S., Mordt, O.V., Torreele, E., Sassella, D., Bray, M.A., Hovsepian, L., Evene, E., Gualano,
V., Felices, M., et al. (2014). Determination of an optimal dosing regimen for fexinidazole, a novel oral drug
for the treatment of human African trypanosomiasis: first-in-human studies. Clin. Pharmacokinet. 53, 565–
580.
Torreele, E., Trunz, B.B., Tweats, D., Kaiser, M., Brun, R., Mazue, G., Bray, M.A., and Pecoul, B. (2010).
Fexinidazole–a new oral nitroimidazole drug candidate entering clinical development for the treatment of
sleeping sickness. PLoS Negl Trop Dis 4, e923.
Trindade, S., Rijo-Ferreira, F., Carvalho, T., Pinto-Neves, D., Guegan, F., Aresta-Branco, F., Bento, F.,
Young, S.A., Pinto, A., Van Den Abbeele, J., et al. (2016). Trypanosoma brucei Parasites Occupy and
Functionally Adapt to the Adipose Tissue in Mice. Cell Host Microbe 19, 837–848.
Truc, P., Jamonneau, V., N’Guessan, P., Diallo, P.B., and Garcia, A. (1998). Parasitological diagnosis of
human African trypanosomiasis: a comparison of the QBC® and miniature anion-exchange centrifugation
techniques. Trans. R. Soc. Trop. Med. Hyg. 92, 288–289.
Tschudi, C., Djikeng, A., Shi, H., and Ullu, E. (2003). In vivo analysis of the RNA interference mechanism
in Trypanosoma brucei. Methods San Diego Calif 30, 304–312.
Tsumoto, K., Shinoki, K., Kondo, H., Uchikawa, M., Juji, T., and Kumagai, I. (1998). Highly efficient
recovery of functional single-chain Fv fragments from inclusion bodies overexpressed in Escherichia coli by
controlled introduction of oxidizing reagent—application to a human single-chain Fv fragment. J. Immunol.
Methods 219, 119–129.
Turner, C.M. (1999). Antigenic variation in Trypanosoma brucei infections: an holistic view. J Cell Sci 112,
3187–3192.
Ullu, E., Djikeng, A., Shi, H., and Tschudi, C. (2002). RNA interference: advances and questions. Philos.
Trans. R. Soc. Lond. B. Biol. Sci. 357, 65–70.
Urade, Y., and Hayaishi, O. (2011). Prostaglandin D 2 and sleep/wake regulation. Sleep Med. Rev. 15, 411–
418.

126
Urbaniak, M.D., Martin, D.M., and Ferguson, M.A. (2013). Global quantitative SILAC phosphoproteomics
reveals differential phosphorylation is widespread between the procyclic and bloodstream form lifecycle
stages of Trypanosoma brucei. J. Proteome Res. 12, 2233.
Vassella, E., Reuner, B., Yutzy, B., and Boshart, M. (1997). Differentiation of African trypanosomes is
controlled by a density sensing mechanism which signals cell cycle arrest via the cAMP pathway. J. Cell Sci.
110 ( Pt 21), 2661–2671.
Vaughan, S., and Gull, K. (2003). The trypanosome flagellum. J. Cell Sci. 116, 757–759.
Vaughan, S., Kohl, L., Ngai, I., Wheeler, R.J., and Gull, K. (2008). A repetitive protein essential for the
flagellum attachment zone filament structure and function in Trypanosoma brucei. Protist 159, 127–136.
Vickerman, K., Tetley, L., Hendry, K.A., and Turner, C.M. (1988). Biology of African trypanosomes in the
tsetse fly. Biol. Cell 64, 109–119.
Walls, D., and Loughran, S.T. (2011). Tagging recombinant proteins to enhance solubility and aid purification.
Protein Chromatogr. Methods Protoc. 151–175.
Wampler, R.D., Kissick, D.J., Dehen, C.J., Gualtieri, E.J., Grey, J.L., Wang, H.-F., Thompson, D.H., Cheng,
J.-X., and Simpson, G.J. (2008). Selective detection of protein crystals by second harmonic microscopy. J.
Am. Chem. Soc. 130, 14076–14077.
Wolburg, H., Mogk, S., Acker, S., Frey, C., Meinert, M., Schönfeld, C., Lazarus, M., Urade, Y., Kubata, B.K.,
and Duszenko, M. (2012). Late stage infection in sleeping sickness. PloS One 7, e34304.
Woo, P.T.K., and others (1970). The haematocrit centrifuge technique for the diagnosis of African
trypanosomiasis. Acta Trop. 27, 384–6.
Yamaguchi, H., and Miyazaki, M. (2014). Refolding techniques for recovering biologically active
recombinant proteins from inclusion bodies. Biomolecules 4, 235–251.
Yang, J.T., Wu, C.-S.C., and Martinez, H.M. (1986). [11] Calculation of protein conformation from circular
dichroism. Methods Enzymol. 130, 208–269.
Yonekura, K., Kato, K., Ogasawara, M., Tomita, M., and Toyoshima, C. (2015). Electron crystallography of
ultrathin 3D protein crystals: atomic model with charges. Proc. Natl. Acad. Sci. U. S. A. 112, 3368–3373.
Zhou, Q., Liu, B., Sun, Y., and He, C.Y. (2011). A coiled-coil- and C2-domain-containing protein is required
for FAZ assembly and cell morphology in Trypanosoma brucei. J. Cell Sci. 124, 3848–3858.

127
10 CURRICULUM VITAE
I. PERSONAL DATA
Name : MUDOGO NZANZU Célestin
Address : Philosophenweg 79, 72076 Tübingen, Germany
Date of Birth : 26th May 1980 in Kinshasa, DR Congo
Nationality :
Sex :
Congolese
Male
Téléphone : +49 (0) 157 38561189
E-Mail : [email protected]/[email protected]
Marital Status: Single
II. EDUCATION BACKGROUND
❖ 1986 – 1992: Primary School at the Institute of Mont – Amba
❖ 1993 – 1998: High School at the Institute of Mont – Amba
❖ 1999 – 2006: M.D Degree obtained at the Université de Kinshasa, Medical Doctor Degree in
Medical General Surgery and Childbirth
❖ 2007 – 2008: Junior Assistant at Cliniques Universitaires de Kinshasa; Department of
Clinical Biochemistry, Democratic Republic of the Congo
❖ 2008 – 2011: M.Sc. in Biochemistry and Molecular Biology at Faculty of
Sciences/Department of Biochemistry and Molecular Biology, Egerton University, Kenya
❖ June 2012 – September 2012: German Language Courses at Mannheim-Heidelberg Goethe
Institute (Intensive 4 months)

128
❖ October 2012 – July 2017: PhD research work in Biochemistry and Molecular Parasitology at
the Interfaculty Institute of Biochemistry, Eberhard-Karls Tübingen University, Germany.
Thesis Title: Analysis of a putative cyclooxygenase from Trypanosoma brucei and its
eligibility as a possible drug target. Supervisor: Prof. Dr. Michael Duszenko
III. HONORS AND AWARDS
❖ 2008, The New Partnership for Africa’s Development (NEPAD) & Biosciences eastern and
central Africa Network (BecaNeT) scholarship for Master study at Egerton University,
Kenya
❖ 2009, DFG Fund Project “Late Stage African Sleeping Sickness: Elucidation of Brain
Infection by African Trypanosomes”, Master scholar, October 2009
❖ 2012, Bourse d’Excellence Bringmann aux Universités Congolaises (BEBUC) scholarship for
PhD study from the Université de Kinshasa (UNIKIN)
❖ 2012, DAAD scholarship for PhD study at Eberhard-Karls Tübingen University, Germany.
PhD Project Title: Expression, Refolding and Purification of a putative cyclooxygenase like-
enzyme from trypanosoma brucei for structural studies
IV. PROFESSIONAL EXPERIENCE
❖ MD General practitioner
❖ NEPAD & BecaNET Sponsored Student from East and Central African region.
MSc. Thesis Title: Purification and Characterization of a Cyclooxygenase – like enzyme from
Trypanosoma brucei. Supervisors: Prof. Dr. Michael Duszenko (Tübingen University) Prof.
Bruno Kilunga Kubata (coordinator of Health/NEPAD), Prof. Raphael Ngure (Egerton
University)
❖ Sandwich program between Africa and Germany that allowed me to undertake their
research work at the Interfaculty Institute of Biochemistry (IFIB), Eberhard-Karls Tübingen
University under the DFG Fund Project “Late Stage of African Sleeping Sickness:
Elucidation of Brain Infection by African Trypanosomes.”
❖ PhD research work at the Interfaculty Institute of Biochemistry, Eberhard-Karls Tübingen
University, Germany. Thesis Title: Analysis of a putative cyclooxygenase from Trypanosoma
brucei and its eligibility as a possible drug target. Supervisor: Prof. Dr. Michael Duszenko
V. PUBLICATIONS AND PRESENTATIONS
❖ Oral presentation PhD project at the 2nd Interfaculty Institute of Biochemistry (IFIB) -
Tübingen University PhD symposium in Blaubeuren, September 20th-September 22nd, 2013

129
❖ Stein J, Mogk S, Mudogo CN, Sommer BP, Scholze M, Meiwes A, Huber M, Gray A,
Duszenko M. (2014) Drug Development Against Sleeping Sickness: Old Wine in New
Bottles? Curr Med Chem., 2014, 21, 1713-1727
❖ Barth T, Bruges GA, Meiwes A, Mogk S, Mudogo CN and Duszenko M. (2014)
Staurosporine-induced cell death in Trypanosoma brucei and the role of Endonuclease G
during apoptosis. Open J. of Apoptosis, 2014, 3, 16-31
❖ Duszenko M, Redecke L, Mudogo CN, Sommer BP, Mogk S, Oberthür D, Betzel C. (2015)
In vivo protein crystallization in combination with novel highly brilliant radiation source
opportunities for structural analysis of post-translationally modified eukaryotic proteins.
Acta Crystallographica F Struc. Biol. Commun., 2015, 71: 927-937
❖ Abstract and Poster presentation at the forthcoming Sao Paulo School of Advanced Science
on Neglected Disease Drug Discovery focus on Kinetoplastids at the Brazilian Center for
Research in Energy and Materials (CNPEM), Campinas, Brazil, June 14th – June 24th, 2015
❖ Oral presentation PhD project & Method talk at the Interfaculty Institute of Biochemistry
(IFIB) - Tübingen University PhD symposium in Freudenstadt, April 21th-23rd, 2016
❖ Mogk S, Boßelmann CM, Mudogo CN, Stein J, Wolburg H, Duszenko M. (2016) African
trypanosomiasis and brain infection – the unsolved question. Biol Rev Camb Philos Soc.
2016 Oct 14 [Epub ahead of print]
VI. REFEREES
❖ Prof. Michael Duszenko
Interfaculty Institute of Biochemistry (IFIB) - Tübingen University
Tübingen University-Hoppe-Seyler-Str. 4
72076 Tübingen
Tel: +49 (0) 7071 2973343
E-Mail: [email protected]