analysis of a nuclear accident: fission and activation ...analysis of a nuclear accident: fission...
TRANSCRIPT

PNNL-20912
Prepared for the U.S. Department of Energy under Contract DE-AC05-76RL01830
Analysis of a Nuclear Accident: Fission and Activation Product Release from the Fukushima Daiichi Nuclear Facility as Remote Indicators of Source Identification, Extent of Release, and State of Damaged Spent Nuclear Fuel JM Schwantes CR Orton RA Clark January 2012


DISCLAIMER This report was prepared as an account of work sponsored by an agency of the United States Government. Neither the United States Government nor any agency thereof, nor Battelle Memorial Institute, nor any of their employees, makes any warranty, express or implied, or assumes any legal liability or responsibility for the accuracy, completeness, or usefulness of any information, apparatus, product, or process disclosed, or represents that its use would not infringe privately owned rights. Reference herein to any specific commercial product, process, or service by trade name, trademark, manufacturer, or otherwise does not necessarily constitute or imply its endorsement, recommendation, or favoring by the United States Government or any agency thereof, or Battelle Memorial Institute. The views and opinions of authors expressed herein do not necessarily state or reflect those of the United States Government or any agency thereof. PACIFIC NORTHWEST NATIONAL LABORATORY operated by BATTELLE for the UNITED STATES DEPARTMENT OF ENERGY under Contract DE-AC05-76RL01830 Printed in the United States of America Available to DOE and DOE contractors from the Office of Scientific and Technical Information,
P.O. Box 62, Oak Ridge, TN 37831-0062; ph: (865) 576-8401 fax: (865) 576-5728
email: [email protected] Available to the public from the National Technical Information Service, U.S. Department of Commerce, 5285 Port Royal Rd., Springfield, VA 22161
ph: (800) 553-6847 fax: (703) 605-6900
email: [email protected] online ordering: http://www.ntis.gov/ordering.htm
This document was printed on recycled paper.
(9/2003)

PNNL-20912
Analysis of a Nuclear Accident: Fission and Activation Product Releases from the Fukushima Daiichi Nuclear Facility as Remote Indicators of Source Identification, Extent of Release, and State of Damaged Spent Nuclear Fuel
JM Schwantes1
CR Orton1
RA Clark2
1Pacific Northwest National Laboratory 2University of Missouri at Columbia January 2012 Prepared for the U.S. Department of Energy under Contract DE-AC05-76RL01830 Pacific Northwest National Laboratory Richland, Washington 99352

Analysis of a Nuclear Accident: Fission and Activation Product Releases from the
Fukushima Daiichi Nuclear Facility as Remote Indicators of Source Identification,
Extent of Release, and State of Damaged Spent Nuclear Fuel
Jon M. Schwantes1, Christopher R. Orton1, and Richard A. Clark2
1Pacific Northwest National Laboratory 2University of Missouri at Columbia
January 17,2012
Abstract
Measurements of radionuclides within environmental samples taken from the Fukushima Daiichi nuclear
facility and reported on the Tokyo Electric Power Company website following the recent tsunami‐
initiated catastrophe were evaluated. From this effort, Units 1 and 3 were identified as the major source
of radioactive contamination to the surface soil close to the facility. This release was likely dictated
primarily by chemical volatility driven by temperature and reduction potential within the primary
containment vessels of the vented reactors. All coolant had likely evaporated by the time of venting and
damage to fuel bundles was likely extensive, minimizing any containment due to physical migration of
these species through the fuel matrix and across the cladding wall. Isotopic ratios of Pu with distance
from the source indicated that the damaged reactors were the major contributor of plutonium to
surface soil at the source but that this contribution likely decreased rapidly with distance from the
facility. The fraction of the total plutonium inventory released to the environment from venting Units 1
and 3 relative to cesium was estimated to be ~0.003% based upon two independent evaluations.
Significant volatile radionuclides within the spent fuel at the time of venting but not as yet observed and
reported within environmental samples are suggested as potential analytes of concern for future
environmental surveys around the site.
Introduction
One of the most severe nuclear accidents occurred at the Tokyo Electric Power Company (TEPCO)
Fukushima Daiichi Nuclear Power Station on March 11, 2011, following the largest earthquake in
recorded Japanese history (magnitude 9.0 on the Richter scale). The epicenter of the earthquake was
located 112 miles offshore northwest of the facility. This event triggered a total of seven tsunamis that
impacted the site, with a maximum height of 14 to 15 m. Water and debris from the tsunamis overtook
a 6‐meter‐high seawall protecting the site, destroyed off‐site power and most backup generators on‐
site, blocked seawater intakes, and flooded most of the facilities under 4 m of water. An extensive
summary of the events surrounding this accident has been provided by the Institute of Nuclear Power
Operations (1).
The TEPCO Fukushima Daiichi Facility consisted of six boiling water reactors (BWRs), with a combined
generating power capability of 5480 MWe. At the time of the accident, three of the six reactor units
were in operation (Units 1, 2, and 3). The reactor at Unit 4 had been shut down since November 30,
2010, and all of its fuel had been offloaded to the shared spent fuel pool nearby. This pool was the
largest spent fuel storage on site, containing 1,331 spent nuclear fuel assemblies or 1.4 times the
amount of fuel contained within reactor Units 1 and 3 at the time of the earthquake (1). Units 5 and 6
were also in a planned shutdown, but still had their fuel loaded, reactor pressure vessels installed, and
cooling water at normal levels. Units 5 and 6 were successfully shut down without any significant release
of radionuclides to the environment (1).
The earthquake initiated automatic scrams for Units 1, 2 and 3, beginning a sequence designed to shut
down these reactors safely. This sequence, which is designed to cool reactor cores to a safe
temperature, was interrupted, however, upon the arrival of the tsunamis and loss of primary and
backup power. With the loss of any heat removal capability, temperatures within the primary
containment vessels of Units 1, 2, and 3 quickly rose to >900° C. Pressures in Units 1 and 3 also increased beyond the’ design specifications for these vessels due to a chemical reaction (2‐3) between
water and the zirconium cladding of the fuel. This reaction occurs at high temperatures and produces
H2(g) (Eq. 1).
2 → Eq. 1
This exothermic reaction initiates at ~900° C, but becomes autocatalytic at ~1300° C. Once the pressures within the primary containment vessels of Units 1 and 3 exceeded design specifications, the decision
was made to vent the H2(g) and any other volatile gases that had built up within the primary vessels to
the atmosphere in an attempt to protect the structural integrity of the primary containment vessels (1).
The first of a series of venting operations occurred roughly one day after units 1, 2, and 3 were
scrammed (March 12, 1440 JST). Hydrogen gas released from the primary vessels of Units 1 and 3
subsequently accumulated within the superstructures above the core and eventually lead to a series of
explosions. One of the explosions occurred at the spent‐fuel pool at Unit 4, and is thought to be a result
of H2(g) that backed up and accumulated there from common piping connecting units 3 and 4 (1).
There is some debate over the source and extent of radionuclide contamination to the environment
from the Fukushima Daiichi nuclear facility. It has been suggested, for instance, that the explosion at the
Unit 4 cooling pool, which is not contained within any primary containment system, may have damaged
fuel and contributed to or even composed the major source of the release of radionuclides to the
environment (4‐5). This was based upon a correlation in time observed between the application of
water over the spent fuel pool and a decrease in the atmospheric plume measured over Europe.

However, large amounts of radioactive contamination detected across the site (6), as well as trace levels
of radiation detected across the Northern hemisphere (7) were also correlated in time with the venting
of Units 1 and 3.
Here, we evaluate the earliest reported measurements (within 20 days after the earthquake) of several
radionuclides found within environmental samples taken from the Fukushima Daiichi nuclear facility (8).
The purpose of this effort was to attempt to identify the source term, reconstruct the release
mechanisms, estimate the extent of the release, and generally demonstrate the power of rapid
evaluations based upon basic chemical and nuclear engineering concepts for purposes of consequence
management.
Methods
Data Quality
Evaluations provided here were based upon analytical results reported on the TEPCO website (8) posted
roughly 20 days after the earthquake. Some of the data we have used were subsequently removed from
the website for reasons we assume were related to quality concerns stemming from the rather unique
and short‐lived nature of these isotopes. However, it is precisely the short‐lived nature of these isotopes
that make them powerful signatures of the state and identity of their source. As such, we have reviewed
the retracted measurements of 136Cs, 132Te, 110mAg, 140Ba, 140La, 106Ru, 99Mo, 99mTc and 95Nb and have
concluded that their reported measured activities in soil samples were consistent with both burnup
model predictions of potential source terms and the published measurements of more commonly
reported and longer‐lived isotopes (131I and 137Cs). Based upon this review we cautiously defend our use
of these data for qualitative assessments regarding the source. We assert no assurances with regards to
the quality of these data or the evaluations we have generated beyond their use in assessments of a
qualitative nature. Certainly, more thorough assessments of this accident will eventually be available
from which to compare the results of this rough‐but‐rapid evaluation.
Conceptual Model for the Release of Radionuclides from the Primary Containments of Units 1 and 3 and
cooling pool from Unit 4
Two possible sources of radionuclides released to the environment from the Fukushima Daiichi nuclear
facility have been suggested; these include venting of scrammed Units 1, 2 and 3, and uncontrolled
releases from damaged fuel located within the central cooling pool at Unit 4.
Figure 1 provides a graphical overview of the assumed mechanism for radionuclide release from the
vented Fukushima Daiichi Units 1 and 3. The mechanism involves five steps: 1) volatilization of
radionuclides within the fuel matrix, 2) migration of those volatile species through the interstices of the
fuel to the cladding wall, 3) escape of the volatile radionuclides through damaged portions of the
cladding, 4) bubbling of those volatile contaminants through the confined coolant during venting, and 5)

migration of these radionuclides to the environment. In our evaluation of the reported data, we make
the following conservative, simplifying, assumptions:
1. The volatility of all radionuclides of interest is adequately described by assuming
thermodynamic equilibrium (9). Kinetic limitations associated with phase transformation are
assumed unimportant.
2. Any gaseous radionuclides that have evaporated within the fuel completely migrate to the
cladding walls. Kinetic limitations associated with migration through the fuel matrix are assumed
to be insignificant.
3. Any volatile radionuclides that have migrated to the cladding wall will escape across the
damaged cladding wall. In other words, the cladding is assumed to be sufficiently damaged as to
pose no significant barrier to escape.
4. All coolant within Units 1 and 3 has evaporated prior to venting, such that volatile radionuclides
are released directly into the atmosphere without fractionation due to partitioning into a
retained aqueous phase.
5. All volatile radionuclides released during venting immediately condense upon cooling and
mixing with the atmosphere, and precipitate without significant fractionation to the surface soil
at close distances from the source. The assumption that no fractionation had occurred between
differing elements from the point of release to the point of measurement is likely only valid at
short distances from the source.
Explosions at Unit 4 suggest the possibility of the dispersal of radionuclides from the irradiated fuel
stored within the cooling pool of Unit 4. In order to assess radionuclide release to the local environment
from this source, we assume that no fractionation of isotopes has occurred from the point of release to
the point of measurement. When evaluating measurements of cesium within water from the cooling
pool or sub‐drains in close proximity to the pool, we assume a significant fraction of the inventory of the
highly soluble cesium isotopes within the damaged fuel ends up dissolved in the water, whether these
isotopes were explosively released as part of a fuel fragment or evolved during extreme overheating.

Figure 1. Mcontainmmechanis
Modeled
Radionuc
SCALE 5.1
expected
Reactors s
nuclear p
well with
function w
initial 235U
be 25 MW
per cubic
(400 days
after cool
We utilize
within spe
was used
4, with th
consisten
Major mechaent vessels oms made her
Spent Fuel In
lide inventori
1 simulation p
at a Fukushim
similar in des
lant have bee
optical and m
was used with
U enrichment
W days per me
centimeter).
s per cycle) us
ing for severa
e ORIGEN‐ARP
ent fuel from
to predict rad
e exception o
t with the fue
anisms to gasef Units 1 and re for evaluat
nventories
ies within spe
package (10).
ma‐style reac
ign to those r
en modeled b
mass spectrom
hin ORIGEN‐A
. A one‐metr
etric ton of ur
The burnup
sing a single li
al time points
P model pred
the scramme
dionuclide inv
of using outpu
el most recen
eous release 3. Conservattion purposes
ent nuclear re
Assumption
tor (i.e., boili
running at th
by the authors
metric measu
ARP. The fuel
ric‐ton uraniu
ranium (MTU
was simulate
ibrary per cyc
s post‐irradia
dictions after
ed reactors ju
ventories con
ut from predi
ntly added to
of radioactiveive, worst‐cas are describe
eactor fuel wa
ns were made
ng‐water rea
e time of the
s previously.
urements of a
l was assume
um basis was
U) and the mo
ed up to a cum
cle. Nuclide l
tion, includin
1 d of cooling
ust before ven
ntained within
ictions after 1
the pool from
e effluents duse‐scenario aed within the
as simulated
e to simulate
ctor, Gen2, B
earthquake a
Modeled inve
ctual sample
d to be Gene
used. The po
oderator dens
mulative of 30
ists were gen
ng 1, 2, 3, 30,
g to represen
nting efforts c
n the spent fu
100 d of cooli
m the reactor
uring the venassumptions f“Methods” s
using ORIGEN
the generic c
BWR4, Marc I
at the Fukush
entories in th
s of the fuel (
eral Electric 8x
wer density w
sity was 0.733
0,000 MW/M
nerated for th
100 and 365
t the radionu
commenced.
uel in the coo
ing. This cool
r at Unit 4. Ta
ting of primafor each of thection.
N‐ARP, part o
conditions
containment
hima Daiichi
hose cases ag
(11). The Exp
x8 fuel with 4
was assumed
32 g/cm3 (gra
MTU over 3 cy
he simulated f
days.
uclide invento
The same m
oling pool at U
ing time is
king this mos
ry he
of the
t).
reed
press
4%
to
ams
ycles
fuel
ories
odel
Unit
st
recent fuel to represent the entirety of fuel assemblies contained within the spent fuel pool has the
effect of dramatically overestimating the potential contribution of radionuclides coming from this
source.
Results
Analytical results of environmental surveys taken from across the Fukushima Daiichi facility grounds and
published on the TEPCO website within the first 20 days after the earthquake are provided in Tables 1
through 3. Table 4 provides model output from ORIGEN ARP computations designed to replicate the
average radionuclide inventories within Units 1 and 3 just before venting and that of the most recently
off‐loaded fuel stored in the spent‐fuel cooling pool at Unit #4.
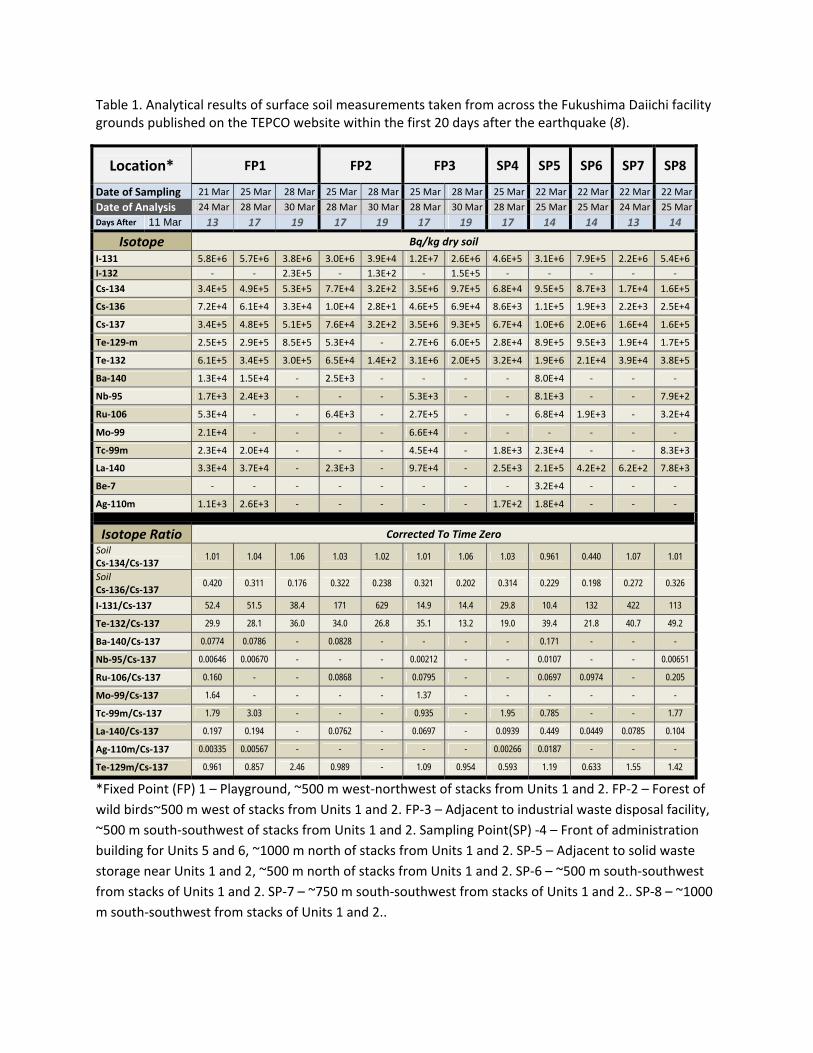
Table 1. Analytical results of surface soil measurements taken from across the Fukushima Daiichi facility grounds published on the TEPCO website within the first 20 days after the earthquake (8).
Location* FP1 FP2 FP3 SP4 SP5 SP6 SP7 SP8
Date of Sampling 21 Mar 25 Mar 28 Mar 25 Mar 28 Mar 25 Mar 28 Mar 25 Mar 22 Mar 22 Mar 22 Mar 22 Mar
Date of Analysis 24 Mar 28 Mar 30 Mar 28 Mar 30 Mar 28 Mar 30 Mar 28 Mar 25 Mar 25 Mar 24 Mar 25 Mar
Days After 11 Mar 13 17 19 17 19 17 19 17 14 14 13 14
Isotope Bq/kg dry soil
I‐131 5.8E+6 5.7E+6 3.8E+6 3.0E+6 3.9E+4 1.2E+7 2.6E+6 4.6E+5 3.1E+6 7.9E+5 2.2E+6 5.4E+6
I‐132 ‐ ‐ 2.3E+5 ‐ 1.3E+2 ‐ 1.5E+5 ‐ ‐ ‐ ‐ ‐
Cs‐134 3.4E+5 4.9E+5 5.3E+5 7.7E+4 3.2E+2 3.5E+6 9.7E+5 6.8E+4 9.5E+5 8.7E+3 1.7E+4 1.6E+5
Cs‐136 7.2E+4 6.1E+4 3.3E+4 1.0E+4 2.8E+1 4.6E+5 6.9E+4 8.6E+3 1.1E+5 1.9E+3 2.2E+3 2.5E+4
Cs‐137 3.4E+5 4.8E+5 5.1E+5 7.6E+4 3.2E+2 3.5E+6 9.3E+5 6.7E+4 1.0E+6 2.0E+6 1.6E+4 1.6E+5
Te‐129‐m 2.5E+5 2.9E+5 8.5E+5 5.3E+4 ‐ 2.7E+6 6.0E+5 2.8E+4 8.9E+5 9.5E+3 1.9E+4 1.7E+5
Te‐132 6.1E+5 3.4E+5 3.0E+5 6.5E+4 1.4E+2 3.1E+6 2.0E+5 3.2E+4 1.9E+6 2.1E+4 3.9E+4 3.8E+5
Ba‐140 1.3E+4 1.5E+4 ‐ 2.5E+3 ‐ ‐ ‐ ‐ 8.0E+4 ‐ ‐ ‐
Nb‐95 1.7E+3 2.4E+3 ‐ ‐ ‐ 5.3E+3 ‐ ‐ 8.1E+3 ‐ ‐ 7.9E+2
Ru‐106 5.3E+4 ‐ ‐ 6.4E+3 ‐ 2.7E+5 ‐ ‐ 6.8E+4 1.9E+3 ‐ 3.2E+4
Mo‐99 2.1E+4 ‐ ‐ ‐ ‐ 6.6E+4 ‐ ‐ ‐ ‐ ‐ ‐
Tc‐99m 2.3E+4 2.0E+4 ‐ ‐ ‐ 4.5E+4 ‐ 1.8E+3 2.3E+4 ‐ ‐ 8.3E+3
La‐140 3.3E+4 3.7E+4 ‐ 2.3E+3 ‐ 9.7E+4 ‐ 2.5E+3 2.1E+5 4.2E+2 6.2E+2 7.8E+3
Be‐7 ‐ ‐ ‐ ‐ ‐ ‐ ‐ ‐ 3.2E+4 ‐ ‐ ‐
Ag‐110m 1.1E+3 2.6E+3 ‐ ‐ ‐ ‐ ‐ 1.7E+2 1.8E+4 ‐ ‐ ‐
Isotope Ratio Corrected To Time Zero
Soil Cs‐134/Cs‐137
1.01 1.04 1.06 1.03 1.02 1.01 1.06 1.03 0.961 0.440 1.07 1.01
Soil Cs‐136/Cs‐137
0.420 0.311 0.176 0.322 0.238 0.321 0.202 0.314 0.229 0.198 0.272 0.326
I‐131/Cs‐137 52.4 51.5 38.4 171 629 14.9 14.4 29.8 10.4 132 422 113
Te‐132/Cs‐137 29.9 28.1 36.0 34.0 26.8 35.1 13.2 19.0 39.4 21.8 40.7 49.2
Ba‐140/Cs‐137 0.0774 0.0786 - 0.0828 - - - - 0.171 - - -
Nb‐95/Cs‐137 0.00646 0.00670 - - - 0.00212 - - 0.0107 - - 0.00651
Ru‐106/Cs‐137 0.160 - - 0.0868 - 0.0795 - - 0.0697 0.0974 - 0.205
Mo‐99/Cs‐137 1.64 - - - - 1.37 - - - - - -
Tc‐99m/Cs‐137 1.79 3.03 - - - 0.935 - 1.95 0.785 - - 1.77
La‐140/Cs‐137 0.197 0.194 - 0.0762 - 0.0697 - 0.0939 0.449 0.0449 0.0785 0.104
Ag‐110m/Cs‐137 0.00335 0.00567 - - - - - 0.00266 0.0187 - - -
Te‐129m/Cs‐137 0.961 0.857 2.46 0.989 - 1.09 0.954 0.593 1.19 0.633 1.55 1.42
*Fixed Point (FP) 1 – Playground, ~500 m west‐northwest of stacks from Units 1 and 2. FP‐2 – Forest of
wild birds~500 m west of stacks from Units 1 and 2. FP‐3 – Adjacent to industrial waste disposal facility,
~500 m south‐southwest of stacks from Units 1 and 2. Sampling Point(SP) ‐4 – Front of administration
building for Units 5 and 6, ~1000 m north of stacks from Units 1 and 2. SP‐5 – Adjacent to solid waste
storage near Units 1 and 2, ~500 m north of stacks from Units 1 and 2. SP‐6 – ~500 m south‐southwest
from stacks of Units 1 and 2. SP‐7 – ~750 m south‐southwest from stacks of Units 1 and 2.. SP‐8 – ~1000
m south‐southwest from stacks of Units 1 and 2..

Table 2. Analytical results of water samples taken from sub drains and turbine water from units 1 through 6 of the Fukushima Daiichi nuclear
facility published on the TEPCO website within the first 20 days after the earthquake (8).
Location Unit 1
Unit 2
Unit 3 Unit 4 Unit 5 Unit 6
Sub Drain Turbine Water
Sub Drain Sub drain
Turbine Water Sub Drain Sub Drain Sub Drain
Date of Analysis 26 Mar 30 Mar 30 Mar 26 Mar 30 Mar 26 Mar 30 Mar 24 Mar 30 Mar 30 Mar
Days After 11 Mar 15 19 19 15 19 15 19 13 19 19
Isotope Bq/cm3
Cs‐134 ‐ 8.81E‐01 8.86E‐01 ‐ 7.00E‐01 ‐ 1.00E+01 ‐ 2.50E‐01 4.70E+00 Cs‐136 8.46E‐02 6.61E‐02 6.46E‐02 2.50E+01 6.50E‐02 6.50E+00 9.40E‐01 3.70E+00 2.70E‐02 3.90E‐01 Cs‐137 ‐ 8.81E‐01 8.86E‐01 2.30E+02 6.30E‐01 5.60E+01 1.00E+01 3.20E+01 2.70E‐01 4.90E+00
Isotope Ratio
Cs‐134/Cs‐137 ‐ 8.81E‐01 8.86E‐01 ‐ 1.11E+00 ‐ 1.00E+00 ‐ 9.26E‐01 9.59E‐01 Cs‐136/Cs‐137 8.46E‐02 6.61E‐02 6.46E‐02 1.09E‐01 1.03E‐01 1.16E‐01 9.40E‐02 1.16E‐01 1.00E‐01 7.96E‐02

Table 3. Analytical results of Pu activity in surface soil with distance from the Fukushima Daiichi nuclear
facility measured after the earthquake on March 11, 2012 (6, 8).
Distance From Source Pu‐238
(Bq/kg dry soil)
Pu‐239,240
(Bq/kg dry soil) Pu‐238/Pu‐239,240
45.4 0.82 2.5 0.328
38.6 0.77 0.6 1.283
31.2 4 1.8 2.222
23.9 2.3 1.8 1.278
5.25 0.55 0.66 0.833
0.17 0.051 0.026 1.96
0.17 0.14 0.087 1.61
0.17 0.26 0.12 2.17
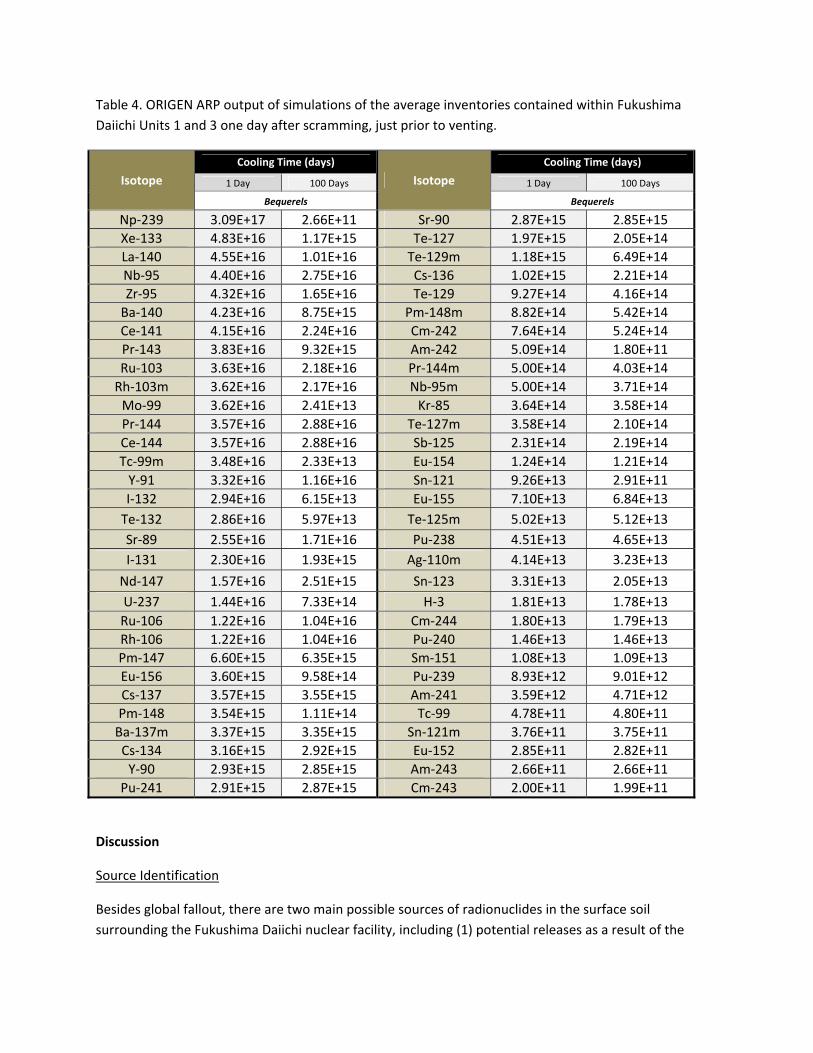
Table 4. ORIGEN ARP output of simulations of the average inventories contained within Fukushima
Daiichi Units 1 and 3 one day after scramming, just prior to venting.
Isotope
Cooling Time (days)
Isotope
Cooling Time (days)
1 Day 100 Days 1 Day 100 Days
Bequerels Bequerels
Np‐239 3.09E+17 2.66E+11 Sr‐90 2.87E+15 2.85E+15
Xe‐133 4.83E+16 1.17E+15 Te‐127 1.97E+15 2.05E+14
La‐140 4.55E+16 1.01E+16 Te‐129m 1.18E+15 6.49E+14
Nb‐95 4.40E+16 2.75E+16 Cs‐136 1.02E+15 2.21E+14
Zr‐95 4.32E+16 1.65E+16 Te‐129 9.27E+14 4.16E+14
Ba‐140 4.23E+16 8.75E+15 Pm‐148m 8.82E+14 5.42E+14
Ce‐141 4.15E+16 2.24E+16 Cm‐242 7.64E+14 5.24E+14
Pr‐143 3.83E+16 9.32E+15 Am‐242 5.09E+14 1.80E+11
Ru‐103 3.63E+16 2.18E+16 Pr‐144m 5.00E+14 4.03E+14
Rh‐103m 3.62E+16 2.17E+16 Nb‐95m 5.00E+14 3.71E+14
Mo‐99 3.62E+16 2.41E+13 Kr‐85 3.64E+14 3.58E+14
Pr‐144 3.57E+16 2.88E+16 Te‐127m 3.58E+14 2.10E+14
Ce‐144 3.57E+16 2.88E+16 Sb‐125 2.31E+14 2.19E+14
Tc‐99m 3.48E+16 2.33E+13 Eu‐154 1.24E+14 1.21E+14
Y‐91 3.32E+16 1.16E+16 Sn‐121 9.26E+13 2.91E+11
I‐132 2.94E+16 6.15E+13 Eu‐155 7.10E+13 6.84E+13
Te‐132 2.86E+16 5.97E+13 Te‐125m 5.02E+13 5.12E+13
Sr‐89 2.55E+16 1.71E+16 Pu‐238 4.51E+13 4.65E+13
I‐131 2.30E+16 1.93E+15 Ag‐110m 4.14E+13 3.23E+13
Nd‐147 1.57E+16 2.51E+15 Sn‐123 3.31E+13 2.05E+13
U‐237 1.44E+16 7.33E+14 H‐3 1.81E+13 1.78E+13
Ru‐106 1.22E+16 1.04E+16 Cm‐244 1.80E+13 1.79E+13
Rh‐106 1.22E+16 1.04E+16 Pu‐240 1.46E+13 1.46E+13
Pm‐147 6.60E+15 6.35E+15 Sm‐151 1.08E+13 1.09E+13
Eu‐156 3.60E+15 9.58E+14 Pu‐239 8.93E+12 9.01E+12
Cs‐137 3.57E+15 3.55E+15 Am‐241 3.59E+12 4.71E+12
Pm‐148 3.54E+15 1.11E+14 Tc‐99 4.78E+11 4.80E+11
Ba‐137m 3.37E+15 3.35E+15 Sn‐121m 3.76E+11 3.75E+11
Cs‐134 3.16E+15 2.92E+15 Eu‐152 2.85E+11 2.82E+11
Y‐90 2.93E+15 2.85E+15 Am‐243 2.66E+11 2.66E+11
Pu‐241 2.91E+15 2.87E+15 Cm‐243 2.00E+11 1.99E+11
Discussion
Source Identification
Besides global fallout, there are two main possible sources of radionuclides in the surface soil
surrounding the Fukushima Daiichi nuclear facility, including (1) potential releases as a result of the
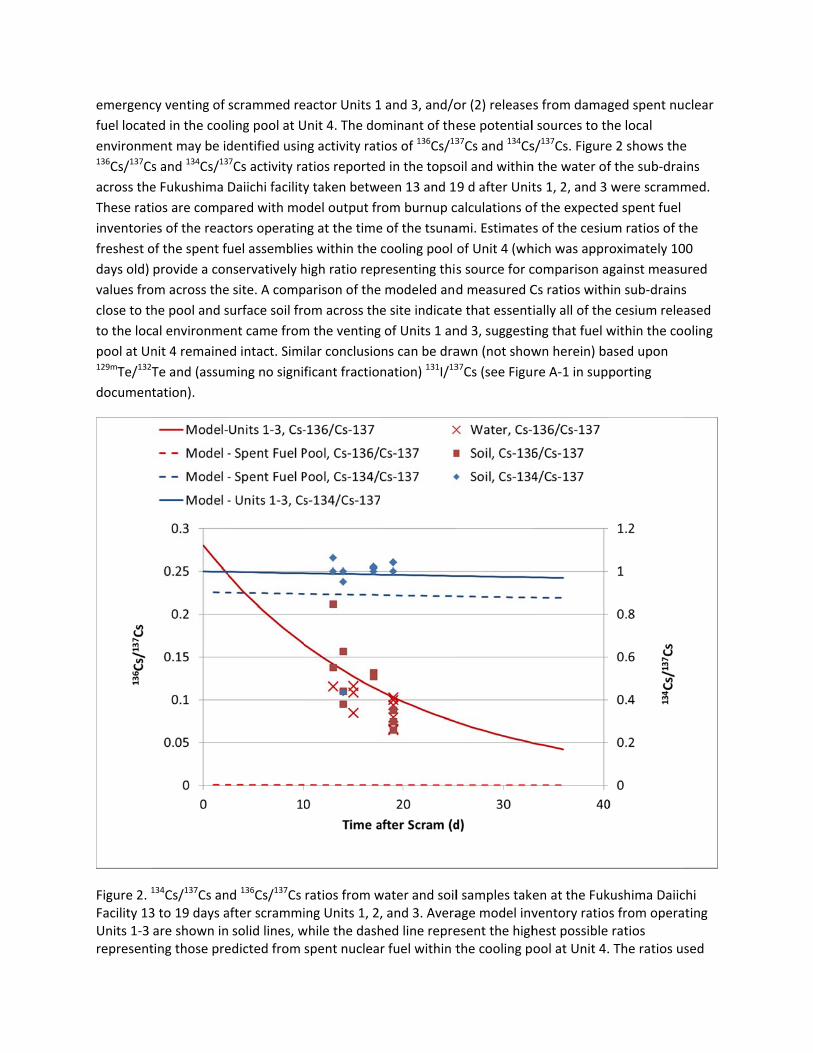
emergenc
fuel locate
environm136Cs/137Cs
across the
These rat
inventorie
freshest o
days old)
values fro
close to th
to the loc
pool at Un129mTe/132T
document
Figure 2. 1
Facility 13Units 1‐3 represent
cy venting of
ed in the coo
ent may be id
s and 134Cs/13
e Fukushima
ios are compa
es of the reac
of the spent fu
provide a con
om across the
he pool and s
al environme
nit 4 remaine
Te and (assum
tation).
134Cs/137Cs an3 to 19 days aare shown inting those pre
scrammed re
ling pool at U
dentified usin7Cs activity ra
Daiichi facility
ared with mo
ctors operatin
uel assemblie
nservatively h
e site. A comp
surface soil fro
ent came from
ed intact. Simi
ming no signif
nd 136Cs/137Cs after scrammi solid lines, wedicted from
eactor Units 1
Unit 4. The do
ng activity rat
atios reported
y taken betw
odel output fr
ng at the time
es within the
high ratio rep
parison of the
om across the
m the venting
ilar conclusio
ficant fractio
ratios from wing Units 1, 2,while the dashspent nuclea
1 and 3, and/o
ominant of the
tios of 136Cs/13
d in the topso
een 13 and 1
rom burnup c
e of the tsuna
cooling pool
resenting this
e modeled and
e site indicate
g of Units 1 an
ns can be dra
nation) 131I/13
water and soil, and 3. Averahed line reprer fuel within t
or (2) release
ese potential37Cs and 134Cs
oil and within
9 d after Unit
calculations o
ami. Estimate
of Unit 4 (wh
s source for c
d measured C
e that essent
nd 3, suggesti
awn (not show37Cs (see Figu
l samples takage model invesent the highthe cooling p
s from damag
l sources to th
s/137Cs. Figure
n the water of
ts 1, 2, and 3
f the expecte
s of the cesiu
hich was appr
comparison a
Cs ratios with
ially all of the
ing that fuel w
wn herein) ba
re A‐1 in sup
en at the Fukventory ratiohest possible ool at Unit 4.
ged spent nu
he local
e 2 shows the
f the sub‐drai
were scramm
ed spent fuel
um ratios of th
roximately 10
gainst measu
hin sub‐drains
e cesium relea
within the co
ased upon
porting
kushima Daiics from operaratios . The ratios us
clear
e
ins
med.
he
00
ured
s
ased
oling
chi ting
sed

to represent the fuel within the cooling pool were based upon the same generic Origen model developed for BWRs at Units 1, 2, and 3, with the exception of utilizing predicted inventories for fuel cooled for 100 d, consistent with the cooling time of the most recently added fuel to the cooling pool at Unit 4.
Evidence of Minor Amounts of Plutonium Released to the Environment
Reports have suggested that plutonium was released from these reactors based upon total plutonium
activity measurements in surface soil (8). However, Hirose et al. (12) has shown that global fallout
deposition rates can vary by 50% or more at the same location of measurement. As such, the use of
absolute activity or deposition rates to soil is of qualitative value at best as an indicator of source
identity.
An excerpt from T. Sekiguchi (13), quoting Japan’s Science Ministry analysis, reports, “…238Pu believed to
have been emitted from the damaged Fukushima Reactors, was found in soil samples from six separate
locations, ranging from 0.55 to 4.0 becquerels per square meter.”
Sekiguchi goes on to report that “Samples from Litate, a village located 28 miles from the power plant,
registered 0.82 becquerels of 238Pu and 2.5 becquerels of 239,240Pu. Litate was evacuated earlier this
year.”
Sekiguchi quotes measured values that equate to a 238Pu/239,240Pu activity ratio of 0.328 within Litate’s
surface soil. Employing a simple two‐term mixing model represented by global fallout (6) (238Pu/239,240Pu
activity ratio = 0.026) and plutonium emanating from the damaged reactors (predicted 238Pu/239,240Pu
activity ratio = 1.92), the contribution from the damaged reactors to surface soil 28 miles (45 km) from
the source was estimated to be roughly 16%.
Figure 3 shows published (14) measurements of the 238Pu/239,240Pu activity ratios in surface soil with
distance from the Fukushima Diiachi Nuclear Power Station taken soon after venting Units 1 and 3.
These values are compared with those indicative of global fallout for the region (12). The predicted 238Pu/239,240Pu activity ratio within the spent fuel at Units 1 and 3 just prior to venting is also shown. The
average of the measured ratios in surface soils at the source correlates well with the model estimates of
the spent‐fuel inventory from Units 1 and 3, and is significantly different from the ratio measured from
global fallout for the region. This indicates that plutonium was released to the local environment during
the venting of Units 1 and 3. Additionally, the 238Pu/239,240Pu activity ratio decreases with distance from
the source, indicating the majority of the plutonium contamination from venting the reactors appears to
be localized within a few tens of kilometers from the site. A simple model shown in Equation 2 was
developed and fit to the experimental data to describe the deposition of plutonium with distance from
the site:
,∙ , Eq. 2

where
prior to ve
depositio
experime
vented pl
site, but o
Figure 3. Mstation. Taverage mmodeled open symmodel.
Estimated
The activi
calculatio
reported
and cesiu
(namely, r
, is the p
enting (taken
n parameter.
ntal data as a
utonium from
only ~20% of t
Measured (8)he average ofmeasured (19inventory wit
mbol “◊” was d
d Fraction of t
ty ratio of 239
ns to be ~150
by TEPCO ran
m that escap
rapid conden
predicted 238P
n to be 1.92),
A value of 5.
a function of d
m Units 1 and
the total plut
) 238Pu/239,240Pf the three m86) ratio fromthin the fuel pdefined as an
the Total plut
,240Pu/137Cs w
0 (see Table 4
nged from ab
ed from the r
sation and de
u/239,240Pu act
d is the dista
.97E‐4 was us
distance from
3 account fo
tonium in surf
Pu ratios as a measured valum global falloprior to venti outlier and e
tonium Inven
within Units 1
4), whereas th
out 2x10⁵ to
reactors follo
eposition clos
tivity ratio wi
nce from the
sed for rd, gen
m the source.
or roughly 100
face soil 50 k
function of des at the souut (correctedng is also shoexcluded duri
tory from Un
and 3 prior t
he measured
1x10⁶. If we a
wed the sam
se‐in from the
ithin the spen
source in kilo
nerated by a l
Using this mo
0% of the plu
m from the s
distance from urce is also shd to 2011) in town. A single ng the develo
nits #1 and 3 V
o venting wa
activity ratio
assume that t
e general fat
e location of
nt fuel in the
ometers, and
least squares
odel (dashed
tonium in sur
source.
the Fukushimown. For comthe region (14data point shopment of th
Vented to the
s estimated f
o in surface so
the majority o
e within the e
venting) and
damaged rea
d rd is the
s fit to the
line in Figure
rface soil at t
ma Daiichi Pomparison, the4) and the avehown with thee deposition
e Environmen
from burnup
oil at the site
of the pluton
environment
that 100% of
actor
e 3),
he
ower erage e
nt
ium
f the

total inventory of cesium within Units 1 and 3 was released to the environment, the discrepancy
between the 239,240Pu/137Cs activity ratio within the spent fuel and that found in the close‐in fallout
within the soil provides a measure of the fraction of the total plutonium inventory that escaped from
the damaged reactors relative to that of cesium. Based upon a comparison of modeled and measured 239,240Pu/137Cs activity ratios it is estimated that less than 0.002% of the total plutonium inventory from
Units 1 and 3 was released to the environment as a result of the Fukushima disaster.
Relative Release Fractions of Fission and Activation Products Trends with Volatility
Radionuclides other than cesium and plutonium were also detected within the soil at the Fukushima
Daiichi Power Station soon after the disaster and provide some independent confirmation of the
estimated fraction of the total plutonium inventory released from Units 1 and 3. Cubicciotti and Sehgal
(9) Error! Bookmark not defined. have suggested that under nuclear‐accident conditions the chemistry
within a primary containment vessel is adequately described assuming thermodynamic equilibrium. At
these high temperatures under a normal atmosphere, often the most stable form of an element will be
its oxide form. However, the environment within the primary containment vessel will also become
strongly reducing as H2(g) builds up from the high‐temperature reaction between the fuel cladding and
water (15). This means volatilization can occur directly from the oxide form within a damaged primary
containment vessel if temperatures within the vessel exceed the boiling point of the oxide, or indirectly
if the buildup of H2(g) is sufficient to reduce the oxide into a more volatile form. The metallic form of
barium, for instance, is more volatile than its oxide form (10). Hobbins et al. (16) has used the Gibbs Free
Energy of Formation (∆ ) for the oxide form of a metal (a.k.a., the oxygen potential) as a rough
measure of that element’s volatility under extreme nuclear accident conditions. Assuming chemical
thermodynamics alone dictated the overall release mechanisms of radionuclides from the primary
containment vessels to the close‐in environment (see Figure 1 and earlier discussion), one might expect
a correlation between the relative fraction of an isotope released from the vented reactors and the ∆
for the oxide form of the element it represents. Table 5 provides a summary of the applicable ∆
values from the literature. Figure 4 plots these values against the fraction of the isotope released, which
was defined as the ratio of the measured activity of an isotope within surface soil relative to 137Cs over
its predicted activity inventory relative to 137Cs from Origen calculations within Units 1 and 3 prior to
venting. The measured activities of daughters 140La and 99mTc were assumed to be in metastable
equilibrium with their parent.
From Figure 4, 140Ba(La) is an obvious outlier from a relatively good trend observed for most other
vented radionuclides and indicates a larger fraction of this isotope was released than would be
predicted assuming the oxide form dictated volatility. Enhanced volatility of 140Ba has been observed
during experiments designed to replicate extreme accident conditions when H2/H2O ratios exceeded 100
(9, 15, 17‐18), suggesting that little or no steam remained within the primary containment vessels prior
to venting. These observations have been attributed to the fact that barium is one of the few elements
whose metallic form is more volatile than its oxide form (10). These findings warrant the exclusion of 140Ba data from the empirical model in Figure 4.
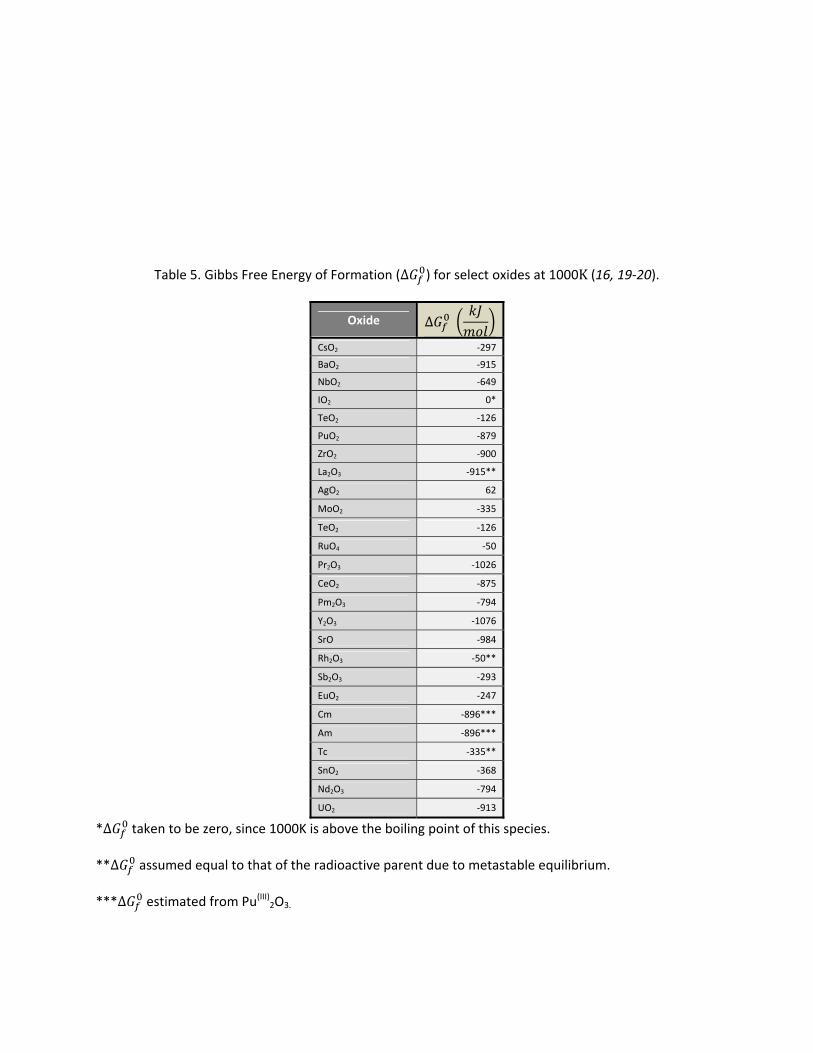
Table 5. Gibbs Free Energy of Formation (∆ ) for select oxides at 1000K (16, 19‐20).
Oxide ∆
CsO2 ‐297
BaO2 ‐915
NbO2 ‐649
IO2 0*
TeO2 ‐126
PuO2 ‐879
ZrO2 ‐900
La2O3 ‐915**
AgO2 62
MoO2 ‐335
TeO2 ‐126
RuO4 ‐50
Pr2O3 ‐1026
CeO2 ‐875
Pm2O3 ‐794
Y2O3 ‐1076
SrO ‐984
Rh2O3 ‐50**
Sb2O3 ‐293
EuO2 ‐247
Cm ‐896***
Am ‐896***
Tc ‐335**
SnO2 ‐368
Nd2O3 ‐794
UO2 ‐913
*∆ taken to be zero, since 1000K is above the boiling point of this species.
**∆ assumed equal to that of the radioactive parent due to metastable equilibrium.
***∆ estimated from Pu(III)2O3.

Figure 4. Eoxygen po
The empi
(and temp
relative to239,240Pu/1
comparab
when usin
Other Rad
It is possib
the ventin
volatile ra
model pre
damaged
present in
areas), ca
radioactiv
Estimated fraotential of the
rical fit shown
perature) tha
o 137Cs was es37Cs ratios in
ble result for t
ng the empiri
dionuclides no
ble that, cons
ng of units 1,
adionuclides)
edictions of t
reactor Units
n the environ
lculated using
ve isotopes pr
action of isotoeir dominant
n in Figure 4 c
t venting occ
stimated to b
soil compare
the fraction o
cal model fro
ot Measured
sidering the u
2, and 3, hard
could have e
he total activ
s 1, 2, and 3 p
ment 1, 30, 3
g the empiric
redicted to be
ope released oxide form.
can be used t
curred. As disc
e 0.0016% + 0
ed to the pred
of the plutoni
om Figure 4 a
but of Poten
uniqueness of
d‐to‐detect ra
escaped detec
ity of several
prior to ventin
300, and 3000
cal relationshi
e within the e
from Units 1
to correct for
cussed earlie
0.0031% (exp
dicted invento
ium released
nd the ∆ fo
tial Environm
f the radionuc
adionuclides
ction thus far
isotopes rela
ng (solid line)
0 days after ve
ip provided in
environment
and 3 as a fu
r fractionation
r, the fraction
panded uncer
ories within t
into the envi
or PuO2(s) from
mental Concer
clides release
released in s
by first respo
ative to 137Cs
). Relative act
enting are als
n Figure 4. Se
after 300 day
nction of the
n due to volat
n of plutonium
rtainty) based
he fuel prior
ironment is o
m the literatu
rn
ed into the en
ignificant qua
onders. Figur
present with
tivities of tho
so shown in F
even of the tw
ys have thus f
e equilibrium
tility at the ti
m released
d upon the
to venting. A
obtained (0.00
ure.
nvironment d
antities (more
e 5 provides
in the fuel of
se isotopes
Figure 5 (shad
welve most
far eluded
me
A
035%)
uring
e
the
ded
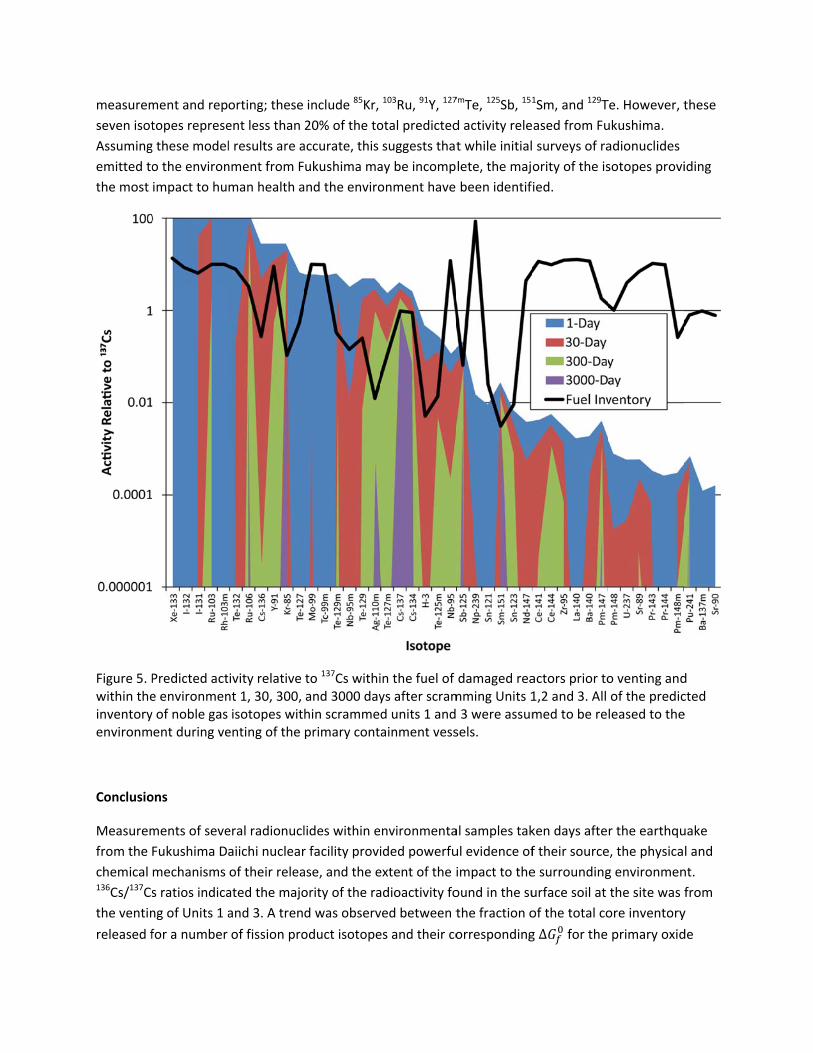
measurem
seven isot
Assuming
emitted to
the most
Figure 5. Pwithin theinventoryenvironm
Conclusio
Measurem
from the
chemical 136Cs/137Cs
the ventin
released f
ment and rep
topes represe
g these model
o the environ
impact to hu
Predicted acte environmeny of noble gas ent during ve
ons
ments of seve
Fukushima D
mechanisms
s ratios indica
ng of Units 1 a
for a number
orting; these
ent less than
l results are a
nment from F
man health a
tivity relative nt 1, 30, 300, isotopes witenting of the
eral radionucl
aiichi nuclear
of their relea
ated the majo
and 3. A tren
of fission pro
include 85Kr,
20% of the to
accurate, this
ukushima ma
and the enviro
to 137Cs withiand 3000 dayhin scrammeprimary cont
lides within e
r facility provi
ase, and the e
ority of the ra
d was observ
oduct isotope
103Ru, 91Y, 127
otal predicted
suggests that
ay be incomp
onment have
in the fuel of ys after scramd units 1 andainment vess
nvironmenta
ided powerfu
extent of the i
adioactivity fo
ved between t
es and their co
7mTe, 125Sb, 151
d activity rele
t while initial
lete, the maj
been identif
damaged reamming Units 1 3 were assumsels.
al samples tak
ul evidence of
impact to the
ound in the su
the fraction o
orresponding
1Sm, and 129T
ased from Fu
surveys of ra
ority of the is
ied.
actors prior to1,2 and 3. All med to be re
ken days afte
f their source
e surrounding
urface soil at
of the total co
g ∆ for the
Te. However, t
ukushima.
adionuclides
sotopes provi
o venting andof the predicleased to the
r the earthqu
e, the physica
g environmen
the site was f
ore inventory
primary oxid
these
iding
d cted e
uake
l and
nt.
from
y
de

form of the isotope, suggesting that release was dictated primarily by chemical volatility driven by
temperature and reduction potential within the primary containment of the vented reactors. The
absence of any major fractionation beyond volatilization and the anomalously high fraction of 140Ba
released suggested that all coolant from within the primary containment vessel had evaporated prior to
venting. The estimated fraction of the total inventory released of the more volatile elements (tellurium,
cesium, iodine) within the spent fuel from the vented reactors indicated the damage to fuel bundles was
likely extensive, minimizing any potential containment by physical transport of these species through
the fuel matrix and across the cladding wall. 238Pu/239,240Pu ratios close‐in and up to 45 km from the
facility indicated that the damaged reactors were the major contributor of plutonium to surface soil at
the source, but also that this contribution likely decreased rapidly with distance from the facility. The
fraction of the total plutonium inventory released from Units 1, 2 and 3 was estimated to be ~0.003%,
relative to the assumed total release of 137Cs, based upon plutonium/cesium isotope ratios relative to
the within‐reactor modeled inventory prior to venting. This was also consistent with an independent
model evaluation that considered chemical volatility based upon measured fission product release
trends. Volatile radionuclides with high activities within the spent fuel at the time of venting have been
identified. Seven of the twelve most active isotopes predicted to be residing within the environment
after 300 d (including 85Kr, 103Ru, 91Y, 127mTe, 125Sb, 151Sm, and 129Te) have gone undetected thus far,
possibly due to difficulties in their measurement or potential inaccuracies with the model presented
here. Until these inconsistencies are addressed, we offer these isotopes as potential analytes of concern
for future environmental surveys around the site.
Acknowledgements
We would like to acknowledge Dr.’s Thomas Zemanian, Michaele Brady‐Rapp and Gregg Lumetta for
their thoughtful reviews and comments. We would also like to acknowledge Lisa Staudinger, Courtland
Johnson and Duane Balvage for their help with technical editing and graphics. This research was
conducted by Pacific Northwest National Laboratory under DOE contract number DE‐AC06‐76RLO‐1830.
References
1. Institute of Nuclear Power Operations, “Special Report on the Nuclear Accident at the Fukushima Daiichi Nuclear Power Station” (Institute of Nuclear Power Operations, 2011).
2. L. J. Baker, L. C. Just, “Studies of metal‐water reactions at high temperatures. III. Experimental and theoretical studies of the zirconium‐water reaction” ANL‐6548 (Argonne National Laboratory, 1962).
3. OECD, “Nuclear fuel behaviour in loss‐of‐coolant accident (LOCA) conditions” (Organisation for Economic Co‐operation and Development Nuclear Energy Agency, 2009).
4. T. J. Yasunari et al., Proc. Nat. Acad. Sci. USA 108, 19530 (Dec 6, 2011). 5. A. Stohl et al., Atmos. Chem. Phys. Discuss. 11, 28319 (2011). 6. Japan Ministry of Education, “The results of various types of analysis of plutonium and strontium
from the Ministry of Education” (Japan Ministry of Education Nuclear Emergency Response Support HQ, 2011).
7. T. W. Bowyer et al., J. Env. Radioactiv. 102, 681 (Jul, 2011).

8. TEPCO, "Press Releases ‐ April 8, 2011" in TEPCO News (Webpage). http://www.tepco.co.jp/en/press/corp‐com/release/index1104‐e.html. Last updated 2012.
9. D. Cubicciotti, B. R. Sehgal, Nucl. Technol. 65, 266 (1984). 10. A. G. Croff, Nuclear Technology 62, 335 (1983). 11. S. A. Bryan, T. G. Levitskaia, A. M. Johnsen, C. R. Orton, J. M. Peterson, Radiochimica Acta 99,
563 (2011). 12. K. Hirose, Y. Igarashi, M. Aoyama, T. Miyao, in Plutonium in the Environment, A. Kudo, Ed.
(Elsevier, Amsterdam, Netherlands, 2001), pp. 251‐266. 13. T. Sekiguchi, “Japan Discovers Plutonium Far From Crippled Reactor,” The Wall Street Journal,
October 2, 2011 2011. 14. TEPCO, "Press Releases ‐ July, 2011" in TEPCO News (Webpage).
http://www.tepco.co.jp/en/press/corp‐com/release/index1104‐e.html. Last updated 2012. 15. H. Albrecht, H. Wild, paper presented at the Topl. Mtg. Fission Product Behavior and Source
Term Research, Snowbird, Utah, July 15‐19 1984. 16. R. R. Hobbins, D. A. Petti, D. L. Hagrman, Nuclear Technology 101, 270 (Mar, 1993). 17. D. Cubicciotti, B. R. Sehgal, Nuclear Technology 67, 191 (1984). 18. R. P. Wichner, R. D. Spence, Nuclear Technology 70, 376 (1985). 19. T. B. Reed, Free Energy of Formation of Binary Compounds. (MIT Press, Cambridge, MA, 1971). 20. D. R. Stull, H. Prophet, JANAF Thermochemical Tables, NSRDS‐NBS 37. (U. S. Department of
Commerce, National Bureau of Standards, Washington, D. C., 1971).
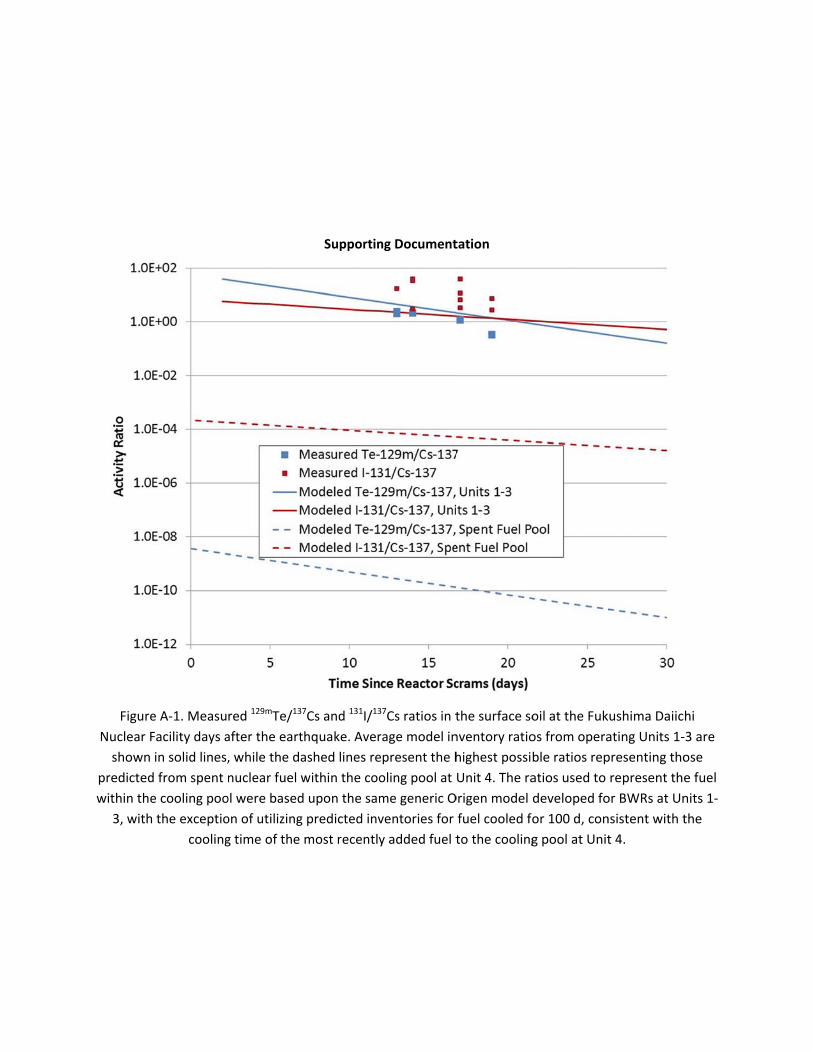
Figure
Nuclear F
shown
predicted
within the
3, with
e A‐1. Measu
Facility days a
in solid lines,
d from spent n
e cooling poo
the exceptio
cooling
red 129mTe/137
after the eart
, while the da
nuclear fuel w
ol were based
on of utilizing
g time of the
Supportin
7Cs and 131I/13
hquake. Aver
ashed lines re
within the coo
upon the sam
predicted inv
most recently
ng Document
37Cs ratios in t
rage model in
epresent the h
oling pool at
me generic O
ventories for
y added fuel t
tation
the surface so
nventory ratio
highest possi
Unit 4. The ra
Origen model
fuel cooled fo
to the cooling
oil at the Fuk
os from opera
ble ratios rep
atios used to
developed fo
or 100 d, con
g pool at Unit
ushima Daiic
ating Units 1‐
presenting tho
represent the
or BWRs at Un
nsistent with t
t 4.
hi
3 are
ose
e fuel
nits 1‐
the