analysis & interpretation of financial reports · analysis & interpretation of financial...
TRANSCRIPT

Analysis & Interpretation of
Financial Information
USQ UNIVERSITY OF SOUTHERN QUEENSLAND
MBA - ACC5502
Accounting & Financial Management / S1 / 2013
M B G Wimalarathna
(ACA, ACMA, ACIM, SAT, ACPM)(MBA–USJ/PIM)

In simple term, Analysis of Financial Information (AFI) is a mechanism used to
re-produce financial information/data which are already prepared and
presented in a formal manner.
Further, AFI is an analytical tool which expresses already reported
Financial/Non-Financial information in relative terms.
AFI requires stakeholders (Internal, Inter-related & External) to take decisions
& form opinions on entity’s past & future performance and position.
AFI - Techniques/methods
Trend Analysis. (Analyze past & do predict)
Horizontal Analysis. (Current Vs Previous)
• Vertical Analysis. (Current Vs Current)
Ratio Analysis. (Mix of all above)
Discuss how to use in decision making? What are the key shortcomings?
When can’t use?
2 wimal
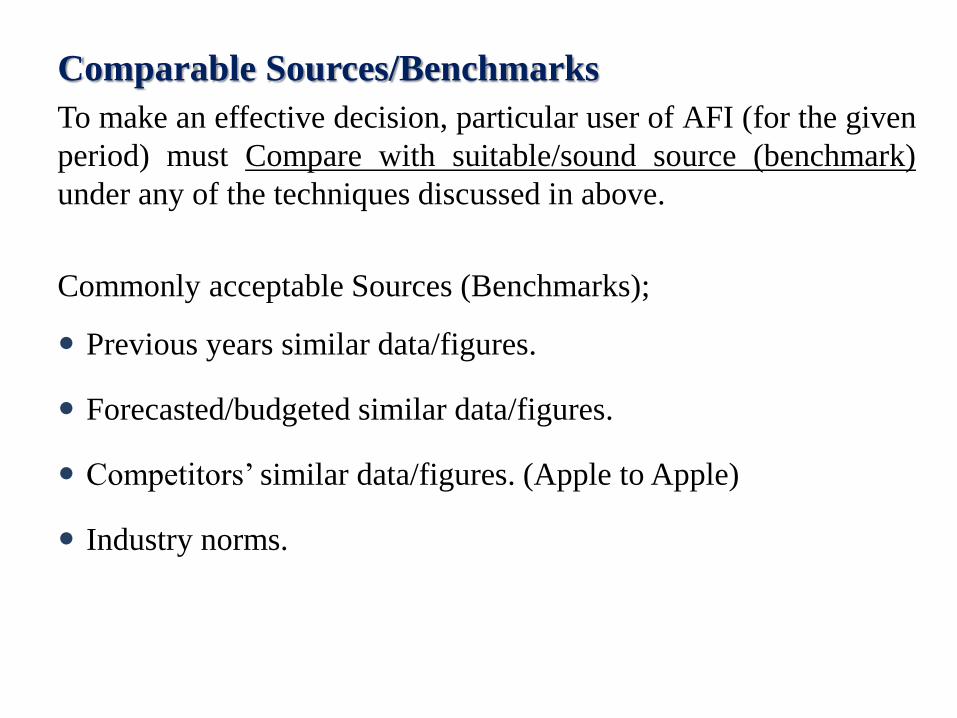
Comparable Sources/Benchmarks
To make an effective decision, particular user of AFI (for the given
period) must Compare with suitable/sound source (benchmark)
under any of the techniques discussed in above.
Commonly acceptable Sources (Benchmarks);
Previous years similar data/figures.
Forecasted/budgeted similar data/figures.
Competitors’ similar data/figures. (Apple to Apple)
Industry norms.
3 wimal

Ratio Analysis
Ratio Analysis is the most common/well known
technique used in AFI.
Key Categories,
Profitability.
Efficiency. View point of the
Liquidity. Company.
Gearing/Capital Structure.
Investors/Market Performance. (Investors’ point of
view.)
4 wimal

Profitability Ratios
Profitability ratios Primary Secondary
Primary
1. ROE. (Return On Equity) NP.atri O/SHS. x100
What? Avg. Equity
How to calculate?
2. ROA. (Return On Assets) EBIT x100
What? Avg. Assets
How to calculate?
5 wimal
What does this measure & indicate to users/Stakeholders?
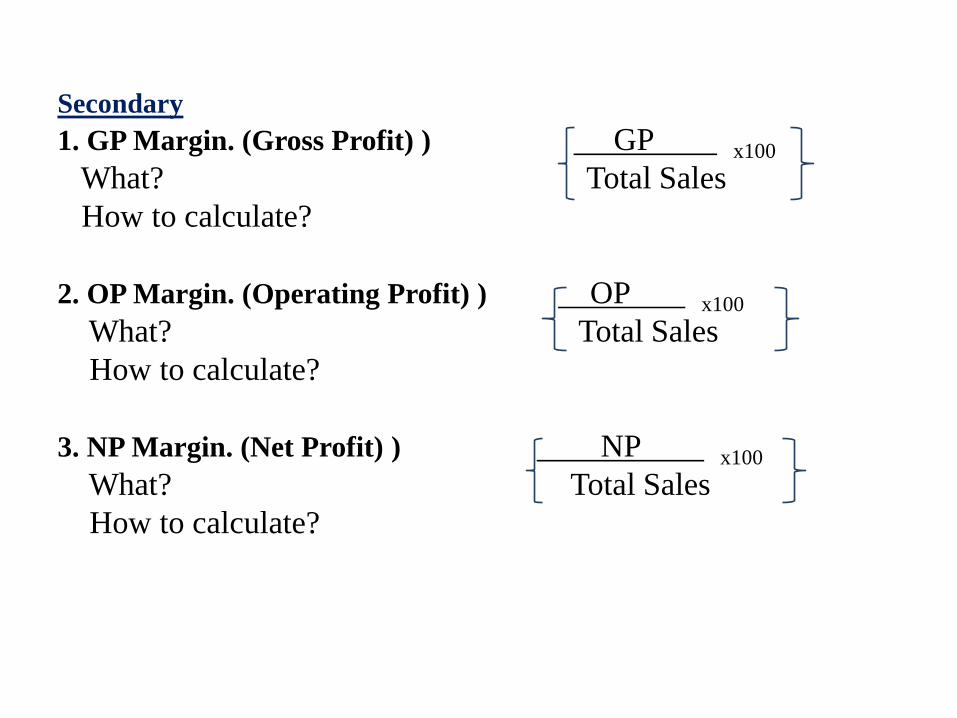
Secondary
1. GP Margin. (Gross Profit) ) GP x100
What? Total Sales
How to calculate?
2. OP Margin. (Operating Profit) ) OP x100
What? Total Sales
How to calculate?
3. NP Margin. (Net Profit) ) NP x100
What? Total Sales
How to calculate?
6 wimal

Efficiency Ratios
1. Asset Turnover Ratio Total Sales
Avg. total Assets
What? (Times / x)
How to calculate?
2. Inventory/Stock Turnover Ratio
Cost of Sales
What? Avg. Stock
How to calculate?
3. Debtors Turnover Ratio
Total Credit Sales
What? Avg. Drs.
How to calculate?
7 wimal
What does this measure & indicate to users/Stakeholders?

4. Stock Residency Period - Direct/Indirect
Avg. Stock x 365/50/12
What? Cost of Sales
How to calculate?
5. Debtors Collection Period - Direct/Indirect
Avg.Debtors x365/50/12
What? Total Credit Sales
How to calculate?
6. Activity Cycle
SRP + DCP
What?
How to calculate?
• If Figures are not available, how to perform the calculation?
8 wimal

Liquidity Ratios
What does this measure & indicate to users / stakeholders?
1. Current Ratio. CA
CL
What?
How to calculate?
2. Quick Asset/Acid Test Ratio. (CA - St.)
CL
What?
How to calculate?
3. Cash Flow Ratio.
NCF. OP. act
CL
What?
How to calculate?
9 wimal

Gearing/Capital Structure Ratios
1. Debt to equity Ratio.
Total Liabilities x 100
What? Total Equity
How to calculate?
2. Debt Ratio.
Total Liabilities x 100
Total Assets
What?
How to calculate?
1
0 wimal
What does this measure & indicate to users / stakeholders?
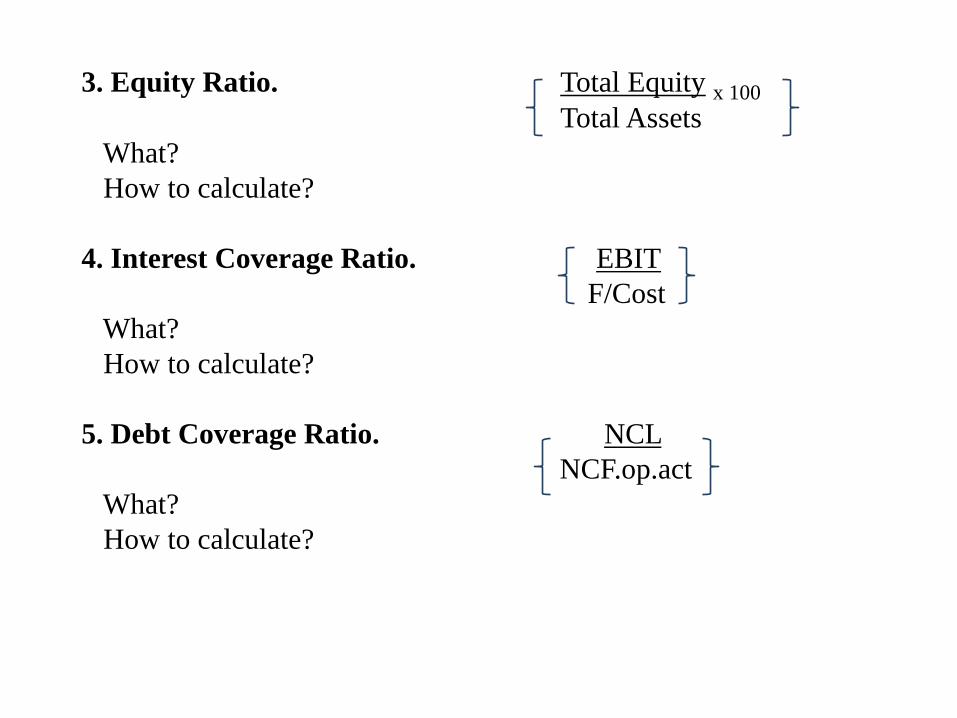
3. Equity Ratio. Total Equity x 100 Total Assets
What?
How to calculate?
4. Interest Coverage Ratio. EBIT
F/Cost
What?
How to calculate?
5. Debt Coverage Ratio. NCL
NCF.op.act
What?
How to calculate?
11 wimal
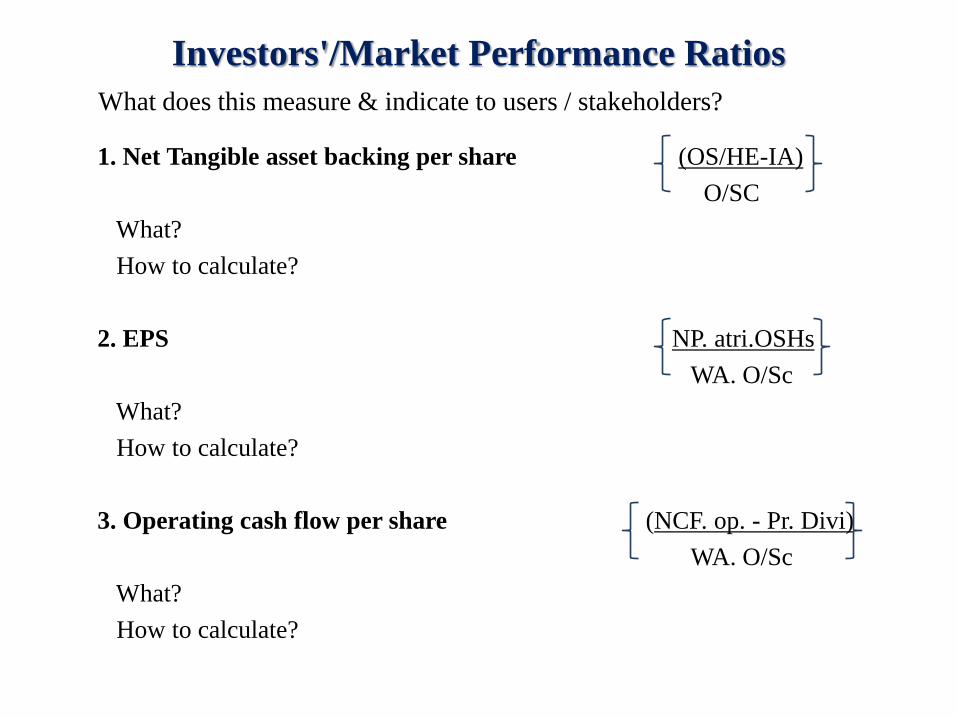
Investors'/Market Performance Ratios
1. Net Tangible asset backing per share (OS/HE-IA)
O/SC
What?
How to calculate?
2. EPS NP. atri.OSHs
WA. O/Sc
What?
How to calculate?
3. Operating cash flow per share (NCF. op. - Pr. Divi)
WA. O/Sc
What?
How to calculate?
1
2 wimal
What does this measure & indicate to users / stakeholders?
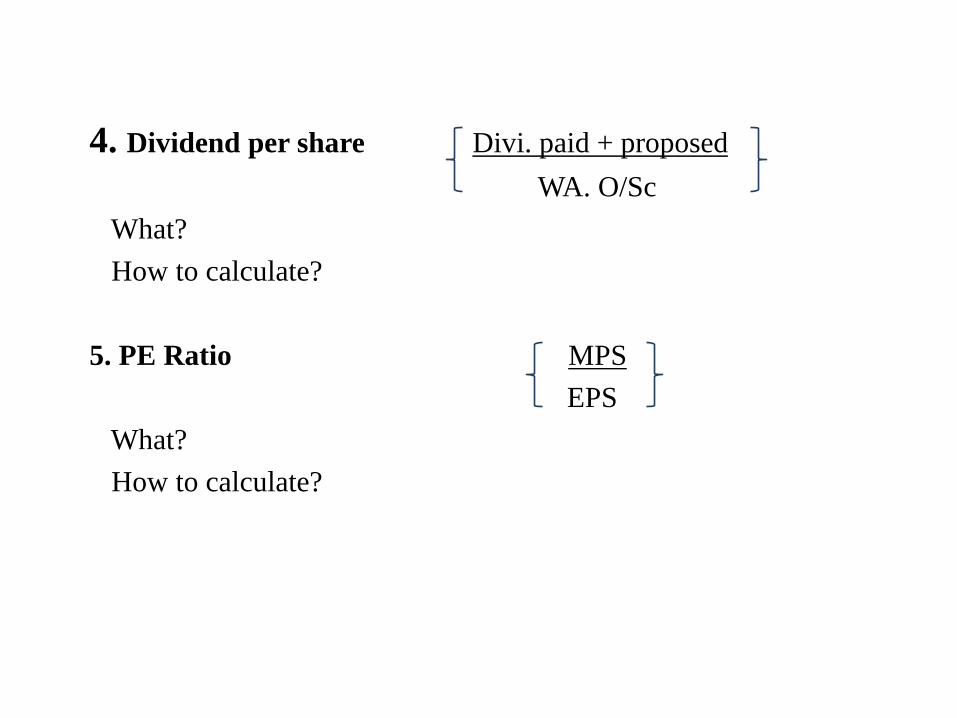
4. Dividend per share Divi. paid + proposed
WA. O/Sc
What?
How to calculate?
5. PE Ratio MPS
EPS
What?
How to calculate?
1
3 wimal

Ratio Analysis Vs Other Techniques Why Ratio Analysis become most popular?
Is Ratio Analysis the best for AFI? Shortcomings of ratio analysis.
End Product of the AFI End Product / result of AFI under any techniques / methods used is writing a report.
Is writing a report so important?
Guidelines for effective report writing.
Format
Language
be polite
be specific
be simple (do not use Technical Jargon)
be focus
1
4 wimal
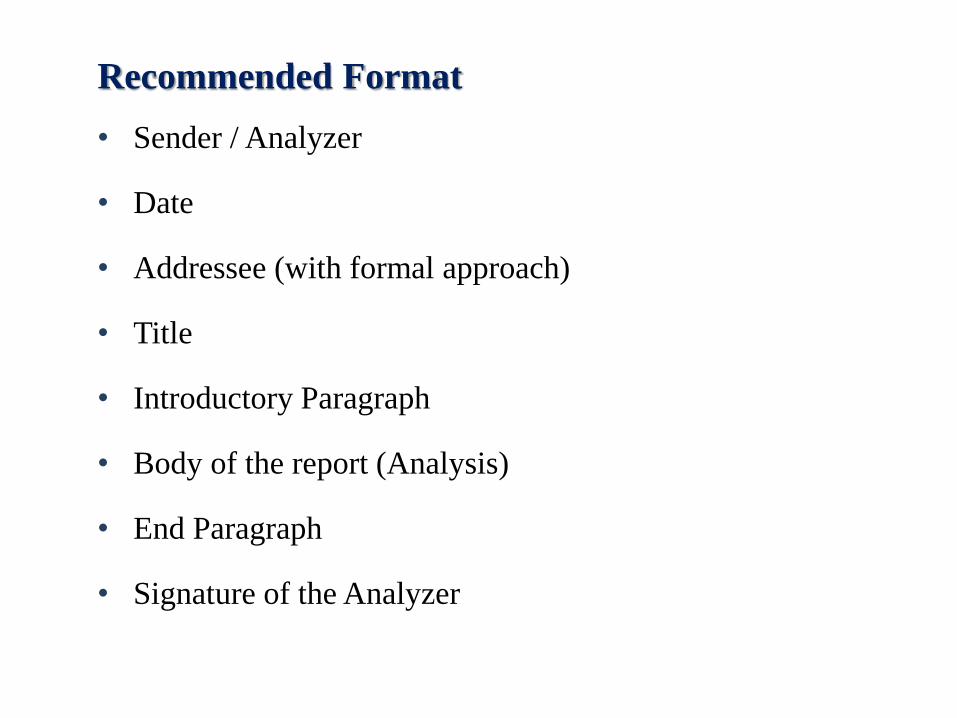
Recommended Format
• Sender / Analyzer
• Date
• Addressee (with formal approach)
• Title
• Introductory Paragraph
• Body of the report (Analysis)
• End Paragraph
• Signature of the Analyzer
15 wimal