analysis customer satisfaction of food service in commons
TRANSCRIPT
Rochester Institute of Technology Rochester Institute of Technology
RIT Scholar Works RIT Scholar Works
Theses
1999
Analysis customer satisfaction of food service in Commons at Analysis customer satisfaction of food service in Commons at
RIT RIT
Yi-Heng Wu
Follow this and additional works at: https://scholarworks.rit.edu/theses
Recommended Citation Recommended Citation Wu, Yi-Heng, "Analysis customer satisfaction of food service in Commons at RIT" (1999). Thesis. Rochester Institute of Technology. Accessed from
This Thesis is brought to you for free and open access by RIT Scholar Works. It has been accepted for inclusion in Theses by an authorized administrator of RIT Scholar Works. For more information, please contact [email protected].

Analysis Customer Satisfaction ofFood Service in Commons at RIT
by
Wu, Yi-Heng
A project submitted to the Faculty of the School ofFood, Hotel and Travel
Management
at
Rochester Institute ofTechnology in partial fulfillment of the requirements
for the degree ofMaster ofScience
February, 1999
ROCHESTER INSTITUTE OF TECHNOLOGY
School of Food Hotel and Travel Management
Department of Graduate Studies
M. S. Hospitality-Tourism Management
Presentation of Thesis I Project Findings
N a m e :_--=Y"""'i=--....;1;H~e"'"'n~g_~W~u _ Date: 3/17/99 SS# _
Title of Research: Analysis Customer Satisfaction of Food Service
in Commons at RIT
Specific Recommendations:
Thesis Committee: (1) Dr _ Richard Marecki
(2) _
or (3) _
Facu Ity Ad vis 0 r: __....JD""r.........~C-=l-=i~n'""t~o~n~J~- _W~a-=l-=l_=i~n!.:;;gut"'"'o<...!on..!....._ _
Number of Credits Approved: _
i-g-tfjDate Committee Chairperson's Signature
f/-%--77
Date Department Chairperson's Signature
Note: This form will not be signed by the DepartmentChairperson until all corrections, as suggested in thespecific recommendations (above) are completed.
cc: Departmental Student Record File OriginalStudent

Acknowledgments
I would like to thank Dr. Marecki and Dr. Wallington to be my adviser and
discuss with me patiently. I also would like to thank Paulette, the manger of
Commons at RIT to do survey liberally and entire staff and faculty in Commons. I
also have to thank myparents'
always supporting.
n

Abstract
Analysis Customer Satisfaction ofFood service in Commons at RIT
By Wu, Yi-Heng
School foodservice is the largest food-service business in the world.. Students and faculty
choose to have meals in the school, because they might lack the time and it is convenient.
However, The students in the college and university represent a hard-to please sort of consumers.
This study selected the specific cafeteria, Commons at Rochester Institute ofTechnology.
The students and faculty filled out the survey which focused on the food and asked students how
they felt about the food, what they liked and did not like and what foods they felt were served not
enough or too often. Additional question on the survey asked the students and faculty about their
feelings on the service and atmosphere of this dinning hall.
Last, this study also evaluated the survey and explored the overall satisfaction of the
students and faculty in the cafeteria, the analysis showed areas where satisfaction was being net
and also where improvement could be made.
Ill

TABLE OF CONTENTS
Page
Acknowledgments U
Abstract Ill
Table ofFigures VI
Table ofTables VII
Chapter I: Introduction 1
Problem Statement 2
Background 2
Purpose & Significance 4
Hypothesis 4
Scope and Limitation 4
Procedures and Long Range Consequence 5
Chapter II: Literature Review 7
American Food 7
Internal Service 8
Food Service 11
Customer Satisfaction 11
Chapter III: Methodology 13
Procedural Assumption 15
Ideological Assumption 15
Chapter TV: Analysis and results 16
Response Rates 16
IV

Respondent Description Data 17
ChapterV: Conclusion 24
Bibliography 26
Appendixes I: Questionnaires 30

Table ofFigures
Page
Figure 1 . The percentage sex of respondents 34
Figure 2. The percentage of respondents live on / off campus 35
Figure 3. How many times do customers eat in Commons per weeks 36
Figure 4. Age of respondents 37
Figure 5. Position of respondents 38
Figure 6, Customer satisfaction in general foodservice 39
Figure 7. The special dietary needs 41
Figure 8. Adequate hours ofoperation for customers 43
Figure 9. Customers suggested perfect hours for Commons 44
Figure 10. The percentage ofgeneral foodservice by living place 53
Figure 1 1 . Other food you would like more often 54
VI

Table ofTable
Page
Table 1. Percentage ofcustomer satisfaction in how frequency of
each food to be served by percentage 40
Table 2. Percentage ofcustomer satisfaction by each of item of
foodservice in Commons by percentage (%) 42
Table 3. How did the different positions of respondents feel about
operating hours in Commons by percentage (%), 45
Table 4. How much did different age of customers feel about operating
hours in Commons by percentage (%) 45
Table 5. How much were customer satisfied at speeding service in
Commons by percentage (%) 46
Table 6. How much did different age of respondents feel about the
serving speed in Commons by percentage (%) 46
Table 7. Crosstab between the frequency ofmeal and general service
by percentage 47
Table 8. Different position of customers who have meals in Commons
per week by percentage (%) 47
Table 9. Relation between cleanliness ofdining area and the
respondents'
position by percentage (%) 48
Table 10. The customer satisfaction of cleanliness of dining area and
age by percentage (%) 48
Table 11. The percentage ofcustomer satisfaction in the appearance of
dining area byrespondents'
positions(%) 49
Table 12. The percentage of customer v satisfaction in the appearance of

dining area by age (%) 49
Table 13. Relations between the meal which customers have and the
variety food 50
Table 14. Relations between quality of food and position of respondents by
percentage(%)51
Tablel5. Percentage of customer satisfaction in friendliness of servers by
age of respondents 51
Table16. Percentage ofcustomer satisfaction in consistency of service
by age of respondents 52
Table17. Percentage ofcustomer satisfaction about the general
foodservice in Commons by age 52
VIII

Chapter I
Introduction
Food service in a school was originally developed in Europe. It was
encourage school attendance as reforms stemming from the Industrial
Revolution and began to free society from the supposed necessity of child labor
(McCool, Smith, & Tucker, 1994). In the late twelfth century, Oxford University,
which was founded in England, started providing student living facilities. The
middle of 16th century, Harvard University, which was founded in the U. S,
supplied residence halls with dining rooms for all students as an administrative
responsibility of the university (McCool, Smith, & Tucker, 1994). AfterWorld
War II, there more customary formal seated meal service and leisurely meals
thatwas served speedily, along with some informal self-service in residence
halls. Today, most campus dining in colleges provides awide variety of services.
School foodservice is the world's largest food-service business
(VanEgmond-Pannell, 1974). In 1992, nearly 25 million children were served
lunch each day as part of the National School Lunch Program; nearly five
million received breakfast daily (Heimstra, 1992; Mary, Jeannie & Josephine,
1992). Moreover, around 15 billion US dollars were projected in sales for school
food-service operations, making schools the fourth largest segment of the food-
service industry ("Operators Step Cautiously into1992,"
1992; Gregoire, Sneed,
& Martin, 1992). In 1994, educational food services, which includes elementary,
secondary school, college and child care, sold nearly 27 rnillion US dollars of
service.
The students in the college and university represent ahard-to-please sort
of consumer. The common complaint about the food provided by school or
college food service includes food that is starchy, non-nutritious, loaded with
calories, or monotonous (Khan, 1991). Students and faculty choose to have
meals in the school, because they might lack the time and it is convenient.
Moreover, students also consider the large amount and variety of food provided
for the price. Consideration should be given to the fact that students like to eat
out after supper or late at night, particularly during examination periods. Also,
they may have to eat at times other than the scheduled meal hours because of
class schedules. For these reasons, residence halls often provide continuous
food service for the major part of the day (Khan, 1991).
Problem Statement
Many foodservice competitors are located near the school. The cafeterias
in schools change the menu to provide variety of food. Students and faculty are
not completely satisfied with food service operation in the dining halls. This
study will determine the percentage of satisfied students and faculty who have
meals in the residence hall, Hettie L. Shumway Dining Common's at the
Rochester Institute ofTechnology (RIT), in Rochester NY.
Background
RIT has seven colleges, including the world renowned National Technical
Institute for the Deaf (NTID). About 13,000 students attend RIT here, and 1,100
students are deaf or hard-of hearing. Hettie L. Shumway Dining Commons is
2
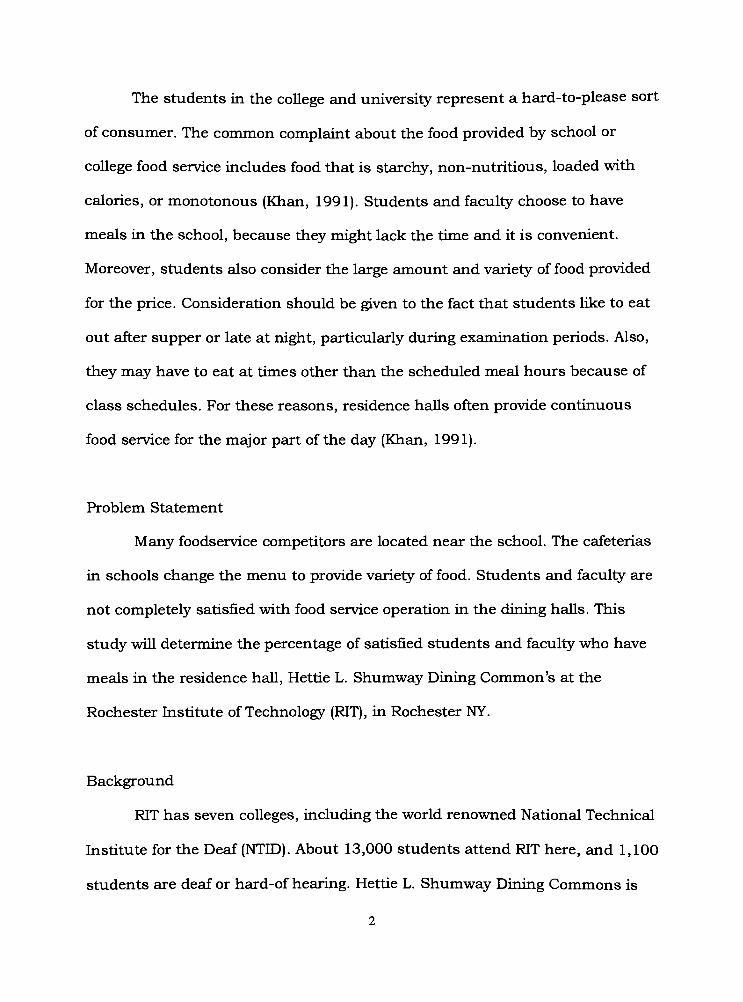
located in the residence hall and provides food service to the resident students
and faculty on campus. The cafeteria is divided into the kitchen, storage, office,
dishwashing area, serving area, beverage area dining area and the Grind which
is a coffee shop. There are about 350 seats in the cafeteria, including the Grind
area. Generally, the cafeteria and Grind provide more than 250 meals every
day. There are two managers, 15 full-time employees, including 2 supervisors, 4
cashier, 3 cooks, 3 for salad bar, a receiver, a dish-washer, an employee for
Grind and more than 85 part-time employees that include staff and student
employees. TheCommons'
opens seven day a week:Monday- Thursday from
8:30AM- 10:00PM, Friday from 8:30AM-8:00PM and Saturday/ Sunday
froml2AM-8PM
TheCommons'
opens for the all students, staff and faculty of school. The
Commons'
staffmakes all signs for price and food. People can pay for the meal
with cash orwith a debit card. Basically, a deli bar and gill bar are offered every
day. The salad bar changes the type of dressing very often. The entree bar is
always changed to give the students and faculty various choices. Beverages
include soda, juices, rnilk and hot coffee. The Commons also provides various
shakes and coolers.
Food service is essential in every school today. The college cafeteria is a
very important public place for students and faculty to relax and to
communicate. It creates a time and place where students can congregate and
socialize with other students. The Commons at RIT is located in a residence hall
that also offers meals for students who live in the dormitory. Some of students
might have meals in this dining hall every day. They spend time enjoying a meal
with their friends. Some students also can have a late supper after class or
studying. Students and faculty in the college would like not only to have high
quality food, but also to have a good atmosphere for the meal.
Purpose 85 Significance
The purpose of this study evaluates the extent to which the resident
students and faculty at RIT are satisfied or dissatisfied with the existing food
service operation in Commons. The study will determine what customers would
like and what service could be improved to reach a better level of satisfaction.
Hypothesis
In this study, we will find out some points of customer dissatisfaction
during service processing. Customers could be tired of eating the similar food
for every meal. Theymight not have the patience to wait in line. Students and
staffmight need high quality food, but also speedy service. Theymight need a
variety of food, because they have everymeal at school. Theymight complain
that the food is not worth of price. Definitions use in this study are:
Scope and Limitation
The study is limited to student customers, the institute staff, and the
faculty eating at Commons of RIT. The survey will be completed on1st
December to 13 December, 1998. The participants who were selected affected
the study. Student and faculty customers usually preconceive notions about
how something should be in school cafeteria. Some of those thoughts that could
4

have influenced the data collected were: people deserve value for their money,
people want the quick and friendly food service, and people would like to have
high quality food.
The studywas affected by the participants who were selected. Just the
fact that they were asked to participate may have caused them to answer the
questions in a positive manner or theymay have used it to voice some of their
personal frustrations.
The study focused attention on the customer immediately and that
usuallymakes the customer feel important. The studywas to find out what the
student and faculty customers in school current perceptions of food service on
campus are and what they expect the school cafeteria to be. While conducting
the research, more information aboutwhat the customer wants out of food
service on campus. In the analysis of the data, it will be determined if
customers are satisfied at the general foodservice in commons and if food would
be served properly.
Procedures and Long Range Consequences
The study will be divided into three steps. First the diriing hall mangers
will be interviewed to determine the type of food provided every day, and what
services are offer for customers.
Second, a questionnaire that includes general information for the survey,
how the customers feel about food quality, menu section, and the general

service. The survey will be collected after the peoplecompleted it.
Questionnaires will cover the breakfast, lunch, dinner, and late nightsupper.
The data will be analyzed.
Finally, to analyze negative issues and recommended the improvement.
The study would be a good source for improving the customer satisfaction for
the school foodservice manager.

Chapter II
Literature Review
Americanfood
Generally, food in residence halls is typical American fast food that is
easy to cook and serve. It can be divided into several types:
Classic American Burgers are on both fine-dining and fast-food menus,
in institutional food-service and on the backyard grill (Bartlett, 1994). The
restaurants and Institutions (R 85 I) Menu Census found hamburgers on 77% of
American menus and cheeseburgers on 73%.
Hot Dog, Frankfurters, is kind of a smoked, spiced, pork-and beef
German link sausage, that were served and sold in American as early as 1860
in pushcarts in New York City. There are two regional hot dog styles. One is
NewYork style that is a hot dog garnished only by mustard and sauerkraut.
The other is Chicago style that is a hot dog and a"garden"
of sliced tomatoes,
cucumbers, green pepper, and shredded lettuce.
Great American Finger Feast is fried chicken that started from southern
states. Fired chicken in Maryland is served with cream gravy and Kentucky
fried chicken doesn't come with gravy. Today, chicken fingers are popular food
in the fast food industry.
There are two kinds of pizza which usually are provided in a school
cafeteria. Roman style pizza is made with potatoes, garlic, crumbled rosemary

or sage with cheese and tomato sauce. American pizzas also are divided into
New York-style, thin-crust pizza and
Chicago-style, deep-dish pizza.
The Mexican-American Taco Salad is one of top entree salads in the
American menu. The burrito made with retried beans and cheese stuffed in a
tortilla is a version of an authentic regional Mexican dish.
Fajita consists of broccoli, carrots, green peppers, onion, zucchini,
mushrooms, tomato and a banana pepper sauteed with Mexican seasoning. The
Sino-American Stir-Fry is one of the most immediately recognizable Asian
influences onWestern menus. According to the R8sl Menu Census, 51% of all
food-service operations offer an Asian entree. Stir-fry is actually a cooking
technique, but it has become a catchall name for various dishes. Entrees
service is limited to one entree, one vegetable, and a starch
Internal service
Managing people is one of the most challenging of all the jobs of an
administrator or supervisor (VanEgmond-Pannell,1974). The people in an
operation their attitudes, abilities, desires and interests influence the
success or failure of the operation. According to Dorothy's study (1974), five
factors influence to amount of labor needed: what kind of foodservice system is
used, howmanymeals are served; what menus are used; how long does the
meal period, what type of food is used.

According to the US Department of labor (1990), there was a 20%
increase in the number ofAmerican employee who worked 35 hours a week or
less between 1980 and 1990 (Lundberg, 1994). The hospitality industry has
traditionally included a large number of part-time and flexible-time workers
(Perkins, 8b Cummings, 1994). In Perkins, and Cummings study (1994),
included 499 individuals whose current employment status was part-time. No
doubt students are the greatest potential source of part-time labor with roughly
one-third of potential part timers falling into this category. Homemakers are the
second group of people willing working in part-time (1 1%). Temporary
employees individuals employed in organizations for specific, limited periods of
time are one of the fastest growing segments of the workforce labor. (Perkins,
8s Cummongs, 1994)
According to the labor Department's "1995-96 National Postsecondary
Student AidStudy,"
only about 20 percent of students at public four-year
institutions were able to avoid both borrowing and working during that
academic year. Fewer than 15 percent took out loans and either did not work or
worked fewer than 15 hours per week. Conversely, more than 40 percent did
not borrow any money at all, but worked 15 or more hours per week. The
remaining 25 percent took out loans and worked 15 hours or more (King, 1998).
In King's study (1998), also mentioned that as opposed to working long hours,
borrowing does not seem to harmstudents'
persistence in college nor their
academic success. Recent results from the Department ofEducation's
longitudinal study show that students who borrow are just as likely to graduate

as those who don't. Of course, we don't students should not borrow more
money than they can reasonably afford to repay.
Students often work part-time for the food service during the peak
serving hours (Kinsella, 1978). Very few schools employ no students at all in
school food-service. Student workers can range from as few as 15 to as many as
1000, who may clean the serving line and the dining area; wash all the dishes,
silverware, pots and pans, and cooking utensils. However, colleges always have
problems dealing with short-sighted student employees. Students like to have
fun duringworking but that is not necessarily a problem employee who enjoys
theirworks are often more pleasant with customers.
In Inman and Enz's (1995) study of employee attitude, part-timefood-
service workers are less competent than are full-tinie workers. The part-time
food-service workers also have a weaker work ethic than do full-time workers.
The part-time food-service workers have a lower level of acceptance of the
organizational beliefs of restaurant cleanliness, cost control, honesty in guest
relations, quality presentation of food and service, and high food quality than
do full-time workers. However, part-time food-service workers have a lower
degree of value sirnilarity with management on the values of efficiency, profits,
adaptability, ethical behavior, company stability, quality, and service than do
full-time workers.
10

Food service
There are types of food service: residence hall dining service, student
union food-services, classroom building service, faculty service, and catering
service; provided on the university and college campuses which are like"mini-
cities."
Residence hall dining service is one of the most important components
of college and university food service.
Today, there are four basic types of foodservice in the college and
university, conventional, commissary, ready-prepared, and assembly/serve
systems. Firsts of all, conventional food-service systems traditionally have
utilized a skilled labor force for food production 13-14 hours per day. Second,
the commissary food service principles have been adopted in systems where
service areas are remote form, yet accessible to, the production center (Harger,
Shugart, 85 Payne-Palacio, 1994). Third, ready-prepared food service that has
more mass production frozen food should consider the storagefacilities'
equipment and food inventory. Fewer skilled employees can be trained to heat
and serve menu items, thus reducing the number of highly skilled workers
required by the system. Last, assembly/ serve food service which may achieve
operational objectives to provide client satisfaction, assumes a lack of skilled
food production employees, and an available supply of highly processed, and
quality food products (Harger, Shugart, 85 Payne-Palacio, 1994).
Customer satisfaction
Customer satisfaction/dissatisfaction began to emerge a major topic in
the field of consumer research in the late 1970s (Andreasen, 1977; Berkman 8s
11

Gilson.1986; Czepiel 8b Rosenberg, 1977; Handy, 1977; 8b Almanza, Jaffe, 8b Lin,
1994). Customer dissatisfaction occurs whencustomers'
expectations and
perceptions are not matched. Approximately one-forth of simply got angry and
left without complaining to the manger when they were dissatisfied (Warland,
Hoerrmann, 8b Willits,1975; and Barbara, Almanza, Jaffe, 8b Lin, 1994).
Nothing is ever good enough for some customers. Customers complain
about slow service, small displays, rude sales people, long queue, exchanging
difficulty and on.
Generally, the most important attributes to the customers in the
university cafeteria were quality of food, convenient location, cleanliness, and
reasonable price. These were all ranked in the top five in importance for all
meal periods (Almanza, Jaffe, 8b Lin, 1994).
Waiting in line is part of customer satisfaction. Federal Express, one of
the most famous and successful service companies and the first service
company to win the Malcolm Baldridge award, once advertised; "Waiting is
frustrating, demoralizing, agonizing, exasperating, annoying, time-consuniing,
and incrediblyexpensive"
(Daviddoff, 1994). No one can doubt the veracity of
the claim because at one time or another everyone has experienced the horrors
and frustrations ofwaiting. In service industries, where customers depend on
human interaction most of the time, waiting is unfortunately inevitable.
12
Chapter III
Methodology
This study will focus on one Academic institution. The sample will come
from that institution. It could give other colleges anduniversities'
ideas as to
how they can improve customer satisfaction. This allows service providers to
improve their service and operations and gives the food service managers a
chance to clearly understand their customers.
Providing the customers a good place to have their meal becomes very
important for the college society. This study will point out the importance of
customer satisfaction and high quality service at school food service. It will
figure out exactlywhat customers want and what customers expect for their
money.
This study will provide the positive and objective results of customer
satisfaction for the food service management. Giving direction to the manager
not only decreases the negative comments of customers, but gives management
a chance to understand what the customer reallywants and to improve their
food service. Because of this study, there is an opportunity to communicate
between the food service and its customers.
A questionnaire was developed for the customers, students and faculty of
the school cafeteria. The questions will be answered by a sample of people who
are having meals in the Commons. Data will be collected from the
13

questionnaires. An example of the survey can be found in Appendix A. these
questionnaires are very general and non-specific to the property.
Questionnaires include the quality of the food and the service. How is
food taste? Are conditions sanitary? How is the quantity of food? How long
should customers wait to be served? This study also askedcustomers'
kinds of
food they do really want to have every day and what they think should be
served frequency. Generally, a score will be given for servers and menus by
customers.
The survey was conducted from December 1st 1998 to December 13,
1998 for two weeks. The questionnaires were split to the breakfast time, lunch
time and dinner time. Every sample will be included to be measured effectively
for this study.
All of the statistical analysis presented in this study was performed on
the RIT VAX system at Rochester Institute ofTechnology. The analysis of the
data was conducted by employing three statistical procedures. First, descriptive
statistics included analysis ofmeans and standard deviation and then cross-
tabulation analysis of: food service and different age and position of
respondents. Next, frequency of food that was served and different position and
age of respondents and percentage of customer satisfaction and different age
and position of respondents. Last, factor analysis to identify underlying
constructs.
14

Procedural Assumption
The survey that was administered during the two weeks ofwinterquarter
of 1998. If this does not yield a large enough sample, the survey would be
continued until there is enough effective data for analysis.
Ideological Assumption
In this study, all the data were collected from the people who eat meals
in the Commons at RIT, both student and faculty. The analysis was done after
the collecting the data. I gave the objective and neutral criticism, but I did not
give any judgmentwhether positive or negative.
15
Chapter IV
Analysis and result
Response rates
The surveywas conducted two weeks during the academic period. Each
day the cafeteria served over 200 people for breakfast, lunch, supper, and
dinner. No respondent was asked to repeat to fill the questionnaires. Therefore,
every sample screened as to whether they have completed the survey. The
samples were selected conveniently. In this case, there were 102 respondents to
do this survey.
Consequently, there were forty three percent of sample of female and
57% of sample of male which were valid in this study (Figure 1). There were
72.2% of respondents staying on campus and 27.8% of people hving off campus
(Figure 2). The frequencies ofmeals that have been eaten per week at Commons
by samples were represented on Figure 3. Fifty-seven percent of the sample had
meals less than 4 times per week. Twenty-seven percent had meal's five to eight
times per week. The age of the respondents was 54.6% of age 18 to 20, 28.9% of
age 21 to 25, 3.1% of age 26 to 30, 8.2% of 31 to 40, and 5.2% of 40s (Figure 4).
The percentage of respondents by their school was presented on figure 5.
Thirty-seven percent of freshman and twenty-nine percent of sophomore were
the biggest group who had meals in Commons.
16

Respondent Description Data
The study found the percentage of customer satisfaction with way the
customers felt about food served in the cafeteria. Generally, people have good
feelings about having meals in the Commons. Around 60% of customers rated
the foodservice in the cafeteria as excellent or pretty good. Only five percent of
respondents who considered food service in Commons poor did not like their
meal there (Figure 6).. There were 74% of customer satisfaction of foodservice in
Commons.
Customer satisfaction could depend on how frequently of food was
served, how the server's attitude was and the environment of Commons which
were shown on Table 1 . Generally, customers feel most of food to be served was
just right. Wrap bar (54.6%), deli bar (74.2%), taco, pizza (59.8%), pita (59.8%),
grill (66%) and fried chickens (59.8%) were felt to be just right by more than 50
percent of sample. About one-third of customers in this survey felt hamburgers
(29.9%) were served too often. More than 50% of people said they seldom see
fish (48.4%), sea food (53.6%) and carver bar (55.2%) in cafeteria. Two-fifth
customers wanted more turkey cutlet (23.7%), faijtas (32%) and vegetables
(30%). Consequently, in Commons provided most of fast food and general food
served in the United States (Table 1).
However, some items of food would not be shown too often such as fish,
sea food, carver bar, and faijta. Some of people wantothers'
food more often
which is shown on Table 1, such as Chinese, Sushi or oriental. Few of
percentages of respondents would need some special dietary food (Figure 7).
17
Although about fifty percent of respondents shown on Table 1 felt each item of
food served just right in Commons, most of people were not feel too many types
served in here.
Foodservice quality in Commons was a high percentage of customer
satisfaction generally (Table 2) . Around 70% of people rated food taste and
dining area appearance, serving area cleanliness as pretty good of excellent.
Most of questions about each item of foodservice showed more than 90%
percent of customer satisfaction as in good, pretty good and excellent.
Especially there were more than 70% of pretty good and excellence customer
satisfaction in appearance of dining area and cleanliness of dining area.
Otherwise, items in variety of food (19.6%), speed of service (20.6%) and
conveniences of hours (26.8%) were considered poor and very poor.
Each item of questionnaire about the foodservice in Commons showed on
Table 2. Respondents evaluated by excellent, pretty good, good, poor and very
poor. Some valuations of foodservice which are more than 90% of customers felt
as good, pretty good or excellent of food service. However, some of items in
general foodservice have pretty low customer satisfaction. Such as the variety of
food was only one-third of samples rated as pretty good and excellent, the speed
of service was 40% of respondents who selected pretty well and excellent, and
the convenience of hours was more than 30% of customer dissatisfaction
shown.
18
Over 35% of customers do not feel convenience of hours that were
exhibited on the last item of table 2. Most of customers who do not like the
hour's operation in the Commons want longer hours (37%). Second, they would
like to open earlier for breakfast (29%). Customers also had 24 hour's
foodservice (8%), late night supper service(13%), and longer time on Saturday or
Sunday (13%) (Figure 8).
Freshman, sophomore and junior students were not be as satisfied about
as the graduate student and faculty (Table 3). About hours of operation, most of
freshman, sophomore and junior students stay in dorm without cars, so they
depend on meals at school. They are concerned seriously about the hours of the
cafeteria. The respondents whose age ranges between twenty-six and thirty
were pretty satisfied at operating hours in Commons(Table 4) . One-third of
freshman in this survey were not satisfied at the operating hours in Commons.
According to the survey results, the speed of service had high percentage
of customer dissatisfaction. Consequently, speed of service and the position
(Table 5) and ages (Table 6) of respondents were analyzed using a cross-
tabulation. The graduate students have a different vision for the speedy service.
Some people felt the speed of service in Commons was pretty good and
excellence (45%), but 55% of graduate students considered the foodservice slow.
However, senior students and faculty did not rate the speed of food service as
excellent. The percentage of customer satisfaction in freshman almost equally
split as excellence (28.6%), pretty good (20%), good (34.3%), and poor (17.1%).
Customers who were over 30 years old considered food service in this cafeteria
19
in average, but there was high satisfaction for speed of service in thetwenty-six
to thirty years old range. Speed foodservice should improve in this cafeteria.
The reason for the speed of service might depend on the server. In this case, it
would because of high number students hired without the professional skills to
serve. Consequently, it made the serving speed slow.
In different type of customers, senior, junior and sophomore students
have meals more frequently thanothers'
types of customers in Commons. These
three types of groups eating meals were about 50% of the total. However, the
biggest of group having meals in the Commons are freshman (37%). One- third
of freshman, 43.6% of sophomore, 71.4% ofjunior and 60% of senior had meals
in Commons more than four times per week (Table 7) . Moreover, most of
selected samples were the undergraduate students. Otherwise each of group
customers should be paid attention to. Having meals in the same place might
affect customer satisfaction (Table 8). The table shows that excellent general
service is reduced, when customers had more and more meals. People having
12 or more meals in Commons did not rate the food service excellent. Less than
20% of customers who ate more than 12 meals per week in the cafeteria felt it
provided pretty good service.
According to the table 2, there was pretty high percentage of pretty good
and excellent ratings on appearance of dining area (72%) and cleanliness of
dining area (65%). Freshman (77.1%), graduate students (75%), and
faculty/ staff (72.7%) have much higher satisfaction about the cleanliness of
dining area than the sophomore students (32.2%). However, this item has very
20

high customer satisfaction generally (Table 9). According to the Table 9, people
over 25 years old felt satisfied at the cleanliness of dining area more than those
less then 25 years old. In the age range between twenty-six to thirty, One
hundred percent of respondents felt satisfied about a clean dining area (Table
10).
Appearance of diningwas rated by more than 70 percent of the people as
in pretty good and excellent. Sophomore students had a high percentage of
dissatisfaction in this item (Table 1 l).The ages above twenty-six years old liked
to have meal in the dining environment that cafeteria provided (Table 12).
However, five percentages of customers considered the dining area poor.
According to the Table 1,one-fifth of the customers were not satisfied
with the various foods provided. The number of meals also affects the
satisfaction with various foods (Table 13). If people eat the same place too often,
they get bored with the regular food. People having meals in Commons more
than 12 times obviously scored the variety of food pretty low; more than 70% of
respondents rated as poor and good. The variety of foods should be a big factor
in increasing customer satisfaction.
Junior students considered the low food quality in Commons (Table 14).
There are 70% ofjuniorstudents'
samples rated the food quality less than good.
The cause would be high percentage ofjunior (71.4%) meals in Commons more
than 5 times per week. However, graduate students and faculty thought there
was pretty good quality food in the cafeteria. Thus, quality of food which
21

customers considered would depend on howmany meals ofmealpeople had
per week.
Friendliness and consistency of service were the effect customer
satisfaction in this study. Student from twenty to forty there were one hundred
percent of pretty good and excellent satisfaction in this item (Table 15).
However, people who were less satisfied with the service were 15.1% of the ages
between 18 to 20, and 30% of the age above 40. The consistency of service in
general does not have pretty good and excellent satisfaction. Moreover, two
percent of people who were age between eighteen and twenty years old felt very
bad in consistency service (Table 16). One-third of people's age in twenty-six
and thirty years old considered the consistency of service poor. The friendliness
and consistency of service should also be improved in order to increase the
customer satisfaction.
Last, the general customer satisfaction by the age and hving location
should be considered. Generally, there were notmuch obvious difference by
groups. However, a small group between 18 and 25 had a poor impression of
general service in the cafeteria (Table 17). Ninety-nine percent of those between
26 and 30 had responded above pretty good. Those above 40 responded as 40%
excellent and about 60% in good. Respondents who lived off-campus (21.7% on
excellent) felt more satisfied at the general service than the people who liveon-
campus (15.2% on excellent and 76% on poor) (Figure 9). Finally, there were
two questions to be answered other kinds of food you preferred in this cafeteria
22
and special dietary requirements. Sixty-two percent of sample wanted
something like Chinese, Sushi, or Oriental food (Figure 10).
23

Chapter V
Conclusion
Based on the findings of the study, several conclusions can be drawn.
First, the Commons considers the cafeteria on the residential side of campus. It
is supposed to provide the convenient hours and place for students, staff and
faculty. However, operating hours of the cafeteria are aweakness. People would
like to have longer serving hours such as until midnight, 24 hours, or brunch
offering during the Saturday and Sunday morning. In general, some of the
evening classes Students and faculty don't have enough time to stay long in the
cafeteria for dinner or supper. Thus, the longer hours for food service would be
the point to increase the customer satisfaction.
Second, various foods would be the weakness in customer satisfaction.
People who have meal in resident hall would eat frequency. However, the food in
the cafeteria should be more choices in the survey. Actually, most foods were
served just right bymost of respondents but some of people requested more
Chinese or Oriental foods. Third, people were dissatisfied at the speed of service
in this study. People having meal in the school would like to save more time to
eat off-campus. Especially, the lunch and dinner times would be the extreme
slow. There was a long queue in front of not only the service area, but also the
cashier.
24
Finally, the cafeteria has very clean, bright environment offeringto
customers. Most of people not only considered the clean and tasty food,but
also would like to need the neat equipment of cafeteria. Generally, most of
people were satisfied at the clean serving and dining areas. The appearance of
serving and dining areas also would be the strength in this survey.
25

Bibliography
Almanza, A. B., Jaffe W. 8b Lin, L. (1994) Use ofThe Service Attribute Matrix to
Measure Consumer Satisfaction. Hospitality Research Journal. 17(2), 63-74.
Andreasen, A. R. (1977). A taxonomy of consumer satisfaction/ dissatisfaction
measures. In K. H. Hund (Ed.), Conceptualization and measurement of
consumer satisfaction and dissatisfaction (pp. 11-35). Cambridge, MA:
Marketing Science Institute.
Bartlett. M. (Ed.) (1994). The best ofRestaurants 8b InstitutionsWinning
Foodservice Ideas, Illinois, John Wily 8b Sons.
Berkman, H. W., 8b Gilson, C. (1986), Consumer behavior: Concepts and
strategies (3rd ed.). Boston, MA: Kent Pubhsbing.
Czepiel, J. A., $ Hosenberg, L. J. (1977). The study of consumer satisfaction:
Addressing the "sowhat"
question. In H.K. Hunt (Ed.), Conceptualization and
measurement of consumer satisfaction and dissatisfaction (pp. 92-119).
Cambridge, MA: Marketing Science Institute.
DavidoffM. D. (1994) Contact Customer Service in the Hospitality and Tourism
Industry, New Jersey: Prentice Hall Career and Technology.
26

Eckel J. P. (1985). College 8b University Foodservice Management Standards,
Connecticut: Avi.
Gtegoire, B. M., Sneed, J. 8b Martin, M. J. (1992) School Foodservice: A looks to
The Future. Hospitality Research Journal. 17(1), 175-194.
Handy, C. R.(1977). Monitoring consumer satisfaction with food products. In
K.H. Hunt (Ed.), Conceptualization and measurement of consumer satisfaction
and dissatisfaction (pp. 215-239). Cambridge, MA: Marketing Science Institute.
Heimstra, S. (1992) Summary ofTrends. School Food service research Review,
16, 75-79.
Harger, F. V., Shugart, S. G. 8b Payne-Palacio, J. (Ed.) (1994). West's and
Wood's Introduction to Foodservice, New York: Macmillan.
Inman C 8& Enz, C. (1995) Shattering the Myths of the Part-time worker. Cornell
Hotel and Restaurant Adrninistration Quarterly, 36(5), 70.
Khan A. M. (1991). Concepts of Foodservice Operations and Management, New
York: Van Nostrand Reinhold.
King E. J. (1998) Too many Students are holding jobs for too many hours. The
Chronicle ofHigher Education (May). 44(34), A72
27

Kinsella S. and the staff of the Action Center(1978). Food on Campus: A Recipe
for Action. Pennsylvania: Rodale Press Emmaus.
Lundberg, C. C. (1994) Forms ofResistance by Temporary Hospitality
Employees, Hospitality Research Journal. 18(2), 128-134.
Lundberg E. D. (1993) The Restaurant From Concept to Operation, Illinois,
John Wily 8b Sons.
Managing Service Quality (1997). London: Paul Chapman Pub Ltd.
McCool C. A., Smith A. F. 8b Tucker L. D. (1994) Dimensions ofNoncommercial
Foodservice Management. Illinois: Van Nostand Reinhold.
Operators step cautiously into 1992, (1992). Restaurants 8b Institutions, 32-43.
Pappas, J. M. (1997). Eat Food Not Profits!. New York: Van Nostrand Reinhold.
Perkins, J. 8b Curnmings, P. (1994) A community Economic Development Survey
of Part- Time Labor: Implications for The Hospitality Industry. Hospitality
Research Journal. 17(3), 111-118.
Warland, R. H., Herrmann, R. O., & Willits, J. (1975). Dissatisfied consumers:
who upset and who takes action. Journal of customer affairs, 9, 148-163.
28

VanEgmond-Pannell D. (1974). School Foodservice, Connecticut: Avi.
29

Appendixes I
Questionnaires
Hi everybody:
I am a graduate student in the Hospitality-Tourism Management
Program. I am doing a project about food-service on campus. I need your
cooperation to complete this questionnaire for me. Please take the time to do
this survey carefully. I will appreciate your cooperation. Thank you.
1 What does you feel the hours of operation in theCommons'
are
adequate to your needs?
(1) Yes
(2) No
If no, what would you like to see changed about the hours?
2. How would you rate this food service on each of the following
attributes, using a scale where 5 means excellent and 1 means very poor?
Excellent very poor
Taste of food 5 4 3 2
Appearance of food 5 4 3 2
Variety of food 5 4 3 2
Hot food served hot 5 4 3 2
Cold food served cold 5 4 3 2
Quality of food 5 4 3 2
30
Friendliness of servers
Appearance of personnel
Speed of service
Consistency of service
Appearance of service area
Appearance of dining area
Cleanliness of serving area
Cleanliness of dining area
Cleanliness of china, glass
Convenience of hours
5 4 3 2
5 4 3 2
5 4 3 2
5 4 3 2
5 4 3 2
5 4 3 2
5 4 3 2
5 4 3 2
5 4 3 2
5 4 3 2
3. Do you feel foods are served too often, not often enough, or just right?
Too often Just right Not often Not aware
of this item
Grill
Fish
Pizza
Pasta
Turkey Cutlets
Taco
Pita
Hamburger
Burritos
Wrap
4
4
4
4
4
4
4
4
4
4
3
3
3
3
3
3
3
3
3
3
2
2
2
2
2
2
2
2
2
2
31

Stir fry 4 3 2
Carver 4 3 2
Sea Food 4 3 2
Fajita 4 3 2
Vegetable 4 3 2
Deli 4 3 2
Fried Chicken 4 3 2
4. How many meals are you eating in Commons every week?
1-4 5-8 9-12 More than 12_
5. You live: On campus Off-campus
6. What other food, if any, do you feel are served too often?_
7. What other foods, if any, would you like to see more often?_
8. Do you have any special dietary needs?
9. Generally, how will you give to the food service in Commons?
(1) excellent
(2) pretty good
(3) good
(4) poor
(5) very poor
10. are you Student: Faculty/staff
1 1 . Ifyou are a student, what year you are?
(1) Freshman
(2) Sophomore32
(3) Junior
(4) Senior
(5) Graduate
12. What is your age?
(1) 18-20
(2) 21-25
(3) 26-30
(4) 31-40
(5) 40+
13. What is your gender?
(1) male
(2) female
Please use the reverse side for any additional comments
Thank you for taking your time to fill out this survey
33

Figure 1. The percentage sex of respondents
43%
?Male
? Female
57%
34
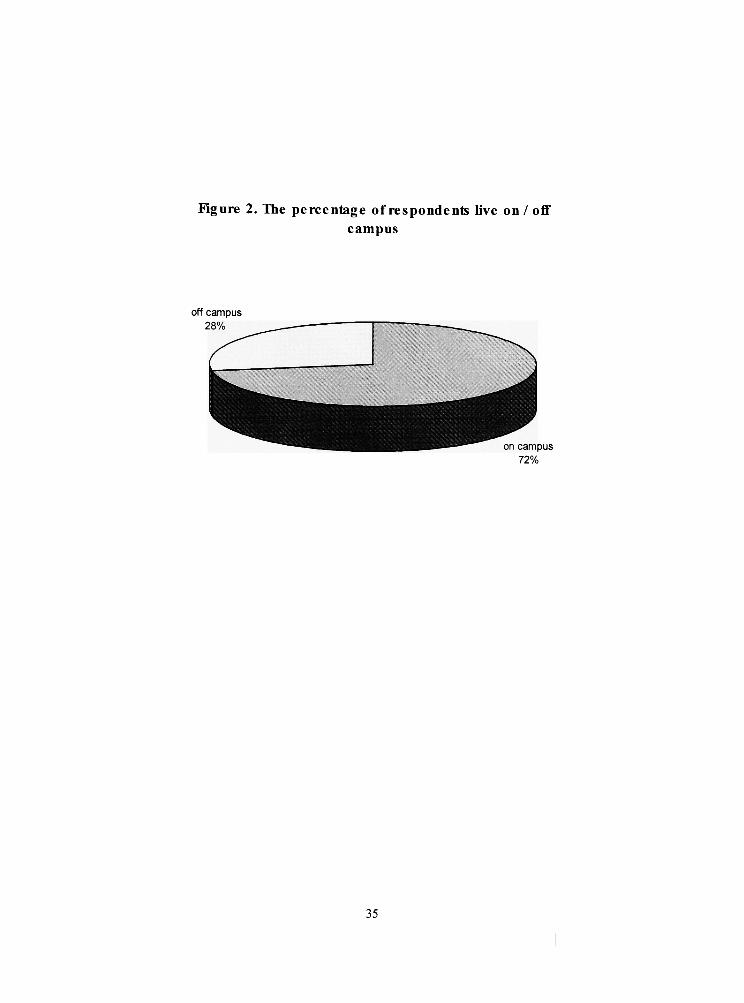
Figure 2. The percentage of respondents live on / off
campus
off campus
28%
35

Figure 3. How many times do customers eat in
Commen's per week (by percentage)
more than 12
5%
36
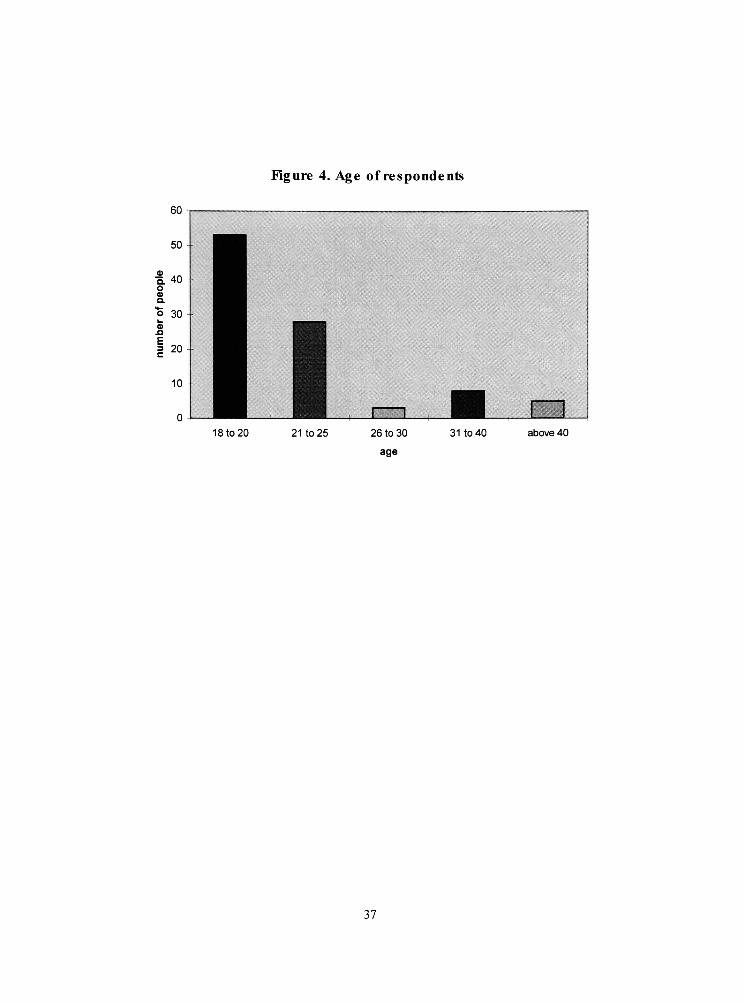
Figure 4. Age of respondents
18 to 20 above 40
37
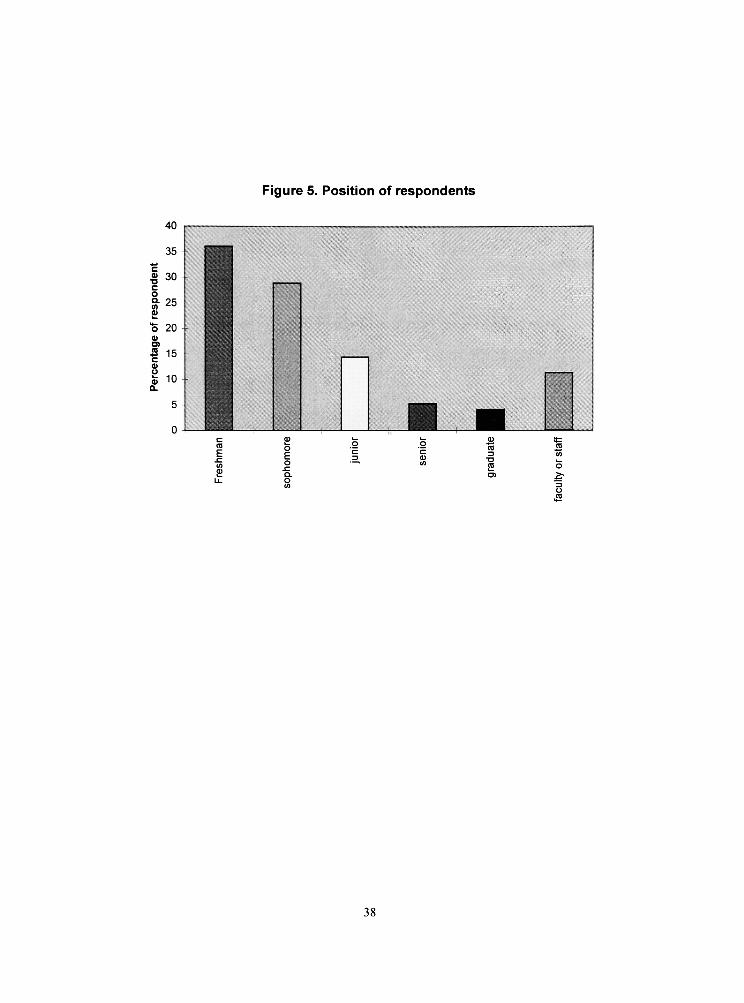
Figure 5. Position of respondents
38

Figure 6. Custome r satisfaction in general foodservice
excellent
16%
pretty good
43%
39

not aware not often just right too often
grill 6.2 9.3 66 17.5
fish 24.7 23.7 42.3 9.3
pizza 2.1 20.6 59.8 17.5
pasta 4.1 29.9 55.7 10.3
turkey cutlets 18.6 23.7 52.6 5.2
taco 5.2 20.6 59.8 14.4
stir fry 7.2 25.8 55.7 11.3
carver 21.6 30.9 39.2 8.2
fried chicken 10.3 23.7 59.8 6.2
pita 12.4 22.7 59.8 5.2
hamburger 6.2 6.2 57.7 29.9
sea food 25.8 27.8 41.2 5.2
fajita 16.5 32 48.5 3.1
vegetable 8.2 30.9 53.6 7.2
deli 0 10.3 74.2 15.5
burritos 8.2 20.6 63.9 7.2
wrap 6.2 32 54.6 7.2
Table 1 . Percentage of customer satisfaction in how frequency of each food to be
served by percentage (%)
40

Figure 7. The special dietary needs
10%
Dyes
? no
90%
41
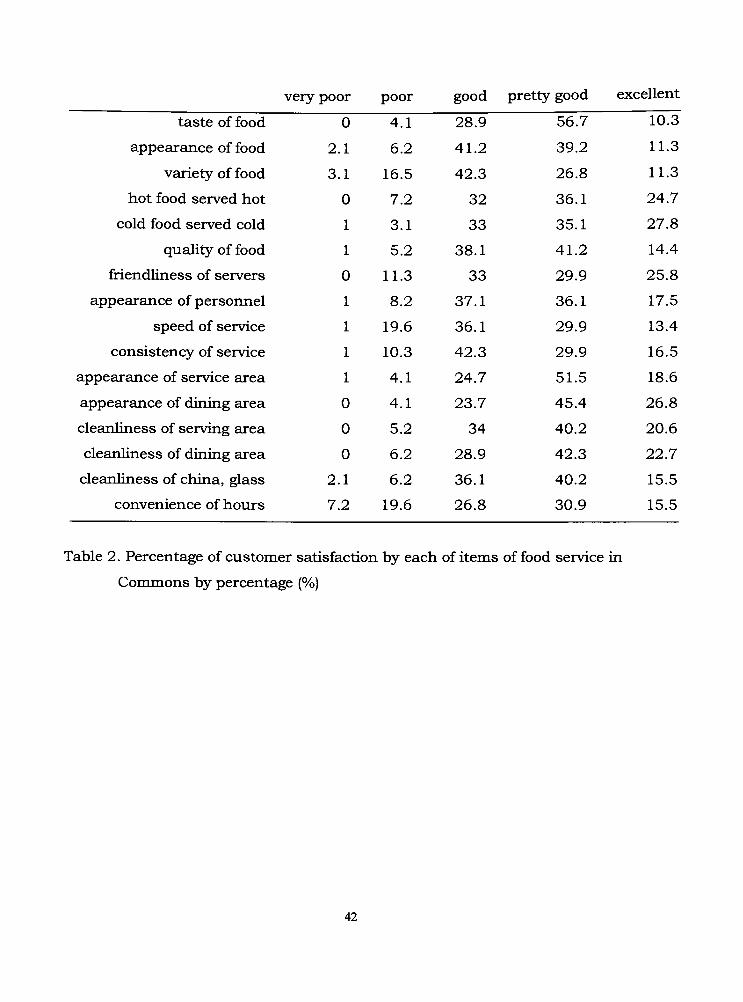
very poor poor good pietty goodexcenem.
taste of food 0 4.1 28.9 56.7 10.3
appearance of food 2.1 6.2 41.2 39.2 11.3
variety of food 3.1 16.5 42.3 26.8 11.3
hot food served hot 0 7.2 32 36.1 24.7
cold food served cold 3.1 33 35.1 27.8
quality of food 5.2 38.1 41.2 14.4
friendliness of servers 0 11.3 33 29.9 25.8
appearance of personnel 8.2 37.1 36.1 17.5
speed of service 19.6 36.1 29.9 13.4
consistency of service 10.3 42.3 29.9 16.5
appearance of service area 4.1 24.7 51.5 18.6
appearance of dining area 0 4.1 23.7 45.4 26.8
cleanliness of serving area 0 5.2 34 40.2 20.6
cleariliness of dining area 0 6.2 28.9 42.3 22.7
cleanliness of china, glass 2.1 6.2 36.1 40.2 15.5
convenience of hours 7.2 19.6 26.8 30.9 15.5
Table 2. Percentage of customer satisfaction by each of items of food service in
Commons by percentage (%)
42
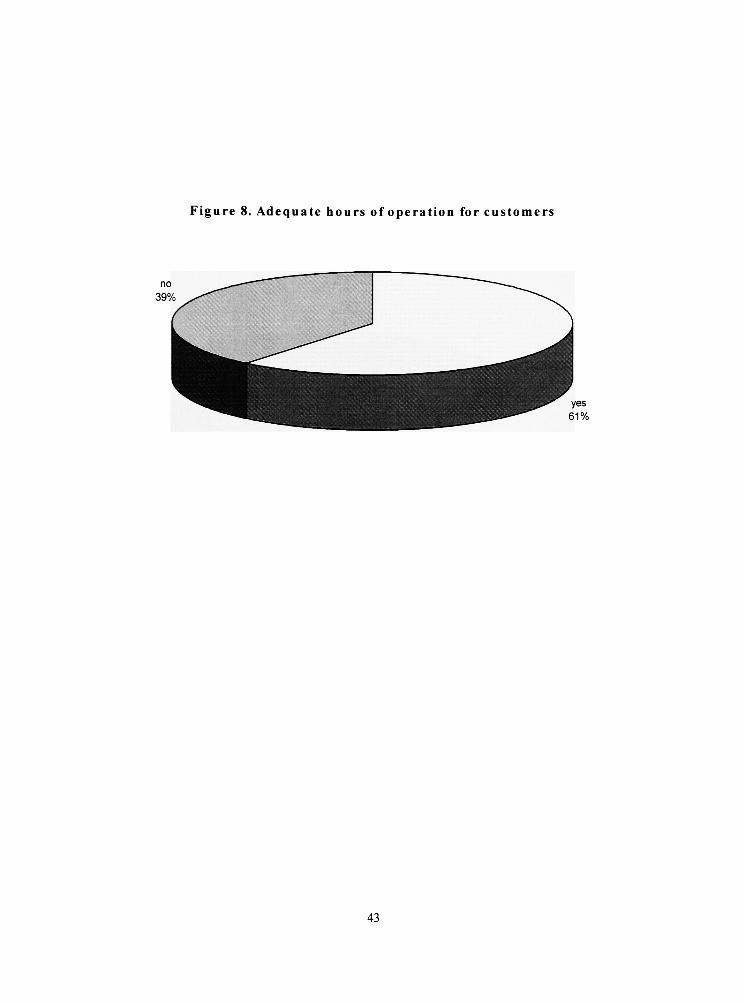
Figure 8. Adequate hours of operation for customers
43

Figure 9. Customers suggested perfect hours for
Commons
? 24 hours
?midnight
? longer hour
? Sat/Sun. longer
? earlier for breakfast
44

freshman sophomore junior senior graduate faculty/ staff
very poor 5.7 14.3 7.1 0 0 0
poor 17.1 25 28.6 20 0 9.1
good 14.3 35.7 50 20 25 18.2
pretty good 26.5 21.4 14.3 60 50 63.6
excellent 34.3 3.6 0 0 25 9.1
Table 3. How did the different positions of respondents feel about operating
hours in Commons by percentage (%)
18-20 21-25 26-30 31-40 above 40
very poor 7.5 7.1 0 12.5 0
poor 26.4 17.9 0 0 0
good 26.4 28.6 0 37.5 25
pretty good 18.9 39.3 33.3 50 75
excellent 20.8 7.1 66.7 0 0
Table 4. Howmuch did different age of customers feel about operating
hours in Commons by percentage (%)
45
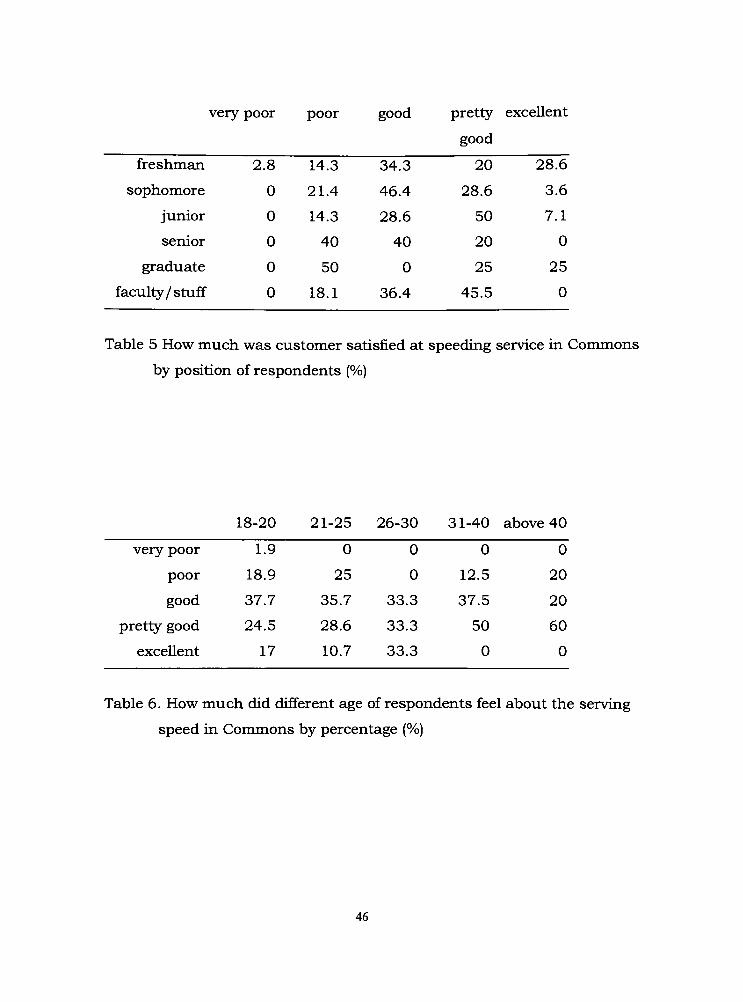
very poor poor good pretty e:scellent
good
freshman 2.8 14.3 34.3 20 28.6
sophomore 0 21.4 46.4 28.6 3.6
junior 0 14.3 28.6 50 7.1
senior 0 40 40 20 0
graduate 0 50 0 25 25
faculty/stuff 0 18.1 36.4 45.5 0
Table 5 Howmuch was customer satisfied at speeding service in Commons
by position of respondents (%)
18-20 21-25 26-30 31-40 above 40
very poor 1.9 0 0 0 0
poor 18.9 25 0 12.5 20
good 37.7 35.7 33.3 37.5 20
pretty good 24.5 28.6 33.3 50 60
excellent 17 10.7 33.3 0 0
Table 6. How much did different age of respondents feel about the serving
speed in Commons by percentage (%)
46

1 to 4 5 to 8 9 to 12 more than 12
very poor 0 0 0 0
poor 1.9 7.7 9.1 20
good 34.5 42.3 18.2 60
pretty good 45.5 38.4 45.5 20
excellent 19.1 11.5 27.2 0
Table 7. Crosstab between the frequency ofmeal and general service by
percentage (%)
1 to 4 5 to 8 9 to 12 more than 12
freshman 68.6 20 8.6 2.8
sophomore 46.4 28.6 14.3 10.7
junior 28.6 57.1 14.3 0
senior 40 20 20 20
graduate 75 0 25 0
faculty/staff 81.8 18.2 0 0
Table 8. Different position of customers who have meals in Commons per
week by percentage (%)
47

freshman sophomor junior senior graduate faculty / staff
e
very poor 0 0 0 0 0 0
poor 0 14.3 0 0 0 18.2
good 22.9 46.4 21.4 40 20 9.1
pretty good 31.4 28.6 71.4 60 40 63.6
excellent 45.7 3.6 7.1 0 20 9.1
Table 9. Relation between cleanliness of dining area and therespondents'
position by percentage (%)
18-20 21-25 26-30 30-40 aibove 40
very poor 0 0 0 0 0
poor 3.8 10.7 0 0 20
good 32.1 35.7 0 12.5 0
pretty good 35.8 42.9 33.3 75 60
excellent 28.3 10.7 66.7 12.5 20
Table 10. The customer satisfaction of cleanliness of dining area and age by
percentage (%)
48

freshman sophomor junior senior graduat faculty/staff
e e
very poor 0 0 0 0 0 0
poor 2.9 3.6 0 0 25 9.1
good 14.3 50 14.3 20 0 9.1
pretty-
40 28.6 78.6 60 50 54.5
good
excellent 42.8 17.8 7.1 20 25 27.3
Table 1 1 . The percentage of customer satisfaction in the appearance of
dining area byrespondents'
positions(%)
18-20 21-25 26-30 30-40 above 40
very poor 0 0 0 0 0
poor 1.9 10.7 0 0 0
good 28.3 21.4 0 12.5 20
pretty good 39.6 50 33.3 67.5 60
excellent 30.2 17.9 66.7 25 20
Table 12. The percentage of customer satisfaction in the appearance of
dining area by age (%)
49

1 to 4 5 to 8 9 to 12 more then 12
very poor 0 11.5 0 0
poor 12.7 23 9.1 40
good 43.6 34.6 54.4 40
very good 30.9 15.4 36.4 20
excellent 12.7 15.4 0 0
Table 13. Relations between the meal which customers have and the variety
food by percentage (%)
50
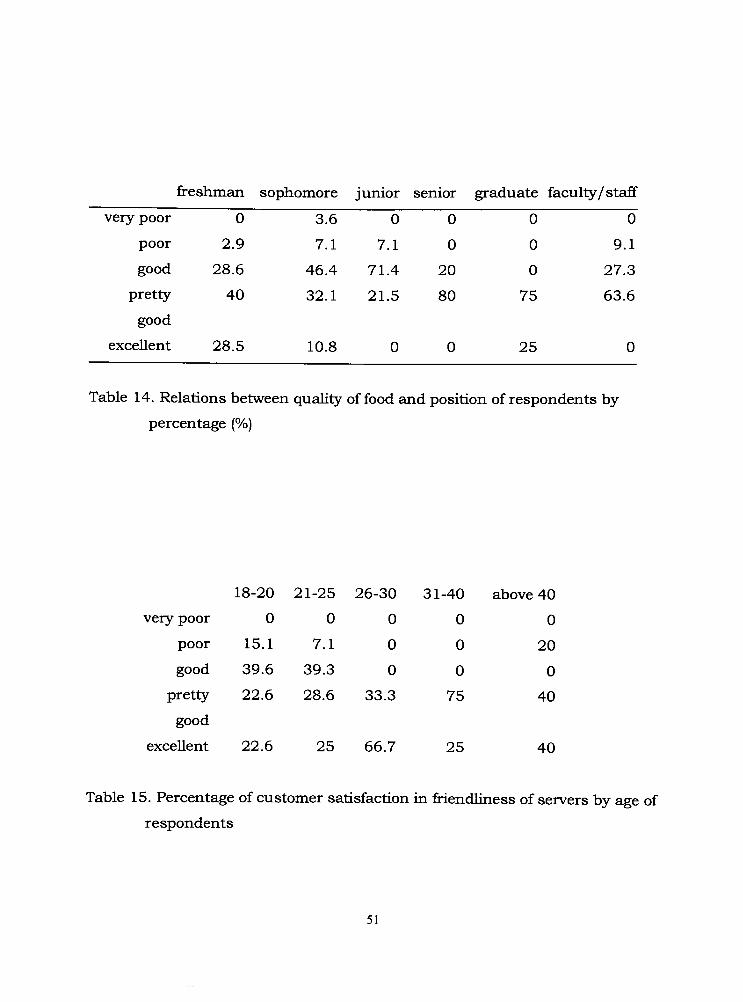
freshman sophomore junior senior graduate faculty/staff
very poor 0 3.6 0 0 0 0
poor 2.9 7.1 7.1 0 0 9.1
good 28.6 46.4 71.4 20 0 27.3
pretty 40 32.1 21.5 80 75 63.6
good
excellent 28.5 10.8 0 0 25 0
Table 14. Relations between quality of food and position of respondents by
percentage (%)
18-20 21-25 26-30 31-40 above 40
very poor 0 0 0 0 0
poor 15.1 7.1 0 0 20
good 39.6 39.3 0 0 0
pretty 22.6 28.6 33.3 75 40
good
excellent 22.6 25 66.7 25 40
Table 15. Percentage of customer satisfaction in friendliness of servers by age of
respondents
51

18-20 21-25 26-30 31-40 above 40
very poor 1.9 0 0 0 0
poor 5.7 17.9 33.3 0 20
good 47.2 39.3 33.3 50 0
pretty good 22.6 32.1 0 50 80
excellent 22.6 10.7 33.3 0 0
Table 16. Percentage of customer satisfaction in consistency of service by age of
respondents
18-20 21-25 26-30 31-40 above 40
poor 5.6 7.1 0 0 0
good 33 42.9 0 25 60
very good 43.4 42.9 66.7 50 0
excellent 17 7.1 33.3 25 40
Table 17. Percentage of customer satisfaction about the general foodservice in
Commons by age
52

Figure 10. the percentage ofgenral foodservice by living
place
? exceollent
H pretty good
JBgood
? poor
i
very poor
on campus off campus
53

Figure 11. Other food you would like more often
38%
?yes
Hno
62%
54