analysis and interactive visualization of software bug reports
TRANSCRIPT
Analysis and Interactive Visualization of Software
Bug Reports
A Thesis Submitted to the
College of Graduate Studies and Research
in Partial Fulfillment of the Requirements
for the degree of Master of Science
in the Department of Computer Science
University of Saskatchewan
Saskatoon
By
Shamima Yeasmin
c©Shamima Yeasmin, August 2014. All rights reserved.

Permission to Use
In presenting this thesis in partial fulfilment of the requirements for a Postgraduate degree from the
University of Saskatchewan, I agree that the Libraries of this University may make it freely available for
inspection. I further agree that permission for copying of this thesis in any manner, in whole or in part, for
scholarly purposes may be granted by the professor or professors who supervised my thesis work or, in their
absence, by the Head of the Department or the Dean of the College in which my thesis work was done. It is
understood that any copying or publication or use of this thesis or parts thereof for financial gain shall not
be allowed without my written permission. It is also understood that due recognition shall be given to me
and to the University of Saskatchewan in any scholarly use which may be made of any material in my thesis.
Requests for permission to copy or to make other use of material in this thesis in whole or part should
be addressed to:
Head of the Department of Computer Science
176 Thorvaldson Building
110 Science Place
University of Saskatchewan
Saskatoon, Saskatchewan
Canada
S7N 5C9
i
Abstract
A software Bug report contains information about the bug in the form of problem description and com-
ments using natural language texts. Managing reported bugs is a significant challenge for a project manager
when the number of bugs for a software project is large. Prior to the assignment of a newly reported bug to
an appropriate developer, the triager (e.g., manager) attempts to categorize it into existing categories and
looks for duplicate bugs. The goal is to reuse existing knowledge to fix or resolve the new bug, and she often
spends a lot of time in reading a number of bug reports. When fixing or resolving a bug, a developer also
consults with a series of relevant bug reports from the repository in order to maximize the knowledge required
for the fixation. It is also preferable that developers new to a project first familiarize themselves with the
project along with the reported bugs before actually working on the project. Because of the sheer numbers
and size of the bug reports, manually analyzing a collection of bug reports is time-consuming and ineffective.
One of the ways to mitigate the problem is to analyze summaries of the bug reports instead of analyzing full
bug reports, and there have been a number of summarization techniques proposed in the literature. Most
of these techniques generate extractive summaries of bug reports. However, it is not clear how useful those
generated extractive summaries are, in particular when the developers do not have prior knowledge of the
bug reports.
In order to better understand the usefulness of the bug report summaries, in this thesis, we first re-
implement a state of the art unsupervised summarization technique and evaluate it with a user study with
nine participants. Although in our study, 70% of the time participants marked our developed summaries as a
reliable means of comprehending the software bugs, the study also reports a practical problem with extractive
summaries. An extractive summary is often created by choosing a certain number of statements from the bug
report. The statements are extracted out of their contexts, and thus often lose their consistency, which makes
it hard for a manager or a developer to comprehend the reported bug from the extractive summary. Based
on the findings from the user study and in order to further assist the managers as well as the developers, we
thus propose an interactive visualization for the bug reports that visualizes not only the extractive summaries
but also the topic evolution of the bug reports. Topic evolution refers to the evolution of technical topics
discussed in the bug reports of a software system over a certain time period. Our visualization technique
interactively visualizes such information which can help in different project management activities. Our
proposed visualization also highlights the summary statements within their contexts in the original report for
easier comprehension of the reported bug. In order to validate the applicability of our proposed visualization
technique, we implement the technique as a standalone tool, and conduct both a case study with 3914 bug
reports and a user study with six participants. The experiments in the case study show that our topic analysis
can reveal useful keywords or other insightful information about the bug reports for aiding the managers or
triagers in different management activities. The findings from the user study also show that our proposed
visualization technique is highly promising for easier comprehension of the bug reports.
ii
Acknowledgements
At first, I thank the Almighty, the most gracious and the most merciful, who granted me the capability
to carry out this work. Then I would like to express my heartiest gratitude to my supervisors Dr. Chanchal
K. Roy and Dr. Kevin A. Schneider for their constant guidance, advice, encouragement and extraordinary
patience during this thesis work. Without their support this work would have been impossible.
I would like to thank Dr. Gordon I. McCalla, Dr. Nadeem Jamali and Dr. Shahedul Khan for their
valuable time, suggestions and insights.
Thanks to all of the members of the Software Research Lab with whom I have had the opportunity
to grow as a researcher. In particular, I would like to thank Minhaz Fahim Zibran, Md. Sharif Uddin,
Mohammad Asif Ashraf Khan, Muhammad Asaduzzaman, Jeffrey Svajlenko, Judith Islam, Md. Saidur
Rahman, Manishankar Mondal, and Farouq Al-Omari.
I am grateful to the University of Saskatchewan and its Department of Computer Science for their generous
financial support through scholarships, awards and bursaries that helped me to concentrate more deeply on
my thesis work.
I thank all the anonymous reviewers for their valuable comments and suggestions in improving the paper
produced from this thesis work.
I would like to thank all of my friends and other staff members of the Department of Computer Science
who have helped me to reach at this stage. In particular, I would like to thank Richard K. Lomotey, Sayooran
Nagulendra, Dylan Knowles, Gwen Lancaster, Shakiba Jalal, and Heather Webb.
I would like to convey my love and gratitude to my beloved husband, Mohammad Masudur Rahman,
who has been staying with me in ease and hardship, inspiring me constantly, and helping me with ideas and
suggestions in this work.
The most wonderful thing in my life is my niece, Mithila, whose presence always inspired me in finishing
my thesis work.
I express my heartiest gratitude to my mother Ms. Rezia Khatoon, and my father Md. Shamsul Alam
and my three brothers Md. Masum Billah, Md. Mamun Billah and Md. Maruf Billah who are the architects
of my life. Their endless sacrifice has made me reach at this stage of my life. I would also like to thank my
mother-in-law Ms. Morium Begum and father-in-law Md. Sadiqur Rahman for their constant well wishes and
inspirations in this thesis work. My sister-in-laws Rabeyia and Farzana, and brother-in-laws Asad, Mamun,
and Sayed have always inspired me in completing my thesis work, and I thank all of them.
iii
I dedicate this thesis to my mother Ms. Rezia Khatoon whose inspiration helps me to accomplish every
step of my life.
iv

Contents
Permission to Use i
Abstract ii
Acknowledgements iii
Contents v
List of Tables vii
List of Figures viii
List of Abbreviations ix
1 Introduction 11.1 Motivation . . . . . . . . . . . . . . . . . . . . . . . . . . . . . . . . . . . . . . . . . . . . . . 1
1.1.1 Problem Statement . . . . . . . . . . . . . . . . . . . . . . . . . . . . . . . . . . . . . . 21.1.2 Our Contribution . . . . . . . . . . . . . . . . . . . . . . . . . . . . . . . . . . . . . . . 2
1.2 Outline of the Thesis . . . . . . . . . . . . . . . . . . . . . . . . . . . . . . . . . . . . . . . . . 41.3 Related Publication . . . . . . . . . . . . . . . . . . . . . . . . . . . . . . . . . . . . . . . . . 4
2 Background 52.1 Software Bug Report . . . . . . . . . . . . . . . . . . . . . . . . . . . . . . . . . . . . . . . . . 52.2 Summary of a Software Bug Report . . . . . . . . . . . . . . . . . . . . . . . . . . . . . . . . 72.3 Topics and Topic Keywords . . . . . . . . . . . . . . . . . . . . . . . . . . . . . . . . . . . . . 72.4 Topic Modeling . . . . . . . . . . . . . . . . . . . . . . . . . . . . . . . . . . . . . . . . . . . . 82.5 Latent Dirichlet Allocation (LDA) . . . . . . . . . . . . . . . . . . . . . . . . . . . . . . . . . 82.6 Gibbs sampling . . . . . . . . . . . . . . . . . . . . . . . . . . . . . . . . . . . . . . . . . . . . 92.7 Summary . . . . . . . . . . . . . . . . . . . . . . . . . . . . . . . . . . . . . . . . . . . . . . . 9
3 Evaluating the Usefulness of Bug Report Summary: An Empirical Study 113.1 Introduction . . . . . . . . . . . . . . . . . . . . . . . . . . . . . . . . . . . . . . . . . . . . . . 113.2 Related Work . . . . . . . . . . . . . . . . . . . . . . . . . . . . . . . . . . . . . . . . . . . . . 133.3 Methodologies . . . . . . . . . . . . . . . . . . . . . . . . . . . . . . . . . . . . . . . . . . . . . 143.4 Experiment Design . . . . . . . . . . . . . . . . . . . . . . . . . . . . . . . . . . . . . . . . . . 16
3.4.1 Creation of Bug Report Summaries . . . . . . . . . . . . . . . . . . . . . . . . . . . . . 163.4.2 Design of User Study . . . . . . . . . . . . . . . . . . . . . . . . . . . . . . . . . . . . . 16
3.5 Evaluation . . . . . . . . . . . . . . . . . . . . . . . . . . . . . . . . . . . . . . . . . . . . . . . 193.5.1 Pyramid Score . . . . . . . . . . . . . . . . . . . . . . . . . . . . . . . . . . . . . . . . 193.5.2 Question Wise Analysis . . . . . . . . . . . . . . . . . . . . . . . . . . . . . . . . . . . 19
3.6 Threats to Validity . . . . . . . . . . . . . . . . . . . . . . . . . . . . . . . . . . . . . . . . . . 243.7 Summary . . . . . . . . . . . . . . . . . . . . . . . . . . . . . . . . . . . . . . . . . . . . . . . 24
4 Interactive Visualization of Bug Reports using Topic Evolution and Extractive Sum-maries 264.1 Introduction . . . . . . . . . . . . . . . . . . . . . . . . . . . . . . . . . . . . . . . . . . . . . . 264.2 Related Work . . . . . . . . . . . . . . . . . . . . . . . . . . . . . . . . . . . . . . . . . . . . . 284.3 Proposed Approach . . . . . . . . . . . . . . . . . . . . . . . . . . . . . . . . . . . . . . . . . . 314.4 Methodologies . . . . . . . . . . . . . . . . . . . . . . . . . . . . . . . . . . . . . . . . . . . . . 32
4.4.1 Methodologies: Topic Evolution of a Bug Report Collection . . . . . . . . . . . . . . . 32
v

4.4.2 Methodologies: Bug Report Summary Visualization . . . . . . . . . . . . . . . . . . . 354.5 Proposed Visual Designs . . . . . . . . . . . . . . . . . . . . . . . . . . . . . . . . . . . . . . . 36
4.5.1 Topic Evolution of a Collection of Bug Reports . . . . . . . . . . . . . . . . . . . . . . 374.5.2 Drilldown Inspection in Context . . . . . . . . . . . . . . . . . . . . . . . . . . . . . . 384.5.3 Searching by keywords . . . . . . . . . . . . . . . . . . . . . . . . . . . . . . . . . . . . 394.5.4 Summary Visualization . . . . . . . . . . . . . . . . . . . . . . . . . . . . . . . . . . . 39
4.6 Experiment & Discussion . . . . . . . . . . . . . . . . . . . . . . . . . . . . . . . . . . . . . . 414.6.1 An Example Case Study: Effectiveness of Topic Evolution . . . . . . . . . . . . . . . . 414.6.2 Evaluation of the Quality of Time-Sensitive Keywords . . . . . . . . . . . . . . . . . . 434.6.3 Comparative Analysis of Visualized form of Bug Report Summary . . . . . . . . . . . 44
4.7 Threats to Validity . . . . . . . . . . . . . . . . . . . . . . . . . . . . . . . . . . . . . . . . . . 454.8 Summary . . . . . . . . . . . . . . . . . . . . . . . . . . . . . . . . . . . . . . . . . . . . . . . 46
5 Evaluation of Bug Report Visualization: A Task-Oriented User Study 475.1 Design of User Study . . . . . . . . . . . . . . . . . . . . . . . . . . . . . . . . . . . . . . . . . 47
5.1.1 Task Design . . . . . . . . . . . . . . . . . . . . . . . . . . . . . . . . . . . . . . . . . . 475.1.2 Study Participants . . . . . . . . . . . . . . . . . . . . . . . . . . . . . . . . . . . . . . 485.1.3 Questionnaire . . . . . . . . . . . . . . . . . . . . . . . . . . . . . . . . . . . . . . . . . 48
5.2 Run of Study Session . . . . . . . . . . . . . . . . . . . . . . . . . . . . . . . . . . . . . . . . . 495.2.1 Execution Phase . . . . . . . . . . . . . . . . . . . . . . . . . . . . . . . . . . . . . . . 495.2.2 Evaluation Phase . . . . . . . . . . . . . . . . . . . . . . . . . . . . . . . . . . . . . . . 49
5.3 Result Analysis and Discussion . . . . . . . . . . . . . . . . . . . . . . . . . . . . . . . . . . . 505.3.1 Evaluation Metrics . . . . . . . . . . . . . . . . . . . . . . . . . . . . . . . . . . . . . . 505.3.2 Motivating Factors of Visualization to Bug Report Summaries . . . . . . . . . . . . . 505.3.3 Comparison between Visualized and Non-visualized Bug Report Extractive Summaries 515.3.4 Qualitative Suggestions from Participants . . . . . . . . . . . . . . . . . . . . . . . . . 52
5.4 Threats to Validity . . . . . . . . . . . . . . . . . . . . . . . . . . . . . . . . . . . . . . . . . . 535.5 Summary . . . . . . . . . . . . . . . . . . . . . . . . . . . . . . . . . . . . . . . . . . . . . . . 53
6 Conclusion 546.1 Concluding Remarks . . . . . . . . . . . . . . . . . . . . . . . . . . . . . . . . . . . . . . . . . 546.2 Future Work . . . . . . . . . . . . . . . . . . . . . . . . . . . . . . . . . . . . . . . . . . . . . 55
References 57
vi

List of Tables
2.1 An Example of Bug Report Summary . . . . . . . . . . . . . . . . . . . . . . . . . . . . . . . 8
3.1 Pyramid Score Calculation . . . . . . . . . . . . . . . . . . . . . . . . . . . . . . . . . . . . . 203.2 Recall for Bug Report Summary . . . . . . . . . . . . . . . . . . . . . . . . . . . . . . . . . . 21
4.1 Dataset for Experiment with Topic Evolution . . . . . . . . . . . . . . . . . . . . . . . . . . . 324.2 Manually Created Stop-word List for Eclipse-Ant Bug Reports . . . . . . . . . . . . . . . . . 334.3 An Example Topic with Keywords and Labels . . . . . . . . . . . . . . . . . . . . . . . . . . . 424.4 Search Results in terms of bug reports retrieved . . . . . . . . . . . . . . . . . . . . . . . . . . 424.5 # of Bug Reports in Eclipse-Ant from 2001 to 2014 . . . . . . . . . . . . . . . . . . . . . . . 434.6 Precision, Recall and F-measure for top 5 Topics . . . . . . . . . . . . . . . . . . . . . . . . . 46
5.1 Difficulty and Frequency Scales . . . . . . . . . . . . . . . . . . . . . . . . . . . . . . . . . . . 505.2 Participants ratings behind motivating factors of our Summary Visualization . . . . . . . . . 515.3 Rating of Efficiency and Look & Feel by participants . . . . . . . . . . . . . . . . . . . . . 51
vii
List of Figures
2.1 An Example Segment of a Bug Report . . . . . . . . . . . . . . . . . . . . . . . . . . . . . . . 10
3.1 The understandability of Bug Report Summary . . . . . . . . . . . . . . . . . . . . . . . . . . 213.2 Percentage of important statements in the bug report summary (According to Participants) . 233.3 Percentage of meaningless statements in bug report summary . . . . . . . . . . . . . . . . . . 243.4 Percentage of users’ ratings for bug report summary . . . . . . . . . . . . . . . . . . . . . . . 25
4.1 Schematic Digram of Topic Evolution Visualizer . . . . . . . . . . . . . . . . . . . . . . . . . 314.2 Schematic Diagram of Bug Report Summarizer . . . . . . . . . . . . . . . . . . . . . . . . . . 314.3 Topic Evolution Example (Topic 3: Tool Launch and Configuration) . . . . . . . . . . . . . . 364.4 Topic Drill Down in the Context . . . . . . . . . . . . . . . . . . . . . . . . . . . . . . . . . . 374.5 Search by Keywords . . . . . . . . . . . . . . . . . . . . . . . . . . . . . . . . . . . . . . . . . 384.6 Manual Topic Labeling . . . . . . . . . . . . . . . . . . . . . . . . . . . . . . . . . . . . . . . . 394.7 Bug Report Summary Visualization . . . . . . . . . . . . . . . . . . . . . . . . . . . . . . . . 404.8 Topic-2 (Editor Outline) . . . . . . . . . . . . . . . . . . . . . . . . . . . . . . . . . . . . . . . 444.9 Topic-4 (Version log) . . . . . . . . . . . . . . . . . . . . . . . . . . . . . . . . . . . . . . . . . 45
5.1 Rating of Efficiency and Look and Feel . . . . . . . . . . . . . . . . . . . . . . . . . . . . . . 52
viii

List of Abbreviations
LDA Latent Dirichlet AllocationLSI Latent Semantic IndexingTF Term FrequencySE Software EngineeringMSR Mining Software RepositoriesTIARA Text Insight via Automated Responsive Analytics
ix

Chapter 1
Introduction
1.1 Motivation
Software bugs are the issues that hinder the work of the users of a software system, and they are reported in
the form of software bug reports. A typical bug report contains several pieces of information such as problem
description of a software bug, steps to reproduce the bug, relevant source code, and data dumps (i.e., content
of the memory at the time of the failure). During the maintenance and evolution of a software system, a
project manager often needs to consult with a number of previously filed bug reports. The goal is to determine
which parts of a given project are more vulnerable (i.e., affected by bugs) and thus deserve more attention.
The task is trivial when there are only a few bugs reported. However, the number of bugs of a software
project generally increases over time, and it poses a great challenge for a project manager to analyze such a
huge collection of bug reports [60]. On the reporting of a new bug, a triager (e.g., the manager) attempts to
classify the bug into existing categories and looks for the duplicate bugs[60]. The goal is to identify not only
the similar bugs reported earlier but also the developers who worked on those bugs so that existing knowledge
and expertise can be applied when fixing or resolving the new bug. However, both tasks require her to read a
number of bug reports from the repository [49] [60]. When developers start working on an existing project, it
is also preferable that they first familiarize themselves with the project along with its reported bugs. Given
the sheer numbers and size of the bug reports, analyzing a large collection of reports manually is highly
unproductive [60], and the managers, the triagers, and the developers spend a significant amount of time
consulting the reports [49]. One way to support them in this regard is to offer useful summaries containing
less information instead of the original bug reports with lots of text and comments [49] [60]. The summary
of a bug report represents a condensed form of important information extracted from the report, and it
could be a useful means for the readers to comprehend the reported bug by spending less amounts of time
and cognitive effort. There exist several approaches that propose summarizing the bug reports. Most of
these techniques generate extractive summaries where the summary statements are extracted out of their
contexts from the bug reports. However, it is not well understood whether those extractive summaries are
useful in practice or not, especially for the developers who do not have prior knowledge of the reported bugs.
Project managers generally use traditional bug tracking systems (e.g., BugZilla [13], JIRA [24]) for different
management activities during the maintenance and evolution of a software product. While the tracking
1

systems facilitate different basic features such as search, addition, deletion or archiving of a bug report, they
also often fail to deliver useful insights on the bug reports required for their work.
1.1.1 Problem Statement
Let us consider a software maintenance scenario, where a triager assigns software bugs to a developer. Prior
to the assignment of a newly reported bug, she attempts to categorize it into an existing category and then
looks for duplicates in the bugs of that category. She uses an existing bug tracking system such as Bugzilla
[13], and the system generally returns a number of bug reports based on their severity and recency. She
then applies an existing summarization technique (e.g., using [47], [60] or [49]) on those reports in order
to comprehend and analyze them with reduced time and effort. However, she notes that the statements
of a summary are taken out of context, and they do not represent a clear and consistent view about the
corresponding reported bug. The triager might also be interested to collect certain other information for her
work such as– (1) Did the resulting critical bugs exist in earlier versions? (2) Are there other bugs related to
these critical bugs?, (3) When did they first appear?, and (4) What are the technical issues associated with
these bugs? However, neither the bug tracking systems nor the existing approaches in the literature answer
these questions satisfactorily. In this research, we thus attempt to solve these two research problems–(1)
analyzing the effectiveness of extractive summaries for bug reports, and (2) mining and visualizing the useful
aspects of bug reports. We decompose the two research problems into the following research questions:
• Does the summary of a bug report contain the most important or the most relevant information re-
garding the reported bug?
• Does the summary represent a clear or consistent view about the reported bug?
• To what extent does the summary help in the comprehension of the bug?
• Does the visualization of summary statements in their contexts help a reader to more easily comprehend
the reported bug?
• Does a reported bug belong to a category that is the most frequently used?
• Which bug reports in the repository discuss a frequent technical topic?
1.1.2 Our Contribution
In this thesis, we conduct two studies focusing on the two research problems discussed above. In the first study,
in order to better understand the effectiveness of extractive summaries for bug reports, we replicate a state
of the art summarization technique [47] called Hurried Bug Summarization that applies techniques (cosine
similarity, sentiment analysis and so on) in order to choose summary sentences from the bug report, and
conduct a user study with nine participants. According to our conducted study, 70% of the time participants
2
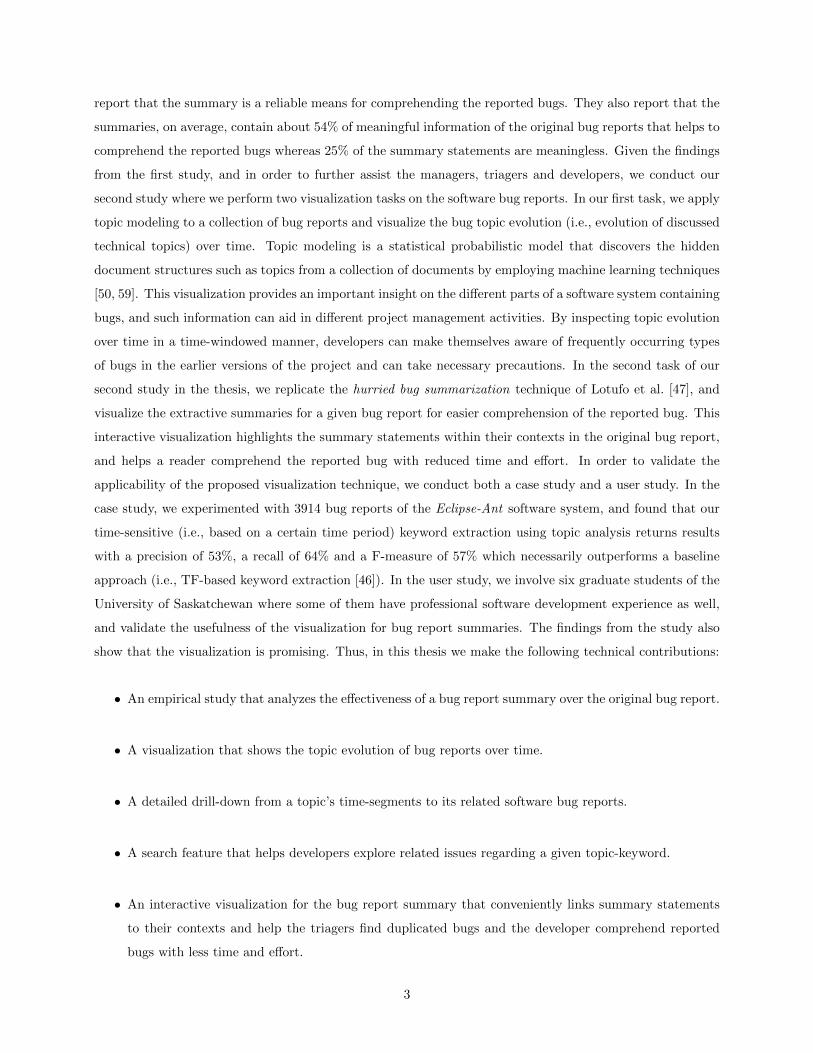
report that the summary is a reliable means for comprehending the reported bugs. They also report that the
summaries, on average, contain about 54% of meaningful information of the original bug reports that helps to
comprehend the reported bugs whereas 25% of the summary statements are meaningless. Given the findings
from the first study, and in order to further assist the managers, triagers and developers, we conduct our
second study where we perform two visualization tasks on the software bug reports. In our first task, we apply
topic modeling to a collection of bug reports and visualize the bug topic evolution (i.e., evolution of discussed
technical topics) over time. Topic modeling is a statistical probabilistic model that discovers the hidden
document structures such as topics from a collection of documents by employing machine learning techniques
[50, 59]. This visualization provides an important insight on the different parts of a software system containing
bugs, and such information can aid in different project management activities. By inspecting topic evolution
over time in a time-windowed manner, developers can make themselves aware of frequently occurring types
of bugs in the earlier versions of the project and can take necessary precautions. In the second task of our
second study in the thesis, we replicate the hurried bug summarization technique of Lotufo et al. [47], and
visualize the extractive summaries for a given bug report for easier comprehension of the reported bug. This
interactive visualization highlights the summary statements within their contexts in the original bug report,
and helps a reader comprehend the reported bug with reduced time and effort. In order to validate the
applicability of the proposed visualization technique, we conduct both a case study and a user study. In the
case study, we experimented with 3914 bug reports of the Eclipse-Ant software system, and found that our
time-sensitive (i.e., based on a certain time period) keyword extraction using topic analysis returns results
with a precision of 53%, a recall of 64% and a F-measure of 57% which necessarily outperforms a baseline
approach (i.e., TF-based keyword extraction [46]). In the user study, we involve six graduate students of the
University of Saskatchewan where some of them have professional software development experience as well,
and validate the usefulness of the visualization for bug report summaries. The findings from the study also
show that the visualization is promising. Thus, in this thesis we make the following technical contributions:
• An empirical study that analyzes the effectiveness of a bug report summary over the original bug report.
• A visualization that shows the topic evolution of bug reports over time.
• A detailed drill-down from a topic’s time-segments to its related software bug reports.
• A search feature that helps developers explore related issues regarding a given topic-keyword.
• An interactive visualization for the bug report summary that conveniently links summary statements
to their contexts and help the triagers find duplicated bugs and the developer comprehend reported
bugs with less time and effort.
3
1.2 Outline of the Thesis
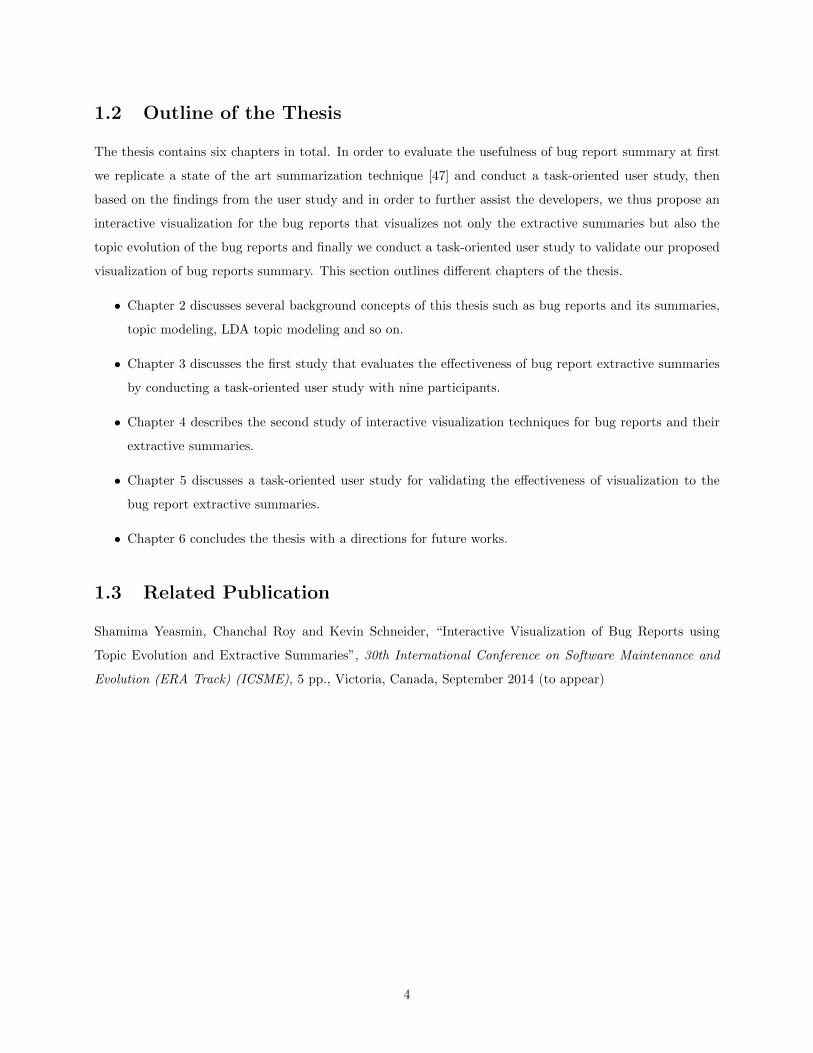
The thesis contains six chapters in total. In order to evaluate the usefulness of bug report summary at first
we replicate a state of the art summarization technique [47] and conduct a task-oriented user study, then
based on the findings from the user study and in order to further assist the developers, we thus propose an
interactive visualization for the bug reports that visualizes not only the extractive summaries but also the
topic evolution of the bug reports and finally we conduct a task-oriented user study to validate our proposed
visualization of bug reports summary. This section outlines different chapters of the thesis.
• Chapter 2 discusses several background concepts of this thesis such as bug reports and its summaries,
topic modeling, LDA topic modeling and so on.
• Chapter 3 discusses the first study that evaluates the effectiveness of bug report extractive summaries
by conducting a task-oriented user study with nine participants.
• Chapter 4 describes the second study of interactive visualization techniques for bug reports and their
extractive summaries.
• Chapter 5 discusses a task-oriented user study for validating the effectiveness of visualization to the
bug report extractive summaries.
• Chapter 6 concludes the thesis with a directions for future works.
1.3 Related Publication
Shamima Yeasmin, Chanchal Roy and Kevin Schneider, “Interactive Visualization of Bug Reports using
Topic Evolution and Extractive Summaries”, 30th International Conference on Software Maintenance and
Evolution (ERA Track) (ICSME), 5 pp., Victoria, Canada, September 2014 (to appear)
4

Chapter 2
Background
In this chapter, we discuss the required concepts and technologies to follow the rest of the thesis. Section 2.1
defines software bug and bug reports and the relevant fields of interest in a bug report, Section 2.2 defines
bug report summary with an example summary, Section 2.3 defines topic and topic keywords, Section 2.4
discuss topic modeling, Section 2.5 explains LDA topic modeling, Section 2.6 focuses on Gibbs sampling, and
Section 2.7 summarizes this chapter.
2.1 Software Bug Report
Software bugs are the issues that hinder the work of the users or testers of a software system. They are
generally reported by users or developers or testers in the form of bug reports utilizing popular bug tracking
systems such as Bugzilla [13], JIRA [24], BugLogHQ [12], Trac [22] and so on. An example segment of Eclipse
bug report collected from Eclipse bugs repository [16] is represented in Fig. 2.1, Each bug report contains
the details of an encountered software issue, and the information is organized into several fields using natural
language text as follows:
• Bug ID: The numeric ID of a bug, which is unique within a bug tracking system.
• Status: The Status field indicates the current state of a reported bug. There are two types of states
associated with a reported bug- one is open bug and other is close bug. The bugs, which has recently
been added to the bug database, or filed, or not resolved yet, are referred to as open bugs. On the
other hand, in case of close bug, either a resolution has been performed for that bug, and waiting for
verification or verified. The current state of an open bug is described by UNCONFIRMED (i.e., the bug
has recently been added to the database and nobody has confirmed that bug as valid), or CONFIRMED
(i.e., the bug is valid and has recently been filed), or IN PROGRESS (i.e., the bug is not yet resolved,
but is assigned to the appropriate person who is now working on the bug), whereas for a close bug the
status can be defined as RESOLVED (i.e., a resolution has been performed for that bug, and waiting
for verification), VERIFIED (i.e., QA has looked at the bug as well as resolution and agrees that the
appropriate resolution has been taken), or FIXED (i.e., a fix for the bug is checked and tested), or
INVALID (i.e., the problem described in that bug is not a bug), or WONTFIX (i.e., the bug will never
be fixed), or DUPLICATE (i.e., the bug is a duplicate of an existing bug), or WORKSFORME (i.e.,
5

the bug was unable to reproduce and if more information appears later, the bug can be reopened).
• Summary: Short description of a bug containing a few keywords, which is often defined as the title of
a bug report. In our research, we measure the relevance of each sentence in a bug report with its title.
• Description: Detailed description of a bug, such as steps to produce the bug, and technical error
message. In our research, we consider all sentences in a bug report description as the most important
sentences.
• Product: The product affected by the bug, e.g., Platform is a product of Eclipse.
• Component: The component affected by the bug, e.g., Ant is a component of Eclipse-Platform.
• Version: It defines the version of the software, the reported bug is detected in.
• Hardware: It is the hardware platform, the bug was observed on.
• Author: The person reported the bug.
• Severity: Severity is perceived by the reporter of the bug. Several severity levels are used such as
blocker (i.e., the reported bug blocks development or testing work), critical (i.e., the impact of the
bug can be crashes, loss of data, and severe memory leak), major (i.e., the bug is causing major
loss of function), normal (i.e., the bug is a regular issue, and losing some functionality under specific
circumstances), minor (i.e., the bug is causing minor loss of function), and trivial (i.e., the bug is
creating a cosmetic problem such as misspelled words or misaligned text).
• Priority: Priority is assigned by a bug triager. On the submission of a bug report, a triager decides
an appropriate priority level for the bug report. Five priority levels are generally used such as: P1, P2,
P3, P4, and P5, where P1 is the highest priority and P5 is the lowest.
• Target Milestone: This field is used to define the target release, and it is expected to get a reported
bug fixed by that target release.
• Attachments: This field is utilized to attach large amount of ASCII data, such as stack traces,
debugging output files, or log files into a reported bug report.
• Comments: In a typical bug report, comments are the collaboration among developers in the form of
conversations. Within comments, bug report contains three types of information: claims, hypotheses
and proposals, which are multi threaded. Developers often post evaluation comments that confirm or
dispute previous claims, support or reject previous hypotheses, and evaluate previous proposals [47].
The comments are not constructed with the intention of being easy to read and comprehend. In order
to comprehend a bug report, it is often necessary to read almost the entire conversation (i.e., all the
comments) within a bug report, because comments have a context set by their previous comments and
useful information is spread out throughout the thread [47]. In out thesis, we collect sentences from all
comments within a bug report in order to create summary.
6

2.2 Summary of a Software Bug Report
Bug report summary is a condensed form of important information extracted from the full bug report which
can be a useful mean for the readers to comprehend the reported bug. There are two types of summaries
that can be generated from a bug report: extractive and abstractive. When the statements of a summary are
directly extracted from the bug report based on their importance, it is regarded as extractive summary. On
the other hand, an abstractive summarization approach develops an internal semantic representation of the
bug report texts and then applies some sort of natural-language processing to create a summary. However,
current state-of-the-art in abstractive approaches does not yet support meaningful application [38]. In our
research we replicate an extractive summarization technique and deal with extractive summaries. However,
the idea of creating simple and indicative abstracts (i.e., summaries) arose as early as the fifties. Luhn
[48] proposes to weigh the sentences of a document as a function of high frequency words and extracts the
sentences scoring the highest in significance as auto-abstract. In order to generate text abstract automat-
ically, besides the presence of high-frequency content words (i.e., key words), Edmundson [36] treats three
additional components: pragmatic words (i.e., cue words), title and heading words, and structural indicators
(i.e., sentence location). The comparative analysis Edmundson [36] indicates that the three newly proposed
components dominate the frequency component [48] in the creation of better abstracts. Another approach
proposed by Kupiec et al. [44] extracts important sentences from a document based on a number of different
weighting heuristics such as sentence length cut-off feature, paragraph feature, fixed-phrase, thematic word
feature and uppercase word feature. The approach shows the highest recall of 0.44 when these three features–
features of paragraph, fixed phrase, and sentence length, are combined.
Table 2.1 shows the extractive summary of the bug same bug represented in Fig. 2.1, generated by the
approach of Lotufo et al. [47]. In our thesis, in Chapter 3 we replicate a state of the art summarization
technique proposed by Lotufo et al. in order to create extractive summaries of bug reports and evaluate the
effectiveness of those extractive summaries with a task-oriented user study. Then in Chapter 4, we apply
visualization on those summaries and later in Chapter 5, we conduct another task-oriented study to validate
that visualized summaries.
2.3 Topics and Topic Keywords
A topic represents the thematic content common to a set of text documents [45]. Each topic is characterized
by a distribution over a set of keywords, which are denoted as topic keywords [45]. Each keyword has a
probability that implies the likelihood of that keyword appearing in the related topic. In our research, we
extract keywords associated with each topic extracted from a collection of bug reports in Chapter 4.
7

Table 2.1: An Example of Bug Report Summary
Title: ”(Bug 276131) Eclipse - Browser Test crashing”
Summary: The releng tests have been DNF for the last couple builds. Running locally we occasionally
see crashes in the Browser Tests so we suspect these crashes to be the cause of the DNF. We have NOT
seen this bug affect the usability of Eclipse, only the running of the SWT test suite. The problem is that
the strategy we use to release pools periodically (in readAndDispatch, createWidget, etc) to be able to run
the test suites, releases the main thread pool created be Device and stored in a thread local dictionary.
Obviously, something this low level needs as much as it can get. Can we get a test build run to verify all
tests pass/no crashes /no OOM/etc? Also, you should be doing the two days test pass on a version of SWT
that includes the change. The new fix is simpler, we just make sure that the pool in the thread dictionary is
always valid, that way when another display is created it will not use a released pool. There was a further
problem where the pool was released too early. If we are in call in, we cannot release the top of the stack
pool.
2.4 Topic Modeling
In machine learning and natural language processing, a topic model is a type of statistical model for discov-
ering the abstract topics that occur in a collection of documents. Topic modeling algorithms are statistical
methods that analyze the words of the original texts to discover the themes that run through them, how
those themes are connected to each other, and how they change over time [28]. Intuitively, given that a
document is about a particular topic, one would expect particular words to appear in the document more
or less frequently. For example object and method will appear more often in documents about Java, and
include and function will appear in documents aboutC Programming. A document typically reveals multiple
topics in different proportions; thus, in a document that is 10% about Java and 90% about C Programming,
there would probably be about nine times more C Programming words than Java words. Topic modeling
algorithms can be applied to massive collections of documents as well as can be adapted to many kinds of
data [28]. However, Topic modeling enables us to organize and summarize electronic archives at a scale that
would be impossible by human annotation [28]. In this research, we apply topic modeling algorithm on a
collection of bug reports collected from Eclipse-Ant, which is described in Chapter 4.
2.5 Latent Dirichlet Allocation (LDA)
The intuition behind LDA is that the documents exhibit multiple topics. LDA is a statistical model of
document collections that tries to capture that intuition [28]. It is a generative model that allows sets of
observations to be explained. It also explains why some parts of the data are similar. Each document is
assumed to be a mixture of a small number of topics and the creation of each word creation is attributable to
8

one of the document’s topics. LDA is widely used and one of the most effective topic modeling techniques.
Thus in our thesis, we apply LDA topic modeling technique on our dataset, which is discussed in Chapter 4.
2.6 Gibbs sampling
Gibbs sampling is one of the algorithms from the Markov Chain Monte Carlo (MCMC) framework. The
MCMC algorithms aim to construct a Markov chain that has the target posterior distribution as its stationary
distribution [34]. Gibbs sampling is based on sampling from conditional distributions of the variables of the
posterior. If a joint distribution is not known, it is difficult to generate samples from such distribution
directly. At the same time, if the conditional distribution is known, one can easily generate samples from
that distribution. More importantly, even if the joint distribution is known, the computational burden
might be huge. Gibbs sampling algorithm generates a sequence of samples from conditional individual
distributions, which constitutes a Markov chain, to approximate the joint distribution. In our research, in
order to apply LDA topic modeling on our dataset, we utilize Gibbs sampling for parameter estimation and
inference (Chapter 4).
2.7 Summary
In this chapter, we introduced different terminologies and background concepts that would help one to follow
the remaining of the thesis. We defined software bug reports, and discussed the relevant fields of interest in a
bug report, we defined bug report summary with an example, we defined topic and explained topic keywords
relationship, we described topic modeling, we also defined LDA topic modeling, a widely used topic modeling
techniques, finally we briefly discussed Gibbs sampling.
9

Figure 2.1: An Example Segment of a Bug Report
10
Chapter 3
Evaluating the Usefulness of Bug Report Summary:
An Empirical Study
To evaluate the effectiveness of bug report summary, at first we replicate a state of the art summarization
technique [47] and then conduct a task-oriented user study with nine participants. In this chapter, we describe
the details of this study.
The rest of the chapter is organized as follows. In Section 3.2, we discuss existing studies related to our
research. We discuss methodologies in Section 3.3. We explain detail design of the experiment in Section
3.4. Section 3.5 discusses results of our user study. We identify possible threats to validity in Section 3.6 and
finally we summarize this chapter in Section 3.7.
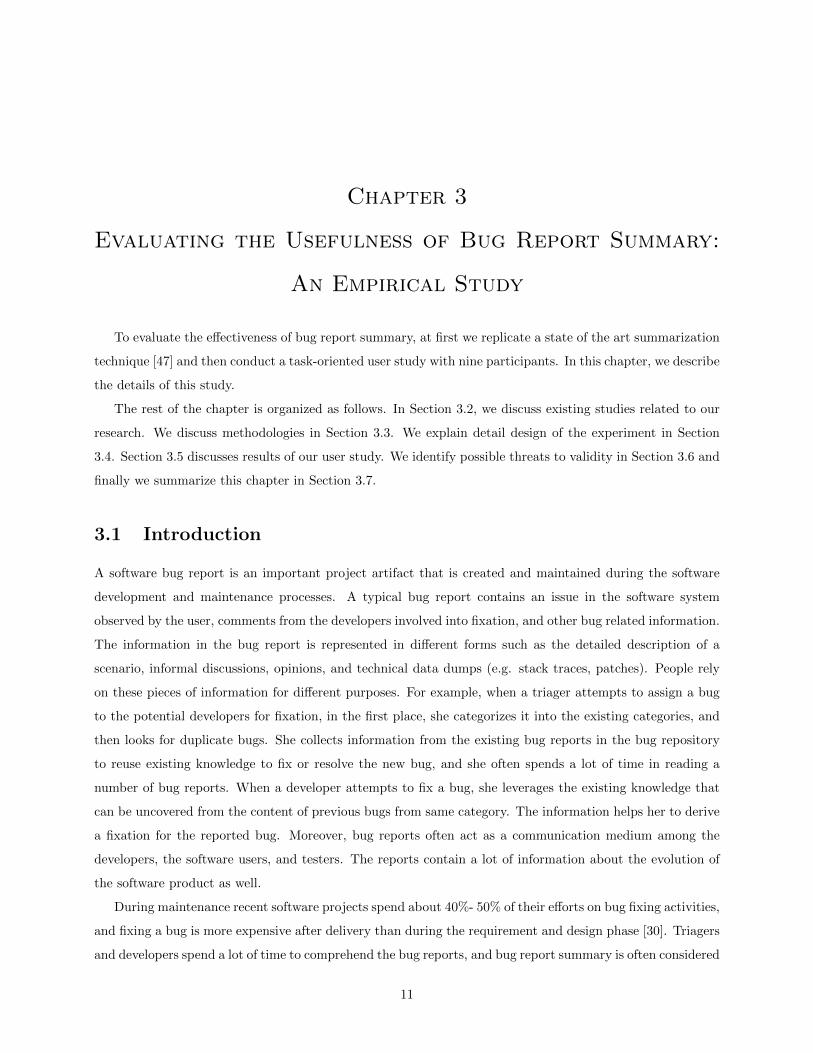
3.1 Introduction
A software bug report is an important project artifact that is created and maintained during the software
development and maintenance processes. A typical bug report contains an issue in the software system
observed by the user, comments from the developers involved into fixation, and other bug related information.
The information in the bug report is represented in different forms such as the detailed description of a
scenario, informal discussions, opinions, and technical data dumps (e.g. stack traces, patches). People rely
on these pieces of information for different purposes. For example, when a triager attempts to assign a bug
to the potential developers for fixation, in the first place, she categorizes it into the existing categories, and
then looks for duplicate bugs. She collects information from the existing bug reports in the bug repository
to reuse existing knowledge to fix or resolve the new bug, and she often spends a lot of time in reading a
number of bug reports. When a developer attempts to fix a bug, she leverages the existing knowledge that
can be uncovered from the content of previous bugs from same category. The information helps her to derive
a fixation for the reported bug. Moreover, bug reports often act as a communication medium among the
developers, the software users, and testers. The reports contain a lot of information about the evolution of
the software product as well.
During maintenance recent software projects spend about 40%- 50% of their efforts on bug fixing activities,
and fixing a bug is more expensive after delivery than during the requirement and design phase [30]. Triagers
and developers spend a lot of time to comprehend the bug reports, and bug report summary is often considered
11

as a preferable alternative. The summary helps one to understand the encountered bug within a shorter period
of time. There exist several approaches [60], [49], [47] that propose summaries for the bug reports. Rastkar
et al. [60] propose a machine learning summarizer on three types of data– email communications, meeting data
and bug reports, and compare the automated summaries against the manually created summaries. Lotufo
et al. [47] propose another approach that focuses on how a reader pays attention and assigns importance
to different sentences of the bug report while reading the report. They evaluate their approach with a user
study involving 58 open source developers who worked on the test bug reports. However, the user study
conducted has several limitations– (1) the evaluation might be biased because of the existing knowledge
of the developers on the bug reports, (2) the evaluation does not consider the perspectives of the triagers
who might not be expert on the domain of the reported bugs. In this thesis, to overcome these limitations,
we replicate a state of the art summarization technique proposed by Lotufo et al. [47] called Hurried Bug
Summarization and conduct a user study involving nine graduate research students using nine bug reports.
The idea is to evaluate the effectiveness of the summarization approach by graduate level participants who
are new to the subject bug reports, and have one to three years software development experience. Basically,
we attempt to simulate the usage scenario of the technique by the triagers and novice developers involved
into bug fixation.
In order to determine the effectiveness of the approach, we formulate the following research questions.
• RQ1: Does the summary of a bug report contain the most important or the most relevant information
regarding the reported bug?
• RQ2: Does the summary represent a clear and consistent view about the reported bug?
• RQ3: To what extent does the summary help in the comprehension of the bug?
In this research, we perform an empirical study to find out whether bug report summary can be useful
to the developers to digest the main concept of the report or not. If then, bug reports summaries would be
a beneficial mean to the triagers as well as developers in order to comprehend the full bug reports within
shorter period of time. We perform the following steps in order to perform our empirical study:
• We collect nine bug reports of Mozilla, Eclipse, and Gnome from popular bug tracking system Bugzilla
[13]. We choose four Mozilla bugs from Bugzilla-Mozilla [19], three Eclipse bugs from Bugzilla-Eclipse
[16], and two Gnome bugs from Bugzila-Gnome [17] for the study.
• We create automatic summary for each bug report by employing hurried bug summarization technique
proposed by Lotufo et al. [47].
• Finally, we evaluate the usefulness of bug report summary by conducting a task-oriented user study
with nine graduate students.
12

In this research, we evaluate the usefulness of bug report summaries with a user study where the partic-
ipants use the summaries in order to comprehend the bugs. According to our findings from the study, 70%
of the times participants recommended that bug report summaries could be a reliable mean to comprehend
the reported bugs with less time spent. The findings also show that summaries contain 54% of significant
information of the original bug reports and about 25% of the summary statements are meaningless or not
helpful for bug comprehension. However, the participants also pinpoint a major limitation with the ex-
tractive summaries of bug reports– the lack of consistency among the summary sentences. In the case of
extractive summary, sentences are often extracted out of their contexts from the original bug report, and the
participants faced difficulties in comprehending the bug from such sentences.
3.2 Related Work
During bug triaging process, the triager needs to manually comprehend the contents of the recommended
bugs, which is huge in most cases. Thus, in order to reduce the amount of data to be read for each bug report,
learning based (i.e., supervised) summarization technique can be utilized. But it has some disadvantages such
as, it usually requires large training set and it also can be biased towards the data the model was learned
from.
However, in a supervised approach, Rastkar et al. [60] investigate the possibility of automatic and effective
summarization for software artifacts so that the user can be benefited by the smaller summary instead of the
entire artifacts. To perform this investigation they create a corpus of bug reports consists of summaries for
36 bug reports by human annotators. They apply three existing classifier tarined on email (EC), email and
meeting data (EMC) as of Murray and Carenini [51], and on that manually created bug reports corpus (BRC)
and, find that bug report classifier (BRC) outperforms than the other two classifiers in generating summaries
of bug reports. To evaluate whether the created bug reports summaries have sufficient quality, they provide
generated extractive summaries to human annotators and ask them to rank using five point scale. In case of
assessing the quality of summaries by users the differences between our approach and Rastkar et al. are: (i)
in their approach human judges are instructed to read both the original bug reports and the summaries of
those reports before ranking the summaries, whereas in our approach, before evaluating the effectiveness of
provided automatic summaries at first participants are instructed to study the original bug reports and then
create the extractive summaries, and finally they study provided automatic summaries. Thus, they are not
biased by the content of the automatic summaries while creating their own summaries. (ii) in our approach
we ask the participants some other questions to estimate the relevant or irrelivant information contained in
bug report summary, but in their approach such type of investigation was not conducted.
PageRank [56] proposed by Brin and Page calculate the probability of reaching a web page from another
page by estimating the relevance of that web page. Lotufo et al. [47] first propose the use of PageRank for
unsupervised bug report summarization to develop a deeper understanding of the information exchanged in
13
bug reports. Their summarization approach based on a hypothetical model of how a reader would read a
bug report and the hypotheses reveals relevant sentences, which a reader would find most important. Lotufo
et al. use the same corpus of Rastkar et al. with a restriction that a bug report should have at least 10
comments. During assessing the quality of summaries Rastkar et al. employ graduate students, Lotufo et al.
ask the developer to evaluate the summary of the bug report who really worked on that bug report and in
our approach, we conduct a user study with the developers who do not have any prior experience with the
provided bug reports as well as summaries.
Besides important information, bug reports also contain email conversations, stack traces, pasted com-
mand outputs and so on, which are not useful from summary perspective [49]. To differentiate useful sentences
from useless ones Mani et al. [49] proposed an unsupervised summarization approach that uses a noise re-
ducer which broadly classifies each sentence into question, investigation sentence, code fragments and others.
Finally pass this filtered set of sentences to unsupervised summarizer in order to extract the summary from
the set of useful sentences.
Bettenburg et al. [27] conducted a survey among developers and users of Apache, Eclipse, and Mozilla
to determine what factors constitute a good bug report and they developed Cuezilla, a prototype tool to
measure bug report quality and to recommend which elements should be added to improve the quality. After
analyzing 466 responses they found contradictory information from developers and users where developers
consider steps to reproduce the reported bug, stack traces and test cases as helpful while those are the most
difficult for the user to supply.
Ankolekar et al. [25] developed a prototype Semantic Web system for open source software communi-
ties, Dhruv, which provides an enhanced semantic interface to bug resolution messages that identifies and
automatically links bug reports to important information about bugs. To support the normal process of
bug resolution, Dhruv support the questions that are raised like ”what” and ”why” questions where those
questions represent ”What does this software object do?” and ”Why is this fragment of code implemented
in this particular way?”.
3.3 Methodologies
Bug report contains three types of information within comments– claims, hypotheses and proposals within
comments which are often multi threaded [47]. To understand how a reader might read a bug report,
Lotufo et al. [47] consider three heuristics from their qualitative investigation - (i) users follow the threads of
conversation containing the topics that they are interested in, (ii) users give particular attention to sentences
that are evaluated by other sentences, and (iii) users focus their attention mostly on the comments that
discuss the problem which is introduced in the title of the bug and problem description. By incorporating
these three heuristics, we replicate the summarization approach of Lotufo et al., where we apply the following
steps:
14
Estimating topic similarity
First hypothesis of Lotufo et al. is that the relevance of a sentence is higher the more topics it shares with
other sentences and the more relevant are the sentences it shares topics with. Latent Dirichlet Allocation
(LDA) is a topic modeling technique that identifies topics using word co-occurrence knowledge extracted
from documents [28]. However, this technique is not lightweight and generally requires the tuning of several
different parameters Lotufo et al.. As Lotufo et al. suggest, we use cosine similarity metric in order to
estimate the similarity between two sentences within a bug report. We apply a threshold value of 0.20 for
the similarity measure which is chosen from an extensive iterative experiment. The idea is to discard the
sentence pairs which have very little similarity in the content.
Measuring Evaluation Relations
The second hypothesis by Lotufo et al. is based on evaluation relation that the relevance of a sentence is
higher the more it is evaluated by other sentences and the more relevant are the sentences that evaluate it.
In order to identify evaluation relations between sentences in the bug report, Lotufo et al. apply sentence
polarity detection using sentiment analysis which is often used in the polarity detection of movie reviews
[26], political reviews [61] and so on. In polarity detection, we first identify the evaluation sentences and
then find out whether the sentences are positive or negative. As Lotufo et al. and Go et al. [37] suggest, we
use a machine learning tool for polarity detection which is trained using a training set composed of 800,000
positive and 800,000 negative Twitter messages, and the messages are automatically annotated as of negative
or positive polarity using the emoticons present in the comments. Evaluation relation between two sentences
is bound by the precondition that there must exist a topic similarity relationship between them. It is also
affected by the ordering of the sentences in the bug report as one sentence is only assessed by any other
sentences that follows it in the conversation threads.
Combining all Measures
Third hypothesis of Lotufo et al. is that the relevance of a sentence is higher the more topics it shares with
the bug title and description. To boost the relevance of sentences with similar topics to the bug report title,
Lotufo et al. propose that for every sentence that shares topics with the bug report title, a link should be
added from every other sentence to that sentence. To measure the relevance of a sentence with description
Lotufo et al. add a link from each sentence in the description to itself. We follow Lotufo et al. in order to
compute the relevance of a sentence with bug report title and description. Finally, we combine similarity,
evaluation and title measures for each of the sentences in the bug report where we use the straightforward
weight coefficient (e.g., 1.0) for each measure as of Lotufo et al..
15
3.4 Experiment Design
In this research, we replicate hurried bug summarization technique by Lotufo et al., and create extractive
summaries for the bug reports. We use the same corpus of Rastkar et al. [60] as Lotufo et al. did, and we
collect nine bugs regarding Eclipse, Mozilla and Gnome from the corpus [14] which are used in our user
study. Thus our experiments in this research are conducted using the following two steps:
• Creation of Extractive summaries from Bug Reports.
• Design and Run of the User Study for Evaluating Bug Report Summaries
3.4.1 Creation of Bug Report Summaries
We collect nine bug reports from the same corpus [14] of Rastkar et al. [60], and perform the following steps
in order to create the extractive summary for each of the chosen bug reports.
• We compute cosine similarity between any two sentences in the bug report by applying the first hy-
pothesis of Lotufo et al..
• We exploit Twitter Sentiment Analysis API [20] in order to determine the sentiment (i.e., polarity such
as positive or negative) for each of the sentences in the bug report. We then identify the sentence pairs
where each sentence in the pair is similar (i.e., linked) in terms of topic similarity. For each of these
linked pairs, we calculate evaluation score using sentiment or polarity of each sentence as suggested by
Lotufo et al..
• For each of the sentences in a bug report, we also calculate its similarity with bug report title using
cosine similarity measure.
• We then combine all three measures in order to compute an overall score for each of the sentences. We
rank all sentences of a bug report based on their overall scores and finally choose the top ten sentences
as an extractive summary for the bug report.
3.4.2 Design of User Study
In order to evaluate the effectiveness of bug report summaries, we conduct a user study with nine participants
where we collect feedback from the participants. In the study, the participants are asked questions in order
to evaluate the usefulness or effectiveness of our created summaries (by replicating the approach of [47]) The
participants generally consult with the original bug reports, prepare their summaries for the reports, then
study the auto-generated summaries and finally answer some summary related questions. In this section,
we discuss the details of the conducted study such as task design, study participants, questionnaire for data
collection and sessions of user study.
16

Task Design
In order to evaluate the effectiveness of our bug report summaries (by replicating the approach of [47]), we
design two tasks for the participants. The tasks involve creation of extractive summaries manually, consulting
with auto-generated summaries, and providing feedback on different aspects related to the usefulness or
effectiveness of bug report summaries. Each of the tasks is simple enough to be accomplished by any
participant, and at the same time sufficient enough for exploring the potential of the summary techniques.
T1: Develop an extractive summary for a given bug report by extracting a fixed number of sentences
from the report.
Target usage: Creation of gold (i.e., manually prepared) summary.
T2: Study auto-generated summaries and gold summaries, and provide feedback by consulting both
summaries and the original bug report.
Target usage: Evaluation of bug report summary.
We choose four Mozilla bugs from Bugzilla-Mozilla [19] having IDs 495584 [10], 328600 [7], 449596 [8],
and 491925 [9], three Eclipse bugs from Bugzilla-Eclipse [16] having IDs 260502 [6], 223734 [4], and 250125
[5], and two Gnome bugs from Bugzila-Gnome [17] having IDs 156905 [2] and 164995 [3] for the study.
Each of the participants works with three separate bug reports, and then provides feedback using the study
questionnaire (Section 3.4.2).
Study Participants
We involve nine graduate research students from different Computer Science Laboratories of University of
Saskatchewan, especially from Software Research lab in our user study. Each of the participants has a
substantial amount of programming experience that includes bug fixation or resolution, and some of them
also have professional software development experience.
Questionnaire
We use a questionnaire to collect feedback from each of the participants during study sessions, and the
questionnaire contains the following questions:
• Given that you need to consult a number of bug reports and time for each bug report is limited (i.e.,
three minutes), do you think the summary by our approach provides enough information for you to
comprehend the reported bug?
Options: (a) Yes (b) No (c) Other.........................................................
• Enlist the sentences (i.e., line numbers) that you found the most important in the original bug report.
Options:..................................................................................................................
17

• Does the auto-generated summary of bug report contain those important sentences? If then mention
the percentage range.
Options: (a) 0-25% (b) 26-50% (c) 51-75% (d) 76-100%
• Enlist the sentences (i.e., line number) that you found the least helpful or meaningless while consulting
with the auto-generated summary of the bug report.
Options:..................................................................................................................
• Mention the percentage of the least useful or meaningless sentences in the auto-generated summary for
the bug report.
Options:(a) 0-25% (b) 26-50% (c) 51-75% (d) 76-100%
• Rate the usefulness/effectiveness of our provided extractive summary for the bug report.
Options:(a) Useful (b) Somewhat Useful (c) Not at all (d) Other.................................
Running of the Study
Each study takes about 40 minutes on average, and we conduct the study into two sessions–execution session
and evaluation session. This section describes those sessions briefly.
Execution Phase: In this phase, each of the participants consults with the bug report, and creates
an extractive summary by manually extracting the relevant or important sentences from the original bug
report. Then, our auto-generated summary for the same bug report is provided to the participants for
manual analysis.
Evaluation Phase: In this phase, the participants evaluate the quality or effectiveness of our auto-
generated summaries (created from the replication of the summarization technique by Lotufo et al.), and
answer the questions in the questionnaire. One might argue about the order of manual summary creation
and auto-generation; however, we choose that order to in order to avoid the bias in the evaluation. It is quite
likely that the manually prepared summary would be biased if the auto-generated summary is shown at the
first place, and we avoid that bias carefully.
Support Website
In order to conduct our user study conveniently, we design a website [23] using PHP and MySQL. Each
participant needed to register in the site to perform the user study. We provide a user-friendly interface that
assists the participants in creating their own summaries and evaluating the auto-generated summaries. Once
both summaries are analyzed against the original bug report, the participants provide their feedback using a
web form on certain aspects related to the quality or effectiveness of the summaries.
18

Communication Media
We maintain communication with the participants using e-mail correspondence, and invite them by sending
e-mails containing the link of user study site [23]. Participants completed their tasks staying either in the
lab environment or at home.
3.5 Evaluation
We evaluate the usefulness or effectiveness of our bug report summaries both using different metrics and
comparative analyses. In the first case, we compute pyramid score to determine the extent to which auto-
generated summaries (i.e., our summaries) resemble with gold summaries (i.e., summaries created by the
participants) [39] [53]. In the second case, we attempt to answer different research questions regarding the
quality of the summaries using quantitative and qualitative analysis.
3.5.1 Pyramid Score
Pyramid score is an evaluation metric that estimates the quality or usefulness of an extractive summary
based on a set of summaries manually prepared by the experts. It has been successfully applied in source
code summarization by Haiduc et al. [39]. When an automatic summary of n terms is generated, the pyramid
score for this summary is calculated as the ratio between the summations of the score received by n terms in
the automatic summary and the maximum sum of scores that could have been achieved by any automatic-n
terms summary Haiduc et al..
We consider N sentences instead of n terms for bug report summaries sentences since we deal with
sentences as the units of information in this research. We provide the same bug report to three different
participants, which help us compare each auto-generated summary with three gold summaries using the
pyramid score. TABLE 3.1 shows the pyramid scores found for nine bug reports in our study.
The obtained pyramid scores for nine software bug reports range to above or equal 0.23 for most cases
with an average of 0.48. This result indicates that the performance of automatic summaries cannot meet
users expectation well enough and thus it requires further improvement.
3.5.2 Question Wise Analysis
In this section, we analyze the feedback from the participants, and attempt to answer different research
questions regarding the quality or effectiveness of the bug report summaries.
Q1: Given that you need to consult a number of bug reports and time for each bug report is limited
(i.e., three minutes), do you think the summary by our approach provides enough information for you to
comprehend the reported bug?
19
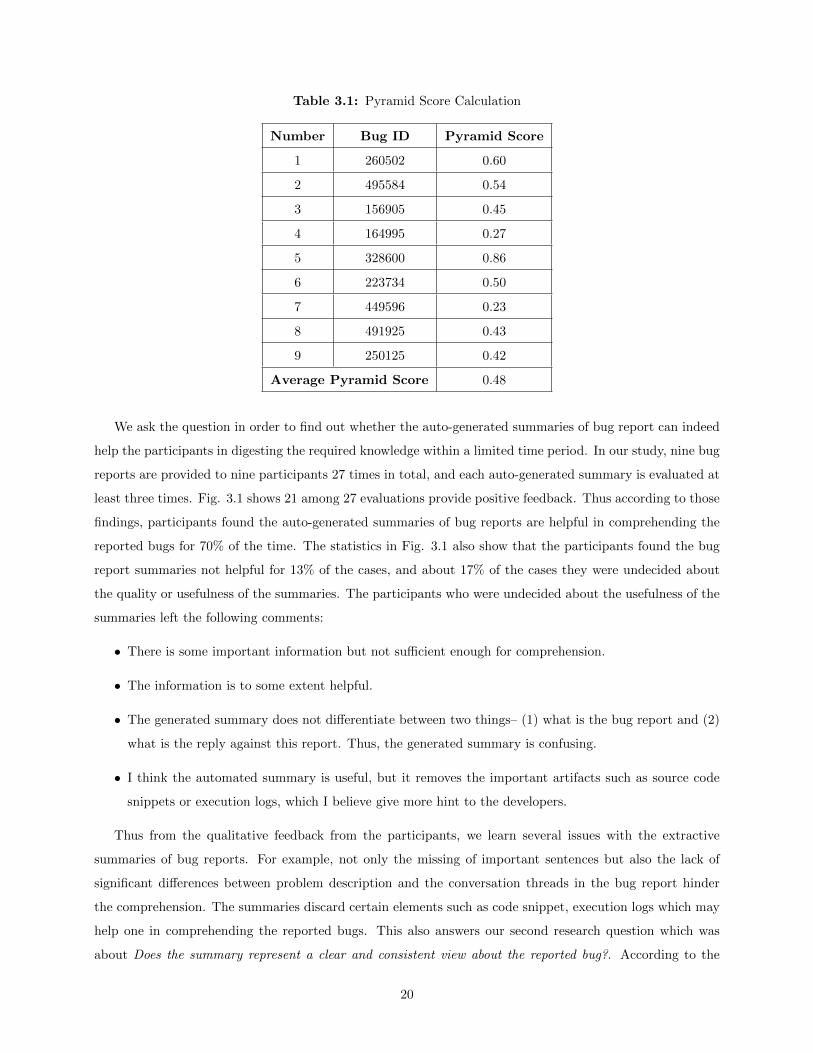
Table 3.1: Pyramid Score Calculation
Number Bug ID Pyramid Score
1 260502 0.60
2 495584 0.54
3 156905 0.45
4 164995 0.27
5 328600 0.86
6 223734 0.50
7 449596 0.23
8 491925 0.43
9 250125 0.42
Average Pyramid Score 0.48
We ask the question in order to find out whether the auto-generated summaries of bug report can indeed
help the participants in digesting the required knowledge within a limited time period. In our study, nine bug
reports are provided to nine participants 27 times in total, and each auto-generated summary is evaluated at
least three times. Fig. 3.1 shows 21 among 27 evaluations provide positive feedback. Thus according to those
findings, participants found the auto-generated summaries of bug reports are helpful in comprehending the
reported bugs for 70% of the time. The statistics in Fig. 3.1 also show that the participants found the bug
report summaries not helpful for 13% of the cases, and about 17% of the cases they were undecided about
the quality or usefulness of the summaries. The participants who were undecided about the usefulness of the
summaries left the following comments:
• There is some important information but not sufficient enough for comprehension.
• The information is to some extent helpful.
• The generated summary does not differentiate between two things– (1) what is the bug report and (2)
what is the reply against this report. Thus, the generated summary is confusing.
• I think the automated summary is useful, but it removes the important artifacts such as source code
snippets or execution logs, which I believe give more hint to the developers.
Thus from the qualitative feedback from the participants, we learn several issues with the extractive
summaries of bug reports. For example, not only the missing of important sentences but also the lack of
significant differences between problem description and the conversation threads in the bug report hinder
the comprehension. The summaries discard certain elements such as code snippet, execution logs which may
help one in comprehending the reported bugs. This also answers our second research question which was
about Does the summary represent a clear and consistent view about the reported bug?. According to the
20

Figure 3.1: The understandability of Bug Report Summary
Table 3.2: Recall for Bug Report Summary
Number Bug ID Recall
1 260502 0.45
2 495584 0.57
3 156905 0.43
4 164995 0.33
5 328600 0.60
6 223734 0.44
7 449596 0.67
8 491925 0.80
Average Recall 0.54
participants, although bug report summaries are useful, as 70% of the time participants reported them as
helpful in comprehending the bugs in less time spent, the feedback from the participants imply that the
summaries still lack consistency, and thus need improvement.
Q2: Enlist the sentences (i.e., line numbers) that you found the most important in the original bug report.
In a bug report, all sentences are not equally important, and the summary should contain the most
important or relevant statements that can represent a consistent view about the reported issue. In this
question, we attempt to determine whether the auto-generated summaries by our replicated approach contain
such important statements from the original bug reports or not. Since we are interested in determining the
fraction of the sentences in an auto-generated summary that are important in the eyes of the participants,
recall is an appropriate metric. We consider oracle, G or Gold Standard, which is made of all the summary
21

sentences (i.e., that are recommended as important) by all three participants for a single bug report. Here,
recall is the fraction of the statements in the auto-generated summary S which are also found in G, and it
can be defined as follows:
recall ={S ∩G}
G(3.1)
Table 3.2 shows the recall measures in our study. The average recall measure is 0.54 with having range
between 0.33 and 0.80. Thus, 54% of the important sentences of a bug report are presented in the auto-
generated summary. Thus, 46% (100%-54%) important information of a bug report are not contained in an
extractive summary of that report. To address this issue, we are including contextual help to the bug report
summaries (Chapter 4) so that the 46% of significant information can be comprehend by the developers from
the context of the bug reports.
Our first research question was Does the summary of a bug report contain the most important or the most
relevant information regarding the reported bug? It is found that summary of a bug report contains 54%
important information regarding the reported bug.
Q3: Does the auto-generated summary of bug report contain those important sentences? Mention the
percentage range.
As summary of a document refers to the condensed form of important parts of the document, we were
interested to find out whether our automatic summary follows that characteristic or not. While we determine
such information from statistical analysis in the case of question Q2, we also asked the participants to estimate
the fraction of important or relevant statements of a bug report presented in the auto-generated summary
from their point of view. Figure 3.2 summarizes their responses:
From Fig. 3.2, we note that, 37% of the evaluations reported that the fractions of important summary
statements vary from 51% to 75% while other 33% of the evaluations found that it is between 76% and 100%.
Thus, 70% (37% + 33%) of the evaluations made by the participants reported that the extractive summaries
of bug reports contain more than 50% important or relevant statements of the original bug reports. While
this finding shows the effectiveness of the summaries from the participants’ point of view, it also validates
our average recall measure with question Q2.
Q4: Enlist the sentences (i.e., line number) that you found the least helpful or meaningless while consulting
with the auto-generated summary of the bug report.
Most of the participants did not answer this question. Thus, the data collected from the study are not
enough to reach any conclusion. One possible reason could be that the participants did not feel confident
enough or probably felt reluctant to consider any summary statement as meaningless.
Q5: Mention the percentage of the least useful or meaningless sentences in the auto-generated summary
for the bug report.
Although the participants did not point out meaningless sentences, they provided the fractions of the
summary sentences that are meaningless or the least helpful from their educated guess, and Fig. 3.3 shows
the statistics.
22
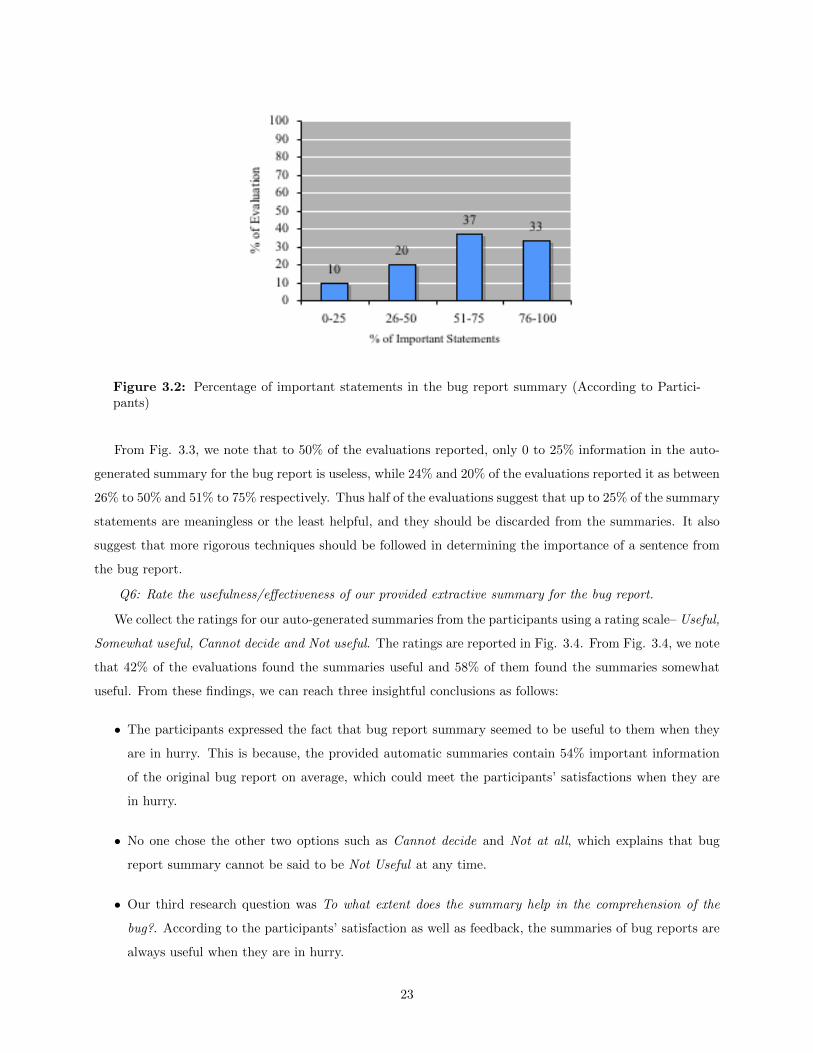
Figure 3.2: Percentage of important statements in the bug report summary (According to Partici-pants)
From Fig. 3.3, we note that to 50% of the evaluations reported, only 0 to 25% information in the auto-
generated summary for the bug report is useless, while 24% and 20% of the evaluations reported it as between
26% to 50% and 51% to 75% respectively. Thus half of the evaluations suggest that up to 25% of the summary
statements are meaningless or the least helpful, and they should be discarded from the summaries. It also
suggest that more rigorous techniques should be followed in determining the importance of a sentence from
the bug report.
Q6: Rate the usefulness/effectiveness of our provided extractive summary for the bug report.
We collect the ratings for our auto-generated summaries from the participants using a rating scale– Useful,
Somewhat useful, Cannot decide and Not useful. The ratings are reported in Fig. 3.4. From Fig. 3.4, we note
that 42% of the evaluations found the summaries useful and 58% of them found the summaries somewhat
useful. From these findings, we can reach three insightful conclusions as follows:
• The participants expressed the fact that bug report summary seemed to be useful to them when they
are in hurry. This is because, the provided automatic summaries contain 54% important information
of the original bug report on average, which could meet the participants’ satisfactions when they are
in hurry.
• No one chose the other two options such as Cannot decide and Not at all, which explains that bug
report summary cannot be said to be Not Useful at any time.
• Our third research question was To what extent does the summary help in the comprehension of the
bug?. According to the participants’ satisfaction as well as feedback, the summaries of bug reports are
always useful when they are in hurry.
23

Figure 3.3: Percentage of meaningless statements in bug report summary
3.6 Threats to Validity
We identify a few issues that may pose threats to the validity of our conducted study. This section discusses
those issues as follows:
Lack of Experience of the Participants: The participants took part in the study do not have
the professional experience for software bug management. In order to mitigate this threat we involve those
graduate students in the study who have substantial amount of programming experience that involves problem
solving and bug fixation, and some of them also have professional software development experience.
Lack of Expertise on Provided Bug Reports: While we cannot guarantee that all participants have
sufficient knowledge about the software systems or components discussed in the bug report, we tried our
best to minimize the threat by selecting only those bug reports that contains enough information about the
software or components and the reported issues are to some extent familiar to most of the developers.
3.7 Summary
In this study, we investigate the usefulness of bug report summary by conducting a task-oriented user study
with nine participants. To perform the study, we collect nine bug reports from several bug tracking systems,
and summarize each of them by following an existing unsupervised bug report summarization technique [47].
Finally, we analyze the data collected from the feedback of the participants. According to our study, 70% of
the time participants agree with the fact that bug report summaries could be a reliable mean to comprehend
the reported bug quickly. It is also found from the study that 54% of important information of an original
bug report is presented in the bug report summary and about 25% information in a bug report summary is
useless. In our user study, most of the participants rated bug report summaries as either useful or somewhat
24
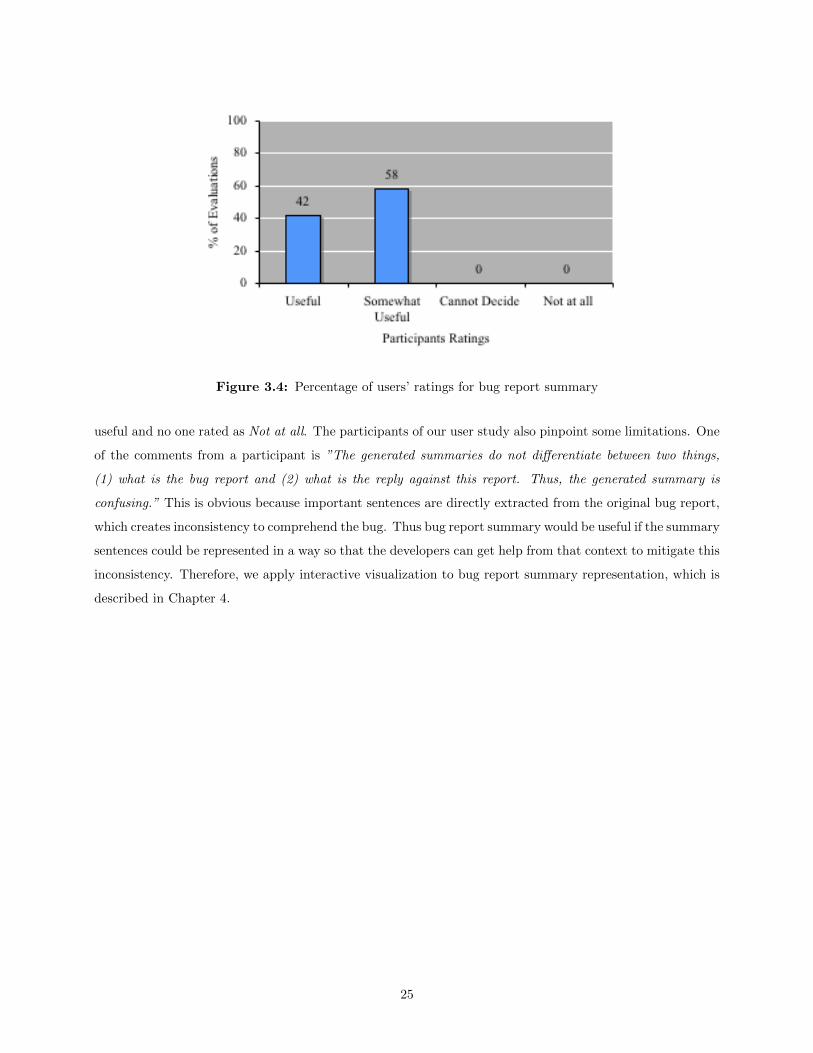
Figure 3.4: Percentage of users’ ratings for bug report summary
useful and no one rated as Not at all. The participants of our user study also pinpoint some limitations. One
of the comments from a participant is ”The generated summaries do not differentiate between two things,
(1) what is the bug report and (2) what is the reply against this report. Thus, the generated summary is
confusing.” This is obvious because important sentences are directly extracted from the original bug report,
which creates inconsistency to comprehend the bug. Thus bug report summary would be useful if the summary
sentences could be represented in a way so that the developers can get help from that context to mitigate this
inconsistency. Therefore, we apply interactive visualization to bug report summary representation, which is
described in Chapter 4.
25

Chapter 4
Interactive Visualization of Bug Reports using Topic
Evolution and Extractive Summaries
In the previous work described in Chapter 3, we first replicate a state of the art bug report summarization
technique proposed by Lotufo et al. [47] and then conduct a task-oriented user study with nine participants to
evaluate the effectiveness of bug report extractive summaries. According to the study, bug report automatic
summaries contain only 54% important information of the original bug reports and the participants reported
several problems for bug report summaries in comprehending the bugs. One of the problems is that sometimes
the participant cannot comprehend summary sentences as extractive summaries are often hard to understand
as the summary sentences are taken out of their context in the bug report, and thus they may lose their
consistency. To mitigate this issue, in this research we apply visualization techniques to bug report extractive
summaries in order to provide contextual help to the developers. To further aid developers, we also apply
topic modeling on a collection of bug reports and visualize topic evolution of the bug reports.
The rest of the chapter is organized as follows. In Section 4.2 we discuss existing studies related to our
research such as bug report visualization, summarization and so on. We propose our approach in Section
4.3. We discuss methodologies in Section 4.4. Section 4.5 discusses about our proposed visual design. We
explain detail design of the experiment, results and discussion in Section 4.6. We identify possible threats to
validity in Section 4.7 and finally we summarize this chapter in Section 4.8.
4.1 Introduction
Software bug reports are an important source of information for software development and maintenance. A
typical bug report contains several pieces of information such as description of a bug, steps to reproduce the
bug, source code, data dumps and so on. During resource allocation, a project manager distributes time
and effort for each project task and assigns appropriate developers. Estimating resource requirement is a
time-consuming task, and it often involves the study of a large number of previously filed bug reports. The
goal of the study is to determine which part of a given project is more problematic and thus needs more
attention. The task is trivial when there are only a few bugs reported. However, the number of bugs generally
increases over time, and it becomes almost impossible for a manager to analyze such a huge collection of bug
reports.
26

When a developer starts working on an existing project, it is preferable that she first familiarizes herself
with the project along with its bug reports. However, analyzing a number of bug reports manually is highly
unproductive and time consuming, and an automated tool support is likely to benefit managers and/or
developers in this regard. In this thesis, we propose a tool that offers useful insights derived from a collection
of bug reports as well as provides a visualization for the extractive summary of a bug report. Let us consider
a scenario where a project manager assigns project tasks to developers. She decides to check previously filed
bugs, and she uses an existing bug tracking system. The system returns the bugs that are critical and should
be addressed in the next version. However, she would also like to know more about these bugs– (1) Did
these critical bugs exist before this version?, (2) Are there other bugs related to these critical bugs?, (3) How
long ago did they first appear?, (4) What are other issues associated with these bugs, and so on. In order
to collect such information, one has to consult the bug database, and existing bug tracking systems such as
Bugzilla [13] might not be effective to mine such information.
In our research, we perform two major visualizations on software bug reports. The first one applies
topic modeling on a collection of bug reports and produces a visual topic-based analysis. Topic modeling
is a machine learning technique explores the hidden structure of a collection of documents [29]. Topics are
constructed statistically by identifying co-occurring words and then summarizing key concepts of a document
collection. Topic modeling on the bug reports instantly provides an overview on the amount of bugs each
of the project parts contains. A project managers can take effective steps in resource allocation using such
information.. By inspecting topic evolution over time in a time-windowed manner, a novice developer can
also be aware of the frequent bugs occurred in the past.
The second one visualizes an extractive summary of a bug report while requested by a developer. We
create the extractive summary using hurried bug summarization technique proposed by Lotufo et al. [47].
Extractive summaries are often hard to understand as the summary sentences are taken out of their context
in the original bug report, and thus they may lose their consistency. If a summary sentence can be revealed
in the original bug report, the developer can further investigate the context (i.e., the sentences that precede
or follow the summary sentence), which influences the meaning of that sentence. We provide an interactive
visualization of a bug report summary using different colour codings, to aid ones view its context in the
original bug report. Thus, a project manager or a developer can study and analyze the reported bug more
effectively but with less effort. In this thesis, Our contributions of this work include:
• A topic evolution visualization for bug reports.
• A detailed drill-down from a topic’s time-segments to its related bug reports.
• A search feature that helps developers explore related issues for a given topic-keyword.
• An interactive visualization of a bug report summary that conveniently links summary sentences to
their context.
27

We collect 3914 bug reports from Eclipse-Ant, and analyze them with our system. Several insightful
pieces of information about the project are evident from the topic evolution visualization, such as: the topic
“Tool Launch and Configuration” is one of the most frequently occurring topics and thus a developer needs
to pay more attention regarding the bugs associated with this topic. We also evaluate the quality of the
time-segment keywords for the top 5 topics and it is shown that our system outperforms a term frequency
based system [46] in terms of precision, recall and F-measure.
Our system helps the developer in the above scenario to more conveniently and quickly dig deeper into a
large collection of bug reports including the bug reports from the prevision versions. For example, from our
system now she is able to know that the top most occurring topics are ‘Plugin’, ‘Tools’, ‘Page’ and so on as
depicted in Table 4.3. From the visualization of a topic such as in Figure 4.3, she can explore when a topic
peaked. For further information, she can drill-down into the bug reports containing that topic as in Fig. 4.4.
Assuming that an existing bug tracking system suggested some critical bugs to her, then with our tool she
can check whether the keywords from those critical bugs exist in the keywords of the top topics or not. Our
search capability can help her to discover how many as well as which bugs exist with those keywords along
with their duration. She will be able to further assess the severity of critical bugs by also considering related
bug reports and the time duration of a topic. A lengthy time duration of a topic containing the relevant
keywords may indicate a more severe level of bug, as it has a possibility of occurring again in future. If
required, she is able to study the summaries of the bug reports as shown in Fig. 4.7, which will also reduce
her time and effort as she no longer needs to read the complete bug report.
4.2 Related Work
To represent the evolution of bugs D’Ambros et al. [33] propose a visualization technique called System
Radiography that indicates which parts are the most problematic parts in a system. They also provide
useful insight regarding the life cycle of a bug by another visualization technique- Bug Watch. A different
visualization technique is proposed by Dal Sassc and Lanza [31] in order to represent a fine-grained view of
a bug report. To analyze bug tracking system, they also propose a visual analytic platform called in*Bug.
Hora et al. [43] present a tool, BugMaps to map reported bugs to defects in the classes of object oriented
systems and provide many interactive visualizations for decision support. To uncover the relationship of how
an evolving software is affected by software bugs, D’Ambros and Lanza [32] propose an visual approach that
show the evolution of software entities at different levels of granularity. The main differences between those
work and our prototype are that (i) for visualization of bugs, we are using topic evolution over time, but
D’Ambros et al. use matrix-based representation, Dal Sassc and Lanza propose a web-based visual analytics
platform, and Hora et al. utilize Distribution Map and (ii) that none of these existing studies visualizes bug
report extractive summaries which we do.
Topic modeling has been successfully applied in different fields, including: cross-project analysis [41],
28
email summarizing [45], and patient records [63]. In the case of software bug management, topic modeling
has been used to classify bug reports from non-bugs [58], detect duplicate bug reports [55], recommend buggy
files in source code level [54], and so on.
Hindle et al. [41] proposed a time-windowed model to aid a developer understand a software project.
They apply both Latent Dirichlet Allocation (LDA) [29] and Latent Semantic Indexing (LSI) tools on the
source control repository and analyze commit comments in a timely manner and demonstrate developers
focus changes by comparing sets of topics over time Hindle et al.. The keyword sets associated with each
topic is meaningless if they are not labeled appropriately, because not all associated words carry the same
importance. To automatically label topics, Hindle et al. [42] propose an approach to assign context-sensitive
labels from a generalizable cross-project taxonomy.
Martie et al. [50] apply LDA topic modeling on a large collection of documents containing discussion
data from Android developers. A limitation of this work is that although they consider discussion trends
over time they use the same associated keywords throughout the discussion trends. Topic evolution seems
to be meaningless to developers if a topic’s associated keywords do not change over time. To mitigate this
problem, in our work, we extract frequently used keywords associated with each topic for each time window
as a summary, and we refer them as time-sensitives keywords. Thus, our approach is more time specific than
theirs.
In software engineering (SE), some new technologies gain popularity while other technologies fail or
diminish popularity. To investigate the impact of the changes of technologies on Software Engineering research
field, Demeyer et al. [35] apply a mining technique (N-Gram) on the complete corpus of ten years of MSR
(Mining Software Repositories) papers and compute the normalized frequency of keywords to measure their
occurrence over time. This paper inspired us to apply a mining technique on large datasets of bug reports.
They retrieve a number of keywords that more frequently occur together, whereas a topic of interest can
be expressed in a few words (one or two), but this also results in a large volume of data to inspect, a time
consuming task. In our system, topics are associated with a reasonable number of keywords and express a
distinct type. Moreover, none of the previous work interactively visualizes topic evolution over time, which
we do.
In the field of information visualization, researchers have deployed two types of visualization techniques:
one is metadata-based and the other is content-based. In the first approach, metadata of text documents
are visualized [52] [57]. For example, email metadata contain data specific to an e-mail such as attachment
count (i.e., number of attachments in the e-mail), attachment flag (i.e., indicates whether an e-mail has
an attachment or not) and so on. However, metadata-based approach is good for extracting information,
which are hidden in the text. If the document does not contain enough metadata then it is not useful at
all. Viegas et al. [62] propose a tool that visualizes keywords in a content-based approach. Havre et al.
[40] use a symmetric river metaphor to represent thematic variations over time in the context of a time-line
and corresponding external events. Here, the symmetry around the horizontal axis of the river makes it
29
easier for users to perceive flow patterns and changes from group of currents. TIARA (Text Insight via
Automated Responsive Analytics) [63] conveys far more complex text analysis results than Havre et al. by
showing detailed thematic content in keywords. TIARA is a visual analytic system that shows the content
evolution of topics over time Wei et al.. Wei et al. extract topics from email data and patient records, and
generate time-sensitive keywords to represent topic evolution. The differences between their Wei et al. tool
and ours is that (i) we are adapting techniques proposed by Wei et al. in demonstrating topic evolution of
software bug reports rather than email data, and (ii) we are visualizing extractive summaries which they did
not.
The concept of PageRank [56] is to measure the probability of textual similarity, where they calculate
the probability of reaching a web page from another page by estimating the relevance of web pages. Lotufo
et al. [47] first propose the use of PageRank for unsupervised bug report summarization to develop a deeper
understanding of the information exchanged in a bug report. Their summarization approach Lotufo et al. is
based on a hypothetical model of how a reader would read a bug report and the hypotheses reveals relevance
sentences computed by sentiment analysis, which a reader would find most important.
Rastkar et al. [60] investigate the possibility of summarizing automatically and effectively so that the
user can benefit from the smaller summary instead of the entire artifact. To perform this investigation they
created a corpus of bug reports consisting of summaries for 36 bug reports by human annotators. Then
they trained classifiers separately on only email, and then on both email and meeting data, and finally on
those manually created bug reports corpus and found that the classifier that trained on the bug reports
outperforms the other two in generating summaries of bug reports. Lotufo et al. use the same corpus as
Rastkar et al. with a restriction that a bug report should have at least 10 comments. While assessing the
quality of the summaries Rastkar et al. employ graduate students and Lotufo et al. ask the developer to
evaluate the summary of a bug who really worked on that bug. While bug triaging, the triager still needs to
manually study the contents of the recommended bugs, which takes longer in most cases. A learning based
automatic summarization technique can reduce the amount of data but it also has some disadvantages like it
usually requires a large training set and it also can be biased towards the data the model learned. Mani et al.
[49] proposed an unsupervised summarization approach that uses a noise reducer which broadly classifies
each sentence into question, investigation sentence, code fragments and others, then passes this filtered set
to unsupervised summarizer to extract the summary from the set of useful sentences. The purpose of using
a noise reducer is to differentiate useful sentences from useless sentences such as noise email dump, chat
transcripts, because a typical bug report contains large amount of such kinds of noise.
In this research, besides showing topic evolution of bug reports, we also apply hurried bug summarization
approach proposed by Lotufo et al. to create summaries of bug reports and then visualize them in a convenient
way that improve their understandability for the developer. To the best of our knowledge, no visualization
has yet been done for the extractive summaries of bug reports. Thus, we are the first proposing this kind of
visualization.
30

Figure 4.1: Schematic Digram of Topic Evolution Visualizer
Figure 4.2: Schematic Diagram of Bug Report Summarizer
4.3 Proposed Approach
We propose a standalone tool, which analyzes the bug-reports downloaded from official bug-repositories such
as Bugzilla [16]. We divide our proposed tool in two different parts: Part I is related to the features that are
based on topic modeling and Part II creates extractive summaries of bug reports and visualizes them.
We further divide the topic modeling part (Part I) into two individual phases- analytics and visualization.
In the analytics phase, we collect bug reports from a popular bug tracking system Eclipse, and perform
preprocessing such as stemming, stop word removal and so on. We then apply LDA topic modeling on
the preprocessed data utilizing Gibbs Sampling to extract topics. We utilize JGibbLDA1, which is a Java
implementation of LDA, to apply topic modeling on our dataset. Then we filter keywords per topic and
finally extract time-sensitive keywords for each time interval. In the visualization phase, we visualize topic
evolution with the help of a popular Java chart library JFreeChart2, where the X-axis represents time and the
Y-axis represents the number of bugs containing that topic. We implement our tool in Java. Our proposed
system architecture for part I is shown in Fig. 4.1.
In the summary visualization (Part II), shown in Fig. 4.2, we create bug report summaries applying
1http://jgibblda.sourceforge.net2http://www.jfree.org/jfreechart/
31
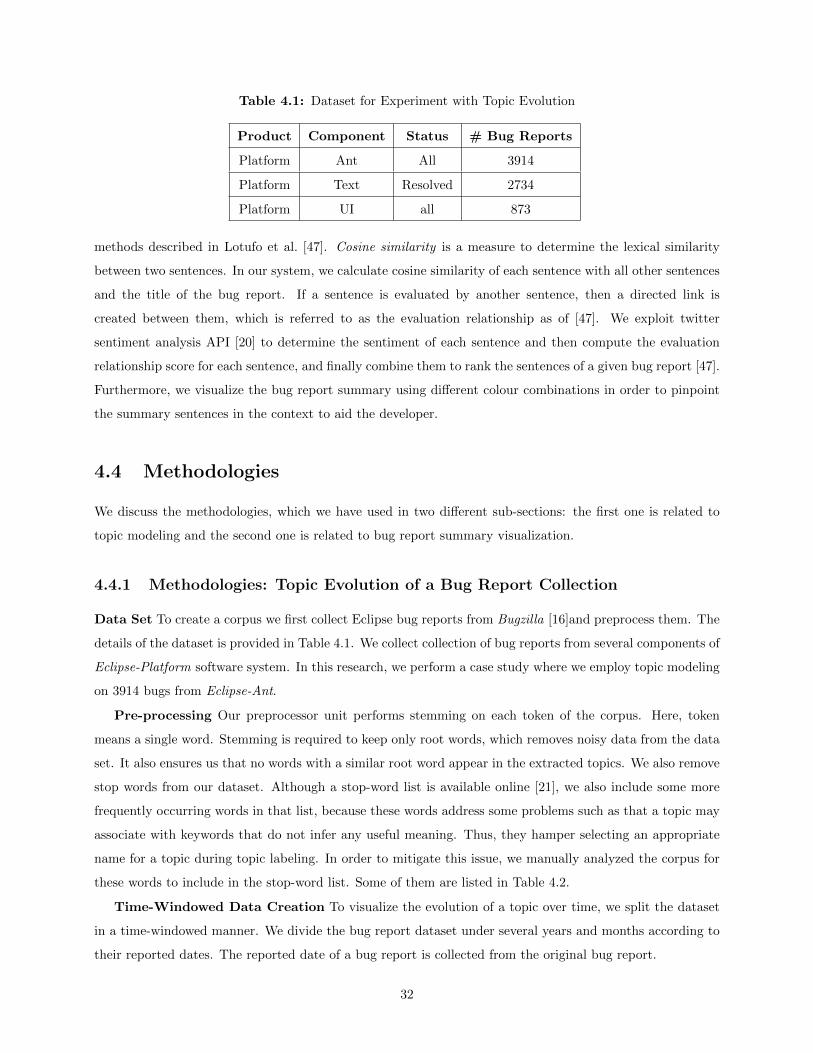
Table 4.1: Dataset for Experiment with Topic Evolution
Product Component Status # Bug Reports
Platform Ant All 3914
Platform Text Resolved 2734
Platform UI all 873
methods described in Lotufo et al. [47]. Cosine similarity is a measure to determine the lexical similarity
between two sentences. In our system, we calculate cosine similarity of each sentence with all other sentences
and the title of the bug report. If a sentence is evaluated by another sentence, then a directed link is
created between them, which is referred to as the evaluation relationship as of [47]. We exploit twitter
sentiment analysis API [20] to determine the sentiment of each sentence and then compute the evaluation
relationship score for each sentence, and finally combine them to rank the sentences of a given bug report [47].
Furthermore, we visualize the bug report summary using different colour combinations in order to pinpoint
the summary sentences in the context to aid the developer.
4.4 Methodologies
We discuss the methodologies, which we have used in two different sub-sections: the first one is related to
topic modeling and the second one is related to bug report summary visualization.
4.4.1 Methodologies: Topic Evolution of a Bug Report Collection
Data Set To create a corpus we first collect Eclipse bug reports from Bugzilla [16]and preprocess them. The
details of the dataset is provided in Table 4.1. We collect collection of bug reports from several components of
Eclipse-Platform software system. In this research, we perform a case study where we employ topic modeling
on 3914 bugs from Eclipse-Ant.
Pre-processing Our preprocessor unit performs stemming on each token of the corpus. Here, token
means a single word. Stemming is required to keep only root words, which removes noisy data from the data
set. It also ensures us that no words with a similar root word appear in the extracted topics. We also remove
stop words from our dataset. Although a stop-word list is available online [21], we also include some more
frequently occurring words in that list, because these words address some problems such as that a topic may
associate with keywords that do not infer any useful meaning. Thus, they hamper selecting an appropriate
name for a topic during topic labeling. In order to mitigate this issue, we manually analyzed the corpus for
these words to include in the stop-word list. Some of them are listed in Table 4.2.
Time-Windowed Data Creation To visualize the evolution of a topic over time, we split the dataset
in a time-windowed manner. We divide the bug report dataset under several years and months according to
their reported dates. The reported date of a bug report is collected from the original bug report.
32

Table 4.2: Manually Created Stop-word List for Eclipse-Ant Bug Reports
bug like need just doesn’t try id
make does think look don’t new fine
don’t want know i’m it’s happen change
thing thank all goes sure tri click
able good did better problem create got
thi comment excep except come check ill
Topic Analysis A topic implies the thematic content common to a set of text documents. After pre-
processing, the collection of bug reports are considered as a collection of text documents. Each document is
composed of a sequence of words. Each topic is referred to by a set of keywords that form a topic-keywords
distribution and this distribution is independent within all text documents. Each keyword in a topic has
a probability that represents its likelihood of appearing in that topic. To retrieve time-sensitive keywords
for each topic, our topic model uses two matrices: a document-topic distribution matrix and a topic-word
distribution matrix.
From the document-topic distribution matrix, we see that each document may be associated with all
topics with some probability. Therefore, we use a threshold-based technique to assign a topic to a document.
After considering different values we use a threshold of 0.01 in our experiment as using this threshold results
reasonable number of topics can be assigned to each document. We also restrict a document from having
no more than five topics to ensure that each bug report should be associated with some dominated topics,
not all. During topic modeling we restrict the number of iterations to 3000 and generate 20 topics, as we
observed too many common keywords among topics can be associated if we consider more than 20 topics for
the dataset we have used.
Topic Ranking LDA topic modeling outputs 20 topics, which are randomly ordered. One of the reasons
to apply topic modeling is to discover the topics that appear in most of the bug reports. Therefore, we
rank the topics so that the most important topics appear first in the topic list. To rank topics, we consider
generic topics that occur in all documents. So, the rank of a topic is measured by a combination of both
topic content coverage and topic variance (i.e., how far a topic is spread out). For bug report topic ranking
we adapted the topic ranking algorithm of Wei et al., who used a topic ranking algorithm to rank topics in
an email-summarizer. We calculate mean, variance, and then rank them as follows:
mean, µ =
∑Ni=1 θti ×Ni∑N
i=1Ni
(4.1)
variance, σ2 =
∑Ni=1(θti − µ)×Ni∑N
i=1Ni
(4.2)
rankt = µtσt (4.3)
Given a document-topic distribution θ, the rank of a topic t is computed and N is the total number of
33

documents and θti is the probability distribution of topic t in document i.
Filtering Keywords for Topics In LDA topic modeling, some extracted keywords of a given topic may
not be ideal for understanding the theme (i.e., name or label or definition) of the topic. There are some
keywords that appear in all documents, which are too generic to express any topic definition. Therefore,
we summarize each topic by filtering these type of keywords from that topic. The strategy is, a keyword
is important for a topic - if it appears frequently in that topic and does not occur frequently in any other
topics. This actually measures the TF-IDF (Term Frequency and Inverse Document Frequency) score of
each keyword in a bug reports collection. Here, the occurrence of a keyword is calculated by the probability
measure of that keyword in a topic. We adapted the approach of Wei et al. to topic analysis on a bug
reports collection. Given topic-word distribution λ, we compute the weight of each keyword kwm derived
from the original LDA model and then sort them in ascending order to select the top n keywords per topic.
we calculate the weight of each keyword using the following equation:
weight(kwm) = λtm × logλtm
(∏T
j=1 λjm)1/T(4.4)
Where T is the total number of topics and λtm, is the probability of keyword kwm in topic t.
Time-sensitive Keyword Extraction In our tool, we visualize topic evolution over time, where the
most frequently occurring keywords are selected and presented in each time-segment of a topic. At the
beginning, we divided the collection of bug reports into subsections, each of them is associated with a
particular time such as a month and a year. For each time-segment of a topic, we extract keywords, which
appear frequently both in that topic and time-segment. We also consider the highest peak from different
values within a time interval. For example, assuming that in 2003 all bug reports from Eclipse-Ant were
reported in January, March, June, and December. Also assuming that a given topic is contained in 60, 47, 89
and 56 bug reports respectively during these four months. Then our system will consider the value 89 as the
number of bug reports associated with that topic, against the year of 2003. To extract time-sensitive keywords
we adapted the procedure of Wei et al.. During this selection, we consider two factors for each keyword of a
topic: (i) if the keyword appears frequently in the sub collection (i.e., time-segment), it is important, (ii) but
if it also occurs in any other sub collections, it is not important. The main point of this type of selection is to
extract those keywords for a topic that can be used to distinguish that topic uniquely from other topics. We
collect each word dwm of sub collection s, compute its weight and select the top n keywords as time-sensitive
keywords for each topic-segment after sorting them in ascending order. Given topic t, term frequency of word
dwm is denoted as TFtsm, and so word-weight is calculated using the following equation:
weight(dwm) =TFtsm∑Ss TFtsm
+ λtm × logλtm
(∏T
j=1 λjm)1/T(4.5)
Topic Naming In our proposed tool, experienced developers are allowed to label a topic manually, which
depends on their skills with that project. So, we manually label the top 5 topics depicted in Table 4.6. We
start from left to right, pick a keyword, keep it if it has significant dominance or discard it if it can be placed
34
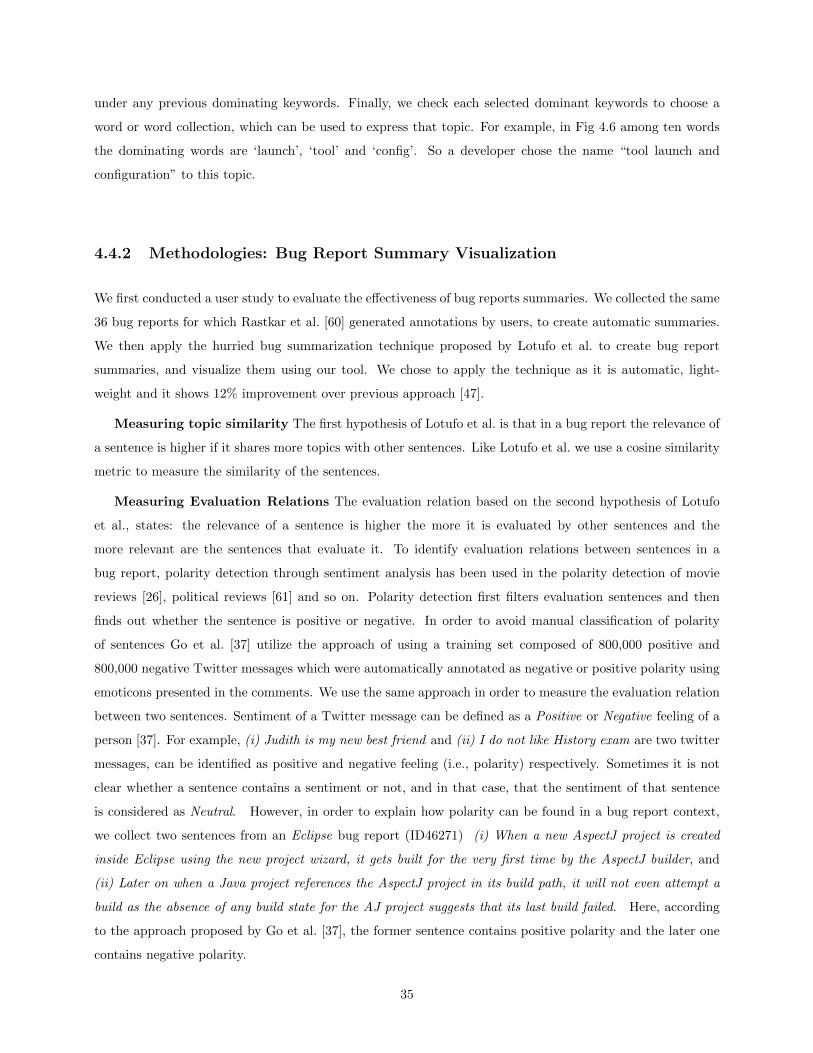
under any previous dominating keywords. Finally, we check each selected dominant keywords to choose a
word or word collection, which can be used to express that topic. For example, in Fig 4.6 among ten words
the dominating words are ‘launch’, ‘tool’ and ‘config’. So a developer chose the name “tool launch and
configuration” to this topic.
4.4.2 Methodologies: Bug Report Summary Visualization
We first conducted a user study to evaluate the effectiveness of bug reports summaries. We collected the same
36 bug reports for which Rastkar et al. [60] generated annotations by users, to create automatic summaries.
We then apply the hurried bug summarization technique proposed by Lotufo et al. to create bug report
summaries, and visualize them using our tool. We chose to apply the technique as it is automatic, light-
weight and it shows 12% improvement over previous approach [47].
Measuring topic similarity The first hypothesis of Lotufo et al. is that in a bug report the relevance of
a sentence is higher if it shares more topics with other sentences. Like Lotufo et al. we use a cosine similarity
metric to measure the similarity of the sentences.
Measuring Evaluation Relations The evaluation relation based on the second hypothesis of Lotufo
et al., states: the relevance of a sentence is higher the more it is evaluated by other sentences and the
more relevant are the sentences that evaluate it. To identify evaluation relations between sentences in a
bug report, polarity detection through sentiment analysis has been used in the polarity detection of movie
reviews [26], political reviews [61] and so on. Polarity detection first filters evaluation sentences and then
finds out whether the sentence is positive or negative. In order to avoid manual classification of polarity
of sentences Go et al. [37] utilize the approach of using a training set composed of 800,000 positive and
800,000 negative Twitter messages which were automatically annotated as negative or positive polarity using
emoticons presented in the comments. We use the same approach in order to measure the evaluation relation
between two sentences. Sentiment of a Twitter message can be defined as a Positive or Negative feeling of a
person [37]. For example, (i) Judith is my new best friend and (ii) I do not like History exam are two twitter
messages, can be identified as positive and negative feeling (i.e., polarity) respectively. Sometimes it is not
clear whether a sentence contains a sentiment or not, and in that case, that the sentiment of that sentence
is considered as Neutral. However, in order to explain how polarity can be found in a bug report context,
we collect two sentences from an Eclipse bug report (ID46271) (i) When a new AspectJ project is created
inside Eclipse using the new project wizard, it gets built for the very first time by the AspectJ builder, and
(ii) Later on when a Java project references the AspectJ project in its build path, it will not even attempt a
build as the absence of any build state for the AJ project suggests that its last build failed. Here, according
to the approach proposed by Go et al. [37], the former sentence contains positive polarity and the later one
contains negative polarity.
35

Figure 4.3: Topic Evolution Example (Topic 3: Tool Launch and Configuration)
4.5 Proposed Visual Designs
One of the main objectives of our proposed tool is to provide insightful information to developers through
software bug reports as they evolve over time. That is why, we design our tool so as to provide the highest
possible information interactively. Currently, our visualization tool: (i) generates as well as shows topic
evolution of each topic automatically, (ii) then for further inspection it retrieves all software bug reports
associated with a given topic along with their Bug Report IDs and titles, (iii) provides a searching option so
that a developer can search bug reports by keywords associated with a topic, and (iv) visualizes an extractive
summary of each bug report.
We utilize an area-graph based visual layout to represent topic evolution (i.e., content changes over time
as in Fig. 4.3). Our tool generates the visual summary of each topic individually. At first we tested our tool
with a stacked graph (i.e., arranging topics one after another for five or more topics in the same visual layout),
but this caused several information hazards. Therefore, we decided to generate one topic visually each time.
However, this area layout is depicted by set of keywords clouds in order to show the content evolution over
time. The height of the area graph at each time-segment (here, a year) encodes the strength of the topic for
that point (Fig. 4.3). Strength is calculated by the number of software bug reports containing that topic at
the certain point. The functionality of our visualization tool is described in the following subsections.
36

Figure 4.4: Topic Drill Down in the Context
4.5.1 Topic Evolution of a Collection of Bug Reports
Once a developer selects a dataset (i.e., a collection of bug reports) the system automatically applies topic
modeling to it. After performing some analytics on the produced topic model, the tool depicts the topic
evolution of several topics derived from the dataset. From this visualized output, both experienced and
novice developers can analyze which type of topics are evolved most of the time and associated with most of
the bugs. By analyzing bug report topic evolution, a manager can check the year in which a given project
contains the highest number of bugs, and which of the topics occur more frequently. Thus, the manager can
identify the parts of the project which are affected by the highest number of bugs, and such information can
aid the manager in different decisions making activities associated with that software project.
A topic is associated with a set of keywords, and say an experienced developer has good expertise on the
project related to the provided collection of bug reports, and therefore, by inspecting the top ten keywords
for each topic, that developer is able to understand what is suggested by those keywords. Therefore, she
can label (i.e., Fig. 4.6) that topic easily, but in case of a novice developer she is not asked to label a topic,
rather she is able to gather insightful information from topic evolution as well as topic-keywords. This is not
necessarily a limitation of the system, because on one hand we would like to utilize the skills of an experienced
developer during topic labeling, and on other hand we are providing some other features such as drill-down,
searching and so on to the novice developer so that she can enrich her knowledge about the bug reports
collection.
37

Figure 4.5: Search by Keywords
4.5.2 Drilldown Inspection in Context
In LDA topic modeling, keywords that are assigned to a topic are extracted automatically. Therefore, two
situations may occur: (i) the one or more associated keywords that are not important enough to understand
the topic, and (ii) the developer cannot understand the topic-keywords relationship to formulate a topic
label. Therefore, in these circumstances, to help the developer in understanding a topic, our tool provides
the opportunity to drill down from the topics to the document collection level. The only way to gain more
knowledge about the topic-keywords relationship is to study the context in the document collection, from
which they have come. So, if the developer requests for more information regarding a topic, then all bug
report IDs and titles associated with that topic will be shown, as is depicted in left part of the Fig. 4.4. In this
way, the context of the bug reports will aid the developer in gathering enough knowledge to identify that topic
precisely. During resolving a new bug, a developer might be interested to gather knowledge from existing
similar bugs so that she can apply existing expertise in order to fix that bug. She can collect important
keywords from the provided new bug as well as can check which topic contains those keywords. From topic
drilldown feature, she can investigate all bug reports under a topic of interest in order to enrich her knowledge
and thus, can apply existing expertise on the newly reported bug.
38
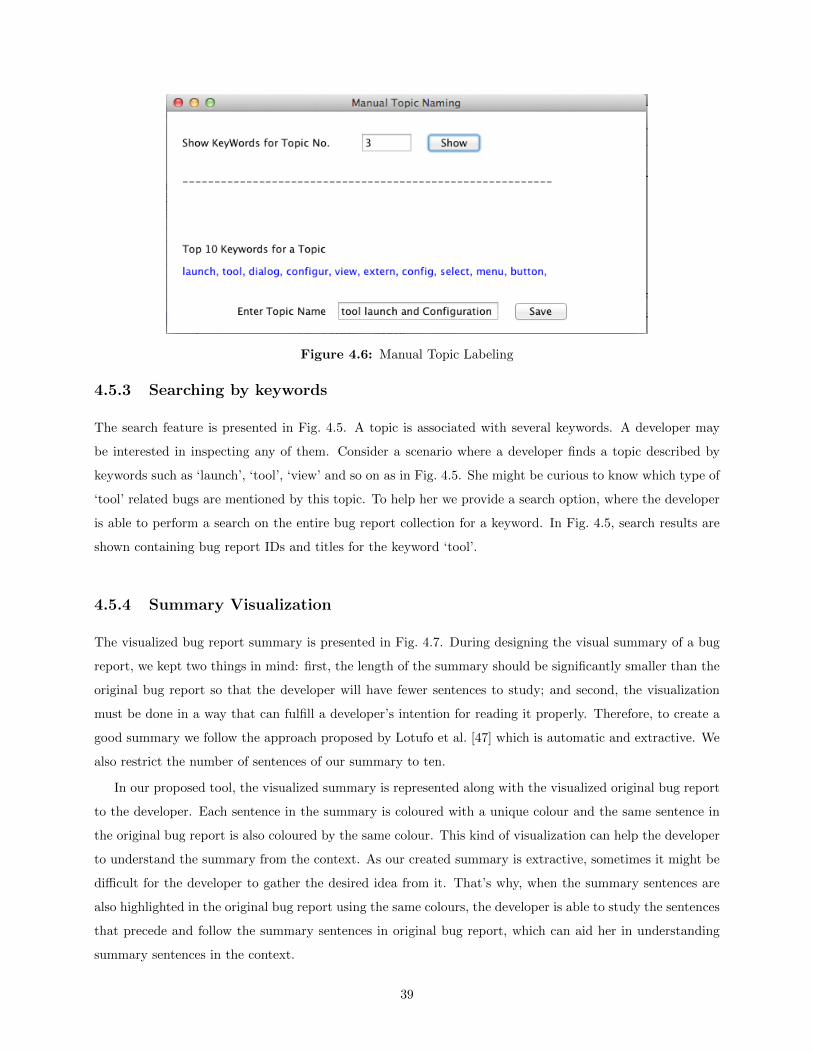
Figure 4.6: Manual Topic Labeling
4.5.3 Searching by keywords
The search feature is presented in Fig. 4.5. A topic is associated with several keywords. A developer may
be interested in inspecting any of them. Consider a scenario where a developer finds a topic described by
keywords such as ‘launch’, ‘tool’, ‘view’ and so on as in Fig. 4.5. She might be curious to know which type of
‘tool’ related bugs are mentioned by this topic. To help her we provide a search option, where the developer
is able to perform a search on the entire bug report collection for a keyword. In Fig. 4.5, search results are
shown containing bug report IDs and titles for the keyword ‘tool’.
4.5.4 Summary Visualization
The visualized bug report summary is presented in Fig. 4.7. During designing the visual summary of a bug
report, we kept two things in mind: first, the length of the summary should be significantly smaller than the
original bug report so that the developer will have fewer sentences to study; and second, the visualization
must be done in a way that can fulfill a developer’s intention for reading it properly. Therefore, to create a
good summary we follow the approach proposed by Lotufo et al. [47] which is automatic and extractive. We
also restrict the number of sentences of our summary to ten.
In our proposed tool, the visualized summary is represented along with the visualized original bug report
to the developer. Each sentence in the summary is coloured with a unique colour and the same sentence in
the original bug report is also coloured by the same colour. This kind of visualization can help the developer
to understand the summary from the context. As our created summary is extractive, sometimes it might be
difficult for the developer to gather the desired idea from it. That’s why, when the summary sentences are
also highlighted in the original bug report using the same colours, the developer is able to study the sentences
that precede and follow the summary sentences in original bug report, which can aid her in understanding
summary sentences in the context.
39
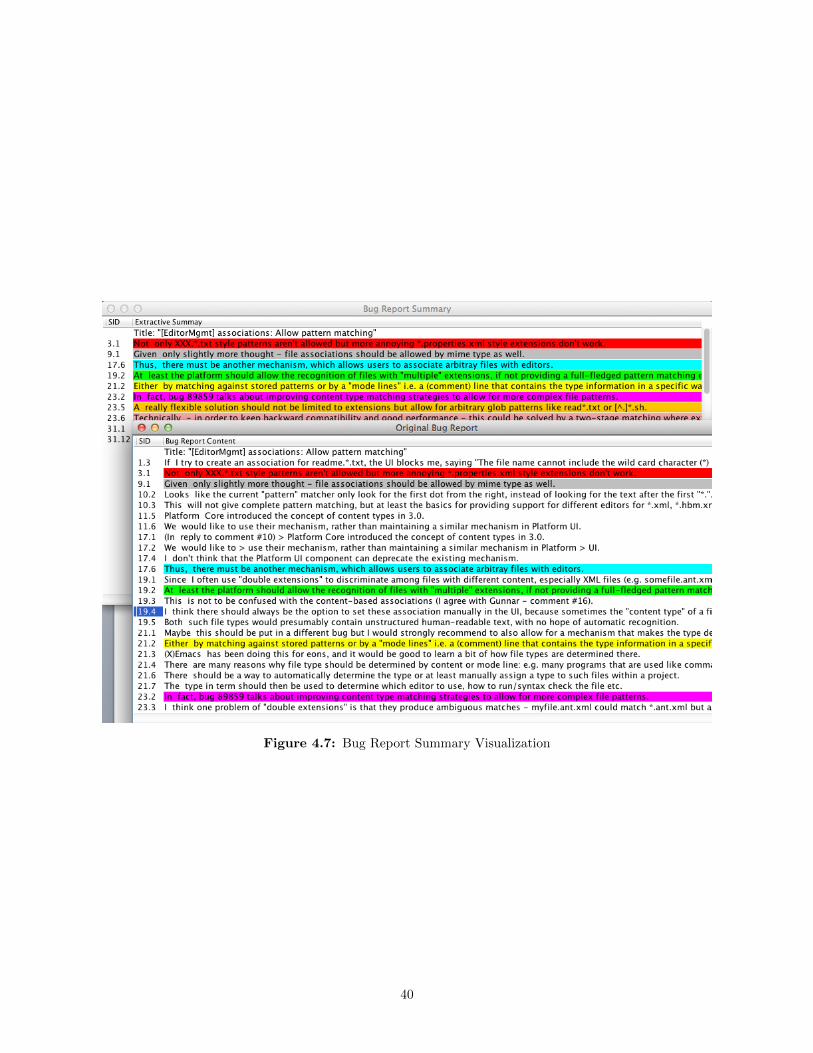
Figure 4.7: Bug Report Summary Visualization
40

4.6 Experiment & Discussion
We divide our experiment into three different sections. First we discuss some scenarios in a case study to
evaluate the effectiveness of topic evolution over time, then we measure the quality of time-sensitive keywords
in terms of precision, recall and F-measure, and finally we do a comparative analysis between a visualized
and non-visualized bug report summary.
4.6.1 An Example Case Study: Effectiveness of Topic Evolution
In software bug management, an existing bug repository always works as a good source of information.
Sometimes a bug which is already fixed can be reopened. Search on existing bug repository is generally
performed for finding similar or duplicate bugs. Thus, studying an existing bug database is beneficial even if
the bugs are fixed. However, to examine the effectiveness of topic evolution, let us assume a scenario where a
novice developer will soon start working on Eclipse-Ant, and at the beginning she wants to give a quick look
at its bugs. At present, Eclipse-Ant contains 3914 bug reports and definitely studying all of them would take
a long time. Therefore, in this situation, we are providing our tool that can aid her to more conveniently and
quickly dig deeper into a large collection of bug reports including the bug reports from the previous versions.
From our tool we can see 20 topics as output, each of which have 10 keywords. To keep this discussion simple,
an example of the top most 5 topics together with their associated keywords are provided in Table 4.3. We see
that the 1st, 2nd and 3rd topics are about ‘Plug in’, ‘Editor’ and ‘Tool’ respectively. During searching these
keywords are both in Bugzilla and our tool; a different number of bug reports result as shown in Table 4.4.
Our tool retrieves more bug reports than Bugzilla for each keyword (Table 4.4). To investigate the reason
behind this, we randomly as well as manually check results both from our proposed tool and Bugzilla. In
Bugzilla almost all retrieved bug reports contain searching keyword in their titles, because Bugzilla produces
search results based on bug report titles only, where we consider the contents of the bug report in addition
to the title during searching.
In our scenario, from Table 4.3, the novice developer can gather an idea regarding the most occurring
problems (i.e., bugs) in Eclipse-Ant, which are related to ‘plug-in’, ‘editor’, ‘tool’, ‘log’ and so on. To dig
deeper she can also search by those keywords as in Fig. 4.5, and can have a clear idea about how many bug
reports are associated with each top topic. Below are some questions we can use our tool to address for the
above scenario.
• Which month/year was the most crucial period for Eclipse-Ant bugs?
• What was the most active topic in a given year such as 2003 or 2009?
• What was discussed in the most active topic?
• Which bugs are associated with the most active topic?
41
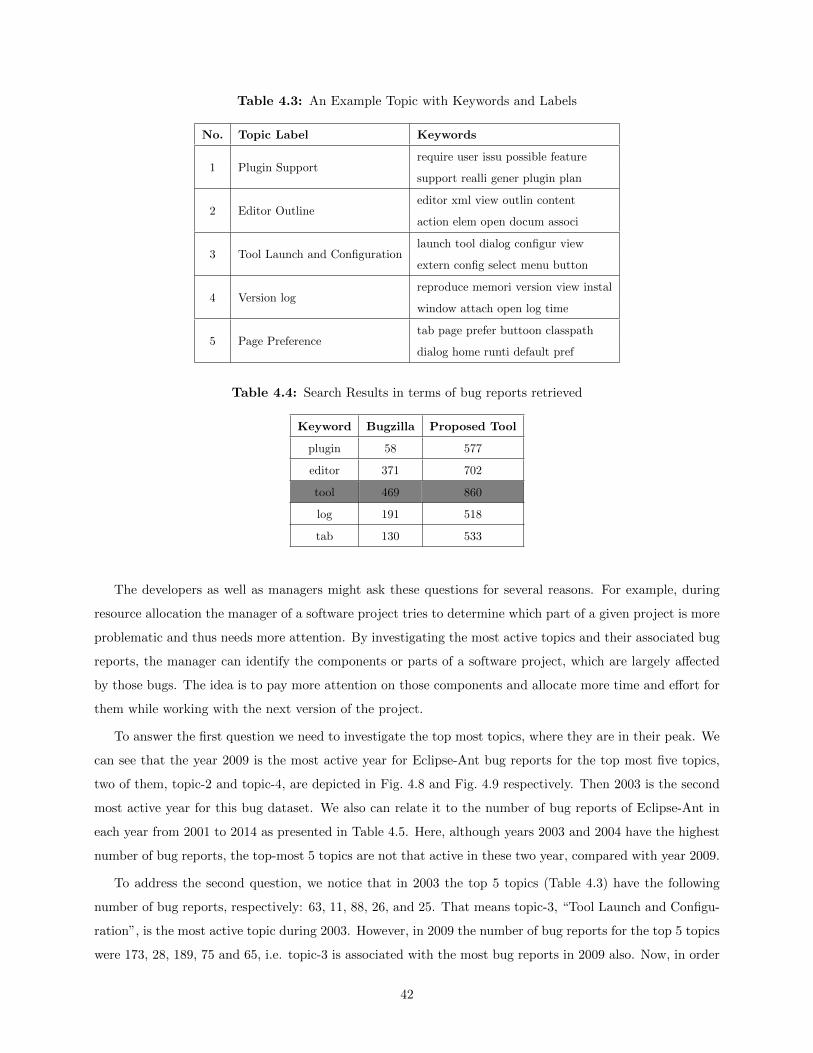
Table 4.3: An Example Topic with Keywords and Labels
No. Topic Label Keywords
1 Plugin Supportrequire user issu possible feature
support realli gener plugin plan
2 Editor Outlineeditor xml view outlin content
action elem open docum associ
3 Tool Launch and Configurationlaunch tool dialog configur view
extern config select menu button
4 Version logreproduce memori version view instal
window attach open log time
5 Page Preferencetab page prefer buttoon classpath
dialog home runti default pref
Table 4.4: Search Results in terms of bug reports retrieved
Keyword Bugzilla Proposed Tool
plugin 58 577
editor 371 702
tool 469 860
log 191 518
tab 130 533
The developers as well as managers might ask these questions for several reasons. For example, during
resource allocation the manager of a software project tries to determine which part of a given project is more
problematic and thus needs more attention. By investigating the most active topics and their associated bug
reports, the manager can identify the components or parts of a software project, which are largely affected
by those bugs. The idea is to pay more attention on those components and allocate more time and effort for
them while working with the next version of the project.
To answer the first question we need to investigate the top most topics, where they are in their peak. We
can see that the year 2009 is the most active year for Eclipse-Ant bug reports for the top most five topics,
two of them, topic-2 and topic-4, are depicted in Fig. 4.8 and Fig. 4.9 respectively. Then 2003 is the second
most active year for this bug dataset. We also can relate it to the number of bug reports of Eclipse-Ant in
each year from 2001 to 2014 as presented in Table 4.5. Here, although years 2003 and 2004 have the highest
number of bug reports, the top-most 5 topics are not that active in these two year, compared with year 2009.
To address the second question, we notice that in 2003 the top 5 topics (Table 4.3) have the following
number of bug reports, respectively: 63, 11, 88, 26, and 25. That means topic-3, “Tool Launch and Configu-
ration”, is the most active topic during 2003. However, in 2009 the number of bug reports for the top 5 topics
were 173, 28, 189, 75 and 65, i.e. topic-3 is associated with the most bug reports in 2009 also. Now, in order
42

Table 4.5: # of Bug Reports in Eclipse-Ant from 2001 to 2014
Year # Bug Reports Year # Bug Reports
2001 17 2008 114
2002 484 2009 510
2003 776 2010 90
2004 728 2011 128
2005 479 2012 71
2006 256 2013 91
2007 155 2014 15
to investigate the relevant bug reports under the most active topic (i.e., Tool Launch and Configuration),
our detail drilldown feature can aid developers by showing all bug report IDs and titles associated with that
topic as depicted in Fig. 4.4.
It is also observed from Table 4.3 that the most crucial topic, i.e., topic-3 contains keywords such as
‘launch, ‘tool’, ‘dialog’, ‘configur’, ‘view’ and so on. We can verify it with searching results presented in
Table 4.4, where we can see that the highest number of bug reports are retrieved against keyword ‘tool’ both
from Bugzilla and our proposed tool.
4.6.2 Evaluation of the Quality of Time-Sensitive Keywords
For each topic, we select the time-sensitive keywords for each time-segment (i.e., based on a certain time
period), which are used to represent the content evolution of that topic over time. In order to assess the
quality of the time-sensitive keywords, we compute precision, recall and F-measure of each topic in all of
their time-segments. We check whether we can recover the original keywords of a topic by combining the
keywords associated with each time segment. We consider a Term Frequency-Based (TF-based) system as
the baseline system for comparison. As in our proposed tool no more than 10 keywords can be shown in
each time segment, so for each of the top 5 topics, we retrieve the top 10 keywords in each time segment
both by our proposed system and by the TF-based system. Then for each topic we create an keyword union
by combining all keywords retrieved from all of it’s time segments, and separately compare each keyword
union with the top 50 keywords derived by the LDA topic model. Given a set of time-sensitive keywords
tskt = tskt1, tskt2, ........., tsk
tN of topic t where N is the number of topic segments, and St is the keyword
based topic summary for topic t, then the F-measure is computed by the following equation:
F t = 2× precisiont × recallt
precisiont + recallt(4.6)
Where, precisiont =|tskt ⋂St|
|tskt| and recallt =|tskt ⋂St|
|St|
We calculate mean precision, recall and F-measure for the top 5 topics both for TF-Based system and our
proposed tool, which are shown in Table4.6. Table4.6 represents that in average, our proposed visualization
43

Figure 4.8: Topic-2 (Editor Outline)
shows 53% precision, 64% recall and 57% F-measure and thus, outperforms TF-Based systems [46] in all
measures. It implies our selected time-sensitive keywords for each topic segment are aligned with original
topic-keywords far more than a TF-Based system.
4.6.3 Comparative Analysis of Visualized form of Bug Report Summary
To perform comparative analysis of bug reports, we first need to determine whether a bug report summary is
useful or not. After conducting a user study discussed in Chapter 3, we have already shown that a bug report
summary is beneficial to the developers especially when they are in a hurry. So, let us determine whether it
is beneficial to include visualization along with the bug report summary.
When conducting the user study (Chapter 3) some of the participants commented that they cannot
understand the automatic summary as the sentences were picked from the original bug report and they lack
contextual meaning. Creating an extractive summary automatically in a consistent form is a difficult task.
One approach is to determine a convenient way of providing contextual help to the developers. We design
the visual form of the bug report summary where each sentence is coloured by a distinct colour and the
same sentence is also coloured by the same colour in the original bug report. Therefore, if a developer cannot
understand a sentence in the bug report summary, then she can quickly have a look at the original bug report
pointed to by the same colour to read it in context. We conduct a task-oriented user study to validate the
usefulness of visualized bug report summaries, which is described in Chapter 5.
44
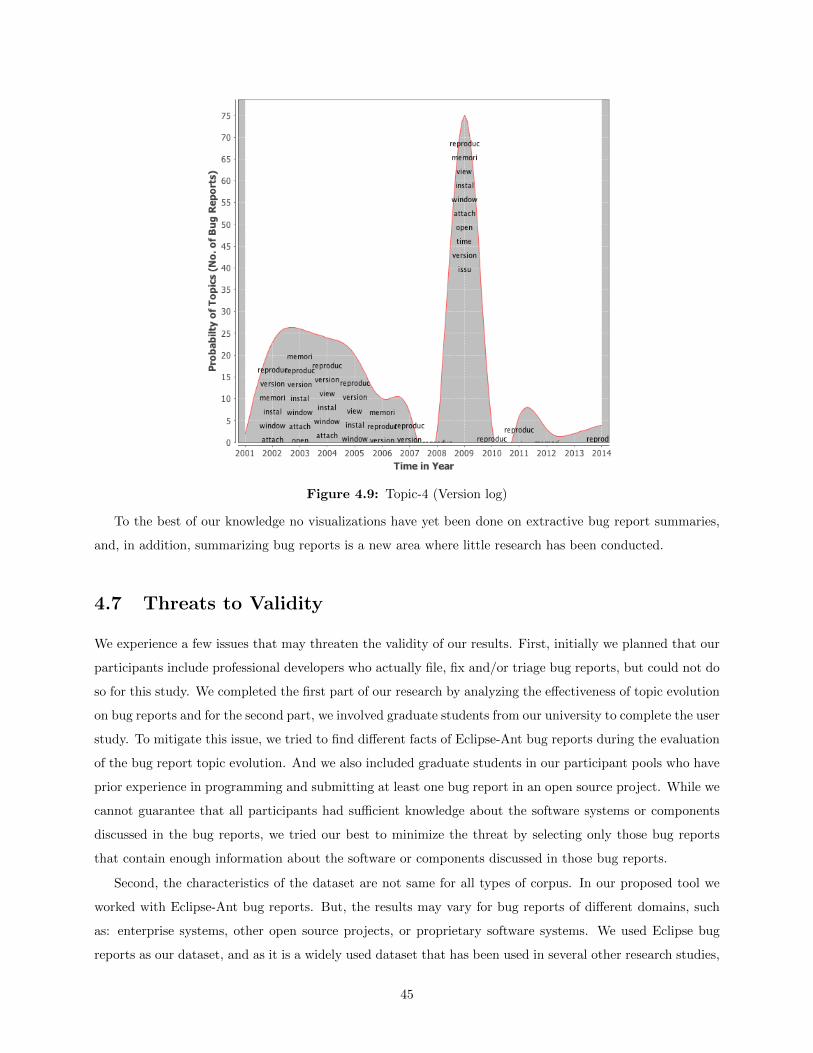
Figure 4.9: Topic-4 (Version log)
To the best of our knowledge no visualizations have yet been done on extractive bug report summaries,
and, in addition, summarizing bug reports is a new area where little research has been conducted.
4.7 Threats to Validity
We experience a few issues that may threaten the validity of our results. First, initially we planned that our
participants include professional developers who actually file, fix and/or triage bug reports, but could not do
so for this study. We completed the first part of our research by analyzing the effectiveness of topic evolution
on bug reports and for the second part, we involved graduate students from our university to complete the user
study. To mitigate this issue, we tried to find different facts of Eclipse-Ant bug reports during the evaluation
of the bug report topic evolution. And we also included graduate students in our participant pools who have
prior experience in programming and submitting at least one bug report in an open source project. While we
cannot guarantee that all participants had sufficient knowledge about the software systems or components
discussed in the bug reports, we tried our best to minimize the threat by selecting only those bug reports
that contain enough information about the software or components discussed in those bug reports.
Second, the characteristics of the dataset are not same for all types of corpus. In our proposed tool we
worked with Eclipse-Ant bug reports. But, the results may vary for bug reports of different domains, such
as: enterprise systems, other open source projects, or proprietary software systems. We used Eclipse bug
reports as our dataset, and as it is a widely used dataset that has been used in several other research studies,
45
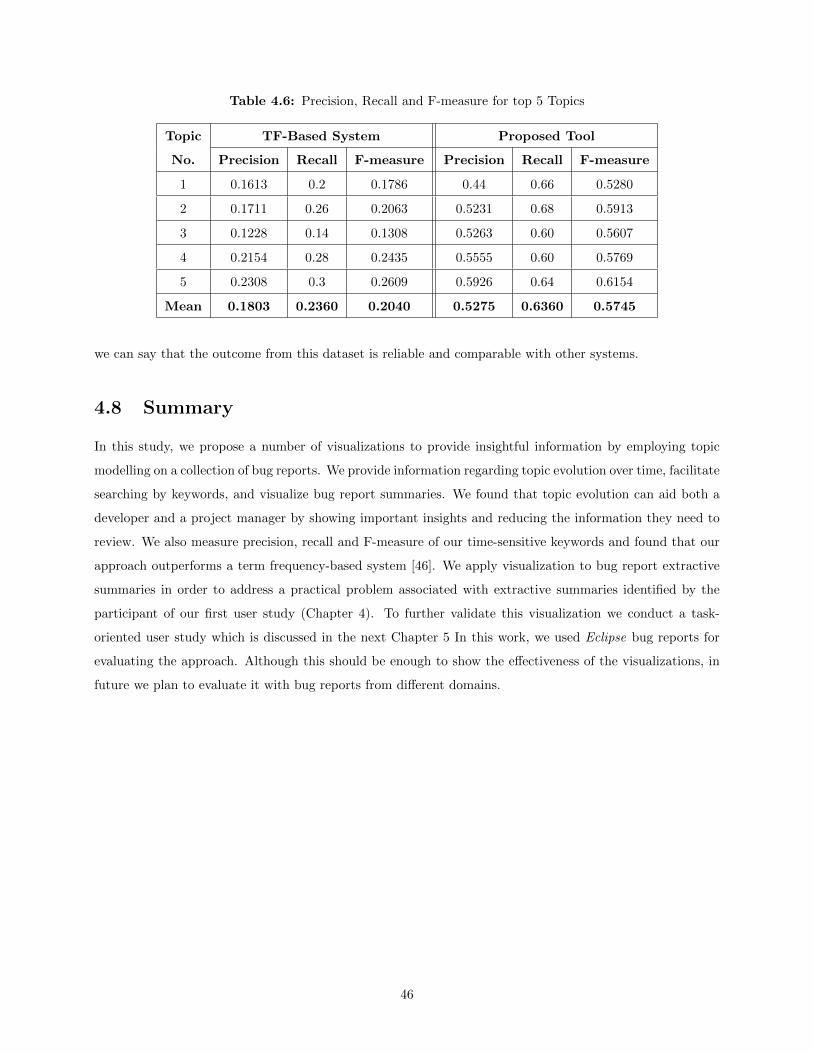
Table 4.6: Precision, Recall and F-measure for top 5 Topics
Topic TF-Based System Proposed Tool
No. Precision Recall F-measure Precision Recall F-measure
1 0.1613 0.2 0.1786 0.44 0.66 0.5280
2 0.1711 0.26 0.2063 0.5231 0.68 0.5913
3 0.1228 0.14 0.1308 0.5263 0.60 0.5607
4 0.2154 0.28 0.2435 0.5555 0.60 0.5769
5 0.2308 0.3 0.2609 0.5926 0.64 0.6154
Mean 0.1803 0.2360 0.2040 0.5275 0.6360 0.5745
we can say that the outcome from this dataset is reliable and comparable with other systems.
4.8 Summary
In this study, we propose a number of visualizations to provide insightful information by employing topic
modelling on a collection of bug reports. We provide information regarding topic evolution over time, facilitate
searching by keywords, and visualize bug report summaries. We found that topic evolution can aid both a
developer and a project manager by showing important insights and reducing the information they need to
review. We also measure precision, recall and F-measure of our time-sensitive keywords and found that our
approach outperforms a term frequency-based system [46]. We apply visualization to bug report extractive
summaries in order to address a practical problem associated with extractive summaries identified by the
participant of our first user study (Chapter 4). To further validate this visualization we conduct a task-
oriented user study which is discussed in the next Chapter 5 In this work, we used Eclipse bug reports for
evaluating the approach. Although this should be enough to show the effectiveness of the visualizations, in
future we plan to evaluate it with bug reports from different domains.
46

Chapter 5
Evaluation of Bug Report Visualization: A Task-Oriented
User Study
We employ topic modeling on a collection of bug reports to show topic evolution of bug reports over time,
which is described in Chapter 4. We also apply visualization to the bug reports extractive summaries to
address a practical problem associated with extractive summaries. Now, in order to validate the applicability
of our bug report summary visualization, we conduct a user study with six participants where we collect
feedback from the participants. In the study, the participants identify duplicate bugs by consulting with
two types of summaries– our visualized summaries and plaintext or non-visualized summaries of the bug
reports, and then compare our visualized summaries with plaintext or non-visualized summaries based on
their working experience with them. In this chapter, we discuss different parts of the conducted study such
as task design, study participants, questionnaire for data collection, sessions of user study, result collection
and data analysis.
The rest of the chapter is organized as follows. In section 5.1, We explain detail design of the user study.
In Section 5.2 we discuss running phases of our study. Section 5.3 discusses results and fundings of our user
study. We identify possible threats to validity in Section 5.4 and finally we summarize this chapter in Section
5.5.
5.1 Design of User Study
5.1.1 Task Design
In order to evaluate the effectiveness of visualized bug report summaries, we design two tasks that involve the
identification of duplicate bugs from a collection for a newly reported bug. Each of the tasks is simple enough
to be accomplished by any participant, and at the same time sufficient enough for exploring the potential of
any of the summary representation techniques.
T1: Identify duplicate bugs from a collection of eight bug reports for a given bug report by consulting
plaintext or non-visualized extractive summaries of the bug reports.
Target usage: Evaluation of non-visualized summary.
T2: Identify duplicate bugs from a collection of eight bug reports for a given bug report by consulting
47
visualized extractive summaries of the bug reports.
Target usage: Evaluation of visualized summary.
We choose two Eclipse bugs from Bugzilla [13] having IDs 62468 [11] and 14890 [1] for the study. We
denote them as Bug Report1 and Bug Report2 respectively in the remaining of the chapter.
5.1.2 Study Participants
We choose six graduate research students from Software Research Lab, University of Saskatchewan, as the
participants for the study. Each of the participants has a substantial amount of programming experience that
includes bug fixation or resolution, and some of them have professional software development experience.
5.1.3 Questionnaire
We use a questionnaire to collect feedback from each of the participants during the study sessions, and the
questionnaire contains the following questions:
For non-visualized summaries, we ask the following questions:
• Consult with plaintext or non-visualized summaries of bug reports, and label each of the eight candidate
bug reports for duplicity. Use these labels for labeling: Duplicate (D), Near Duplicate (NRD), Not
Duplicate (ND), Related (R) and Not Related (NR).
Options: 1........2........3.........4........5........6.........7........8........
• In extractive summary, sentences are often extracted out of their contexts in the bug report, which
might need to be consulted for easier comprehension. How much difficulty did you face in locating the
contexts of the summary sentences in the original bug report?
Options: (a) Very hard (b) Hard (c) Not hard not easy (d) Easy (e) Very Easy
• How often did you switch between the summary and the original bug report for context analysis?
Options: (a) Very often (b) Often (c) Sometimes (d) Hardly (e) Never
• Rate the usefulness/effectiveness of a plaintext or non-visualized bug report summary in bug compre-
hension on the scale from 1 (least useful) to 10 (most useful).
Options:..........................................................................................
• Rate the overall look and feel of the non-visualized summary on the scale from 1 (least helpful) to 10
(most helpful).
Options:...........................................................................................
For visualized bug report summary, we ask the following questions:
48

• Consult with visualized summaries of bug reports, and label each of the eight candidate bug reports for
duplicity. Use these labels for labeling: Duplicate (D), Near Duplicate (NRD), Not Duplicate (ND),
Related (R) and Not Related (NR).
Options: 1........2........3.........4........5........6.........7........8........
• Rate the usefulness/effectiveness of visualized bug report summary in bug comprehension on the scale
from 1 (least useful) to 10 (most useful)
Options: ..........................................................................................
• Rate the overall look and feel of visualized summary on the scale from 1 (least helpful) to 10 (most
helpful).
Options: ..........................................................................................
• Do you think that the visualized bug report summary is more effective than plaintext or non-visualized
bug report summary for quick comprehension of the reported bug?
Options: (a) Strongly Agree (b) Agree (c) Neutral (d) Disagree (e) Strongly disagree
• How to improve the visualized summary for more easier comprehension of bug reports? Please provide
your suggestions.
Options:................................................................................................
5.2 Run of Study Session
We run our user study in two sessions- execution phase and evaluation phase as follows:
5.2.1 Execution Phase
At the beginning of the user study, we brief the participants about the tasks to be completed. It usually takes
3-5 minutes. We divide the six participants into two groups- Group A (P1, P3, P5) and Group B (P2, P4,
P6). Participants in Group A perform tasks where they identify duplicate bug reports for BugReport1 using
non-visualized summaries and also do the same for BugReport2 using visualized summaries. On the other
hand, participants from Group B identify duplicate bugs for BugReport1 using visualized summaries and for
BugReport2 using plaintext or non-visualized summaries. At first, the participants analyze the summaries
as well as the bug reports of the candidate bugs for a given bug report, and then, fill up the first and sixth
questions of the questionnaire (Section 5.1.3). The session lasts about 15-20 minutes on average.
5.2.2 Evaluation Phase
In this phase, participants answer the rest of the questions from questionnaire (Section 5.1.3), where they
compare the effectiveness of visualized bug report summaries with non-visualized bug report summaries in
49

Table 5.1: Difficulty and Frequency Scales
Difficulty Levels Scales Frequency Levels Scales
Very hard 5 Very often 5
Hard 4 Often 4
Not hard nor easy 3 Sometimes 3
Easy 2 Hardly 2
Very Easy 1 Never 1
identifying duplicate bugs for a given bug report from a list of candidate bugs. We also collect qualitative
suggestions from the participants on how to further improve the interactive visualization. This phase takes
about 5-10 minutes on average.
5.3 Result Analysis and Discussion
We analyze the feedback collected from participants during evaluation phase, and contrast our visualized
summaries with non-visualized summaries for determining effectiveness in the identification of duplicate bug
reports. This section discusses the findings from our comparative analysis.
5.3.1 Evaluation Metrics
We apply two metrics- Average Rating and Mann-Whitney U-Test [18] for evaluation. The first metric shows
whether two lists of measures are equal or not in terms of their central values, and the second one determines
if the lists are significantly different from each other. We define the both metrics as follows:
Average Rating: It averages a list of ratings, where each rating is associated with a certain interval. In
our user study, we consider ”1” as lowest rating and ”10” as the highest rating. We compute average for the
ratings on certain features of the bug report summaries such as Convenience for context analysis, Difficulty
in context analysis, Efficiency in bug comprehension and so on.
Mann-Whitney U-Test: It is a non-parametric statistical test that compares between two sets of
ordinal measures. In our user study, this test is used to determine whether the ratings provided by the
participants for the visualized summaries are significantly differ from that of non-visualized summaries. This
test outputs two measures- U and p-values. We consider a significance level of 0.05 i.e., if p-value is less than
0.05 for a pair of rating lists, then they are significantly different from each other and vice versa.
5.3.2 Motivating Factors of Visualization to Bug Report Summaries
We apply visualization to the extractive summaries of bug reports to aid developers in comprehending bugs
conveniently. In order to identify the motivating factors behind our visualization, we collect responses from
50

Table 5.2: Participants ratings behind motivating factors of our Summary Visualization
Motivating Factors P1 P2 P3 P4 P5 P6 Avg. Comment
Difficulty- Finding summary sentences in original bug report 5 3 5 5 5 4 4.5 Very hard
Frequency- Context switching between summary and bug report 3 2 3 3 4 4 3.17 Sometimes
Table 5.3: Rating of Efficiency and Look & Feel by participants
Features Approach P1 P2 P3 P4 P5 P6 U-value p-value RD
EfficiencyNon-Visualized Summary 5 6 3 5 6 6
0 0.00512 SVisualized Summary 7 10 8 8 9 7
Look & FeelNon-Visualized Summary 5 7 4 3 6 6
1.5 0.01046 SVisualized Summary 7 10 8 7 9 7
the participants where we set appropriate scales to certain factors such as Difficulty (i.e., finding summary
sentences in original bug report) and frequency (i.e., context switching between summary and bug report)
in (Table 5.1). We transform the participants’ feedback into numerical scales. Table 5.2 shows individual
responses on the motivating factors and their average measures. From Table 5.2, we note that locating
sentences of a non-visualized summary in original bug report is very hard for the participants. It is required
when the developer cannot comprehend the summary sentences because of their inconsistencies and moves to
the original bug report for contextual help. From Table 5.2, we note that although the participants attempt
to focus on the summary for bug comprehension, sometimes still they need to switch between bug report and
its summary. Thus, the responses from the participants indicate that the support for context analysis for the
summary sentences of the bug report should be made more accessible and user-friendly to the developers,
and we apply interactive visualization for that purpose.
5.3.3 Comparison between Visualized and Non-visualized Bug Report Extrac-
tive Summaries
We identify two features- Efficiency and Look and Feel to compare the performance between our visualized
summaries and the traditional non-visualized summaries. Fig. 5.1 shows the average ratings for both features,
where we note that visualized bug report summaries are highly rated compared to the non-visualized for
each feature by the participants. In order to determine whether the ratings for visualized summaries are
significantly higher than that of non-visualized ones, we conduct Mann-Whitney U-test. We apply this test
on both sets of ratings from the same participants. Table 5.3 shows that the ratings are significantly different
for both features- Efficiency and look and feel of the bug report summaries.
In our user study, all (i.e., six ) participants select the option Agree with the fact that visualized bug
report summary is more effective than non-visualized summary for comprehending the reported bug quickly.
Three out of them (i.e., 50%) report that they Strongly Agree with this. Thus, most of the participants in
our study highly agreed on the effectiveness of visualized bug report summary over non-visualized summary.
51

Figure 5.1: Rating of Efficiency and Look and Feel
We also observe the completion time that participants take for both tasks with non-visualized and visu-
alized summaries. According to our experiments, the participants took 10.5 minutes on average in order to
complete their tasks with non-visualized summaries, whereas they took 8.8 minutes on average for the same
purpose with visualized summaries. Although the timing difference is small, this might be significant when
large number of bug reports are handled by the developers. Thus in terms of task completion time, visualized
summaries are found more effective than traditional plaintext or non-visualized summaries of bug reports for
the comprehension of the bugs.
5.3.4 Qualitative Suggestions from Participants
Participants pin-point some useful suggestions that can improve the visualization of the extractive summaries
of bug reports, and they are listed as follows:
• Keyword highlighting: Important keywords from the given bug report should be highlighted both
in the summary and the original bug report of the candidate bugs.
• Hyper linking: Summary sentences should be hyper linked to the corresponding in the original bug
report.
• Mouse hover capabilities: When a developer hovers the mouse on a summary sentence, the same
sentence in the original bug report should be highlighted or blinked.
• Look and feel: One of the participants suggest lighter colors for highlighting a sentence or keyword.
• Text wrapping: The text should be wrapped in order to avoid scrolling for the summaries of the bug
reports.
52

5.4 Threats to Validity
We identify a few potential threats to the validity of our conducted user study. One of them is lack of
professional experience of the participants for bug report management. In practice, the task of identifying
duplicate bugs from a collection of bugs is performed by a triager who generally has some prior knowledge on
the provided bugs. In order to mitigate the threat, we thus choose two frequent issues related with memory
leak and build dependency which are often faced by the developers (i.e., participants). This actually facilitated
our conducted study as we intended to determine the effectiveness of visualized bug report summary where
the developers are average users rather than experts.
Second, the participants are chosen from among the peers for our user study, and some of them are from
Software Research lab. Thus one can argue about the potential bias in the ratings by the participants for
our system. While we cannot rule out the possibility of such bias, we adopted a careful technique in order
to mitigate such bias in the evaluation. The study sessions with each of the participants were conducted in
isolation and the evaluation was based on their instant working experience as well as their best judgment.
Third, the number of participants involved in our conducted user study is not enough. In order to mitigate
this threat we involve those graduate students in the study who have substantial amount of programming
experience that involves problem solving and bug fixation, and some of them also have professional software
development experience.
5.5 Summary
In this chapter, we validate the effectiveness of the visualized extractive summaries of the bug report by
conducting a task-oriented user study. We design two tasks for the study that involve the identification
of duplicate bugs from a recommended bug collection for two given bug reports. Each of the participants
performs those tasks by consulting with non-visualized and visualized summaries of the bug reports and
records their feedback as the questionnaire responses. We then analyze those feedbacks and contrast our
visualized summaries with traditional non-visualized summaries of bug reports for effectiveness. We also
collect qualitative suggestion from the participants, and point out certain threats to the validity of the study.
In our study, the performance of the visualized bug report summaries are highly rated by the participants
compared to the non-visualized. Moreover, most of the participants agreed that visualized summaries are
more effective than non-visualized for comprehending the bug report quickly. They also pin-point some useful
suggestions, which can be used to improve the visualization of bug report summary. Thus, in future, in order
to improve the visualization of bug report summary we plan to add some of the features suggested by the
participants such as important keyword highlighting, tool tip option on summary sentences, and so on.
53
Chapter 6
Conclusion
6.1 Concluding Remarks
Software bugs are issues that hamper the work of the users of a software system. Software bug reports contain
information about the bugs following an unstructured or a semi-structured form using natural language text.
The developer who fixes or resolves a bug is also required to study a series of relevant bug reports in order to
enrich her knowledge. The triager (i.e., manager) who assigns bugs to the developers often needs to consult a
lot of bug reports for the identification of duplicate bug reports. so that existing knowledge or expertise can
be reused for fixing the new bugs. Project managers often also need to consult and analyze a large collection
of bug reports for different management activities. Thus, each of the managers, triagers and developers need
to consult with a number of bug reports for their tasks. However, because of the sheer weight of numbers and
the size of the bug reports, manually analyzing a collection of bug reports is time-consuming and ineffective.
One way to mitigate this issue is to consult with the summary of a bug report rather than the full bug report,
and there exist several summarization techniques [60], [49], [47] for bug reports. Most of these summarization
techniques provide extractive summaries of bug reports where summary statements are directly extracted
from the original bug report. However, the effectiveness of this type of extractive summaries for either expert
or average developers in comprehending bugs is not clear. Thus, to determine the effectiveness of bug report
summaries, in our thesis, at first we replicate a state of the art summarization technique [47] and then
conduct a task-oriented user study in order to evaluate the extractive summaries. Most of the participants
in our study report that the summaries are useful for comprehending the bug reports. They also point out
some limitations of extractive summaries that hinder the comprehension of the reported bugs such as lack of
consistency among the summary sentences. In order to mitigate that limitation and further assist developers
with insightful information about the bug reports, in this thesis, we propose an interactive visualization that
not only visualizes the extractive summaries but also the topic evolution of bug reports. Finally, we perform
a case study for evaluating the topic evolution and conduct a task-oriented user study in order to validate
our interactive visualization for bug report summaries. Thus, in this thesis we conduct three separate studies
including two user studies and one case study, and we have the following outcomes:
• In the first study (Chapter 3) we evaluate the effectiveness of extractive summaries of bug reports
by conducting a task-oriented user study. 70% of the time participants report the summary as a
54

useful mean for bug report comprehension. According to them, the bug report summaries contain 54%
important statements (i.e., sentences) of the original bug reports which are helpful for comprehension
whereas 25% of the summary statements are meaningless. They also report that the statements of the
extractive summaries are often inconsistent which greatly hinders the comprehension of bug reports.
• In the second study (Chapter 4), we not only visualize the extractive summaries of bug reports but
also the evolution of technical topics over time discussed in those reports. In summary visualization,
we apply different colour coding and link the summary sentences to their contexts so that one can
easily analyze the contexts of those statements while reading the summaries. In the visualization of
topic evolution for bug reports, we apply LDA, a topic modeling tool, and adapt an existing approach
associated with the topic evolution in email documents. In order to evaluate our topic evolution
technique, we conduct a case study where we apply topic modeling on 3914 bug reports collected
from Eclipse-Ant and visualize the evolution of several important topics such as plugin support, editor
outline, tool launch and configuration, version log, page reference and so on. It is also found that our
time-sensitive (i.e., based on a certain time period) keyword extraction using topic modeling returns
results with a precision of 53%, a recall of 64% and a F-measure of 57% which necessarily outperform
a baseline approach (i.e., TF-based keyword extraction [46]). In the case study, we show how the topic
evolution can help a triager or a developer in finding the relevant bug reports under a certain topic.
• In order to determine how well the visualized extractive summaries of the bug reports can aid developers
in comprehending bug reports, we conduct a task-oriented user study (Chapter 5). According to the
findings from the study, participants rated significantly higher for visualized summaries than plaintext
or non-visualized summaries of bug reports. Participants also spent less time in the identification of
duplicate bugs while using visualized summaries for bug comprehension. Qualitative feedbacks and
suggestions from the participants also show that the visualization technique has a great potential for
helping the readers in bug comprehension with reduced time and effort.
6.2 Future Work
In future, at first we plan to improve both visualizations for topic evolution and extractive summaries of bug
reports. In the case of topic evolution visualization, we plan to add an automatic topic labeling capability
and perform comparative topic evolution for different selected topics over time. Although automatic topic
labeling requires a large training dataset and effective training algorithms, it would reduce the time and
effort in topic naming for the project managers. Comparative analysis of topic evolution can be performed
by visualizing the evolution of top most topics in parallel, and both managers and developers can get an idea
of how a topic evolves over time containing more bugs than others.
In order to improve the visualization of bug report extractive summaries, we plan to apply the suggestions
collected from the participants such as important keyword highlighting, hyperlink between summary sentences
55

and the corresponding sentences and contexts in the original bug report, tool tip option on summary sentences,
wrapping the summary text with no scrolling and so on.
To validate the effectiveness of improved visualization of bug report summaries, we plan to conduct a user
study involving professional developers. As they are the target users of our tool, their evaluation would be
more practical and effective. We also plan to study topic evolution of software bugs collected from Mozilla
[19] and Debian [15]. One way to extend our work on topic evolution is to establish a link between bug topics
with the affected component of a given project visually. We are also interested to predict the possible future
bugs and the parts of a software system that would be affected more in the next version based on the existing
bugs information.
In future, we also plan to add visualization support to other bug management activities such as bug
localization, bug duplication and so on. Bug localization helps us locating the existence of bugs in source
code levels. We plan to integrate the extracted information from bug reports of a given software project with
the information collected from its source codes by exploiting topic-keywords relationships. The idea is to
identify the shared terms between a bug report and a target source code file, and then determine relevance
between them. Currently, we are working on only software bug reports, but in future we have a plan to
visualize not only information extracted from bug reports but also from source code of a software system.
56

References
[1] Eclipse bug 14890. URL https://bugs.eclipse.org/bugs/show_bug.cgi?id=14890.
[2] Gnome bug 156905. URL https://bugzilla.gnome.org/show_bug.cgi?id=156905.
[3] Gnome bug 164995. URL https://bugzilla.gnome.org/show_bug.cgi?id=164995.
[4] Eclipse bug 223734. URL https://bugs.eclipse.org/bugs/show_bug.cgi?id=223734.
[5] Eclipse bug 250125. URL https://bugs.eclipse.org/bugs/show_bug.cgi?id=250125.
[6] Eclipse bug 260502. URL https://bugs.eclipse.org/bugs/show_bug.cgi?id=260502.
[7] Mozilla bug 328600. URL https://bugzilla.mozilla.org/show_bug.cgi?id=328600.
[8] Mozilla bug 449596. URL https://bugzilla.mozilla.org/show_bug.cgi?id=449596.
[9] Mozilla bug 491925. URL https://bugzilla.mozilla.org/show_bug.cgi?id=491925.
[10] Mozilla bug 495584. URL https://bugzilla.mozilla.org/show_bug.cgi?id=495584.
[11] Eclipse bug 62468. URL https://bugs.eclipse.org/bugs/show_bug.cgi?id=62468.
[12] BugLgoHQ, . URL http://www.bugloghq.com/.
[13] Bugzilla, . URL http://www.bugzilla.org.
[14] Bug Reports Corpus. URL http://www.cs.ubc.ca/labs/spl/bugreports.xml.
[15] Debian bugs. URL https://www.debian.org/Bugs/.
[16] Eclipse bugs. URL https://bugs.eclipse.org/bugs/.
[17] Gnome bugs. URL https://bugzilla.gnome.org/.
[18] Mann-Whitney U-Test. URL http://www.socscistatistics.com/tests/mannwhitney/.
[19] Mozilla bugs. URL https://bugzilla.mozilla.org.
[20] Twitter Sentiment Analysis. URL http://help.sentiment140.com/api.
[21] Stop Words List. URL https://code.google.com/p/stop-words/.
[22] Trac. URL http://trac.edgewall.org/.
[23] An User Study on Bug Rport Summarization. URL http://homepage.usask.ca/~shy942/.
[24] Jira. URL https://www.atlassian.com/software/jira.
[25] A. Ankolekar, K. Sycara, J. Herbsleb, R. Kraut, and C. Welty. Supporting Online Problem-solvingCommunities with the Semantic Web. In Proceedings of the 15th International Conference on WorldWide Web, pages 575–584, 2006.
57

[26] P. Beineke, T. Hastie, C. Manning, and S. Vaithyanathan. Exploring Sentiment Summarization. InAAAI Spring Symposium on Exploring Attitude and Affect in Text: Theories and Applications (AAAItech report SS-04-07), 2004.
[27] N. Bettenburg, S. Just, A. Schroter, C. Weiss, R. Premraj, and T. Zimmermann. What Makes a GoodBug Report? In Proceedings of the 16th ACM SIGSOFT International Symposium on Foundations ofSoftware Engineering, pages 308–318, 2008.
[28] D. M. Blei. Probabilistic Topic Models. Communications of the ACM, 55:77–84, 2012.
[29] D. M. Blei, A. Y. Ng, and M. I. Jordan. Latent Dirichlet Allocation. The Journal of Machine LearningResearch, 3:993–1022, 2003.
[30] B. Boehm and V. R. Basili. Top 10 List [Software Development]. Computer, 34:135 –137, 2001.
[31] T. Dal Sassc and M. Lanza. A Closer Look at Bugs. In 2013 First IEEE Working Conference onSoftware Visualization (VISSOFT), pages 1–4, 2013.
[32] M. D’Ambros and M. Lanza. Software Bugs and Evolution: A Visual Approach to Uncover Their Rela-tionship. In Proceedings of the 10th European Conference on Software Maintenance and Reengineering(CSMR), pages 10 pp.–238, 2006.
[33] M. D’Ambros, M. Lanza, and M. Pinzger. ”A Bug’s Life” Visualizing a Bug Database. In 4th IEEEInternational Workshop on Visualizing Software for Understanding and Analysis (VISSOFT), pages113–120, 2007.
[34] W. M. Darling. A Theoretical and Practical Implementation Tutorial on Topic Modeling and GibbsSampling. In Proceedings of the 49th Annual Meeting of the Association for Computational Linguistics:Human Language Technologies, pages 642–647, 2011.
[35] S. Demeyer, A. Murgia, K. Wyckmans, and A. Lamkanfi. Happy birthday! A Trend Analysis on PastMSR Papers. In 2013 10th IEEE Working Conference on Mining Software Repositories (MSR), pages353–362, 2013.
[36] H. P. Edmundson. New Methods in Automatic Extracting. J. ACM, 16, 1969.
[37] A. Go, R. Bhayani, and L. Huang. Twitter Sentiment Classification using Distant Supervision. CS224NProject Report, Stanford, pages 1–12, 2009.
[38] U. Hahn and I. Mani. The Challenges of Automatic Summarization. Computer, 33:29–36, 2000.
[39] S. Haiduc, J. Aponte, and A. Marcus. Supporting Program Comprehension with Source Code Summa-rization. In 2010 ACM/IEEE 32nd International Conference on Software Engineering (ICSE), volume 2,pages 223–226, 2010.
[40] S. Havre, E. Hetzler, P. Whitney, and L. Nowell. Themeriver: Visualizing Thematic Changes in LargeDocument Collections. IEEE Transactions on Visualization and Computer Graphics, 8:9–20, 2002.
[41] A. Hindle, M. W. Godfrey, and R. C. Holt. What’s Hot and what’s not: Windowed Developer TopicAnalysis. In IEEE International Conference on Software Maintenance (ICSM), pages 339–348, 2009.
[42] A. Hindle, N. A. Ernst, M. W. Godfrey, and J. Mylopoulos. Automated Topic Naming to Support Cross-project Analysis of Software Maintenance Activities. In Proceedings of the 8th Working Conference onMining Software Repositories (MSR), pages 163–172, 2011.
[43] A Hora, N. Anquetil, S. Ducasse, M. Bhatti, C. Couto, M. T. Valente, and J. Martins. Bug Maps:A Tool for the Visual Exploration and Analysis of Bugs. In Proceedings of the 2012 16th EuropeanConference on Software Maintenance and Reengineering (CSMR), pages 523–526, 2012.
58

[44] J. Kupiec, J. Pedersen, and F. Chen. A Trainable Document Summarizer. In Proceedings of the 18thAnnual International ACM SIGIR Conference on Research and Development in Information Retrieval,pages 68–73, 1995.
[45] S. Liu, M. X. Zhou, S. Pan, W. Qian, W. Cai, and X. Lian. Interactive, Topic-based Visual TextSummarization and Analysis. In Proceedings of the 18th ACM conference on Information and KnowledgeManagement (CIKM), pages 543–552, 2009.
[46] B. Lott. Survey of Keyword Extraction Techniques. UNM Education, 2012.
[47] R. Lotufo, Z. Malik, and K. Czarnecki. Modelling the Hurried Bug Report Reading Process to SummarizeBug Reports. In Proceedings of the 2012 IEEE International Conference on Software Maintenance(ICSM), pages 430–439, 2012.
[48] H. P. Luhn. The Automatic Creation of Literature Abstracts. IBM J. Res. Dev., 2:159–165, 1958.
[49] S. Mani, R. Catherine, S. V. Sinha, and A. Dubey. Ausum: Approach for Unsupervised Bug ReportSummarization. In Proceedings of the ACM SIGSOFT 20th International Symposium on the Foundationsof Software Engineering (FSE), pages 11:1–11:11, 2012.
[50] L. Martie, V.K. Palepu, H. Sajnani, and C. Lopes. Trendy Bugs: Topic Trends in the Android BugReports. In Proceedings of the 9th IEEE Working Conference on Mining Software Repositories (MSR),pages 120–123, 2012.
[51] G. Murray and G. Carenini. Summarizing Spoken and Written Conversations. In Proceedings of theConference on Empirical Methods in Natural Language Processing (EMNLP), pages 773–782, 2008.
[52] B. A. Nardi, S. Whittaker, E. Isaacs, M. Creech, J. Johnson, and J. Hainsworth. Integrating Commu-nication and Information Through Contactmap. Commun. ACM, 45:89–95, 2002.
[53] A. Nenkova, R. Passonneau, and K. Mckeown. The Pyramid Method: Incorporating Human ContentSelection Variation in Summarization Evaluation. ACM Trans. Speech Lang. Process., 4(2), 2007.
[54] A. T. Nguyen, T. T. Nguyen, J. Al-Kofahi, H. V. Nguyen, and T. N. Nguyen. A Topic-based Approachfor Narrowing the Search Space of Buggy Files from a Bug Report. In Proceedings of the 26th IEEE/ACMInternational Conference on Automated Software Engineering (ASE), pages 263–272, 2011.
[55] A. T. Nguyen, T. T. Nguyen, T. N. Nguyen, D. Lo, and C. Sun. Duplicate Bug Report Detection witha Combination of Information Retrieval and Topic Modeling. In Proceedings of the 27th IEEE/ACMInternational Conference on Automated Software Engineering (ASE), pages 70–79, 2012.
[56] L. Page, S. Brin, R. Motwani, and T. Winograd. The Pagerank Citation Ranking: Bringing Order tothe Web. Technical Report 1999-66, 1999. URL http://ilpubs.stanford.edu:8090/422/.
[57] A. Perer and M. A. Smith. Contrasting Portraits of Email Practices: Visual Approaches to Reflectionand Analysis. In Proceedings of the working conference on Advanced Visual Interfaces (AVI), pages389–395, 2006.
[58] N. Pingclasai, H. Hata, and K.-I. Matsumoto. Classifying Bug Reports to Bugs and Other Requests UsingTopic Modeling. In Proceedings of the 20th Asia-Pacific Software Engineering Conference (APSEC),pages 13–18, 2013.
[59] M. M. Rahman and C. K. Roy. An Insight into the Pull Requests of Github. In Proceedings of the 11thWorking Conference on Mining Software Repositories (MSR), pages 364–367, 2014.
[60] S Rastkar, C. G. Murphy, and G. Murray. Summarizing Software Artifacts: a Case Study of BugReports. In Proceedings of the 32Nd ACM/IEEE International Conference on Software Engineering(ICSE), pages 505–514, 2010.
[61] H. Tang, S. Tan, and X. Cheng. A Survey on Sentiment Detection of Reviews. Expert Systems withApplications, 36(7), 2009.
59
[62] F. B. Viegas, S. Golder, and J. Donath. Visualizing Email Content: Portraying Relationships fromConversational Histories. In Proceedings of the SIGCHI Conference on Human Factors in ComputingSystems (CHI), pages 979–988, 2006.
[63] F. Wei, S. Liu, Y. Song, S. Pan, M. X. Zhou, W. Qian, L. Shi, L. Tan, and Q. Zhang. TIARA: A VisualExploratory Text Analytic System. In Proceedings of the 16th ACM SIGKDD International Conferenceon Knowledge Discovery and Data Mining (KDD), pages 153–162, 2010.
60