analysis and improvement of the dynamic stability in weak...
TRANSCRIPT
Fourth Advance of PhD Thesis, CIEP, UASLPAugust, 2016
Analysis and Improvement of the Dynamic Stabilityin Weak Power Systems With Interconnection ofHydroelectric Power and High Penetration of WindEnergyOmar Beltran Valle1, Rafael Pena Gallardo PhD. 2, Juan Segundo Ramırez PhD.3
AbstractIn this report the activities carried-out for the period of January 2016 - August 2016 are presented. This reportpresents a comparative study of the application of Flexible AC Transmission System (FACTS) devices, asThyristor Controlled Series Capacitor (TCSC), Static Synchronous Compensator (STATCOM) and Unified PowerController (UPFC) on congestion management and voltage support in the area of the Istmo of Tehuantepec,Oaxaca, Mexico. The implementation of the FACTS devices was made in the PowerFactory software.
KeywordsDynamic models, energy congestion, FACTS, PowerFactory, renewable energy, TCSC, STATCOM, UPFC,voltage support.
1PhD Student2Thesis Advisor3Thesis Co-advisor
Contents
Previous advances 1
1 Introduction 1
2 Impact of high penetration of wind farms 2
3 Flexible AC Transmission System devices 23.1 TCSC . . . . . . . . . . . . . . . . . . . . . . . . . . . . . . . 2
TCSC controller
3.2 STATCOM . . . . . . . . . . . . . . . . . . . . . . . . . . . . 3STATCOM controller
3.3 UPFC . . . . . . . . . . . . . . . . . . . . . . . . . . . . . . . 4UPFC controller
4 Generalized one-line diagram of the southeast areaof the Mexican power system 5
5 Case Study 55.1 Congestion in the transmission line . . . . . . . . . . 55.2 Increment of active and reactive power . . . . . . . 7
Schedule of Activities 7
References 8
Previous advancesIn previous advances an equivalent model from the southeastpart of the national electricity system (Istmo of Tehuantepec,Oaxaca) and its interconnection to the national grid of Mexico
has been presented. Also, the hydropower plants and windfarms plants and their controllers were implemented in theequivalent model of the Istmo of Tehuantepec. Finally somestability and power flow studies in the DIgSILENT PowerFactory software were reported.
1. Introduction
THE integration of renewable energies, such as wind power,are growing in power systems around the world with the
objective of reducing CO2 levels and the dependence on fossilfuels, in addition to satisfy the increasing electric demand [1].Main advantages of this source are the absence of harmfulemissions and in principle, infinite availability of the primemover that is converted into electricity [2].
On the other hand, the increasing of this type of generationbrings new opportunities and also challenges in the electricpower system [3]. Problems like dispatch of active and re-active power, voltage stability, subsynchronous resonance,power quality, among others can be produced due to the na-ture of this type of energy generation [3], [4]. As a result, thesafety and stability of the electrical network with high windenergy penetration might be compromised.
In some works, such as [5], [6], [7], is shown the effec-tiveness of Flexible Alternating Current Transmission Sys-tem (FACTS) devices for solving problems related with windpower plants. In the most general expression, the FACTSconcept is based on the substantial incorporation of power

Analysis and Improvement of the Dynamic Stability in Weak Power Systems With Interconnection ofHydroelectric Power and High Penetration of Wind Energy — 2/8
electronic devices and methods in the high-voltage side of thenetwork to make it electronically controllable [8]. FACTStechnology comprises a set of controllers that offer the pos-sibility of controlling one or more parameters that modifythe operation of the transmission system [9] and controllingtransmission capability enhancement, voltage stability im-provement, power conditioning, power quality improvement,among others [4]. In fact, the main purpose of connectingFACTS devices in the power system, which includes windfarms, is to have a controlled dynamic power flow in transmis-sion lines and damping power oscillations [10].
In Mexico, in recent years the wind generation has in-creased, mainly in the Istmo of Tehuantepec, Oaxaca and itis expected to increase in the next years. Although, in thisarea exists congestion problems in transmission lines thatare caused by the large amount of wind power generation incombination with the associated network topology [11].
In this report, FACTS devices are proposed to increasethe available power transfer/capacity of existing transmissionlines and voltage support in the area of Istmo de Tehuantepec.In this first stage of the research it has been implemented theThyristor Controlled Series Capacitor (TCSC), Static Syn-chronous Compensator (STATCOM) and Unified Power FlowController (UPFC), in following advances more FACTS de-vices will be included.
1
2. Impact of high penetration of windfarms
Wind power generation is the most economically attractiverenewable power source for power systems. For example, theEuropean power system has reported over 44 % of the windgeneration penetration [12].
Although, all kinds of renewable energy sources, whichare considered as an alternative of fossil fuels in the future,can produce unforeseen problems as they are connected tothe main power grid [3]. One example of these problems isat Penghu Island in Taiwan, with an abundant wind resourcesand high penetration of wind power that has reached 34 %,although it has impact in the Penghu network. Problems likevoltage and frequency variations in the point of common cou-pling and angle rotor variations of the machines are produceddue to the high penetration of wind power plants [13].
In [14] is analyzed the impact on transient and frequencystability at very high wind penetration, analysis in this workshow that the performance in the transient stability is adverselyaffected when faults are initiated close to areas with high windpenetration, due to the significant reduction in active powergeneration and high reactive power absorption during crow-bar operation at wind generators. The case of the frequencystability analysis has shown that synchronous areas with lessinertia (due to wind integration) can be noticeably affectedby generator outage events in other synchronous area, due tostrong tie line interconnection. System damping capabilityhas significantly reduced at high penetration, with rotor an-
gle oscillations exacerbated when faults occur closer to windfarms. In addition to previous examples, in [15] - [16], is re-ported how the high penetration of the wind energy impacts inthe power system and show that the main factors that modifythe performance of the system are: wind turbine generatortechnology, wind farm location, level of penetration, voltagelevel of the connection point, parameters of the controllersand stress level of the system.
3. Flexible AC Transmission Systemdevices
This Section describes the modeling of TCSC, STATCOMand UPFC. These controllers are represented by simplifiedmodels that capture the corresponding controller response tothe fundamental frequency. In [9] and [17] are described indetail the control techniques used in these devices.
3.1 TCSCOne of the controllers of FACTS family is the Thyristor Con-trolled Series Capacitor, which allows rapid and continuousadjustment of the transmission line impedance. As a resultof this control, the active power flowing along the compen-sated transmission line can be maintained at a specified valueunder a range of operating conditions [4]. Figure 1 showsa general configuration of a TCSC [4], which consists of aseries capacitor bank in parallel with a thyristor controlledreactor.
C
LSW
ik imVC �+ -
iL
iC � " ik �iL � Xkm
Vk VmTCSC
Figure 1. TCSC scheme.
3.1.1 TCSC controllerThe purpose of the TCSC control is to modify the reactanceon the transmission line in order to control the power flow[17]. The TCSC control is depicted in the Figure 2.
Kp +KIs
11+sTr
Pkm
Pref
VPOD
VR
XCmax
XCmax
bTCSC XCbTCSC
XC
Figure 2. Control block diagram of the TCSC.
The output signal of the block diagram of the TCSC is its
Analysis and Improvement of the Dynamic Stability in Weak Power Systems With Interconnection ofHydroelectric Power and High Penetration of Wind Energy — 3/8
variable susceptance (bTCSC), whose expression is:
bTCSC =− XC/Xkm
Xkm(1−XC/Xkm)(1)
where XC is the control signal and Xkm is the line reactancebetween the node k and m.
Considering the scheme of the Figure 1, the total reactanceof the circuit XT is:
XT = Xkm +XTCSC (2)
where XTCSC is:
XTCSC =Xcap Xin
Xin−Xcap(3)
considering that bTCSC = (XTCSC)−1:
bTCSC =Xin−Xcap
Xcap Xin(4)
The control signal XC used is Xin that is the inductive reactanceof the TCSC, this expression is obtained from (1) and (4), afterseveral simplifications, it is possible to determine:
Xin =Xcap Xkm−XC XcapXC Xcap
Xkm−XC +Xkm
(5)
Since the inductive reactance is in parallel with the capacitormight eventually make up together a resonance circuit, it isnecessary to ensure that XTCSC does not surpass determinedminimum and maximum threshold (XCmin,XCmax), these ex-pressions are:
XCmin =Xkm
CF +1
XCmax =Xkm
1−CF
(6)
where CF is a compensation fraction that might be 0.3 (30 %of Xkm) [4].
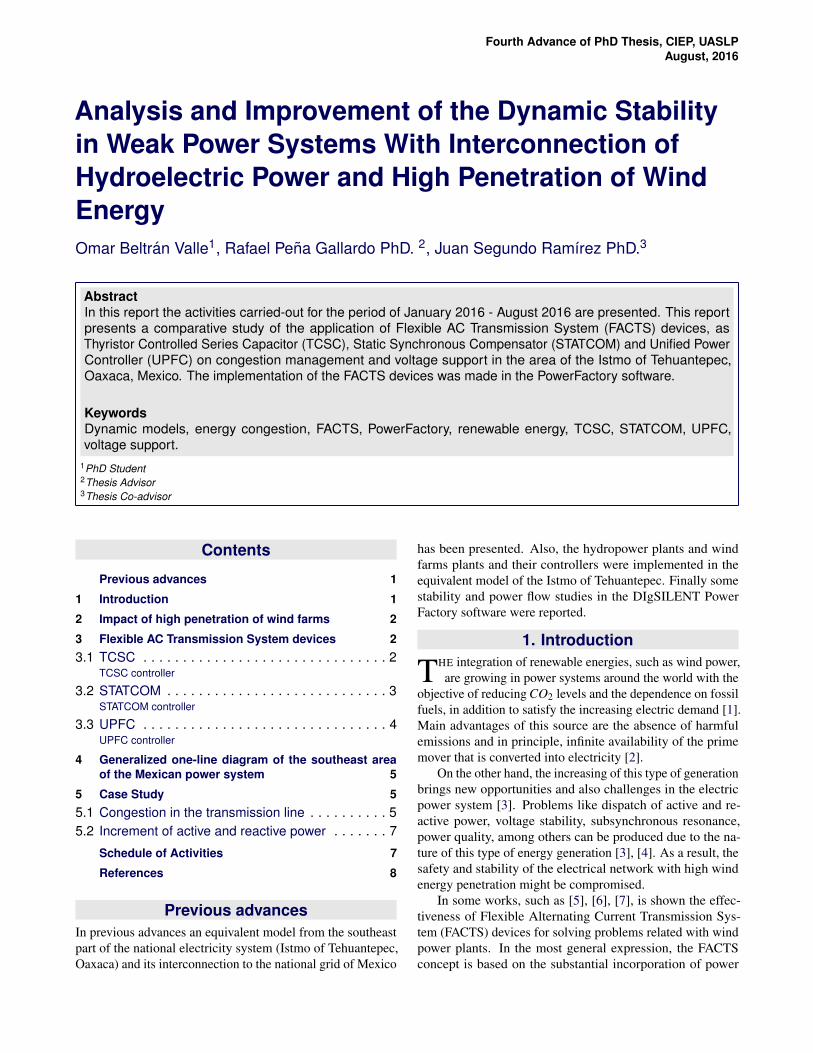
3.2 STATCOMThe main feature of the Static Synchronous Compensatoris to provide voltage support without using large banks ofcapacitors and reactors in order to supply or absorb reactivepower [4]. The STATCOM is modeled as a controlled currentsource that injects or consumes reactive power and generatesa balanced set of sinusoidal voltages at the fundamental fre-quency with rapidly controllable amplitude and phase anglein order to compensate the active and reactive power neededby the system. In the Figure 3 is shown the scheme of theSTATCOM.
The implementation of the STATCOM in PowerFactoryas a controlled current source is through of static generator,the expression that represents this behavior is:
i1 = (id re f Cos(V )− iq re f Sin(V ))+ j(id re f Sin(V )+ iq re f Cos(V )) (7)
Xkm
ik
iSH
GTOConverter
VDC
C
im
Vk Vm
Figure 3. STATCOM scheme.
where:
Cos (V ) =Vr
V
Sin (V ) =Vi
V
(8)
From the apparent power at the STATCOM connectionbus is possible to determine the expression of the magnitudeof the current that the STATCOM injects (iSH = i1), that is:
S = V I∗ = (Vr + jVi)(ir− jii)
= (Vr ir +Vi ii)+ j(Vi ir−Vr ii)(9)
Thus:
P =Vr ir +Vi ii (10)Q =Vi ir−Vr ii (11)
The STATCOM modeled does not allow the active powerexchange with the network, this mean P = 0. Then solving iifrom the Equation (10):
ii =−Vr irVi (12)
So, the expression of the current iSH is:
iSH2 =i2r + i2i = i2r −
(Vr irVi
)2
iSH =V irVi
(13)
Therefore, it is possible to determine the expressions thatrelate ir and ii with iSH = i1 to determine the real and theimaginary part:
ir =iSH Vi
V
ii =−iSH Vr
V
(14)
3.2.1 STATCOM controllerThe purpose of the STATCOM control is maintain the voltagein the bus to which is connected to a voltage of reference [17].The control block system is shown in the Figure 4.
Analysis and Improvement of the Dynamic Stability in Weak Power Systems With Interconnection ofHydroelectric Power and High Penetration of Wind Energy — 4/8
VPOD
V
Vref
Kr1+sTr
imax
imin
iSH
Figure 4. Control block diagram of the STATCOM.
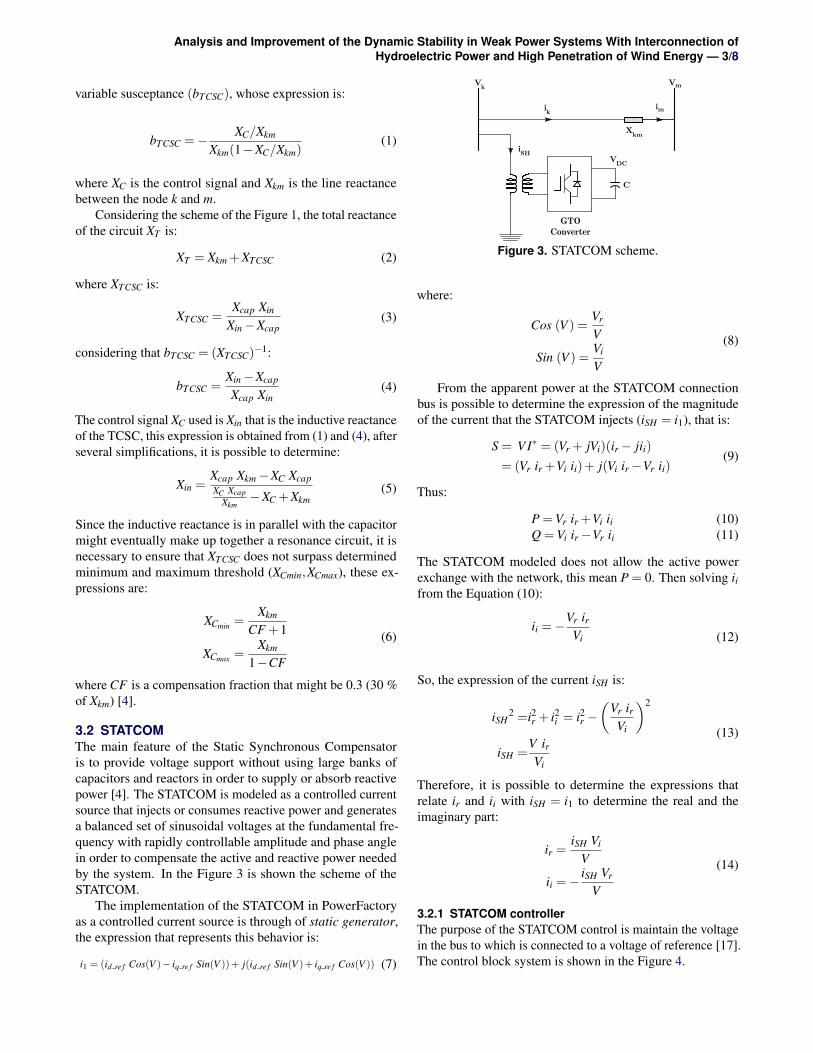
3.3 UPFCThe Unified Power Flow Controller is the combination ofshunt and series converters, which are coupled on the DC sidevia a common link. This link allows bidirectional exchange ofactive and reactive power between these two devices, in orderto control the active and reactive power compensation to thesystem. The basic scheme of a UPFC is shown in Figure 5,which depicts its series and shunt connection to the system.While in the Figure 6 the circuit equivalent of the UPFC isshown; it is represented by one series voltage source Vs andby one shunt current source ish.
VkVm
iq
ikVpVq
Xkm
im
GTOConverter
GTOConverter
VDC
C
Figure 5. UPFC scheme.
Vk k Vm mV'kVs
ish
ikm imkjXkm
Figure 6. Equivalent circuit of the UPFC.
The implementation of the UPFC in PowerFactory is acontrolled voltage source Vs and controlled current sourceish is through of two static generators, the expression thatrepresents the behavior of the controlled voltage source Vs is:
V 1r in+ j V 1i in = (Vr + j Vi)+(−ii X + j ir X) (15)
From the apparent power in the transmission line is po-ssible to determine the expression of the magnitude of thecontrolled voltage source to keep the voltage and active powerin a reference, that is:
Sseries =Vseries(Iseries)∗ = (Vr + j Vi)(ir− jii)
= (Vr ir +Vi ii)+ j(Vi ir−Vr ii)(16)
Thus:Pseries =Vr ir +Vi ii =Vp iseries (17)
Qseries =Vi ir−Vr ii =Vq iseries (18)
The UPFC uses the constant voltage mode, so it is neces-sary to find expressions for Vi and Vr of the controlled voltagesource Vs. The expression for Vi that determine this mode isobtained from (18), that is:
Vq =Vq0 =Qseries0
iseries0(19)
From (18) and (19) and solving for Vi :
Vi =Qseries0 iseries
iriseries0+
Vr iiir
(20)
The current and voltage of the UPFC converter are relatedthrough the next expressions:
Vr ir +Vi iiVi ir−Vr ii
=Vp
Vq(21)
Finally, replacing (20) in (21) and solving for Vr, after severalsimplifications:
Vr =Qseries0 (Vp ir−Vq ii)
iseriesiseries0Vq(22)
The expressions Vr and Vi were implemented in the blockUPFC series interface of the control block of the series con-verter of the UPFC to get the signals V 1r in and V 1i in of thesource Vs.
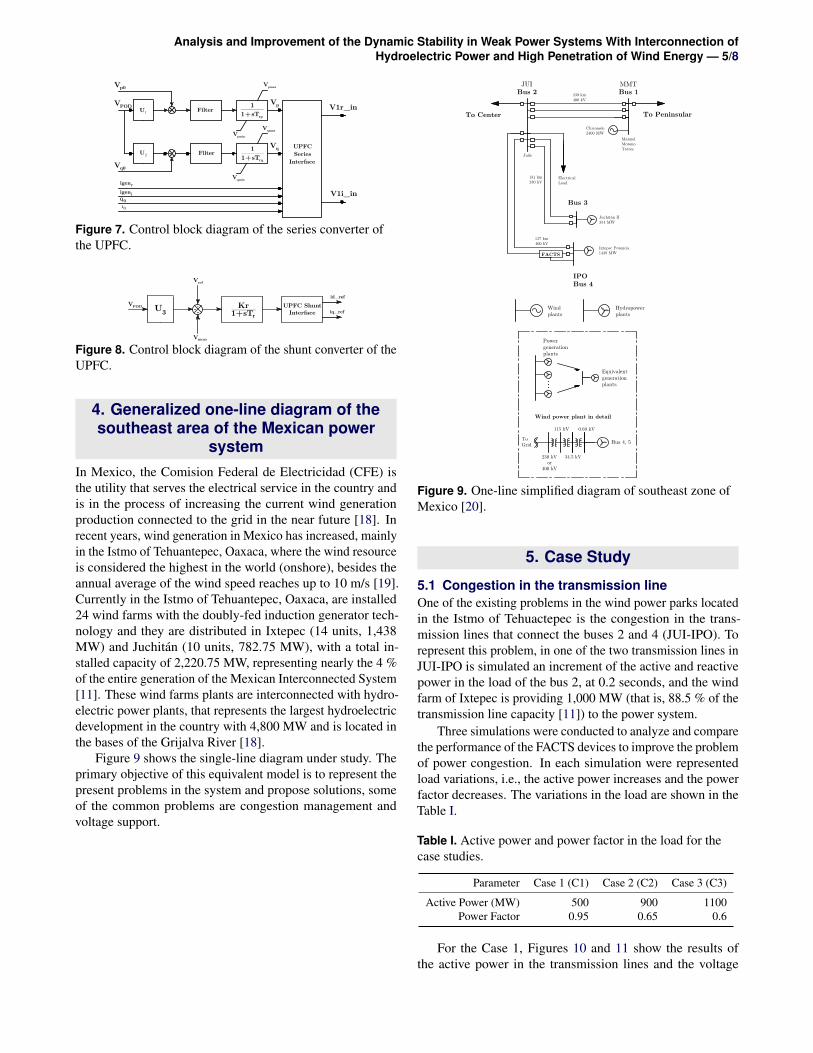
3.3.1 UPFC controllerThree output signals are used in order to control the UPFC:vp, vq and iq. Signal vp represents the component of the seriesvoltage VS that is in phase with the line current, this signalcontrols the exchange of active power between the UPFCand the system, i.e., controls the active power flowing in thetransmission line; the signal vq represents the component ofseries voltage VS that is in quadrature with the line current, thissignal controls the reactive power to keep a specified valueof the voltage in the bus V ′k ; and the signal iq represents thecomponent of shunt current ish which is in quadrature withthe bus voltage (this current keeps the bus voltage Vk arounda specified level) [17].
The control signals and output of the UPFC series com-ponent controller (see Figure 7) are functions of vp and vq,and represent the signals Vsr and Vsi of the controlled voltagesource Vs.
The UPFC shunt component operates like the STATCOMcontroller (see Figure 8). The expression that corresponds tothe shunt controller is:
iq re f =−iqid re f = 0
(23)
Analysis and Improvement of the Dynamic Stability in Weak Power Systems With Interconnection ofHydroelectric Power and High Penetration of Wind Energy — 5/8
VPOD
Vp0
Vq0
igenrigeniQ0i0
Vpmax
Vpmin
Vqmax
Vqmin
UPFCSeries
Interface
V1r_inFilter1
1+sTrp
Filter 11+sTrq
U1
U2
Vp
Vq
V1i_in
Figure 7. Control block diagram of the series converter ofthe UPFC.
VPOD
Vref
Vmeas
U3UPFC Shunt
Interface
id_ref
iq_refKr
1+sTr
Figure 8. Control block diagram of the shunt converter of theUPFC.
4. Generalized one-line diagram of thesoutheast area of the Mexican power
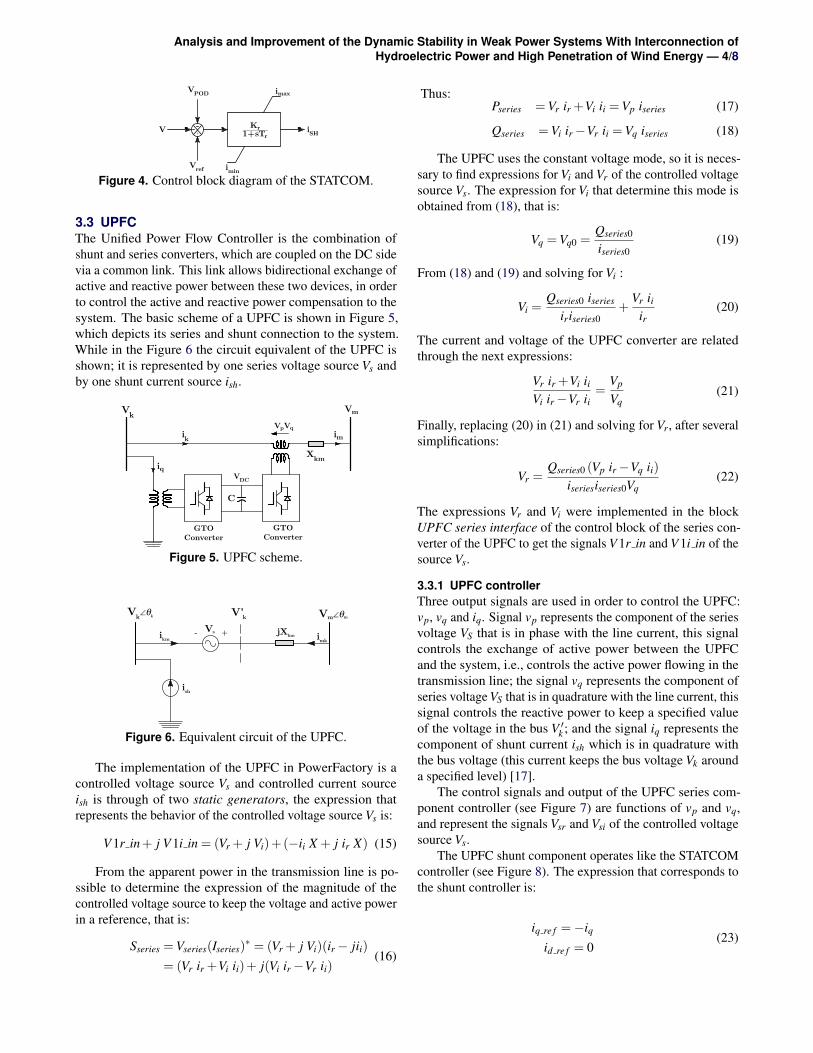
systemIn Mexico, the Comision Federal de Electricidad (CFE) isthe utility that serves the electrical service in the country andis in the process of increasing the current wind generationproduction connected to the grid in the near future [18]. Inrecent years, wind generation in Mexico has increased, mainlyin the Istmo of Tehuantepec, Oaxaca, where the wind resourceis considered the highest in the world (onshore), besides theannual average of the wind speed reaches up to 10 m/s [19].Currently in the Istmo of Tehuantepec, Oaxaca, are installed24 wind farms with the doubly-fed induction generator tech-nology and they are distributed in Ixtepec (14 units, 1,438MW) and Juchitan (10 units, 782.75 MW), with a total in-stalled capacity of 2,220.75 MW, representing nearly the 4 %of the entire generation of the Mexican Interconnected System[11]. These wind farms plants are interconnected with hydro-electric power plants, that represents the largest hydroelectricdevelopment in the country with 4,800 MW and is located inthe bases of the Grijalva River [18].
Figure 9 shows the single-line diagram under study. Theprimary objective of this equivalent model is to represent thepresent problems in the system and propose solutions, someof the common problems are congestion management andvoltage support.
Figure 9. One-line simplified diagram of southeast zone ofMexico [20].
5. Case Study
5.1 Congestion in the transmission lineOne of the existing problems in the wind power parks locatedin the Istmo of Tehuactepec is the congestion in the trans-mission lines that connect the buses 2 and 4 (JUI-IPO). Torepresent this problem, in one of the two transmission lines inJUI-IPO is simulated an increment of the active and reactivepower in the load of the bus 2, at 0.2 seconds, and the windfarm of Ixtepec is providing 1,000 MW (that is, 88.5 % of thetransmission line capacity [11]) to the power system.
Three simulations were conducted to analyze and comparethe performance of the FACTS devices to improve the problemof power congestion. In each simulation were representedload variations, i.e., the active power increases and the powerfactor decreases. The variations in the load are shown in theTable I.
Table I. Active power and power factor in the load for thecase studies.
Analysis and Improvement of the Dynamic Stability in Weak Power Systems With Interconnection ofHydroelectric Power and High Penetration of Wind Energy — 5/7
Table I. active power and power factor in the load for the casestudies.
Parameter Case 1 (C1) Case 2 (C2) Case 3 (C3)
Active Power (MW) 500 900 1100Power Factor 0.95 0.65 0.6
For the Case 1, Figures 10 and 11 show the results ofthe active power in the transmission lines and the voltagein the bus at which the FACTS controllers are connected,respectively.
In the case of the active power in the transmission line(see Figure 10), it is noticed that when there are not installedFACTS devices, the active power decreases from 1000 MWto 984.7 MW. With the STATCOM there is an increment inthe active and reactive power in the connection point of thiselement (because of the principle of parallel compensation[4]), i.e., in the bus 4, the active power has a value of 1034.2MW. In case of the TCSC, it can be seen that this deviceallows controlling the active power in order to keep the samepre-disturbance active power, in this case is of 1000 MW. Withthe UPFC, the active power reaches reference value of powerin less oscillations as compared to the TCSC.
0 5 10 15 20 25 30 35 40 45920
940
960
980
1000
1020
10401050
Time (sec)
ActivePow
erin
MW
Without FACTSSTATCOMTCSCUPFC
Figure 10. Active power profile with and without FACTSdevices.
Figure 11 shows the voltage profile in the bus 4, it canbe noted that when no exist FACTS controllers the voltageprofile is 0.907 p.u., while the TCSC controller increases thisprofile to a value of 0.942 p.u. In the case of the STATCOMand the UPFC, these devices let compensate the voltage inits references values, that is 1 p.u., but the responses of theSTATCOM and the UPFC in the first oscillation are 0.94 p.u.and 0.99 p.u., respectively, i.e., the UPFC lets a less decrementin the voltage profile, because this device has the objective ofcompensating the active power in the transmission line andreactive power in the bus which is connected.
In the next Figures, three case studies are simulated inorder to analyze and compare the performance of the FACTSdevices. Figure 12 shows the active power with and withoutFACTS in the transmission line between the buses 2 and 4(JUI-IPO). From this Figure, it can be seen that the TCSCand the UPFC compensate the active power and reach thereference value, therefore, it is worth mentioning that, in thethree case studies even if the demand of active and reactivepower in the load increase, these devices maintain the value
0 10 20 30 40 450.9
0.92
0.94
0.96
0.98
1
1.02
Time (sec)
Voltage
inp.u.
Without FACTSSTATCOMTCSCUPFC
Figure 11. Voltage in p.u. profile with and without FACTSdevices.
of the active power to the reference without compromising thepower capacity in the transmission line. On the other hand,the STATCOM in the three case studies, increases the flow ofactive power in the line, for example in the Case 3, with theSTATCOM the active power in the line represents the 87 % ofits capacity, while without FACTS the active power representsthe 82.3 % of its capacity.
C1 C2 C3 C1 C2 C3 C1 C2 C3900
920
940
960
980
1000
1020
1040
1060
1080
ActivePow
erin
MW
With FACTSWithout FACTS
Power reference: 1000 MW
STATCOM TCSC UPFC
Figure 12. Active power in the transmission line.
Figure 13 shows the results of the voltage profile in thebus 4 with and without FACTS controllers. The simulationresults show that the shunt controllers (STATCOM and UPFC)compensate the voltage profile near the voltage of reference(1 p.u.). Also, the STATCOM in the Case 3 keeps the voltagein the bus 4 to 0.995 p.u., while the UPFC keeps the voltageto 0.999 p.u., this due to its operative limits of the device.
C1 C2 C3 C1 C2 C3 C1 C2 C30.88
0.9
0.92
0.94
0.96
0.98
1
1.02
1.04
Voltagein
p.u.
With FACTSWithout FACTS
TCSC UPFCSTATCOM
Figure 13. Voltage in Bus 4.
Figure 14 shows the reactive power profile in the trans-mission line with and without FACTS devices. Due to theshunt compensation in the STATCOM and the UPFC, thatis, these devices inject reactive power in order to maintain
For the Case 1, Figures 10 and 11 show the results ofthe active power in the transmission lines and the voltage

Analysis and Improvement of the Dynamic Stability in Weak Power Systems With Interconnection ofHydroelectric Power and High Penetration of Wind Energy — 6/8
in the bus at which the FACTS controllers are connected,respectively.
In the case of the active power in the transmission line(see Figure 10), it is noticed that when there are not installedFACTS devices, the active power decreases from 1000 MWto 984.7 MW. With the STATCOM there is an increment inthe active and reactive power in the connection point of thiselement (because of the principle of parallel compensation[4]), i.e., in the bus 4, the active power has a value of 1034.2MW. In case of the TCSC, it can be seen that this deviceallows controlling the active power in order to keep the samepre-disturbance active power, in this case is of 1000 MW. Withthe UPFC, the active power reaches reference value of powerin less oscillations as compared with the TCSC.
0 5 10 15 20 25 30 35 40 45920
940
960
980
1000
1020
10401050
Time (sec)
ActivePow
erin
MW
Without FACTS
STATCOM
TCSC
UPFC
Figure 10. Active power profile with and without FACTSdevices.
Figure 11 shows the voltage profile in the bus 4, it can benoted that with no FACTS controllers, the voltage profile is0.907 p.u., while the TCSC controller increases this profileto a value of 0.942 p.u. In the case of the STATCOM andthe UPFC, these devices let compensate the voltage in theirreferences values, that is 1 p.u., but the responses of the STAT-COM and the UPFC in the first oscillation are 0.94 p.u. and0.99 p.u., respectively, i.e., the UPFC lets a smaller voltagedip, because this device has the objective of compensating theactive power in the transmission line and reactive power inthe bus which is connected.
0 10 20 30 40 450.9
0.92
0.94
0.96
0.98
1
1.02
Time (sec)
Voltage
inp.u.
Without FACTSSTATCOMTCSCUPFC
Figure 11. Voltage in p.u. with and without FACTS devices.
In the next Figures, three case studies are simulated inorder to analyze and compare the performance of the FACTSdevices. Figure 12 shows the active power with and withoutFACTS in the transmission line between the buses 2 and 4(JUI-IPO). From this Figure, it can be seen that the TCSCand the UPFC compensate the active power and reach the
reference value, therefore, it is worth mentioning that, in thethree case studies even if the demand of active and reactivepower in the load increases, these devices maintain the valueof the active power to the reference without compromising thepower capacity in the transmission line. On the other hand,the STATCOM in the three case studies, increases the flow ofactive power in the line, for example in the Case 3, with theSTATCOM the active power in the line represents the 87 % ofits capacity, while without FACTS the active power representsthe 82.3 % of its capacity.
C1 C2 C3 C1 C2 C3 C1 C2 C3900
920
940
960
980
1000
1020
1040
1060
1080
ActivePow
erin
MW
With FACTSWithout FACTS
Power reference: 1000 MW
STATCOM TCSC UPFC
Figure 12. Active power in the transmission line.
Figure 13 shows the results of the voltage profile in thebus 4 with and without FACTS controllers. The simulationresults show that the shunt controllers (STATCOM and UPFC)compensate the voltage profile near the voltage of reference(1 p.u.). Also, the STATCOM in the Case 3 keeps the voltagein the bus 4 to 0.995 p.u., while the UPFC keeps the voltageto 0.999 p.u., this due to its operative limits of the device.
C1 C2 C3 C1 C2 C3 C1 C2 C30.88
0.9
0.92
0.94
0.96
0.98
1
1.02
1.04
Voltagein
p.u.
With FACTSWithout FACTS
TCSC UPFCSTATCOM
Figure 13. Voltage in the Bus 4.
Figure 14 shows the reactive power profile in the trans-mission line with and without FACTS devices. Due to theshunt compensation in the STATCOM and the UPFC, thatis, these devices inject reactive power in order to maintainthe reference value, the reactive power that flows through thetransmission line is reduced significantly. The STATCOMreduces the reactive power in the transmission line more thanthe UPFC, because it only has the objective to control thevoltage in the bus, while the UPFC controls the voltage inthe buses which is connected and controls the active power inthe transmission line, that is, the UPFC has a better balancebetween the compensation of the active and reactive powerthan the STATCOM and the TCSC. On the other hand, theTCSC compensates in lower magnitude the reactive powerthan the active power.

Analysis and Improvement of the Dynamic Stability in Weak Power Systems With Interconnection ofHydroelectric Power and High Penetration of Wind Energy — 7/8
C1 C2 C3 C1 C2 C3 C1 C2 C350
100
150
200
250
300
350
400
ReactivePow
erin
Mva
r
With FACTSWithout FACTS
UPFCTCSCSTATCOM
Figure 14. Reactive power in the transmission line.
In conclusion, in the case of the compensation of theactive power in the transmission line, the obtained results ofthe TCSC and the UPFC show that these devices maintainthe reference value, while the STATCOM increases the activepower and produces congestion problems in the transmissionline. In the case of the voltage regulation, the STATCOM andthe UPFC keep the voltage near to the reference value in thebuses which are connected. Finally, in the case of the reactivepower in the transmission line, the STATCOM and the UPFCreduces this power significantly, on the other hand the TCSCcompensates the reactive power in proportion to the capacityof the capacitor of this device.
5.2 Increment of active and reactive powerIn this Section two case studies were conducted to comparethe impact of the FACTS devices in the voltage of the busesnear them. To represent this effect, it was simulated an incre-ment of the active and reactive power in the load of the bus 2up to 4000 MW and 4000 Mvar. The results are analyzed andcompared for the bus 2. In the Case 1, the active power in-creases and for the Case 2, the reactive power increases, whilethat the power factor is of 0.85 in both cases. For the Case1, the Figure 15 shows the voltage profile in the bus 2 whenthe active power in the load is increased. In this Case with anincrement of 4000 MW of the active power consumption inthe load, the voltage profile when there are no installed theFACTS devices is 0.977 p.u., while the voltage profile in theTCSC is 0.981 p.u. and the voltage profile of the STATCOMand the UPFC is 0.985 p.u. and 0.99 p.u., respectively.
1000 1500 2000 2500 3000 3500 40000.95
0.96
0.97
0.98
0.99
1
1.01
1.02
Active power in MW
Voltage
inp.u.
Without FACTS
STATCOM
TCSC
UPFC
Figure 15. Voltage profile in the bus 2 with changes in activepower in the load.
Figure 16 shows the voltage profile in the bus 2 whenthere is an increment of reactive power in the load, with andwithout FACTS devices. For this case, with an increment of4000 Mvar of the reactive power consumption in the load, thevoltage in the bus 2 without FACTS devices is 0.969 p.u., inthe case of the STATCOM and the UPFC the voltage profileis 0.993 p.u. and 0.995 p.u., respectively, while the TCSC is0.991 p.u.
1000 1500 2000 2500 3000 3500 40000.95
0.96
0.97
0.98
0.99
1
1.01
1.02
Reactive power in MVar
Voltage
inp.u.
Without FACTS
STATCOM
TCSC
UPFC
Figure 16. Voltage profile in the bus 2 with changes inreactive power in the load.
In conclusion to the Case 1, the STATCOM and the UPFChave a better performance in the voltage profile that the TCSCwhen the active power is increased, this is mainly due to theTCSC compensates only active power, while the STATCOMand the UPFC injects reactive power that improves the voltagein the buses. For the Case 2, the results of the simulationsshow that all devices have a great performance in the voltageprofile when the reactive power is increased, for the case ofthe TCSC, this device does not reduce the flow of reactivepower in the transmission line, so that when the reactive poweris increased, the voltage in the bus 2 is no affected.
Schedule of activitiesFigure 17 illustrates the activities and the time required todevelop the doctoral thesis. Currently it has a 45% of total ad-vance. In this period, FACTS devices like TCSC, STATCOMand UPFC and theirs controllers have been implemented onstudies as congestion management and voltage support in theIstmo of Tehuantepec; as result of this activity, one paper isunder review in the IEEE ROPEC 2016 conference.
1 2 3 4 5 6 7 81. Literature review2. Analysis of the electric system3. Development and implementation4. Development studies5. Propose strategies6. Writing articles7. Writing thesis
Objetive Semester
Progress Programmed
Figure 17. Schedule of activities.
Analysis and Improvement of the Dynamic Stability in Weak Power Systems With Interconnection ofHydroelectric Power and High Penetration of Wind Energy — 8/8
References[1] E. Vittal, M. O’Malley, and Andrew Keane. A steady-
state voltage stability analysis of power systems with highpenetrations of wind. IEEE Transactions Power Systems,volume 25:433–442, February 2010.
[2] J. G. Slootweg and W. L. Kling. Aggregated modellingof wind parks in power system dynamics simulations.Bologna, Italy, June 2003. Power Tech Conference Pro-ceedings, IEEE.
[3] A. Saberian, P. Farzan, M. Fadaee, H. Hizam, C. Gomes,M. Lutfi, M. Amran, and M. Zainal. Role of facts devicesin improving penetration of renewable energy. pages432 – 437, Langkawi, June 2013. Power Engineering andOptimization, IEEE.
[4] N. G. Hingonari and Laszlo Gyugy. UnderstandingFACTS: Concepts and Technology of Flexible AC Trans-mission Systems. Wiley-IEEE Press, December 1999.
[5] R. K. Varma, S. Auddy, and Y. Semsedini. Mitigation ofsubsynchronous resonance in a series-compensated windfarm using facts controllers. pages 1645 – 1654, July2008.
[6] V. Salehi, S. Afsharnia, and S. Kahrobaee. Improvementof voltage stability in wind farm connection to distribu-tion network using facts devices. pages 4242 – 4247,Paris, November 2006. Industrial Electronics, IEEE.
[7] B. A. Renza, A. Keri, A. S. Mehraban, C. Schauder,E. Stacey, L. Kovalsky, L. Gyugyi, and A. Edris. Aepunified power flow controller performace. IEEE Trans-actions on Power Delivery, 14(4):1374–1381, Octuber1999.
[8] IEEE. Guide for planning dc links terminating at aclocations having low short-circuit capacities. Technicalreport, IEEE, 1997.
[9] M. Gonzales and L. Rueda. PowerFactory Applicationsfor Power System Analysis. Springer, 2014.
[10] V. Yuvaraj, P. Raj, and L. Thirugnanamoorthy. Powerquality improvement for grid connected wind energy sys-tem usin facts device. Int’l Symposium on TheoreticalElectrical Engineering (ISTET), 2011.
[11] E. Luna, C. Perez, E. Fernandez, and G. Tequitlalpa.Active power control of wind farms in mexico to mitigatecongestion energy problems and contribute to frequencyregulation. pages 451–456. ROPEC, IEEE, November2014.
[12] The European Wind energy Association. Wind in power2015 european statistics. Technical report, February2016.
[13] Yuan-Kang Wu. High wind power penetration – a casestudy in penghu island. pages 1–6, Hong Kong, Decem-ber 2014. PES Asia-Pacific Power and Energy Engineer-ing Conference (APPEEC), IEEE.
[14] L. Meegahapola and D. Flynn. Impact on transient andfrequency stability for a power system at very high windpenetration. Minneapolis, MN., July 2010. PES GeneralMeeting, IEEE.
[15] L. Shi, S. Dai, Y. Ni, L. Yao, and M. Bazargan. Transientstability of power systems with high penetration of dfigbased wind farms. In IEEE Power Energy Society GeneralMeeting, pages 1–6. IEEE, July 2009.
[16] D. J. Figueroa, R. R. Avila, and M. B. C. Salles. Analysisof transmission systems with high penetration of windpower using dfig based wind farms during voltage sags.In Clean Electrical Power (ICCEP), 2013 InternationalConference on, pages 361–367. IEEE, June 2013.
[17] F. Milano. Power System Analysis Toolbox. PSAT, 2.0.0edition, February 2008.
[18] Secretaria de Energia. Programa de desarrollo del sistemaelectrico nacional. Technical report, 2015-2029.
[19] Cableados Industriales. Parque eolico bii nee stipa ii.Technical report, 2010.
[20] CENACE-CFE. Reglas generales de interconexion alsistema electrico nacional. Centro Nacional de Con-trol de Energıa, Asociacion Mexicana de Energıa Eolica(AMDEE), 2012.