analysis and development using tools for augmented reality...
TRANSCRIPT

Erik Söderqvist & Johan Paulsson
Analysis and Development using Tools for Augmented Realityon Smartphones
Master's Thesis
Department of Design SciencesLund UniversityISRN:LUTMDN/TMAT-5172-SE
EAT 2013

Analysis and Development using Tools for
Augmented Reality on Smartphonesv1.0
Erik Soderqvist, [email protected] Paulsson, [email protected]
Supervisors:Joakim Eriksson, LTH , [email protected]
Jonas Svensson, Knowit Mobile Syd AB, [email protected]
June 11, 2013

Abstract
The goal of this master thesis was to examine some of the available development
tools for augmented reality in mobile applications. The best development tool
were then used in development of an application for Android or iOS.
The thesis has two main parts, the analysis of development tools and the
application development. During the analysis five different commercial develop-
ment tools for augmented reality were examined. Four criterions were defined
that were used to compare the different development tools. Based on the anal-
ysis the development tool that fulfilled most criterions were chosen to be used
in the development of an application.
The development had two main parts, design and implementation. Several
body and brainstorming sessions were used during the design phase to find a
good idea for an application that could show the functionality of the chosen
development tool. This resulted in an application idea that with the help of
augmented reality informs a commuter how long he will have to wait until his bus
arrives. A Lo-Fi prototype was developed during the design phase that was used
as a base for the development of the application. Valuable information about
user interaction was received from testing the Lo-Fi prototype on potential users.
This resulted in a Hi-Fi prototype that underwent several usability evaluation
to get an intuitive design.

Sammanfattning
Syftet med examensarbetet var att undersoka olika utvecklingsverktyg for Aug-
mented Reality i mobila applikationer. Malet var att efter analysen var avslutad
skulle ett av verktygen anvandas for att utveckla en applikation till Android eller
iOS.
Arbetet kan delas upp i tva delar, analys och applikationsutvecklings. Analys-
delen gick ut pa att undersoka fem kommersiella utvecklingsverktyg for aug-
mented reality. Analysen baserades pa fyra kriterier definierade innan un-
dersokningen borjade. Baserat pa resultatet av analysen valdes det basta utveck-
lingsverktyget ut for att utveckla en applikation.
I utvecklingsprocessen ingick tva delmoment, design och implementation.
Under designfasen anvandes flertalet body- och brainstormingsessioner for att
fa en bra ide till en applikation som skulle visa upp funktionerna av det valda
utvecklingsverktyget. Applikationen som utvecklades visar upp nar bussen anlander
med hjalp av Augmented Reality. Under designfasen utvecklades en Lo-Fi pro-
totyp som sedan anvandes som bas for resten av utvecklingsarbetet. Proto-
typen gav ocksa information om hur anvandarna interagerade med applikatio-
nen. Detta resulterade i en Hi-Fi prototyp som genomgick flera anvandartester
for att fa en intuitiv design.

Acknowledgments
We would like to thank our supervisors at Knowit Mobile Syd AB, Jonas Svens-
son and Axel Holtas who gave us the opportunity to conduct this master thesis.
A thank to our supervisor at LTH, Joakim Eriksson that has helped us through-
out the project. We would also like to thank Jens Ryden at Knowit Tech Doc
AB that helped us with the graphics for the application.
Johan Paulsson & Erik Soderqvist, Malmo june 2013

Contents
1 Introduction 1
1.1 Knowit Mobile Syd AB . . . . . . . . . . . . . . . . . . . . . . . 1
1.2 Augmented reality . . . . . . . . . . . . . . . . . . . . . . . . . . 1
1.2.1 Tracking . . . . . . . . . . . . . . . . . . . . . . . . . . . . 1
1.3 Goal . . . . . . . . . . . . . . . . . . . . . . . . . . . . . . . . . . 1
1.4 Criteria for SDK testing . . . . . . . . . . . . . . . . . . . . . . . 2
1.5 Application . . . . . . . . . . . . . . . . . . . . . . . . . . . . . . 2
2 Theoretical background 3
2.1 Introduction . . . . . . . . . . . . . . . . . . . . . . . . . . . . . . 3
2.2 Vuforia . . . . . . . . . . . . . . . . . . . . . . . . . . . . . . . . . 3
2.2.1 Platform support and development language . . . . . . . 3
2.2.2 Documentation . . . . . . . . . . . . . . . . . . . . . . . . 3
2.2.3 Tracking solutions . . . . . . . . . . . . . . . . . . . . . . 3
2.2.4 License . . . . . . . . . . . . . . . . . . . . . . . . . . . . 4
2.2.5 Other . . . . . . . . . . . . . . . . . . . . . . . . . . . . . 5
2.3 Metaio . . . . . . . . . . . . . . . . . . . . . . . . . . . . . . . . . 5
2.3.1 Platform support and development language . . . . . . . 5
2.3.2 Documentation . . . . . . . . . . . . . . . . . . . . . . . . 5
2.3.3 Tracking solutions . . . . . . . . . . . . . . . . . . . . . . 6
2.3.4 License . . . . . . . . . . . . . . . . . . . . . . . . . . . . 6
2.3.5 Other . . . . . . . . . . . . . . . . . . . . . . . . . . . . . 7
2.4 D’Fusion . . . . . . . . . . . . . . . . . . . . . . . . . . . . . . . . 7
2.4.1 Platform support and development language . . . . . . . 7
2.4.2 Documentation . . . . . . . . . . . . . . . . . . . . . . . . 7
2.4.3 Tracking solutions . . . . . . . . . . . . . . . . . . . . . . 8
2.4.4 License . . . . . . . . . . . . . . . . . . . . . . . . . . . . 8
2.5 Layar . . . . . . . . . . . . . . . . . . . . . . . . . . . . . . . . . 8
2.5.1 Platform support and development language . . . . . . . 8
2.5.2 Documentation . . . . . . . . . . . . . . . . . . . . . . . . 9
2.5.3 Tracking solutions . . . . . . . . . . . . . . . . . . . . . . 9
2.5.4 License . . . . . . . . . . . . . . . . . . . . . . . . . . . . 9
2.6 Mixare . . . . . . . . . . . . . . . . . . . . . . . . . . . . . . . . . 10
2.6.1 Platform support and development language . . . . . . . 10
2.6.2 Documentation . . . . . . . . . . . . . . . . . . . . . . . . 10
2.6.3 Tracking solutions . . . . . . . . . . . . . . . . . . . . . . 10
2.6.4 License . . . . . . . . . . . . . . . . . . . . . . . . . . . . 10
2.7 Comparison . . . . . . . . . . . . . . . . . . . . . . . . . . . . . . 11
5

2.7.1 Tracking of QR code . . . . . . . . . . . . . . . . . . . . . 11
2.7.2 Tracking of images . . . . . . . . . . . . . . . . . . . . . . 11
2.7.3 Tracking of 3D object . . . . . . . . . . . . . . . . . . . . 11
2.7.4 Tracking of GPS coordinate . . . . . . . . . . . . . . . . . 12
2.7.5 Overlay on tracked object . . . . . . . . . . . . . . . . . . 12
2.7.6 Metaio versus Vuforia . . . . . . . . . . . . . . . . . . . . 13
2.8 Conclusion . . . . . . . . . . . . . . . . . . . . . . . . . . . . . . 14
3 Design of public transportation application 15
3.1 Introduction . . . . . . . . . . . . . . . . . . . . . . . . . . . . . . 15
3.2 User study . . . . . . . . . . . . . . . . . . . . . . . . . . . . . . . 15
3.2.1 Introduction . . . . . . . . . . . . . . . . . . . . . . . . . 15
3.2.2 Market analysis . . . . . . . . . . . . . . . . . . . . . . . . 15
3.2.3 Brainstorming . . . . . . . . . . . . . . . . . . . . . . . . 16
3.2.4 Bodystorming . . . . . . . . . . . . . . . . . . . . . . . . . 17
3.2.5 Scenarios . . . . . . . . . . . . . . . . . . . . . . . . . . . 18
3.2.6 Questionnaire . . . . . . . . . . . . . . . . . . . . . . . . . 19
3.2.7 Functionality . . . . . . . . . . . . . . . . . . . . . . . . . 22
3.3 Lo-Fi prototyping . . . . . . . . . . . . . . . . . . . . . . . . . . . 24
3.4 Usability evaluation - First iteration . . . . . . . . . . . . . . . . 26
4 Implementation of public transport application 30
4.1 Workflow . . . . . . . . . . . . . . . . . . . . . . . . . . . . . . . 30
4.2 Data retrieving and parsing . . . . . . . . . . . . . . . . . . . . . 30
4.2.1 Working with Skanetrafiken’s API . . . . . . . . . . . . . 30
4.2.2 Converting coordinates from WGS84 to RT90 and back . 31
4.2.3 Bus lines and bus direction . . . . . . . . . . . . . . . . . 32
4.3 Augmented reality . . . . . . . . . . . . . . . . . . . . . . . . . . 32
4.3.1 Tracking and displaying the location of the bus with aug-
mented reality . . . . . . . . . . . . . . . . . . . . . . . . 32
4.3.2 The augmented reality map view . . . . . . . . . . . . . . 33
4.4 Final design . . . . . . . . . . . . . . . . . . . . . . . . . . . . . . 35
4.4.1 Start screen . . . . . . . . . . . . . . . . . . . . . . . . . . 35
4.4.2 Function 1 . . . . . . . . . . . . . . . . . . . . . . . . . . 35
4.4.3 Function 2 . . . . . . . . . . . . . . . . . . . . . . . . . . 36
4.4.4 The how to view . . . . . . . . . . . . . . . . . . . . . . . 36
4.4.5 The settings view . . . . . . . . . . . . . . . . . . . . . . . 37
4.5 Overview of user interaction . . . . . . . . . . . . . . . . . . . . . 39
6

5 Discussion 40
5.1 Augmented reality in mobile devices . . . . . . . . . . . . . . . . 40
5.2 The analysis . . . . . . . . . . . . . . . . . . . . . . . . . . . . . . 40
5.3 The application . . . . . . . . . . . . . . . . . . . . . . . . . . . . 40
5.3.1 Augmented reality in the application . . . . . . . . . . . . 40
5.3.2 Choosing direction versus destination . . . . . . . . . . . 41
5.3.3 Automatically searches for nearest bus stop . . . . . . . . 41
5.3.4 Further development . . . . . . . . . . . . . . . . . . . . . 41
6 Conclusion 42
7 Bibliography 43
Appendix A 45
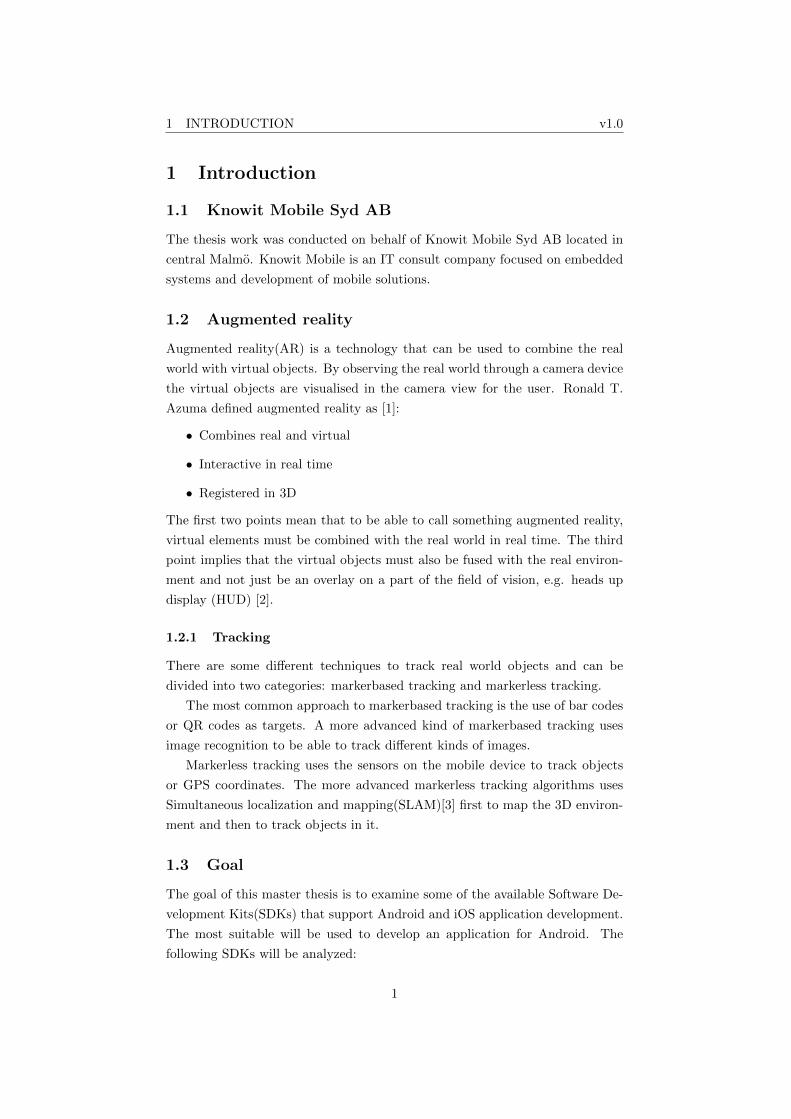
1 INTRODUCTION v1.0
1 Introduction
1.1 Knowit Mobile Syd AB
The thesis work was conducted on behalf of Knowit Mobile Syd AB located in
central Malmo. Knowit Mobile is an IT consult company focused on embedded
systems and development of mobile solutions.
1.2 Augmented reality
Augmented reality(AR) is a technology that can be used to combine the real
world with virtual objects. By observing the real world through a camera device
the virtual objects are visualised in the camera view for the user. Ronald T.
Azuma defined augmented reality as [1]:
• Combines real and virtual
• Interactive in real time
• Registered in 3D
The first two points mean that to be able to call something augmented reality,
virtual elements must be combined with the real world in real time. The third
point implies that the virtual objects must also be fused with the real environ-
ment and not just be an overlay on a part of the field of vision, e.g. heads up
display (HUD) [2].
1.2.1 Tracking
There are some different techniques to track real world objects and can be
divided into two categories: markerbased tracking and markerless tracking.
The most common approach to markerbased tracking is the use of bar codes
or QR codes as targets. A more advanced kind of markerbased tracking uses
image recognition to be able to track different kinds of images.
Markerless tracking uses the sensors on the mobile device to track objects
or GPS coordinates. The more advanced markerless tracking algorithms uses
Simultaneous localization and mapping(SLAM)[3] first to map the 3D environ-
ment and then to track objects in it.
1.3 Goal
The goal of this master thesis is to examine some of the available Software De-
velopment Kits(SDKs) that support Android and iOS application development.
The most suitable will be used to develop an application for Android. The
following SDKs will be analyzed:
1

1 INTRODUCTION v1.0
• Vuforia, developed by Qualcomm
• Metaio, developed by Metaio GmbH
• D’Fusion, developed by Total Immersion
• Layar, developed by Layar
• Mixare, open source project
The SDKs to be analysed were chosen by Knowit Mobile Syd AB. During the
analysis it became obvious that these are the market leading SDKs and therefore
no other SDKs were examined. The SDKs will be examined according to the
criteria defined in section 1.4. An application will then be developed to confirm
that the SDK deliver the functionality stated by the developers.The vision for
the application can be seen in 1.5.
1.4 Criteria for SDK testing
The analysis of the SDKs will be based on the following criteria:
• It must be able to extract the tracking data from the SDK to write our
own functions.
• It is an advantage if the SDK support different tracking methods.
• The SDK must support Android and iOS, it is an advantage if it also
supports Windows phone.
• Developing with the SDK should be easy, plug-ins for application devel-
opment environments are preferred.
• The license should support commercialization of applications developed
with the SDK without being overly expensive or difficult.
1.5 Application
The vision of the application that is going to be developed is to better inform
public transport users. They should always know how long they will have to wait
at the station that they intend to travel from. The user should get information
about where on the route the buses are, how far a specific bus has to travel
until it will arrive and how long time it is until that specific bus arrives. This
information should be visualized with augmented reality to the user in a fast,
simple and clear way.
2

2 THEORETICAL BACKGROUND v1.0
2 Theoretical background
2.1 Introduction
The information gathered during the analysation of the SDKs will be presented
in this section. The section ends with a comparison between all the examined
SDKs and a conclusion which presents the most suitable SDK for Android de-
velopment. The analysis has been done from an Android developer point of
view since the goal of this master thesis is to develop an Android application.
2.2 Vuforia
2.2.1 Platform support and development language
The Vuforia SDK supports iOS, Android and Unity. The SDK is developed in
C/C++ and you interact with it using C/C++. This means that from an An-
droid developers point of view, the Android Native Development Kit(NDK)[4]
must be installed and you use Java Native Interface(JNI)[5] to call the SDK.
Much of the content of an application developed with Vuforia will therefore be
developed in C/C++.
2.2.2 Documentation
There is an Application Programming Interface(API) for all classes of the Vufo-
ria SDK available on their website[6]. The API contains a descriptive text for all
classes and methods. It is well structured and it is easy to get a good overview
of the class structure. There is also an image of the class heritage to see what
class it extends. The website contains a developer guide which is a tutorial on
how to install the tool-kit provided. It includes how to set up the development
environment for the different platforms, installation guides, instructions on how
to compile and run the code and tips on developer workflow. There is no tu-
torials for android development, but there are several sample programs which
are very well documented and show all the functionality of Vuforia. An image
of one of our tests with the sample code can be seen in figure 1. If you have
problems with the SDK and need support from Vuforia there is a forum on their
website where most questions are answered within a couple of hours.
2.2.3 Tracking solutions
The Vuforia SDK supports markerbased tracking with multiple targets. To be
able to track an image you need to upload it to the Vuforia website where it
is processed and you receive two files that the SDK can use as an image target
for the tracking algorithm. The tracking values were extracted in real time
3

2 THEORETICAL BACKGROUND v1.0
Figure 1: Vuforia sample code tracking an image and overlaying a 3D model.
Measured value Value reported by SDK10cm 10020cm 19930cm 30240cm 403
Table 1: Reported distance from target by the Vuforia SDK.
when an image was tracked and the distance from the camera to the target was
calculated. The x, y and z coordinates were extracted from the pose matrix that
the SDK delivers and sqrt(x2 +y2 +z2) was used to calculate the distance. The
distance was measured with a ruler from the side of the smartphone and to the
target at the same time and the results are presented in table 1. The tracking
of objects far away was tested and Vuforia lost tracking when the target was
2.5 meters away from the smartphone. Vuforia started to track the target again
when it was 1.2 meters away from the smartphone. The picture that was used
as a target can be seen in figure 2. All the tests were done on a Samsung Galaxy
S3.
2.2.4 License
It is free to download and develop applications using Vuforia SDK and it does
not cost anything to publish your application to any application market.
4

2 THEORETICAL BACKGROUND v1.0
Figure 2: Tracking target for Vuforias sample program ImageTarget [18]. (Theimage is the property of Qualcomm Austria Research Center GmbH).
2.2.5 Other
The Vuforia SDK has a cloud service for target management since there is a cap
on 100 images that you can supply with your application. The cloud storage is
accessed through the internet and increases the target recognition from a few
frames to a few seconds (depending on network speed). The cloud storage is
available both in a free version and a paid version, the free version supports
1000 targets while the version you have to pay for supports over one million.
2.3 Metaio
2.3.1 Platform support and development language
The Metaio SDK has support for iOS, Android, Unity and Windows. When
developing for Android in eclipse you get access to the SDK by importing a
project containing the SDK. All the methods available from the SDK are called
with Java which makes it easy for development.
2.3.2 Documentation
There is an API for all the classes of the SDK available on Metaio’s website[7].
It is fairly well documented and all classes and methods have descriptions, some
of them could be more descriptive though. When developing for Android in
eclipse, the descriptions available in the API can be seen as javadoc in pop ups
from eclipse. On their website there are also several sample projects which have
text descriptions of the important parts of the code that handles the tracking
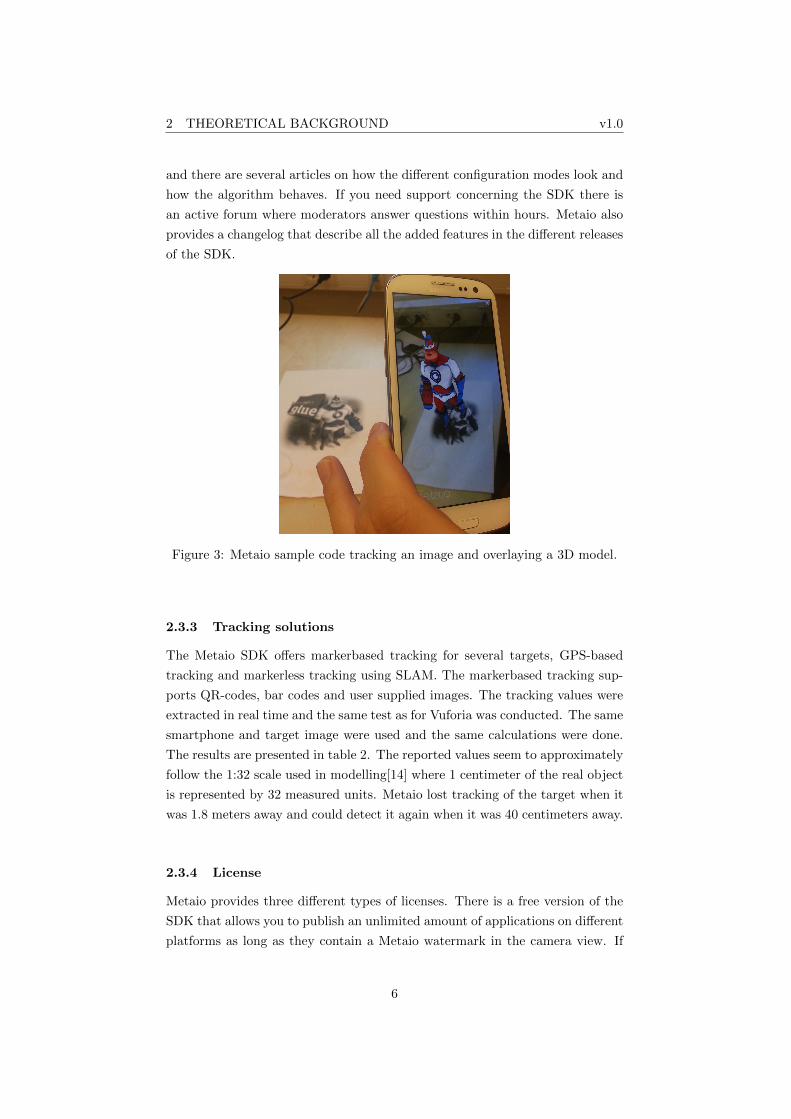
and rendering. An image of one of our tests with the sample code can be seen
in figure 3. The tracking algorithm uses xml files for configuration modification
5
2 THEORETICAL BACKGROUND v1.0
and there are several articles on how the different configuration modes look and
how the algorithm behaves. If you need support concerning the SDK there is
an active forum where moderators answer questions within hours. Metaio also
provides a changelog that describe all the added features in the different releases
of the SDK.
Figure 3: Metaio sample code tracking an image and overlaying a 3D model.
2.3.3 Tracking solutions
The Metaio SDK offers markerbased tracking for several targets, GPS-based
tracking and markerless tracking using SLAM. The markerbased tracking sup-
ports QR-codes, bar codes and user supplied images. The tracking values were
extracted in real time and the same test as for Vuforia was conducted. The same
smartphone and target image were used and the same calculations were done.
The results are presented in table 2. The reported values seem to approximately
follow the 1:32 scale used in modelling[14] where 1 centimeter of the real object
is represented by 32 measured units. Metaio lost tracking of the target when it
was 1.8 meters away and could detect it again when it was 40 centimeters away.
2.3.4 License
Metaio provides three different types of licenses. There is a free version of the
SDK that allows you to publish an unlimited amount of applications on different
platforms as long as they contain a Metaio watermark in the camera view. If
6

2 THEORETICAL BACKGROUND v1.0
Measured value Value reported by SDK10cm 32520cm 65730cm 99240cm 1334
Table 2: Reported distance from target by the Metaio SDK.
you want to get rid of the watermark you have two possibilities, buy the basic
product to remove the watermark from 2D tracking only or buy the pro version
of the product where no watermark will be shown at all.
2.3.5 Other
Metaio provides a tool with the feature to scan and save 3D environments. These
environments could later be used as tracking targets. The tool is available as
an application for smart phones and is called Creator for Android and Toolbox
for iOS.
2.4 D’Fusion
2.4.1 Platform support and development language
D’Fusion is available to develop applications for Android, iOS, Unity and flash.
When developing with D’Fusion you use D’Fusion studio which is a standalone
program. In D’Fusion studio you handle scenarios in which you add cameras
and 3D objects to the scenario through a graphical user interface. The events
that set off tracking algorithms are managed through LUA scripting. To load
the scenarios in your Android application you need the D’Fusion mobile SDK
which loads the exported project from D’Fusion studio.
2.4.2 Documentation
There is an API for the LUA classes that can be opened from within the
D’Fusion studio. There is also a step by step guide with pictures on how to
start your first D’Fusion studio project. An extensive guide on how the aug-
mented reality engine works can also be found in the D’Fusion studio. There
are several sample projects that can be download on D’Fusion’s website[8]. The
projects come with a short installation guide and a short description of what
each project does, but no information of what the code does. A test of one of the
sample projects can be seen in figure 4. There are tutorials on the website that
shows how to create 3D models with Autodesk Maya[9] or Autodesk 3DSMax
7

2 THEORETICAL BACKGROUND v1.0
[10] that can later be included in you augmented reality project in D’Fusion
studio. You have to use one of those 3D modelling programs as D’Fusion stu-
dio uses a proprietary 3D model format that can only be extracted from them.
There is a support forum on their website but the answer time can be over a
month in some cases and no answer at all in others.
Figure 4: D’Fusion sample code tracking an image and overlaying a 3D model.
2.4.3 Tracking solutions
D’Fusion offers markerbased tracking, GPS based tracking and face detection
and tracking. The markerbased tracking can handle QR codes, barcodes and
usersupplied images.
2.4.4 License
You can download and test the D’Fusion suite, but if you want to publish an
application commercially you have to become a partner with Total Immersion
which is the company that created the D’Fusion suite. The price you pay to
become a partner is negotiated based on what you are going to do with the
D’Fusion suite.
2.5 Layar
2.5.1 Platform support and development language
The Layar SDK supports development for both iOS and Android. The SDK
provides three simple classes which are used to interact with the SDK.
8

2 THEORETICAL BACKGROUND v1.0
2.5.2 Documentation
On Layar’s website there is a lot of information about how to get started with
Layar[11]. There is a lot of information about what techniques Layar is using
and how to get started with the different features provided by Layar. It is
also possible to download technical documentation for the SDK which includes
an API. The homepage also includes a support forum where moderators post
articles concerning problem users have encountered. The support page also
includes a FAQ where frequently asked questions are answered.
Figure 5: Test of image tracking with the Layar SDK.
2.5.3 Tracking solutions
The Layar SDK only supports image recognition. All trackable images are
uploaded to Layars server via their homepage and is then available via the
Layar browser.
2.5.4 License
You can request a trial key that can be used to test the SDK. The trial key
period is 30 days and gives you the rights to test all features of the SDK and
even try to publish the application. When the trial period is over the user has
the option to buy the rights to have the application published. There is then a
yearly fee per application.
9

2 THEORETICAL BACKGROUND v1.0
2.6 Mixare
2.6.1 Platform support and development language
Mixare is available on both Android and iOS. Since Mixare is open source
the source code for both projects are available for free on their website[12].
The Android version is developed in Java and the iOS version is developed in
Objective-C.
2.6.2 Documentation
You get UML diagrams for some of the classes when you download Mixare for
Android and most classes have descriptive javadocs. There are a few short
tutorials on the wikipage on Mixares google code page[13].
2.6.3 Tracking solutions
Mixare only supports GPS based tracking. A test with Mixare can be seen in
figure 6 where Sankt Petri church in Malmo is tracked.
Figure 6: Test of Mixare in Malmo.
2.6.4 License
Mixare is licensed under the GNU GPL v3 open source license.
10

2 THEORETICAL BACKGROUND v1.0
2.7 Comparison
These sections include a comparison between the different SDKs. The section is
divided into subsections where each feature is discussed individually. A visual
representation of the comparison can be found in table 3 at the end of the
section.
2.7.1 Tracking of QR code
Metaio and D’Fusion have built-in support specially designed to identify and
track QR codes which results in a more robust tracking. You can track QR-
codes with Layar and Vuforia as well, but then you have to track them with
the built-in support for image recognition because there is no special support
for QR codes.
2.7.2 Tracking of images
All the tested SDKs support image tracking except Mixare. In Vuforia you
upload the image you want to track to their website for processing, in return
you get an xml- and a dat-file that the SDK can use for the tracking algorithm.
The processing on the website is very specific on what kind of pictures it accepts.
There are some quality requirements for the image you want to process and if
the requirements are not fulfilled the image will not be processed. In Metaio you
only have to put the image you want to track in a folder that can be accessed
at runtime and the SDK will try to track it. You can configure the tracking
parameters for a specific target in an xml file but there is no indicator if a
target image is hard to track. The only way to notice it is if the algorithm has
a hard time to lock on to the target at runtime. With D’Fusion you are able to
use images without preprocessing the target.The image target is added to the
D’Fusion studio and then made available at runtime. In Layar you upload the
image you want to track to their website and the application will then connect to
the Layar server to find the targets to track at runtime. The image tracking in
Vuforia is a lot more robust than in any of the other SDKs. When rendering an
object on top of the target it will stay in the correct spot without flickering even
when the camera is very shaky. The target will be tracked from the farthest
distance of all the SDKs tested in this thesis and the distance from which it
detects an image is also the farthest.
2.7.3 Tracking of 3D object
Metaio is the only SDK in this examination that supports “true” 3D object
tracking. Vuforia supports 3D object tracking if an image of all the sides of the
11

2 THEORETICAL BACKGROUND v1.0
3D object is supplied to the SDK and is of sufficient quality. D’Fusion supports
face recognition and tracking in 3D but no other objects than that. The 3D
tracking in Metaio uses a format that is proprietary to Metaio: ”.3dmap”. It can
either be supplied to the SDK before compilation to track specific objects that
are known beforehand or SLAM can be used to try to map and track an object
in realtime when the application is running. The 3D maps can be created by
either an Iphone app (“Toolbox”) or an Android app (“Creator”) by scanning
the object with the camera on your mobile device. The realtime mapping and
tracking using SLAM does not work that well and often starts to track a random
spot in the middle of the air instead of the intended target. A test was done to
track a water bottle that was preprocessed by the Creator application. Metaio
indicated that the target was the floor on the side of the water bottle instead
of the intended target.
2.7.4 Tracking of GPS coordinate
Metaio, Mixare and D’Fusion support GPS coordinate tracking. Mixare uses a
ring or a triangle to show a tracked GPS coordinate but in all the other SDKs
you can specify what to overlay on the tracked coordinate.
2.7.5 Overlay on tracked object
The support for rendering content on top of targets differ a lot between the
SDKs. In Vuforia you have to write your own code for what you want to overlay.
There is code in the sample applications from Vuforia that shows how to render
objects on top of targets using OpenGL ES (information about OpenGL can
be found at Khronos group’s website [17]) and everything that can be rendered
with OpenGL can be overlayed on the target. Metaio supports picture, video
and 3D models in the format .md2, .obj and .fbx. If you do not want to use any
of the supported formats of 3D models there is a tutorial on how to incorporate
your own rendered objects with the tracking system. You can also write your
own code to render objects on top of the target using OpenGL ES. D’Fusion
supports picture, video and 3D model overlay. If you want to use 3D models
you have to use either Autodesk 3DSMax or Autodesk Maya to create them
and export them to D’Fusions proprietary format to be used with the SDK.
Layar can overlay either pictures or links on tracked objects. What is going to
be overlayed is chosen on their website at the same time that you upload the
image to be tracked. Mixare only overlays shapes (triangles or circles) but you
can write your own code to render what you like on top of a tracked object.
12

2 THEORETICAL BACKGROUND v1.0
SDKTrackQRcode
TrackImage
Track3Dobject
Track GPScoordinate
Overlay ontracked object
Vuforia No Yes No No (1)
Metaio Yes Yes Yes YesImage, video, 3Dmodel, link, (1)
D’Fusion Yes Yes No YesImage, video, 3Dmodel, link
Layar No Yes No No Image, link
Mixare No No No Yes Link
Table 3: Summary of SDK comparison. (1) means that the SDK can overlayeverything that can be rendered with OpenGL ES.
2.7.6 Metaio versus Vuforia
Based on the investigation and comparison done in section 2 only Metaio and
Vuforia met the requirements that was stated in section 1.4. This section will
present the advantage or disadvantage when choosing to work with either one.
One advantage with Metaio is the development language, as Metaio is purely
Java based it is very easy for an Android developer to incorporate the SDK into
an application. In Vuforia, on the other hand, the developer needs to write
some parts in C++ and separately compile and link the project with JNI. Since
Metaio has its own built in rendering engine the developer can easily call one
method to render an object. In vuforia, the developer will have to build the
rendering engine by themselves using openGL.
Programs that overlayed a 3D object on an image was developed using both
SDKs. Both applications did the same task but the Vuforia project contained
about five times more lines of code than the Metaio project did.
While comparing what tracking features Metaio and Vuforia supported,
Metaio seemed to be the best choice. As illustrated in table 3 Metaio sup-
ports all different kind of tracking and Vuforia only supports image tracking.
The SLAM feature that enable Metaio’s 3D tracking was released with the lat-
est version of the Metaio SDK and seems to be on a beta or trial stage. The
feature obviously needs more work in terms of robustness and performance if it
should be used in or integrated with any application.
A test was done with both Metaio and Vuforia where most of the function-
ality was stripped from a sample application from each SDK that tracked an
image. The size of the compiled application was 19.36 MB for the application
using Metaio and 8.80 MB for the application using Vuforia. The time from
starting the application until it tracked a target and rendered an overlay was
13

2 THEORETICAL BACKGROUND v1.0
SDK Lost tracking Detected targetVuforia 2.5 m. 1.2 m.Metaio 1.8 m. 40 cm.
Table 4: Data from test with Metaio and Vuforia. Measured the distance wherethe SDKs lost the target and from what distance they could detect it again.
measured for both applications. The test was done five times per application on
a Samsung Galaxy S3. Vuforia tracked and rendered a 3D object 2.74 seconds
on average after being started whereas the average time for Metaio were 5.94
seconds when performing the same task. The Metaio splash screen logo is shown
for 2.5 seconds in average and if no background calculations are done during
this time the start time for the Metaio SDK will be reduced to 3.44 seconds if
you buy the rights to the SDK.
The tracking of images is more robust in the Vuforia SDK compared to
Metaio. When the camera moves a lot the overlayed object stays in the correct
spot when using Vuforia. When using Metaio the object flickers and moves
around on the screen and in some cases the object never returned to the tracked
target. As can be seen in table 4 Vuforia is both able to track and detect a
target that is farther away than Metaio can. Metaio has a very active presence
in the research and development of augment reality for smartphones. Metaio is
part of a EU project called Venturi which has the goal to create a “pervasive
AR paradigm”[15]. Metaio also recently signed an agreement with ST-Ericsson
to integrate Metaio’s augmented reality accelerated chipset into ST-Ericsson’s
future mobile platforms[16]. This makes Metaio interesting for future projects
if they optimize their SDK and get SLAM to work properly.
2.8 Conclusion
The Metaio SDK will be used for development of the application described in
section 1.5. A big part of the project will be based on GPS coordinate tracking
and only Metaio has support for that. The fact that the image tracking is not as
good as Vuforia’s is outweighed by the simplicity of developing with Metaio. If
it is impossible to implement the functionality of the application with Metaio’s
image tracking then Vuforia will be used for the parts with image tracking and
Metaio will be used for GPS coordinate tracking.
14
3 DESIGN OF PUBLIC TRANSPORTATION APPLICATION v1.0
3 Design of public transportation application
3.1 Introduction
The methods and techniques that was used during the data collecting phase of
the design process were a questionnaire, a market analysis, brainstorming and
bodystorming. These techniques were chosen since they are easy to use and
generate a lot of data that provide a good basis for development.
3.2 User study
3.2.1 Introduction
This section includes studies concerning the potential users of the application,
what the market situation looks like and definition of the main functionality of
the application.
3.2.2 Market analysis
The market analysis was conducted on all the larger application markets and the
conclusion is that there are several applications available on all platforms with
some sort of feature to show information about public transportation. None of
the applications found had any feature using augmented reality in the way we
intended to do. In most of the applications the user could retrieve information
about specific bus routes, the bus departures and when a specific bus will arrive
at a specific bus stop. One application was found that used augmented reality to
display information about public transportation called the London Tube. The
application basically works like a standard travel application with features to
retrieve information about how and when train and buses are departing and
arriving. The augmented reality part of the application is used to help the user
navigate to the nearest bus station, train station or any other point of interest 7.
There are several different augmented reality browsers that show user supplied
point of interests by displaying different types of pointers in the camera view.
The most downloaded application using augmented reality on Google Play and
Apple app store is Layar which displays points of interest. Users can define
and categorize their own points and then upload them to a global database.
All Layar users can then retrieve information from the database and detect all
specified points of interests. Another application with similar functionality as
Layar is Wikitude which is based on the Vuforia SDK. Still no application with
the features to track buses and augment a pointer in the direction of the bus
in real time was found. In addition to that, no application was found with the
feature to overlay objects on timetables and maps at bus stops and bus stations.
15

3 DESIGN OF PUBLIC TRANSPORTATION APPLICATION v1.0
Figure 7: Screenshot from the London Tube application.(The image is the prop-erty of Presselite - London Tube for iPhone).
3.2.3 Brainstorming
Several brainstorming sessions with different topics were held during the design
phase of the project. The first session was conducted at LTH with the project
tutors. The topic of the session was “What application to develop?”. The
discussed ideas were:
• Vehicle register - The idea basically was to read license plates and then
display information about the owner.
• Tower defence - A tower defence game where all the action was aug-
mented on the table in front of the phone.
• Fire safety - A tool for the fire safety responsible at a company. The tool
should help the responsible to oversee if the office fulfills all requirements
in regards to fire safety.
• High bay storage - A customer helper. The application is used to help
people to navigate through different storages.
• Ikea furnitures - An application that help users to furnish their home
with virtual objects and test different furnitures before buying the real
object.
• Urban planning - A tool to display virtual buildings in the real world
through a smartphone before starting a new construction,“Is this what it
16

3 DESIGN OF PUBLIC TRANSPORTATION APPLICATION v1.0
will look like?”. Much like the Ikea furniture application but in bigger
scale.
• Graffiti - AR-graffiti. Instead of the classic way to paint graffiti this will
be a way not to paint directly on walls. The content will be available
through a smartphone instead.
• Book/Education - The idea was an application to be used as an extra
feature to books and study materials. By using marker based tracking
different objects should be overlayed on specific images.
Figure 8: Picture from the first brainstorming session..
Though none of the ideas discussed above were chosen for development the
session resulted in a spontaneous bodystorming session at a bus stop in Lund
3.2.4. Another brainstorming session was held to generate scenarios 3.2.5. The
scenarios describe different use cases where the application could be useful and
also how it will work in practice. During the same session the questions for the
questionnaire 3.2.6 were formulated.
3.2.4 Bodystorming
The first bodystorming session took place at a bus stop in Lund. During the
session a smartphone was held in front of the map in the bus shed. The
bodystorming-person stated “Imagine that all relevant buses should be dis-
played with AR through the smartphone”. The action led to the idea to point
the smartphone in the direction that the bus arrives from. An indicator for the
17
3 DESIGN OF PUBLIC TRANSPORTATION APPLICATION v1.0
location of the bus and an estimation of how long the user needs to wait until
the bus arrives could be shown in the camera view of the smartphone. The
feature used to display buses on the map also resulted in the idea to augment
buses on timetables to define where the buses are at the moment. A second
bodystorming session was conducted in the centre of Lund. A lot of bus stops
are close by each other which lead to an important discovery. The application
was going to display the time until the bus departed from the nearest bus stop
but during the bodystorming session it was proven that this is not always the
preferred bus stop. During the session the application was started when the
user was in the vicinity of a bus stop that he did not intend to travel from.
The application reported the time until the bus departed from the nearest bus
stop automatically and not the bus stop the user wanted to travel from. This
resulted in the conclusion that the application needs an easy way to scroll past
the wrong information until the correct information is displayed. It needs a
simple way for the user to define what bus line he wants to travel with and in
what direction.
3.2.5 Scenarios
Scenario 1
An ordinary commuter, Bosse, arrives at his usual bus stop. He is just in time
and is wondering where the bus is. He starts the application Busskoll on his
smartphone and points it towards the direction the bus is arriving from. He can
not see the bus in the opposite direction so he sweeps the smartphone along the
horizon until he finds the bus. The application shows him that the bus is one
minute late and 500 meters away.
Scenario 2
Agda, 67 years old, arrives at the bus stop where bus line 4 departs. She looks
at the map of all the different bus lines but do not understand which line that
represent bus number 4. She starts Busskoll on her smartphone and points it at
the map. Line 4 is highlighted in the camera view on the smartphone and the
location of the buses that are near the bus stop where Agda is standing shows
up on the map. Agda clicks on the bus that goes in the direction she wants to go
and the application tells her that it will arrive at to the bus stop in four minutes.
Scenario 3
Lasse is late for his bus. He walks in a fast pace towards his usual bus stop
where only line 2 departs. He wonders if he will be in time for the bus and
starts Busskoll on his smartphone. The application shows him a list of all the
18

3 DESIGN OF PUBLIC TRANSPORTATION APPLICATION v1.0
bus stops that is near and he chooses the one he is heading for. He then points
his smartphone towards the bus stop that is before his and sees that the bus
already left the bus stop. He realises that he has to hurry and runs to his bus
stop to catch the bus just in time.
Scenario 4
Lisa arrives at a bus station where several bus lines depart. She wants to travel
with bus line 34 and wonders how long she will have to wait until the bus de-
parts. She starts Busskoll on her smartphone which shows her a list of all the
bus lines that depart from the bus station. She selects bus line 34 and points
her smartphone in the opposite direction she wants to travel. The application
tells her that the bus will arrive in 24 minutes.
Scenario 5
Konrad is waiting for the bus at a bus stop. The bus is late and Konrad won-
ders when it will arrive. He starts Busskoll on his smartphone and points it at
the timetable of the bus line he wants to travel with. The application shows
Konrad where the bus is by indicating the bus station where the bus is at on
the timetable.
Scenario 6
Cornelis is in a new city and he does not know his way around. He wants to
travel by bus to a specific destination and is standing at the bus station but
do not know which bus to get on. He starts Busskoll on his smartphone and
enters the destination he wants to travel to. He sweeps the smartphone along
the horizon until he finds an overlay displaying the bus stop he should travel
from. The overlay displays that Cornelis should travel with bus 2 that departs
from location D and arrives in seven minutes.
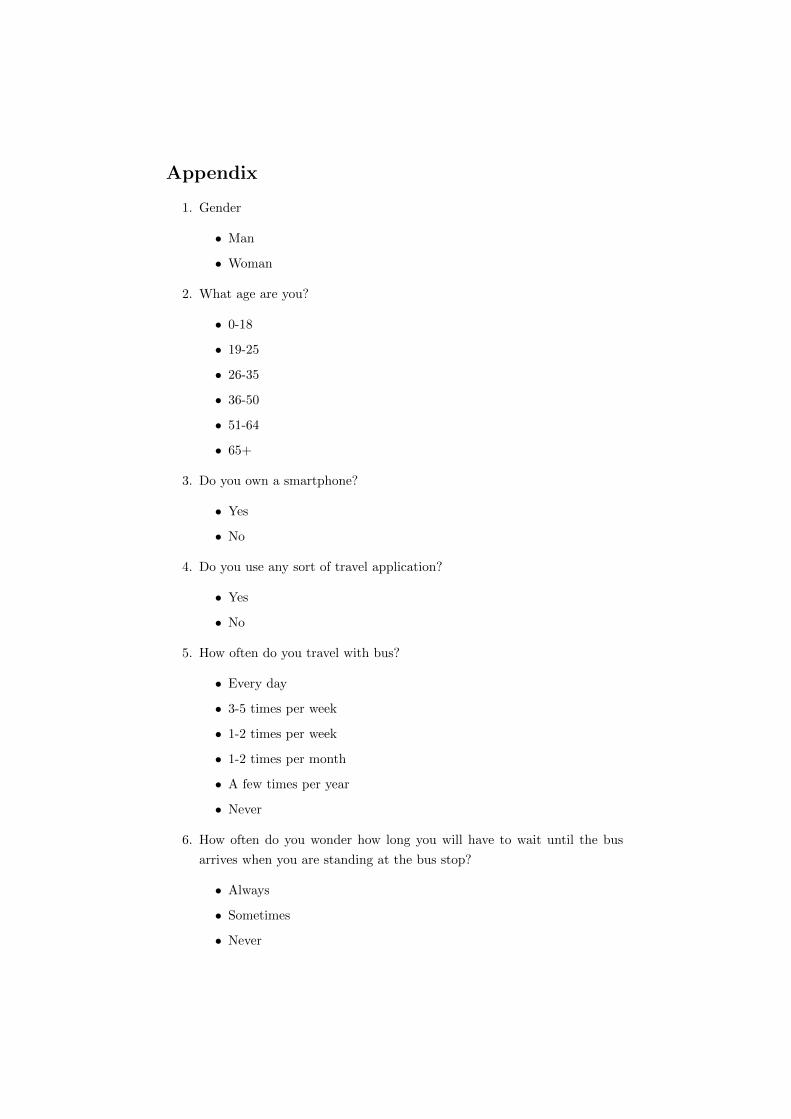
3.2.6 Questionnaire
A questionnaire was conducted with the purpose to verify that there is a de-
mand and market for an application with the features we intend to develop. The
questionnaire was mainly answered by students in Lund. The questions in the
questionnaire can be seen in Appendix A. The answers from the questionnaire
are subdivided into two groups based on their answer on the question “How
often do you ride the bus”. The first group, Group A, is the regular commuters
who travel by bus more than 3 times a week. The other group, Group B, travel
by bus less than 3 times a week. Group A consists of 18 participants and Group
B consists of 53 participants. On the question “How often do you wonder how
19

3 DESIGN OF PUBLIC TRANSPORTATION APPLICATION v1.0
long you will have to wait until the bus arrives when you are standing at the
bus stop?”, 50 % of Group A answered that they always think about it and the
rest of the group answered that they sometimes think about it. 60% of Group
B always think about it, 30% sometimes think about it and 10% answered that
they never think about it. The application that is to be developed makes it
easier for the user to see how long time it is until the bus departs which is
something both groups think about. This shows us that there is a need from
the public for an application with this functionality.
Figure 9: Answers to ”How often do you look at the maps that are available atthe bus stop?” divided by Group A and Group B
If the answers to the question “How often do you look at the maps that are
available at the bus stop?” 9 are compared to the answers to the question “How
often do you look at the timetable that is available at the bus stop” 10, it can be
seen that Group A are infrequent users of both the maps and timetables that are
available at bus stops. This is probably due to them being regular commuters,
they know when the bus will depart and what route it takes. 34% of Group B
answered that they always look at the timetables and only 9% answered that
they never use them, this indicates that a function that utilize the timetable
should be appreciated by the intended user. The maps that are available are
less used by Group B than the timetables but a good portion (47%) still use
them sometimes.
20

3 DESIGN OF PUBLIC TRANSPORTATION APPLICATION v1.0
Figure 10: Answers to ”How often do you look at the timetable that is availableat the bus stop?” divided by Group A and Group B
On the question “Which types of functions would you like to have in this kind
of application?” the potential users marked which functionality they wanted to
have, see figure 11. Function 1 and function 4 were the most popular choice in
the total group of surveyed people. Group A marked function 2 and 3 as the
most popular but Group A also answered that they rarely use the timetable or
the maps so it is a possible misleading result due to Group A being a small test
group. The answers that Group B gave were expected, as they rarely travel by
public transport they want a function to find the bus stop. Once there they
want an easy way to know how long it is until the bus arrives.
Figure 11: Answers to ”Which types of functions would you like to have in thiskind of application?” divided by Group A and Group B
21

3 DESIGN OF PUBLIC TRANSPORTATION APPLICATION v1.0
3.2.7 Functionality
Based on the questionnaire the different features of the application was given a
priority. The features were ranked from one to four where the most popular fea-
ture got a one and the least popular a four. The function that augments pointers
to the nearest bus stop was ranked lowest because several applications was found
during the market analysis that contained this function. The functionality will
be implemented according to the priority in the list. The functionalities will be
briefly described below.
1. Pointer through the camera which displays where the bus are at the mo-
ment.
2. Augment the bus that user are waiting for on the map at the bus stop.
3. Augment a bus on the timetable. The augmented bus will be displayed at
the bus stop it recently passed.
4. Augment pointers in the camera view to the nearest bus stops that are
relevant for the user based on the destination he wants to travel to.
Function 1
The user has chosen what bus stop he intends to travel from and the bus line he
wants to travel by. The user then aims the smartphone to where he thinks the
bus is. An overlay will be shown on top of the camera image when the user aims
the phone in the direction of the bus. On the overlay there will be information
about how long it is until the bus arrives and how far away it is.
Function 2
The user has chosen what bus stop he intends to travel from and the bus line he
wants to travel by. He then aims the smartphone to the map that is available at
some of Skanetrafiken’s bus stops. An overlay will be shown on top of the map
that highlights the bus line that the user chose. All the buses that are available
for the line the user choose will also be shown on the overlay.
Function 3
The user has chosen what bus stop he intends to travel from and with what
bus line. The user aims the smartphone to a timetable that is available at
Skanetrafiken’s bus stops. An overlay will be shown in the camera image of the
timetable. The overlay will show the user on what station the buses are on the
line he chose.
22
3 DESIGN OF PUBLIC TRANSPORTATION APPLICATION v1.0
Function 4
The user has chosen what destination he intends to travel to. The user then
moves the camera on the smartphone around until he finds an overlay in the
camera view. The overlay will show in what direction and how far away the bus
stop is.
23

3 DESIGN OF PUBLIC TRANSPORTATION APPLICATION v1.0
3.3 Lo-Fi prototyping
During the Lo-Fi prototyping phase parallel designing was used. Parallel design
is a technique used to generate design proposals in an early stage of a design
process. In this process, two different lo-fi prototypes were developed by the
two authors of this master thesis. These two prototypes were later merged to
one prototype that serves as a base for the application user interface. The first
instance of the Lo-Fi prototypes were tested on the authors of this master thesis
and the scenarios that were presented can be seen below.
Scenario 1 The user is going to travel with bus line 4 towards Norra Faladen
from Ake hans. The user wants to know how long it will be until the bus arrives.
Scenario 2 The user has some spare time when waiting for the bus stop and
he wants to try out the augmented reality functions for maps that Busskoll pro-
vides.
Some of the important conclusions concerning the user interface can be seen
in the list below.
• Use headlines: The design was confusing, the user found it hard to
understand where in the user interface structure he was working. There
should be a headline on every page in the user interface to ease the pres-
sure on the short time memory, see figure 12.
Figure 12: Screenshot of a view from one of the lo-fi branches.
24

3 DESIGN OF PUBLIC TRANSPORTATION APPLICATION v1.0
• Use the action bar: The user wanted to go to the startpage but had
to press the back button several times. There is a need to quickly switch
between different parts of the application. Therefore, the the action bar
will be used for this purpose.
• Menu for map view: The user wanted to look at a specific line in the
map view but could not. Add a menu to let the user choose which line
they want to view.
• Add favorites: The user wants to look at a specific line fast because he
is stressed. Add favorites to minimize the number of steps the user has to
go through to start the bus finding functionality, see figure 15.
Figure 13: The favorite-view.
• User supplied bus stop: The user wanted to choose a bus stop that
the application did not show in the list of near bus stops. Add an option
to let the user enter the name of the bus stop.
25

3 DESIGN OF PUBLIC TRANSPORTATION APPLICATION v1.0
Figure 14: A view that displays the nearest bus stations or bus stops inthe area.
The parallel designing and the observations from the lo-fi test resulted in one
merged lo-fi prototype that is used as a base for the user interface. The essential
parts of the final lo-fi prototype can be seen in the Appendix B.
3.4 Usability evaluation - First iteration
During the later stage of the design process and in parallel with the implemen-
tation several usability tests were conducted on potential users. The tests were
performed in an informal way.This means that the test subjects had freehand
to orientate through the application. No specific use case or scenario were used.
Inputs from these tests are summarized in this section:
• Hard to understand the different views in function 1: During the
tests many users found it difficult to understand the different views of
function 1, see figure 16 and 17. The users did not understand what to
choose in the long lists of names, bus stations and bus lines.
• Information in the camera view: Users found it difficult to read the
information text in the camera view. The information disappeared too
fast.
• Radar in the camera view for function 1: If the user was not familiar
with the city and the specific bus station they found it difficult to find the
buspointer in the camera view. Therefore, a radar was implemented and
displayed in the upper right corner of the camera view.
26

3 DESIGN OF PUBLIC TRANSPORTATION APPLICATION v1.0
• The text on the pointer in function 1: Some users found it difficult
to read the text that was displayed on the pointer in function 1. The text
had a small font and when the overlay flickered it became difficult to read.
• Legends in function 2: Another finding from the tests was that some
users did not really understand the different icons that were displayed on
the map. To help the user, some sort of legend could be added explaining
the functions of all icons.
• Loading icon in function 2: While using the second function the user
turned impatient and switched lines when the application was retrieving
information from Skanetrafiken. Some sort of feedback was needed to
inform the user that the application was processing data.
• Information in the camera view for function 2: Some users did not
understand what to do with the second function. Information should be
displayed to the user that explained what to do in the camera view, like
the text message in function 1.
• Make the entire field clickable: In the start screen there are two fields
dividing the screen. One field for each function, see figure ??. Users often
tried to click on these fields instead of pressing the red button inside the
fields.
27

3 DESIGN OF PUBLIC TRANSPORTATION APPLICATION v1.0
Figure 15: Screenshot of the main view.
Figure 16: Screenshot of the list view displaying the 10 nearest bus stops.
28

3 DESIGN OF PUBLIC TRANSPORTATION APPLICATION v1.0
Figure 17: Screenshot of the list view displaying the availble lines and directionfrom a specific bus stop.
29

4 IMPLEMENTATION OF PUBLIC TRANSPORT APPLICATION v1.0
4 Implementation of public transport applica-
tion
4.1 Workflow
Some of the design and implementation have been done in parallel and a figure
of the workflow of the project can be seen in figure 18.
Figure 18: A figure of how the work with this thesis has been conducted.
4.2 Data retrieving and parsing
4.2.1 Working with Skanetrafiken’s API
In order to get information in real time about buses and trains that are operated
by Skanetrafiken they have a web service API that can be used.There are seven
different ASP scripts that can be called that are shown in the list below:
• Querypage used to find information about departure and arrival points.
• Resultspage used to find information about travel options between a
departure point and an arrival point.
• Querystation used to find information about stop areas.
• Neareststation returns stop areas that are close to a GPS coordinate
and the distance to the stop area.
30

4 IMPLEMENTATION OF PUBLIC TRANSPORT APPLICATION v1.0
• Stationresults returns information about lines that depart from a sup-
plied stop area.
• Trafficmeans returns all the different types of transportation that is
available from Skanetrafiken.
• Journeypath used to find the route between departure point and arrival
point, returns the route as an array of GPS coordinates.
The scripts are called using HTTP GET requests and they return informa-
tion encased in a SOAP message. SOAP is a protocol used to transfer informa-
tion in a structured way. SOAP relies on XML to structure the information in
a message.
During testing of the application it has become apparent that the open
API that Skanetrafiken supplies is very unreliable. The response times differ
a lot and in some cases no response at all is sent from Skanetrafiken. As all
functionality of the application is based on responses from Skanetrafiken’s API
the application feels unresponsive and the different functions get long loading
times.
All the GPS coordinates that are returned by Skanetrafikens API are in
Rikets Triangelnat 90 (RT90) format which needs to be converted to match the
World Geodetic System 84 (WGS84) format that is used world wide. The ASP
scripts expect all inputs of coordinates to be in the RT90 format as well.
4.2.2 Converting coordinates from WGS84 to RT90 and back
The GPS coordinates that are available through Android are in the format
WGS84 and Skanetrafiken’s API expects coordinates in the RT90 format. There-
for, there was a need to convert the coordinates between these two formats. In
the application Gauss Kruger’s formulas were used for this purpose. The for-
mulas are available at Lantmateriet [19] [20]. The constants that were used for
the formulas are for the 2.5 gon V 0:-15 projection and can be seen below.
• Longitude of the central meridian (λ0) = 15.0+48.0/60.0+22.624306/3600.0
• Scale factor along the central meridian (k0) = 1.00000561024
• False northing (FN) = -667.711
• False easting (FE) = 1500064.274
• Semi major axis of the ellipsoid (a) = 6378137
31

4 IMPLEMENTATION OF PUBLIC TRANSPORT APPLICATION v1.0
4.2.3 Bus lines and bus direction
The location of all bus stops on a bus line is needed to be able to accurately
display to the user where the bus is that he intends to travel with. There is a
functionality to find all the bus stops on a given bus line in the resultpage script
by skanetrafiken but this does not work. All the bus stops on all bus lines in
Scania have therefore been parsed from skanetrafikens website and are available
in the application at runtime. The bus stops are categorised by each bus line
so it is easy to find all the bus stops previous to the one the user is at for a
specific line. These are then sent as arguments to the stationresult script until
it is found out between which two bus stops the bus currently is located.
4.3 Augmented reality
4.3.1 Tracking and displaying the location of the bus with aug-
mented reality
The overlay that displays in what direction the bus is shows up as a green bus
with two text fields in the camera view. The text fields are filled with informa-
tion on how far the bus has to travel and for how long it takes until it arrives
at the bus stop that the user is travelling from. To get the correct direction for
the overlay the RT90 coordinates of the bus stop that is closest to the bus is re-
trieved from Skanetrafikens API and converted into WGS84 coordinates. These
coordinates are supplied to Metaio that handles the displaying of the overlay at
the correct position. The position of the bus is slowly moved between the bus
stops by interpolating the coordinates of the bus so the user gets a feeling that
the bus is getting closer. Metaio is configured to make the overlay larger as the
bus is getting closer to the user to enhance this feeling. A screenshot of this
function in action can be seen in figure 19.
32

4 IMPLEMENTATION OF PUBLIC TRANSPORT APPLICATION v1.0
Figure 19: Screenshot of the application tracking a bus that is heading towardsNorra faladen in Lund
4.3.2 The augmented reality map view
When the user aims the smartphone towards one of Skanetrafiken’s maps dis-
playing the bus lines in Malmo and choose a bus line to track an overlay is
displayed on top of the map. This overlay highlights the bus line that the user
has chosen and displays the buses that are closest to the user on the selected
bus line. A picture of each highlighted bus line is available at runtime and de-
pending on what bus line the user has chosen a specific picture is loaded as an
overlay. A screenshot of this function in action can be seen in figure 20.
33

4 IMPLEMENTATION OF PUBLIC TRANSPORT APPLICATION v1.0
Figure 20: Screenshot of the application tracking buses on bus line 1 when theuser is standing at Gustav Adolfs torg in Malmo.
Figure 21: The image used as tracking target for function 2.
34

4 IMPLEMENTATION OF PUBLIC TRANSPORT APPLICATION v1.0
4.4 Final design
4.4.1 Start screen
When the application is started the start screen, seen in figure ??, is shown to
the user. The user can select between four choices from this view that starts
the different activities that are described in this section. Function 1 and 2 are
started from the big buttons in the middle of the screen and the settings and
how to activities are started from the bottom bar that is standard for Android.
4.4.2 Function 1
Two options are presented to the user after function 1 is started. The first op-
tion starts an activity where the user has to do three choices. The first choice is
the departure point the user wants to travel from. The 10 closest bus stations
are presented in a dropdown list. If the desired bus station is not in the list
the user has the option to enter the name of the bus stop manually. After a
bus stop is specified a second dropdown list is displayed to the user. This list
contains all bus lines that depart from the specified bus stop. The last selection
the user has to make is to specify in what direction he or she wants to travel.
This selection is made with two simple radio buttons, see figure 22.
Figure 22: The view where the user chooses from where to travel and in whatdirection.
35

4 IMPLEMENTATION OF PUBLIC TRANSPORT APPLICATION v1.0
The second option is called “Favorites” and provides the user with the option
to define favourite bus stations and bus lines. All favourites are displayed in a
list and the user can easily add new favourites via the add icon in the upper
right corner of the application see figure 23. The button will send the user to a
view with the same design as the search function described above.
Figure 23: The view with a users favorites.
4.4.3 Function 2
The camera view is started as soon as the user clicks on the function 2 icon
from the start screen. The user can switch between which line is being tracked
with a simple dropdown menu from the top bar. This function only works on
the city bus lines for Malmo in this first release. A screenshot of function 2 in
action can be seen in 20.
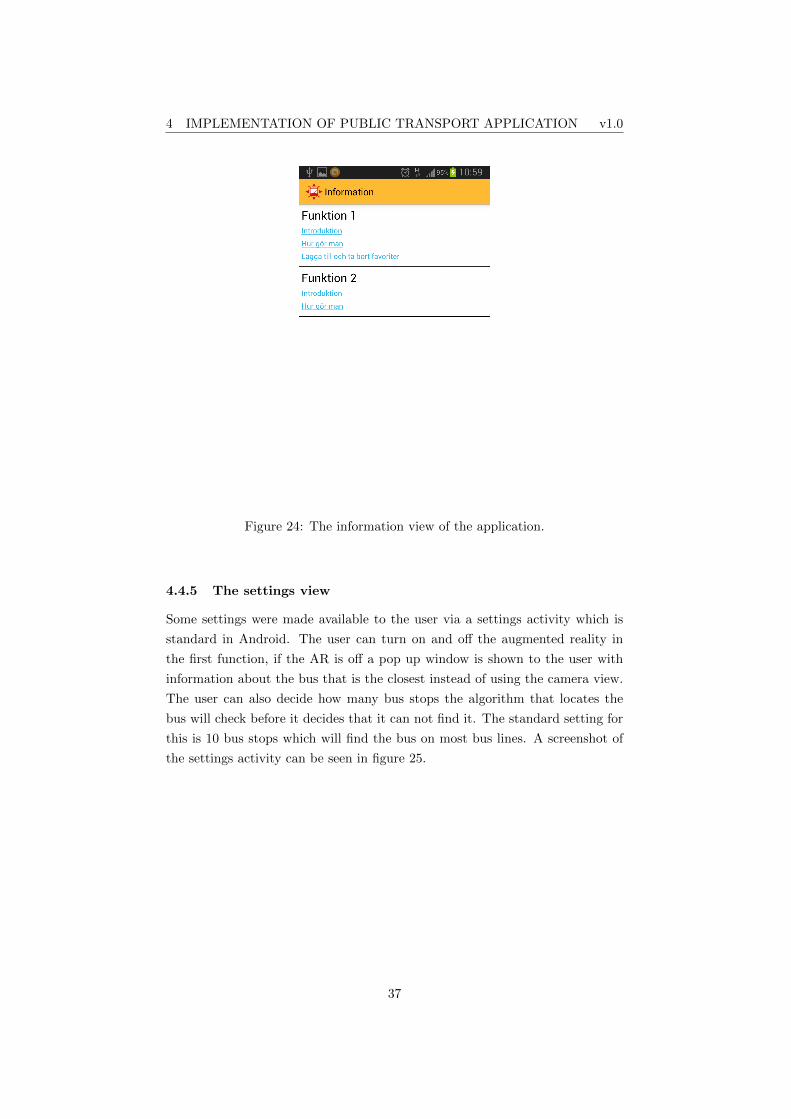
4.4.4 The how to view
This view can be seen in figure 24. A set of links for each function leads to an
information page that gives a short summary of the chosen topic. This view
have been modeled after the how to view of other Android applications so the
user should feel comfortable when using it.
36
4 IMPLEMENTATION OF PUBLIC TRANSPORT APPLICATION v1.0
Figure 24: The information view of the application.
4.4.5 The settings view
Some settings were made available to the user via a settings activity which is
standard in Android. The user can turn on and off the augmented reality in
the first function, if the AR is off a pop up window is shown to the user with
information about the bus that is the closest instead of using the camera view.
The user can also decide how many bus stops the algorithm that locates the
bus will check before it decides that it can not find it. The standard setting for
this is 10 bus stops which will find the bus on most bus lines. A screenshot of
the settings activity can be seen in figure 25.
37

4 IMPLEMENTATION OF PUBLIC TRANSPORT APPLICATION v1.0
Figure 25: The available settings.
38

4 IMPLEMENTATION OF PUBLIC TRANSPORT APPLICATION v1.0
4.5 Overview of user interaction
A figure of the possible choices a user can do in each view can be seen in figure 26.
Figure 26: The figure shows an overview of all the views in the application.
39
5 DISCUSSION v1.0
5 Discussion
5.1 Augmented reality in mobile devices
When starting this thesis both authors had grand schemes about the application
that was going to be developed as part of the project. It was thought that the
state of augmented reality for mobile devices was far more powerful than it is.
During the analysis it turned out that the SDKs that are available support either
image tracking and detection, GPS coordinate tracking or in some cases both.
The augmented reality field for mobile devices is fairly new and it becomes
obvious when testing some of the functionality of the SDKs that it is in a
developmental state.
5.2 The analysis
Most of the analysis of the code and functionality of the SDKs was based on
testing and manipulating the sample code that came with every SDK. Based
on those isolated test cases Metaio came out as the clear victor based on the
broad spectrum of functions and the ease of using them. If more time had been
available to develop specific test cases for every SDK to test them outside of the
comfort of the SDK specific samples it could have been possible to notice that
Metaio’s image tracking could not be used in the application. The time used
trying to get Metaio’s image tracking to work during the implementation phase
could have been used to develop these extra test cases during the analysis or
develop extra functionality for the application.
5.3 The application
5.3.1 Augmented reality in the application
The functionality of the application was designed based on the functions of the
chosen SDK. The functions of the application should prove that the functionality
of the SDK worked in a real project.
The GPS coordinate tracking was very easy to implement as Metaio handles
all the rendering of the overlay in the correct position. The overlay moves around
on the screen even when the device is held absolutely still but the direction is
correct. This makes the GPS coordinate tracking a bit useful but it would
probably be much more appreciated by the end user if the overlay did not
move around. The AR browsers that are available on the market and has GPS
coordinate tracking are much more robust and keep the overlay at the correct
position when the mobile device is held still. However, compared to the other
40

5 DISCUSSION v1.0
analyzed SDK’s that support GPS coordinate tracking, Metaio is still the best
choice.
The second function took a lot more time to implement than the GPS coor-
dinate tracking as Vuforia does not do any rendering. The pose matrix Vuforia
delivers with the position of the target is very accurate which places the overlay
within millimeters of the intended position. As Metaio was not able to track
the target at all this function is a good example showing how much more robust
Vuforia’s image tracking is compared to the best competitors on the market.
5.3.2 Choosing direction versus destination
When the user choose to travel with a bus line he also selects the direction of the
bus line and not a destination. This is not intuitive for most new users that are
used to being forced to enter both a departure point and a destination. However,
when working with Skanetrafikens API it is faster to just enter a direction and
not a destination so for a regular user of the application the time to get to the
AR view is minimized.
5.3.3 Automatically searches for nearest bus stop
The application always searches for the nearest bus stop based on the GPS
coordinates of the user. This is not always the bus stop the user wants to
travel from but based on the core functionality of function 1 this is the best
choice. Function 1 should be used when the user is standing at a bus stop and
is wondering where the bus is.
5.3.4 Further development
All functions that was intended to be in the application did not make it due
to the time constraint on this thesis. Function 1 could be enhanced to support
regional buses as well as city buses. Support for buses and bus lines from other
companies than Skanetrafiken could be added to both function 1 and function
2. Support for bus line maps for others towns than Malmo could be added to
function 2.
41

6 CONCLUSION v1.0
6 Conclusion
The goal of this thesis was to examine some of the available SDKs for developing
augmented reality powered mobile applications. A set of criteria 1.4 were set
to be able to define which of the SDKs that could be considered better than
the other. An application for Android was to be developed using the chosen
SDK to prove that the functions the SDK offered worked properly. During the
analysis in section 2 it was concluded that the Metaio SDK was best suited
for developing mobile applications because it had support for a lot of different
augmented reality functionality and it was very easy to use in development.
During the implementation of the second function in the application it was
found that Metaio could not be used for either detection or tracking of the
maps of all the bus lines. Vuforia, which has a more robust image tracking, was
needed to detect and track the image to be able to overlay the information that
should be shown to the user. The GPS coordinate tracking of Metaio is not as
good as was thought after the analysis and the overlaid image moves around a
lot on the screen even when the mobile device is held still. In controlled tests
Metaio seems to be a good choice but when used in a real project it does not
function as well as thought. Vuforia should therefore be considered as the best
choice when using an SDK for augmented reality in mobile devices.
42
7 BIBLIOGRAPHY v1.0
7 Bibliography
[1] A Survey of Augmented Reality, http://www.cs.unc.edu/~azuma/
ARpresence.pdf, Accessed[2013-06-10]
[2] Handbook of augmented reality, Borko Furht, Springer, 2011
[3] SLAM definition from OpenSLAM, http://www.openslam.org/,
Accessed[2013-06-10]
[4] Native development kit for Android, http://developer.android.com/
tools/sdk/ndk, Accessed[2013-06-10]
[5] Java native interface documentation from oracle, http://docs.oracle.
com/javase/6/docs/technotes/guides/jni/, Accessed[2013-06-10]
[6] API for Vuforia SDK, https://developer.vuforia.com/resources/
api/index, Accessed[2013-06-10]
[7] API for Metaio SDK, http://doxygen.metaio.com/metaioSDK41/index.
html, Accessed[]
[8] D’Fusion website, https://community.t-immersion.com/,
Accessed[2013-06-10]
[9] Autodesk maya website, http://usa.autodesk.com/maya/, Accessed[]
[10] Autodesk 3Ds-max website, http://usa.autodesk.com/3ds-max/,
Accessed[2013-06-10]
[11] API for Layar SDK, http://www.layar.com/documentation/browser/,
Accessed[2013-06-10]
[12] Mixare website, http://www.mixare.org/download/, Accessed[2013-06-
10]
[13] Mixare on google code, https://code.google.com/p/mixare/,
Accessed[2013-06-10]
[14] 1:32 scale described on wikipedia, http://en.wikipedia.org/wiki/1:32_
scale, Accessed[2013-06-10]
[15] Venturi project, https://venturi.fbk.eu/, Accessed[2013-06-10]
[16] Press release from Metaio, http://www.metaio.com/fileadmin/upload/
documents/press_articles/REL-metaio_st_ericsson_MWC-FIN.pdf,
Accessed[2013-06-10]
43

[17] Homepage for Khronos group, creators of OpenGL, http://www.khronos.
org, Acessed[2013-06-10]
[18] Image for tracking in Vuforia samples, https://developer.vuforia.
com/sites/default/files/dev_guide_images/getting_started_SDK_
devguide/stones_320.png, Accessed[2013-06-10]
[19] Formulas for doing the Gauss Kruger conversion, http:
//www.lantmateriet.se/Global/Kartor%20och%20geografisk%
20information/GPS%20och%20m%C3%A4tning/Geodesi/Formelsamling/
Gauss_Conformal_Projection.pdf, Accessed[2013-06-10]
[20] Transformationssamband mellan SWEREF 99 och RT 90, Lotti Jivall,
Lantmateriverket, 2001
Appendix
1. Gender
• Man
• Woman
2. What age are you?
• 0-18
• 19-25
• 26-35
• 36-50
• 51-64
• 65+
3. Do you own a smartphone?
• Yes
• No
4. Do you use any sort of travel application?
• Yes
• No
5. How often do you travel with bus?
• Every day
• 3-5 times per week
• 1-2 times per week
• 1-2 times per month
• A few times per year
• Never
6. How often do you wonder how long you will have to wait until the bus
arrives when you are standing at the bus stop?
• Always
• Sometimes
• Never

7. How often do you need to hurry to catch the bus?
• Always
• Sometimes
• Never
8. How often do you look at the maps that are available at the bus stop?
• Every time you travel with the bus
• Every time you travel from a new bus stops
• Sometimes
• Never
9. How often do you look at the timetable that is available at the bus stop?
• Every time you travel with the bus
• Every time you travel from a new bus stop
• Sometimes
• Never
10. Would you be interested in a smartphone application that shows you when
the bus will arrive?
• Very interested
• Maybe
• Not interested
11. Which types of functions would you like to have in this kind of application?
• A function that shows you how long time it is until the bus arrives
at your bus stop.
• A function that shows you graphically where the bus is on the timetable
that is available at the bus stop
• A function that shows you where nearby buses are on a map
• A function that shows you the nearest bus stop you can use based
on the destination you wish to travel to
12. Do you have any opinions about travel applications please let us now in
the field below