analysis and design of a scada system
TRANSCRIPT

The Degree of Master
A Thesis Presented in Partial Fulfillment of the Requirements for
Department: 2nd Cycle Studies
Specialisation: Automation
Thesis Title
Submitted by :
Mustapha Kamel Khaldi
Date: 6th July, 2020
Before a jury composed of:
Mr Chiali Anisse MCB ESSA. Tlemcen President
Mr Abdi Sidi Mohammed EL Amine MCB ESSA. Tlemcen Supervisor
Mr Bechiche Mohamed Engineer SEOR Co-Supervisor
Mr Megnafi Hicham MCB ESSA. Tlemcen Examiner 1
Mr Brahami Mustapha MCB ESSA. Tlemcen Examiner 2
Academic Year: 2019 / 2020
Analysis and Design of a SCADA System
People's Democratic Republic of Algeria الجـمـھـوریـة الجـزائـریـة الدیـمـقـراطـیــة الشـعـبـیــة
وزارة التعلیـم العالـي والبحـث العلمـي
المـدرسـة العلیـا في العلوم التطبیقیــة
-تلمسان-
MINISTRY OF HIGHER EDUCATION
AND SCIENTIFIC RESEARCH
HIGHER SCHOOL IN APPLIED SCIENCES --T L E M C E N--

Abstract
Supervisory Control And Data Acquisition (SCADA) systems are essential for improving
industrial and automation systems. Moreover they provide complete control of the plant, better
communication and efficiency for the system.
The aim of this study is to plan and design a modern SCADA System for the purpose of
Hassi Ben Okba pumping station. To do so, an optimum SCADA system is suggested taking
into account all the necessary parameters.
Résumer
Les systèmes de contrôle et d'acquisition de données (SCADA) sont essentiels pour
améliorer les systèmes industriels et d'automatisation. De plus, ils fournissent un contrôle
complet de l'installation, une meilleure communication et une meilleure efficacité du système.
Le but de cette étude est de planifier et de concevoir un système SCADA moderne pour la
station de pompage Hassi Ben Okba. Pour ce faire, un système SCADA optimal est suggéré en
tenant compte de tous les paramètres nécessaires.
ملخص
ضروریة لتحسین الأنظمة الصناعیة وأنظمة الأتمتة. (سكادا) ل على البیاناتتعد أنظمة التحكم الإشرافي والحصو
.علاوة على ذلك ، فإنھا توفر التحكم الكامل في المصنع ، وتحسین الاتصال والكفاءة للنظام
الحدیث لغرض محطة ضخ حاسي بن عقبة. للقیام بذلك ، (سكادا) الھدف من ھذه الدراسة ھو تخطیط وتصمیم نظام
.مراعاة جمیع المعلمات الضروریةیسمح ب قترح نظامتم

I
Dedication
To all my family members who have been constant source of motivation, inspiration and support
To my beloved parents To my brothers
To my grandparents To my uncles

II
Acknowledgement
First of all, I would like to thank my supervisor Professor Sidi Mohammed Abdi for his
guidance, great support and kind advice throughout my work. It was a real privilege and
an honor for me to work with him.
I would like to thank my committee members, Mr Chiali Anisse, Mr Megnafi Hicham, Mr
Brahami Mustapha, for serving as my committee members and generously offering their time,
support, guidance and good will. I also want to thank you for letting my defence be an
enjoyable moment, and for your brilliant comments and suggestions.
I also would like to thank to my co-supervisor M. Mohammed Bechich, engineer at the Oran
water board company (SEOR), for his constant support and constructive suggestions.
Special thanks and gratitude to M. Rersa Mustapha, engineer at the Oran water board
company (SEOR), whose insight and knowledge into the subject matter steered me through this
work, I have been extremely lucky to work with such a great man, who cared so much
about my work, and who responded to my questions and queries so promptly and was always
ready to help.
Furthermore I would like to acknowledge the hosting company personnel both M. Hamadi
Gaouar and M. Abdellatif Tefon, for their welcome, friendship and help.
Finally, I would like to acknowledge the pumping station personnel for their welcome
during my internship at the station.

III
Table of Contents
Dedication............................................................................................................................... I
Acknowledgement ................................................................................................................ II
Table of Contents ................................................................................................................ III
List of Figures...................................................................................................................... VI
List of Tables ...................................................................................................................... VII
Abbreviation ..................................................................................................................... VIII
Chapter I Presentation of the host company .......................................................................... 1
I.1 General overview ..................................................................................................... 2
I.1.1 Presentation of SEOR ....................................................................................... 2
I.1.2 Company missions ............................................................................................ 2
I.1.3 Water professions ............................................................................................. 2
I.2 Technological building ............................................................................................ 3
I.2.1 Presentation ...................................................................................................... 3
I.2.2 Purpose of the technological building .............................................................. 3
I.2.3 Departments ...................................................................................................... 3
I.3 Hassi ben Okba pumping station ............................................................................. 5
I.3.1 Presentation ...................................................................................................... 5
I.3.2 Components of the pumping station ................................................................. 5
Chapter II Supervision and monitoring system ..................................................................... 7
II.1 Introduction .............................................................................................................. 8
II.2 Basics concepts ........................................................................................................ 8
II.3 Monitoring ............................................................................................................... 9
II.4 Remote management ................................................................................................ 9
II.5 Supervision .............................................................................................................. 9
II.6 Supervision methodology ...................................................................................... 10
II.7 Active and Passive supervision .............................................................................. 11
II.7.1 Active supervision .......................................................................................... 11
II.7.2 Passive supervision ......................................................................................... 11
II.8 Elementary functions of a supervision and monitoring system ............................. 12
II.8.1 Monitoring functions: ..................................................................................... 12
II.8.2 Supervision and control .................................................................................. 13

IV
II.9 Supervision Standards (ISO 7498/4) ..................................................................... 14
II.9.1 Performance management .............................................................................. 14
II.9.2 Configuration management ............................................................................ 14
II.9.3 Accounting management ................................................................................ 14
II.9.4 Fault management........................................................................................... 15
II.9.5 Security Management ..................................................................................... 15
Chapter III Scada system ..................................................................................................... 16
III.1 History ................................................................................................................ 17
III.2 Definition ........................................................................................................... 18
III.2.1 Objectives of SCADA ................................................................................. 19
III.2.2 Benefits of Scada ........................................................................................ 19
III.2.3 Features of Scada ........................................................................................ 20
III.3 Applications of Scada ......................................................................................... 20
III.4 Functional Units of SCADA .............................................................................. 21
III.4.1 Master Terminal Unit (MTU) ..................................................................... 21
III.4.2 Remote Terminal Unit (RTU) ..................................................................... 21
III.4.3 Communication Network ............................................................................ 21
III.5 Architecture of SCADA ..................................................................................... 21
III.5.1 Hardware architecture ................................................................................. 21
III.5.2 Software Architecture: ................................................................................ 22
III.6 Scada protocols: ................................................................................................. 23
III.6.1 ISO Model ................................................................................................... 23
III.6.2 DNP3 Protocol ............................................................................................ 24
III.6.3 IEC60870 Protocol ...................................................................................... 24
III.6.4 HDLC .......................................................................................................... 25
III.6.5 Modbus ....................................................................................................... 25
III.7 Open Platform Communications ........................................................................ 26
III.7.1 Definition .................................................................................................... 26
III.7.2 Data Access DA .......................................................................................... 27
III.7.3 Alarms & Events AE .................................................................................. 27
III.7.4 Historical Data Access HDA ...................................................................... 27
III.7.5 Unified Architecture ................................................................................... 27
V
III.7.6 XML ............................................................................................................ 28
III.7.7 OPC DX ...................................................................................................... 28
Chapter IV Design and Simulation ...................................................................................... 29
IV.1 Introduction ........................................................................................................ 30
IV.2 Functional analysis ............................................................................................. 30
IV.2.1 Operator interface: ...................................................................................... 30
IV.2.2 Data exchange: ............................................................................................ 30
IV.2.3 Trends ......................................................................................................... 32
IV.2.4 Alarms ......................................................................................................... 32
IV.2.5 Communication medium ............................................................................. 33
IV.3 Configuration and Settings ................................................................................. 34
IV.3.1 Software components .................................................................................. 34
IV.3.2 Main screen ................................................................................................. 35
IV.3.3 Alarms screen: ............................................................................................ 36
IV.3.4 Trends ......................................................................................................... 37
IV.3.5 Historical data ............................................................................................. 38
IV.3.6 Alarms: ........................................................................................................ 40
IV.3.7 Tags ............................................................................................................. 41
IV.4 Simulation .......................................................................................................... 43
IV.4.1 Simulation values ........................................................................................ 43
IV.4.2 Simulation results ........................................................................................ 45
Chapter V General Conclusion ............................................................................................ 47
References ........................................................................................................................... 49

VI
List of Figures
Figure I-1 SEOR Company Headquarters ............................................................................. 2
Figure I-2 Technological Building ........................................................................................ 3
Figure I-3 Location of Hassi Ben Okba pumping station...................................................... 5
Figure II-1 Supervision chart ............................................................................................... 10
Figure II-2 Active supervision ............................................................................................. 11
Figure II-3 Passive supervision ........................................................................................... 11
Figure II-4 Monitoring functions......................................................................................... 13
Figure II-5 Structure of monitoring and supervision ........................................................... 14
Figure III-1 A Basic SCADA Diagram ............................................................................... 18
Figure III-2 Scada Hardware architecture ........................................................................... 22
Figure III-3 Scada Software architecture ............................................................................ 22
Figure III-4 OPC client server architecture ......................................................................... 26
Figure IV-1 eWON tags ...................................................................................................... 33
Figure IV-2 eWON tag configuration ................................................................................. 34
Figure IV-3 Main Screen details ......................................................................................... 35
Figure IV-4 Alarm screen details ........................................................................................ 36
Figure IV-9 Main screen simulation results ........................................................................ 45
Figure IV-11 Trend screen simulation results ..................................................................... 46
Figure IV-11 Alarm screen simulation results .................................................................... 46

VII
List of Tables
Table I-1 Motor-pump characteristics ................................................................................... 6
Table III-1 OSI Reference model layers ............................................................................. 23
Table IV-1 Received data .................................................................................................... 30
Table IV-2 Transmitted data ............................................................................................... 32
Table IV-3 Software component ......................................................................................... 34
Table IV-4 Main screen nomenclature ................................................................................ 35
Table IV-5 Alarm screen nomenclature .............................................................................. 36
Table IV-6 Trend screen nomenclature ............................................................................... 37
Table IV-7 Data logs ........................................................................................................... 38
Table IV-8 Logging tags for Msr data log ........................................................................... 38
Table IV-9 Logging tags for each pump data log ................................................................ 39
Table IV-10 Alarms configuration ...................................................................................... 40
Table IV-11 Configured tags ............................................................................................... 41
Table IV-12 Simulation values ............................................................................................ 43

VIII
Abbreviation
AE Alarms & Events
D/S Downstream
DA Data Access
DNP Distributed Network Protocol
DX Data eXchange
eWON European Work Organization Network
HAD Historical Data Access
HDLC High Level Data Link Control
HMI Human Machine Interface
IEC International Electrotechnical Commission
ISO International Standards Organization
LAN Local Area Network
MTU Master Terminal Unit
OPC Open Platform Communications
OSI Open Systems Interconnection
PLC Programmable logic controller
RTU Remote Terminal Unit
SCADA Supervisory Control and Data Acquisition
SQL Structured Query Language
U/S Upstream
UA Unified Architecture
VPN Virtual Private Network
WAN Wide Area Network
WHP Water Hammer Protection
XML Extensible Markup Language

1
Chapter I
Presentation of the host company

Chapter I Presentation of the host company
2
I.1 General overview
I.1.1 Presentation of SEOR
SEOR “Société de l’Eau et de l’Assainissement d’Oran” is a joint-stock company, whose
shareholders are the Algerian Water Authority “AWE” and the National Sanitation Office “NSO”,
established on April 1, 2008. The company is responsible for managing the public service of drinking
water supply and sanitation of Oran province, having as key objectives the improvement of the
efficiency and the quality of water services as well as the quality of life for citizens [1].
I.1.2 Company missions
- Ensure the availability of water.
- Carry out preventive maintenance and upgrade sanitation infrastructure.
- Improve the technical, economic, and environmental efficiency of water services.
- Develop human and material resources and introduce new technologies by training local
staff [1].
I.1.3 Water professions
Water production systems includes multiple professions, that aims to accomplish the following: [1]
- Drinking water.
- Sewerage.
- Metrology of meters.
- Water treatment.
- The operation, maintenance, and management of hydraulic structures.
Figure I-1 SEOR Company Headquarters
Chapter I Presentation of the host company
3
I.2 Technological building
I.2.1 Presentation
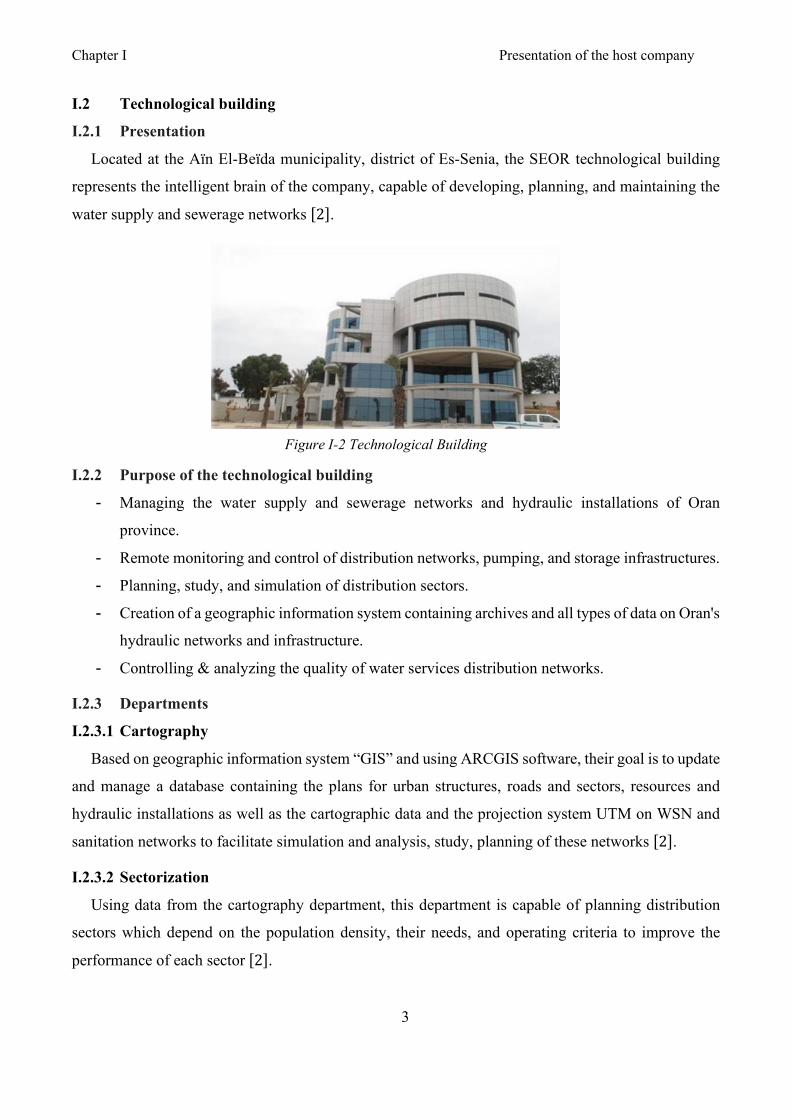
Located at the Aïn El-Beïda municipality, district of Es-Senia, the SEOR technological building
represents the intelligent brain of the company, capable of developing, planning, and maintaining the
water supply and sewerage networks [2].
I.2.2 Purpose of the technological building
- Managing the water supply and sewerage networks and hydraulic installations of Oran
province.
- Remote monitoring and control of distribution networks, pumping, and storage infrastructures.
- Planning, study, and simulation of distribution sectors.
- Creation of a geographic information system containing archives and all types of data on Oran's
hydraulic networks and infrastructure.
- Controlling & analyzing the quality of water services distribution networks.
I.2.3 Departments
I.2.3.1 Cartography
Based on geographic information system “GIS” and using ARCGIS software, their goal is to update
and manage a database containing the plans for urban structures, roads and sectors, resources and
hydraulic installations as well as the cartographic data and the projection system UTM on WSN and
sanitation networks to facilitate simulation and analysis, study, planning of these networks [2].
I.2.3.2 Sectorization
Using data from the cartography department, this department is capable of planning distribution
sectors which depend on the population density, their needs, and operating criteria to improve the
performance of each sector [2].
Figure I-2 Technological Building

Chapter I Presentation of the host company
4
I.2.3.3 Planning
This department is responsible for the good distribution of drinking water among subscribers and
sectors using MAIKEURBAN software that allows importing and exploiting GIS data (ARCGIS) and
facilitate the simulation, either for WSN implementing the EPANET extension or for sanitation using
SWIMM [2].
I.2.3.4 Telecontrol
The goal is to improve the quality of services offered by SEOR by speeding up intervention time,
facilitating decision-making, analyzing behavior and optimizing management and drawing up periodic
reports [2].
Using the Topkapi supervision software which allows to control and monitor the hydraulic stations
(tanks, pumping or desalination station). Record and store measurement data (pressure and flow).

Chapter I Presentation of the host company
5
I.3 Hassi ben Okba pumping station
I.3.1 Presentation
A booster pumping station which helps to increase the flow rate based on production demands.
Located at Hassi Ben Okba municipality, district of Bir El Djir. It is installed in line with the MAO
supply line.
The Mostaganem-Arzew-Oran (MAO) supply line begins downstream of the water treatment
station (STE) at Mostaganem and ends in the arrival chamber at the Oran reservoir. Its objective is to
supply water to the most important cities located along the line (Mostaganem, Arzew and Oran) [2].
I.3.2 Components of the pumping station
The primary constituents of the pumping station are introduced briefly in this section. Details are
included later in this thesis [2].
I.3.2.1 Control room
It includes:
- Control panel: it manages the station automation algorithm, general security, measurements of
both flowrate and pressure, and the alarm system.
- Human machine interface “HMI”: it represents all the hydraulic components constituting the
pumping station as well as the curves, notification and the alarms.
- Auxiliary electrical enclosure BT3F61: it interfaces the pressure control valves, upstream water
hammer protection equipment.
- Auxiliary electrical enclosure BT3F51: it connects with the pumps' room, downstream water
hammer protection equipment, instrumentation (flowmeter, pressure measurements).
Figure I-3 Location of Hassi Ben Okba pumping station

Chapter I Presentation of the host company
6
- Auxiliary electrical enclosure BT3F10: it includes the power supply for direct current
equipment.
- Variable speed drive for each pump.
I.3.2.2 Pumps' room
It contains electrical enclosures, each of which aims to interface with the local equipment located
near the pump unit such as: discharge and suction valves, PT100 probes, etc.
Table I-1 shows the characteristics of motor-pump groups
Table I-1 Motor-pump characteristics
Number of pumps: 4 + 1
Flow rate per pump / Total flow rate (m3/s): 1.0 / 4.0
Total head (m): 64
Pump speed (Rt/min): 993
Motor power (kw): 880
I.3.2.3 Water Hammer Protection (WHP)
The surge tanks are shock absorbers intended to dampen excess pressure variance, which occurs on
the pipelines when starting or stopping the pumps. This is performed by compression/expansion of the
air located at the top of the tank [2].
I.3.2.4 Pressure control room
The pressure room contains control valves which allow the adaptation of the pressure drop during
the transition from the gravity water supply mode to the booster water supply mode [2].

7
Chapter II
Supervision and monitoring system

Chapter II Supervision and monitoring system
8
II.1 Introduction
A supervision and monitoring system aims at performing, in the best conditions, production
planning. It means that it has to recognize abnormal situations. Then, the origin of this situation must
be found ‘diagnosis problem’. When the problem is well identified, a curative solution must be
elaborated. Actions on the control system and on the controlled process have to be performed.
This chapter describes the main aspects, concepts, functionalities and methodologies for
supervision and monitoring system.
II.2 Basics concepts
Generic terms related to supervision and monitoring systems are defined in this section,
- Fault: action, voluntary or not, that does not take all the specifications into account.
- Defect: difference between the actual value of a parameter and its nominal value.
- Error: part of a model isn't exactly matching the specifications of the physical system.
Logically, an error is a consequence of a fault.
- Latent error: the error is qualified of latent as long as the erroneous part of the model has
not been used. After uses of the erroneous part, the error becomes effective.
- Malfunction: execution of a process operation that does not give the expected results.
- Failure: event characterizing a situation in which an operation is not executed by a resource
because its state does not correspond any more to the nominal specifications.
- Breakdown state: state from which the system cannot provide the specified service. This
state follows from a failure.
- Symptom: event or data through which the detection system identifies an abnormal
operation of the process. The symptom is the only information the monitoring system knows
at the detection step.
- Exception: predefined corrective treatment executed when a specific symptom is
recognized.
- Mechanism reserved for well-known failures needing no heavy corrective means.
- Recovery point: state reachable from the breakdown state in which the system must be
driven to return to the normal operation.
- Recovery sequence: set of ordered actions executed in order to make the process evolve
from the breakdown state to the recovery point [3].

Chapter II Supervision and monitoring system
9
II.3 Monitoring
A monitoring system features a hardware device and a purpose-developed software program, this
system is used to collect data from the process and from the controller, determine the actual state of
the controlled system and makes the inferences needed to produce additional data (historic, diagnosis,
etc.). In this case, the status of the system being monitored can only be checked, this means no direct
actions either on the models or on the process are performed.
This system is most advantageous when associated with an alarm signaling system. In this case, the
values are compared against a series of preset standard or ideal values, or against a range of values that
the monitored parameters must stay within. If the values read do not coincide with the preset
parameters, the alarm system signals a fault, allowing the user to take action to restore optimum
operating conditions. [3; 4]
II.4 Remote management
The user can set the system control parameters remotely, such as the operating times, set points and
alarm thresholds. The centralized management of systems that may be installed even large distances
apart simplifies troubleshooting operations, as the actions can be carried out in real time [4].
II.5 Supervision
Computes and parameterizes the control sequence to be executed according to the state of the
control system and of the process, providing for the system itself to make decisions, when certain
situations arise, so as to ensure correct operation, resolve problems and optimize energy consumption.
It includes normal and abnormal operation [3; 4].
- During normal operation, the supervision takes the decisions to raise the indecision in the
control system (real-time scheduling, optimization, control parameterization and switching
from a control law to another one).
- When a process failure occurs, supervision takes all the decision necessary to put the system
back: in its normal operation (rescheduling, recovery actions, emergency procedures, ...)

Chapter II Supervision and monitoring system
10
II.6 Supervision methodology
It simply provides the answer to the following questions:
- What to supervise?
- How to supervise?
- When to supervise?
The what describes the application domain in which we want to obtain information about or have
control over, monitor and interact with its equipment and devices.
The How corresponds to the methods used in order to supervise such as: the observation, the
analysis, the detection… etc.
The when is how frequent we want to supervise [5].
Figure II-1 Supervision chart

Chapter II Supervision and monitoring system
11
II.7 Active and Passive supervision
Two main methods of supervision are passive and active, described briefly bellow [5].
II.7.1 Active supervision
It’s the most widely used method, it has the advantage of being reliable, the checks for supervised
data are carried out regularly and in question-answer mode. It consists of steps listed below:
- The server sends a request to the supervised resource.
- The resource responds to the server request.
- The server analyzes the information and determines a state for the resource.
II.7.2 Passive supervision
The supervised data are checked in the remote units, and the results are transmitted to the server,
the server receives the alerts and processes it. The data exchange is unidirectional. It has the advantage
of reduced communication costs, yet a major disadvantage concerns the update of information, there
is no guarantee that the supervised resource is in a correct state if no data are received.
Figure II-2 Active supervision
Figure II-3 Passive supervision

Chapter II Supervision and monitoring system
12
II.8 Elementary functions of a supervision and monitoring system
Several features have been developed and implemented in supervision and monitoring systems, in
general they are dived into two categories described as follow: [3]
II.8.1 Monitoring functions:
a. Data acquisition: collect technical data coming from the process sensors and the controller.
b. Perception: extracts indicators from technical data. Other monitoring functions to determine
if the process evolutions are normal ones uses these indicators or not.
c. Detection: determine the normality or abnormality of the system functioning. Two classes of
abnormal operations are considered:
- The first one includes situations in which basic operating constraints of the process are
violated (collisions for instance).
- The second one groups together situations in which the part routing (control law) is not
respected (fabrication delays for instance).
d. Filtering: forbid requests sending if the process is not in a state compatible with the
corresponding evolution.
e. Follow: maintain a history of treatments executed by and a trace of events observed by the
Control supervision system.
f. Classification: evaluate the degree of severity of the failure in order to adapt the treatment to
the criticity of the situation (emergency shutdown, diagnosis, ...). A failure can be:
- Critical, needing an emergency processing,
- Significant, needing a specific treatment,
- Minor or without global consequences,
- Tolerable (by the controller), not requiring a corrective treatment.
g. Diagnosis: look for a causality link between the observed symptom, the failure and its origin.
Classically, three sub-functions are distinguished:
- Localization determines the subsystem responsible for the failure.
- Identification identifies the causes of the failure.
- Explanation justifies the conclusions.
h. Prognosis: foresee the consequences of a failure on the future operation of the system. The
consequences can be immediate ones (resource unavailable) or induced ones (faulty parts in
the workshop).
Figure II-4 shows a summary of monitoring functions.

Chapter II Supervision and monitoring system
13
II.8.2 Supervision and control
a. Safety and emergency mechanism: processing with a high level of priority applied in order
to avoid dangerous evolutions for the machines or the shop workers.
b. Compensation: guarantee the service continuity when a failure occurs. This term does not
distinguish between a temporary and a complete process repairing.
c. Reconfiguration: acts on the process by changing the resources states or equipment and on the
control system by changing the control laws, the part routing, etc. Three classes can be defined:
- Minor, only the control law is adapted,
- Significant, other resources are re-allocated,
- Major, re-allocated resources need to be prepared to execute the recovery.
d. Decision: determine the state that must be reached to return to the normal operation, then
determines the sequence of corrective actions to be performed to reach this state.
e. Resumption: execute the corrective actions needed to return to a normal operation [3].
Figure II-4 Monitoring functions

Chapter II Supervision and monitoring system
14
II.9 Supervision Standards (ISO 7498/4)
The concept of supervision has been standardized by ISO. The defined functions are:
II.9.1 Performance management
The performance and efficiency of resources that constitute the system must be evaluated, it
includes procedures for data collection and statistics, dashboard establishment, and plan developments
in the network.
Network performance is evaluated based on four parameters:
- Response time
- The flow
- The error rate per bit
- Availability
II.9.2 Configuration management
Configuration management allows you to identify, configure and control the various network
objects. The procedures required to manage a configuration are:
- Information gathering
- State control
- Historical backup of system state configurations.
II.9.3 Accounting management
Its role is to know the charges of the managed objects as well as their communication costs. Usage
quotas can be set temporarily or not on each of the network resources. In addition, accounting
Figure II-5 Structure of monitoring and supervision

Chapter II Supervision and monitoring system
15
management authorizes the implementation of billing systems according to the use for each user.
Therefore, it allows the establishment of user costs as well as invoicing for the use of resources.
II.9.4 Fault management
Fault management allows the detection, localization and correction of transient or persistent
anomalies.
II.9.5 Security Management
Security management controls access to resources based on established usage rights policies. It
ensures that unauthorized users cannot access certain protected resources.
It also has the role of implementing security policies.

16
Chapter III
Scada system

Chapter III Scada system
17
III.1 History
Before SCADA, plant personnel had to be maintained on site, during production, in order to
control the processes via selector switches, push buttons, and dials for analog signals.
Relays and timers were used to provide some level of supervisory control and limited automation
functionality yet they were difficult to reconfigure and troubleshoot. As manufacturing grew and
remote sites began to scale out in size, solutions were needed to control equipment over long
distances.
Controlling industrial plants via processors became a reality in the early 1950s. Where computers
were first developed and used for industrial control purposes, thanks to the telemetry establishments
in the 60s the measurement data could be transmitted from remote to monitoring units. Another
decade later the term SCADA was used to describe systems with PLC’s and microprocessors that
were being used for the monitoring and control of automated processes on an even greater scale yet
each SCADA system stood on its own because Networks were not available “referred to as
monolithic SCADA systems.” In the next couple of decades, the ’80s and 90s, with the advent of
Local Area Networking (LAN), and HMI software, SCADA systems were able to connect to related
systems. Unfortunately, these were incapable of communicating with systems from other vendors.
These systems were called distributed SCADA systems Later in the ’90s and 2000s, SCADA began
to implement open system architectures with communication protocols that were not vendors
specific.
With the adoption of modern IT standards such as SQL and web-based applications, software has
greatly improved the efficiency, security, productivity, and reliability of SCADA systems [6].

Chapter III Scada system
18
III.2 Definition
The SCADA acronym stands for Supervisory Control and Data Acquisition, it is a collection of
both software and hardware components that allows to:
- Gathering and analyzing real-time data.
- Interact with devices such as sensors, valves, pumps, motors locally or remotely.
- Record events into a log file.
This collection begins with real-time data collected from plant floor devices, then passed to the
processors such as PLCs. From the processor, the data are distributed to a remote-control center where
a graphical representation of the operations exists for operator interactions that help to maintain
efficiency, process data for smarter decisions, and communicate system issues as well as enabling a
high-level process supervisory management and control [6; 7].
Figure III-1 A Basic SCADA Diagram

Chapter III Scada system
19
III.2.1 Objectives of SCADA
SCADA systems work well in many different types of enterprises because they can range from
simple configurations to large, complex installations. In view of this, Scada systems aims to: [6]
- Monitor: continuously monitoring the physical parameters.
- Measure: measuring the processing parameters. - Data Acquisition: Archiving & retrieving It acquires data from RTU, data loggers, etc., and
then store it in the data center.
- Data Communication: provide a communication and transmission medium for data between
different remote sites and central unit.
- Controlling: it allows interact with field devices and control stations remotely or locally.
- Automation: It helps for automatic transmission and functionality.
- Reports valued tool for tracking and analyzing performance and overall production health.
III.2.2 Benefits of Scada
Effective SCADA systems can result in significant savings of time and money. Numerous case
studies have been published highlighting the benefits using a modern SCADA software solution, some
of these benefits are:
- Improved overall System efficiency and performance.
- Improved reliability and quality of service.
- Reduce operation and maintenance cost.
- Reduced labor costs required for troubleshooting or service.
- Reduce system implementation costs.
- Facilitates engineering decision.
- Provide immediate knowledge of overall system health.
- High value service providers.

Chapter III Scada system
20
III.2.3 Features of Scada
SCADA systems perform several functions that allow for proper management of remote facilities.
The following are the core functions of SCADA system [8].
- Alarm handling
- Trend curves patterns
- Data access and retrieval
- Computer networking and processing
- Substation parameter monitoring
- Safety tagging
- High-resolution time stamping
- Sequence of events reporting for post event analysis
- Demand side management
- Volt/VAR control
- Preventive maintenance
- Fault detection isolation and restoration
III.3 Applications of Scada
SCADA is widely used in different industrial organizations and companies in the public and private
sectors the list of applications of SCADA can be listed as follows: [9]
a) Electric power generation, transmission and distribution: Electric utilities use SCADA
systems to detect current flow and line voltage, to monitor the operation of circuit breakers and to take
sections of the power grid online or offline.
b) Water, Waste Water Utilities and Sewage: State and municipal water utilities use SCADA
to monitor and regulate water flow, reservoir levels, pipe pressure and other factors.
c) Buildings, facilities and environments: Facility managers use SCADA to control HVAC,
refrigeration units, lighting and entry systems.
d) Manufacturing: Manage parts lists for just-in-time manufacturing, regulate industrial
automation and robots, and monitor quality and process control.
e) Mass transit: Transit authorities use SCADA protocols to regulate electricity in remote
locations. They also use it to automate traffic signals, to track and locate trains and buses, and to control
railroad crossing gates.
f) Traffic signals SCADA regulates traffic lights, controls traffic flow, and detects out-of-order
signals

Chapter III Scada system
21
III.4 Functional Units of SCADA
The major components of SCADA system include: [5; 7]
- Master Terminal Unit (MTU).
- Remote Terminal Unit (RTU).
- Communication Network.
III.4.1 Master Terminal Unit (MTU)
A central host computer server or servers (sometimes called SCADA Center, master station, Master
Terminal Unit (MTU) or Main Control Room (MCR)). It’s responsible for communication
establishments, collecting and saving data, interfacing with operators and to communicate data to other
systems [5; 7].
III.4.2 Remote Terminal Unit (RTU)
One or more field data interface devices, which interface field sensing devices and actuators. Collect
data and send it to the MTU when requested, modern technology such as PLCs are used as RTUs. This
helps for direct transfer and control of data without any signal from MTU [5; 7].
III.4.3 Communication Network
A communications system used to transfer data between RTU and MTU, the communication
mediums can be wired or wireless channels, fiber optic cables, twisted pair cables [5; 7].
III.5 Architecture of SCADA
SCADA architecture may be divided in two categories: [10]
- Hardware Architecture
- Software Architecture
III.5.1 Hardware architecture
This architecture of the system englobes two main parts:
- Client Layer: For human machine interface
- Data Server Layer: For data processing
The SCADA station refers to the servers, and it is composed of a single PC which process
controllers like PLCs or RTUs in the field can communicate with directly or indirectly via WAN or
LAN networks.

Chapter III Scada system
22
III.5.2 Software Architecture:
The software architecture consists of:
- Server which is used mainly for a real-time database and multitasking and are responsible
for handling and gathering of data.
- Set of programs that provides the main functionalities of SCADA system such as trending,
diagnostic and troubleshooting information, more over a graphical representation of the
plant.
Figure III-3 Scada Software architecture
Figure III-2 Scada Hardware architecture
Chapter III Scada system
23
III.6 Scada protocols:
Protocols allow different functional units of Scada to communicate with each other [11]. The two
widely used protocols for SCADA Applications are:
- HDLC (High Level Data Link Control).
- MODBUS.
III.6.1 ISO Model
The protocols are based on the ISO (International Standards Organization) standard seven-layer
OSI (Open Systems Interconnection) model, the details of which are given below. The different layers
are categorized based on the functions they perform.
The model makes it possible for communications to become independent of the devised system and
shield the user from the need to understand the complexity of the network [11].
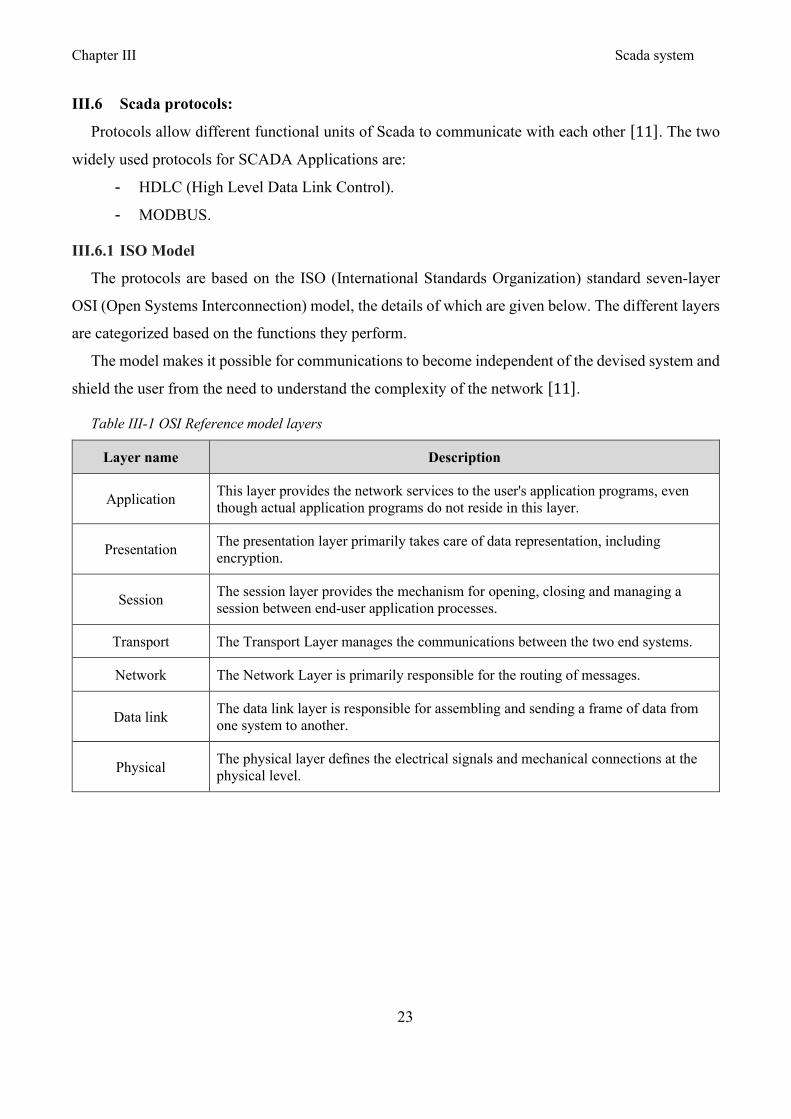
Table III-1 OSI Reference model layers
Layer name Description
Application This layer provides the network services to the user's application programs, even though actual application programs do not reside in this layer.
Presentation The presentation layer primarily takes care of data representation, including encryption.
Session The session layer provides the mechanism for opening, closing and managing a session between end-user application processes.
Transport The Transport Layer manages the communications between the two end systems.
Network The Network Layer is primarily responsible for the routing of messages.
Data link The data link layer is responsible for assembling and sending a frame of data from one system to another.
Physical The physical layer defines the electrical signals and mechanical connections at the physical level.

Chapter III Scada system
24
III.6.2 DNP3 Protocol
The DNP3 or Distributed Network Protocol is a set of communications protocols utilized in
communication between functional units of Scada, DNP3 supports multiple-slave, peer-to-peer and
multiple-master communications. It supports the operational modes of polled and quiescent operation.
The latter is also referred to as reporting by exception.
This protocol is designed to avoid being distorted by legacy equipment, as well as EMI noise and
low-grade transmission channels. This protocol shows an important reliable communication medium
but it’s not secure from hackers and threats [11; 12].
Advantages of DNP3 protocol
- Open protocol.
- Optimized for SCADA communications.
- Provide interoperability between different vendor’s equipment.
- Supported by a substantial number of SCADA equipment manufacturers.
- Improved bandwidth efficiency which is accomplished through event-oriented data reporting.
- DNP3 has good ability to handle error detection.
III.6.3 IEC60870 Protocol
IEC 60870-5 is the collection of standards produced by the IEC (International Electrotechnical
Commission). This standard can be used for interoperating various equipment from different suppliers
through standardized protocols. It is widely used for controlling electric power transmission grids since
provides tele-control and tele-protection of electric power systems through associated tele-
communication [11; 12].
IEC standard 60870 has five parts, defining general information related to the standard, operating
conditions, electrical interfaces, performance requirements and data transmission protocols. These
parts are:
- IEC 60870-5-1: Transmission Frame Formats.
- IEC 60870-5-2: Data Link Transmission Services.
- IEC 60870-5-3; General Structure of Application Data.
- IEC 60870-5-4; Definition and Coding of Information Elements.
- IEC 60870-5-5; Basic Application Functions.

Chapter III Scada system
25
III.6.4 HDLC
HDLC (High Level Data Link Control) is a bit-oriented code transparent synchronous data link
layer protocol developed by ISO. HDLC provides connection – oriented and connection – less services.
Though HDLC can be used for point to point and multi-point connections, but is preferable to use one
to one connections, known as asynchronous balanced mode (ABM). It forms the basis for all modern
protocols [11; 12].
III.6.5 Modbus
MODBUS protocol is simple and robust which has become a widely used standard communication
protocol for connecting industrial electronic devices. The protocol determines how each controller will
know device address, recognize a message addressed to it determine the action to be taken and extract
any information/data attached to it [11; 12].
The advantages of MODBUS protocol
- Industry centric.
- Open Source
- Easy to use and deploy
- Vendor independent

Chapter III Scada system
26
III.7 Open Platform Communications
III.7.1 Definition
The OPC (Open Platform Communications) is the standardized specification for industrial
communication applications, based on Client/Server architecture, the clients send requests to the server
and the server responds to the client requests. The client decides what data type should read from/write
to the system and how frequently this can happen.
OPC has several protocols, each of which have their commands that only affect one protocol at the
time, even if the OPC server supports different types of protocols. Some of these protocols are: DA
(Data access) The most commonly used and oldest protocol, AE (Alarm & Events), HDA (Historical
Data Access), XML DA (XML Data Access) and finally DX (Data eXchange). The following sections
provide more details [13].
Figure III-4 OPC client server architecture
Chapter III Scada system
27
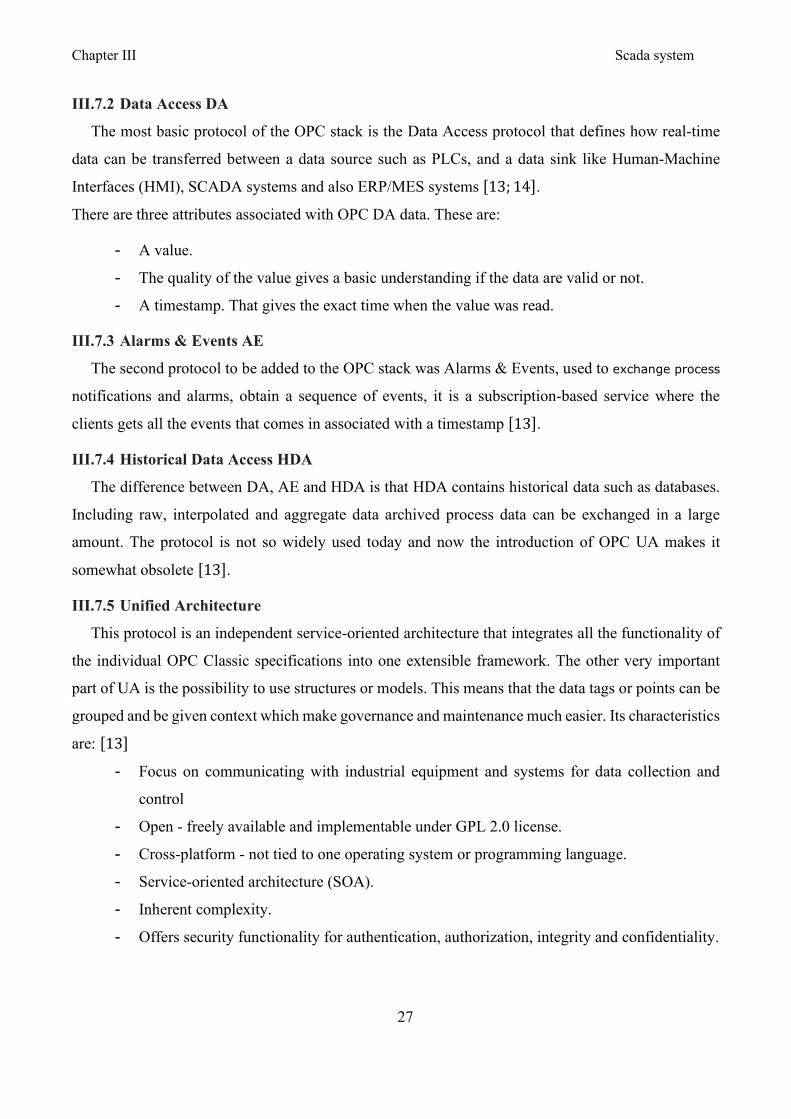
III.7.2 Data Access DA
The most basic protocol of the OPC stack is the Data Access protocol that defines how real-time
data can be transferred between a data source such as PLCs, and a data sink like Human-Machine
Interfaces (HMI), SCADA systems and also ERP/MES systems [13; 14].
There are three attributes associated with OPC DA data. These are:
- A value.
- The quality of the value gives a basic understanding if the data are valid or not.
- A timestamp. That gives the exact time when the value was read.
III.7.3 Alarms & Events AE
The second protocol to be added to the OPC stack was Alarms & Events, used to exchange process
notifications and alarms, obtain a sequence of events, it is a subscription-based service where the
clients gets all the events that comes in associated with a timestamp [13].
III.7.4 Historical Data Access HDA
The difference between DA, AE and HDA is that HDA contains historical data such as databases.
Including raw, interpolated and aggregate data archived process data can be exchanged in a large
amount. The protocol is not so widely used today and now the introduction of OPC UA makes it
somewhat obsolete [13].
III.7.5 Unified Architecture
This protocol is an independent service-oriented architecture that integrates all the functionality of
the individual OPC Classic specifications into one extensible framework. The other very important
part of UA is the possibility to use structures or models. This means that the data tags or points can be
grouped and be given context which make governance and maintenance much easier. Its characteristics
are: [13]
- Focus on communicating with industrial equipment and systems for data collection and
control
- Open - freely available and implementable under GPL 2.0 license.
- Cross-platform - not tied to one operating system or programming language.
- Service-oriented architecture (SOA).
- Inherent complexity.
- Offers security functionality for authentication, authorization, integrity and confidentiality.

Chapter III Scada system
28
- Integral information model, which is the foundation of the infrastructure necessary for
information integration where vendors and organizations can model their complex data into
an OPC UA namespace.
III.7.6 XML
This protocol is based on the OPC Data Access specifications and used to communicate data
in XML facilitate the exchange of plant data across the Internet, via Web services according, which
are available over the same TCP port as the built-in web server and upwards into the enterprise domain.
It incorporates SOAP and Web services. The OPC server exposes simple data points and complex
AST™ functions and. Because Web services are built for being routed across the Internet, the built-in
OPC XML-DA server uses basic authentication for protection against unauthorized write access
[13; 15].
III.7.7 OPC DX
OPC Data eXchange (OPC DX) designed to define how OPC servers exchange data with other
OPC servers, and to address the needs of device-to-device or bus-to-bus communications without
having to go up into the HMI or other higher layers. OPC DX does not specify a new method for the
data transfers and relies on OPC Data Access (OPC DA) data transfer capabilities already in use, while
a small number of vendors incorporated this specification in their products, there are no commercial
implementations of this technology. The Characteristics of this protocol are: [16]
- OPC DX provides a standardized method for OPC Server to OPC Server data transfers.
- OPC Server vendors that implement OPC DX in their OPC Servers can in turn directly
exchange data with other OPC Servers that implement OPC DX.
- OPC DX connections can be locally or remotely managed.

29
Chapter IV
Design and Simulation

Chapter IV Design and Simulation
30
IV.1 Introduction
The pumping station case study is part of the total water production system in the city of Oran.
The SCADA system implemented within the technological building of SEOR allows the personnel to
supervise and monitor the production system.
After defining the basic concepts and the fundamentals of the SCADA system in the previous chapters,
we may now describe the functional analysis.
IV.2 Functional analysis
In order to design and build the SCADA system, a set of requirements are needed.
IV.2.1 Operator interface:
The operator interface includes:
- A graphical representation of the elements that constitute the pumping station such as:
the pumps, the valves, the surge tanks, the pipes.
- Display of individual pump speed, the downstream and upstream pressures, instant and
accumulated flow rate downstream of the station, number of running pumps and
average running speed.
- Control elements such as trends, alarms view and acknowledgment.
IV.2.2 Data exchange:
Table IV-1 shows the data received:
Table IV-1 Received data
Name Type
Instant flow rate Real
accumulated flow rate Integer
Downstream pressure Real
Upstream pressure Real
Pressure control valve position Real
Deferential pressure Real
By-pass valve state Byte
Number of running pumps Integer

Chapter IV Design and Simulation
31
Table IV-1 Received data (Continued)
Name Type
Average frequency Real
Total efficiency Real
Energy cost Real
Pump communication state [1] Boolean
Pump state [1] Byte
Pump speed [1] Real
Hour meter [1] Real
On duration [1] Real
Off duration [1] Real
Number of start-ups [1] Integer
Pump bearing temperature 1 & 2 [1] Real
Motor winding temperature 1 & 2 [1] Real
Motor bearing temperature 1, 2 & 3 [1] Real
Motor current [1] Real
Individual Suction valve state [1] Byte
Individual Discharge Valve state [1] Byte
CR11 Valve state Byte
Main suction valve Byte
Main Discharge Valve Byte
Local/Distance mode Boolean
U/S WHP mode Boolean
D/S WHP mode Boolean
CR12 valves commands Boolean
1 For each motor-pump group

Chapter IV Design and Simulation
32
Table IV-2 shows the data sent:
Table IV-2 Transmitted data
Name Type
Remote flow rate set point Real
Mostaganem tank level Real
Oran tank level Real
CR12 valves limit switches (open & close) Boolean
Pressure control valve position Real
IV.2.3 Trends
Trends are essentially important for an industrial automation system. They are used to record
real-time data from the field, retrieve historical data and present them in graphical ways allowing the
operator to monitor the change in value over time. The following trends are requested:
- Instant flow rate.
- Downstream and Upstream pressures.
- Speed and current of each motor-pump group.
- Energy cost.
IV.2.4 Alarms
The control system generates several alarms that are used to notify the operator in case of any
fault that may occur in the pumping station. These alarms are:
- Minimum suction pressure.
- Maximum and minimum discharge pressure.
- Faults in any motor-pump group.
- Fault in Upstream or downstream water hammer protections

Chapter IV Design and Simulation
33
IV.2.5 Communication medium
The eWON modem router is an industrial VPN router that can read data from various devices
using built-in communication protocols. It also access of the data to other superior devices by Modbus
or SNMP protocols, allowing machine builders and end users to monitor and collect important data
from their PLC using VPN connection. It includes several features such as: data logging, alarming,
built-in web interface, and emailing or texting capabilities. [2; 17]
The data link is explained briefly in the following steps:
- The PLC is connected to eWON modem via ethernet.
- The modem is linked to talk2M cloud service.
- The programmer can connect to talk2M using the eCatcher software.
- The VPN tunnel is created establishing a connection between plc and remote access
device.
Figure IV-1 eWON tags

Chapter IV Design and Simulation
34
For the data access, there is no additional configuration in the PLC itself, as it is all done in the
modem web configurator.
IV.3 Configuration and Settings
In this part, details on the configuration of the project are described.
IV.3.1 Software components
Table IV-3 lists the software used in developing the Scada system and designing the user
interface.
Table IV-3 Software component
Software Version
STEP 7 Professional V15.1
WinCC Professional V15.1
Photoshop CC2018
Figure IV-2 eWON tag configuration

Chapter IV Design and Simulation
35
IV.3.2 Main screen
The main screen is presented in figure IV 3. It allows supervision and monitoring of the station.
Table IV-4 lists the nomenclature used in figure IV 3.
Table IV-4 Main screen nomenclature
Number Description
1 Screen navigation
2 Pumping station details, including its state, number of running pumps and average sped, more over the telecontrol mode, in case of remote control the operator at the supervision station may set the flow rate according to the desired value.
3 Upstream water hammer protection details
4 Downstream water hammer protection details
5 Flow rate measurements, including instantons and accumulated flowrate
6 Active alarms
7 Display of upstream, main discharge and downstream pressures.
8 Running speed of each pump
Figure IV-3 Main Screen details

Chapter IV Design and Simulation
36
IV.3.3 Alarms screen:
Figure IV-4 represents the alarm screen configuration.
Table IV-5 lists the nomenclature used in in Figure IV 4
Table IV-5 Alarm screen nomenclature
Number Description
1 Screen navigation
2 Active alarms
3 Alarm buffer
Figure IV-4 Alarm screen details

Chapter IV Design and Simulation
37
IV.3.4 Trends
Both of the Pressure & flow rate and pumps screens has the same structure as represented bellow:
Table IV-6 lists the nomenclature used in Figure IV 7.
Table IV-6 Trend screen nomenclature
Number Description
1 Screen navigation
2 Trends
Figure IV-7 Trend screen details

Chapter IV Design and Simulation
38
IV.3.5 Historical data
Historical data is used to collect, process and log process data. It is compiled, processed and
saved in the log database in Runtime and can be output as a table or trend. The following logs are
configured:
- Measurements: including flow rate and different pressure values.
- Details of each motor-pump group: current, speed, winding and bearing temperatures…
Tables IV-7, IV-8 and IV-9 represent the historical data configuration.
Table IV-7 Data logs
Name Storage location
Msr Database
Pump_1 Database
Pump_2 Database
Pump_3 Database
Pump_4 Database
Pump_5 Database
Table IV-8 Logging tags for Msr data log
Name Process tag Acquisition mode
Logging cycle
Logging cycle factor
Acum_FlowRate GNRL_DATA_Accum_FR Cyclic 1 s 1
D/S_Prs GNRL_DATA_P_out Cyclic 1 s 1
Inst_FlowRate GNRL_DATA_FLOW_RATE Cyclic 1 s 1
M_Dis_Prs GNRL_DATA_P_Spr Cyclic 1 s 1
M_Sxn_Prs GNRL_DATA_P_Asp Cyclic 1 s 1

Chapter IV Design and Simulation
39
Table IV-9 Logging tags for each pump data log
Name Process tag Acquisition mode
Logging cycle
Logging cycle factor
discharge_valve_state Slaves_Data_pump_1.discharge_valve_state On change / /
duration_motor_off Slaves_Data_pump_1.duration_motor_off Cyclic 1 s 1
duration_motor_on Slaves_Data_pump_1.duration_motor_on Cyclic 1 s 1
Hour_Meter Slaves_Data_pump_1.Hour_Meter Cyclic 1 s 1
motor_bearing_temp_1 Slaves_Data_pump_1.motor_bearing_temp_1 Cyclic 1 s 1
motor_bearing_temp_2 Slaves_Data_pump_1.motor_bearing_temp_2 Cyclic 1 s 1
motor_current Slaves_Data_pump_1.motor_current Cyclic 1 s 1
motor_winding_temp_1 Slaves_Data_pump_1.motor_winding_temp_1 On change / /
motor_winding_temp_2 Slaves_Data_pump_1.motor_winding_temp_2 Cyclic 1 s 1
motor_winding_temp_3 Slaves_Data_pump_1.motor_winding_temp_3 Cyclic 1 s 1
number_of_starts Slaves_Data_pump_1.number_of_starts On change / /
pump_bearing_temp_1 Slaves_Data_pump_1.pump_bearing_temp_1 Cyclic 1 s 1
pump_bearing_temp_2 Slaves_Data_pump_1.pump_bearing_temp_2 Cyclic 1 s 1
Pump_number Slaves_Data_pump_1.Pump_number On change / /

Chapter IV Design and Simulation
40
IV.3.6 Alarms:
Table IV-10 shows the alarms configuration:
Table IV-10 Alarms configuration
ID Alarm text Alarm class Trigger tag Trigger
bit
1 Pumping Station General fault Errors GNRL_DATA_EMR_Stp 0
2 Upstream water hammer protection general fault Errors WHP_US_Data_EMR_STP 0
3 Downstream water hammer protection general fault Errors WHP_DS_Data_EMR_Stp 0
4 Fault, Minimum suction pressure limit reached Errors GNRL_DATA_NotifSC 25
5 Fault, Minimum discharge pressure limit reached Errors GNRL_DATA_NotifSC 26
6 Fault, Maximum discharge pressure limit reached Errors GNRL_DATA_NotifSC 27
7 Upstream water hammer protection in manual mode Errors WHP_US_Data_Mode 0
8 Downstream water hammer protection in manual mode Errors WHP_DS_Data_Mode 0
9 Pump 1 general fault Errors Slaves_Data_pump_1.Alarms 9
10 Pump 2 general fault Errors Slaves_Data_pump_2.Alarms 9
11 Pump 3 general fault Errors Slaves_Data_pump_3.Alarms 9
12 Pump 4 general fault Errors Slaves_Data_pump_4.Alarms 9
13 Pump 5 general fault Errors Slaves_Data_pump_5.Alarms 9
Chapter IV Design and Simulation
41
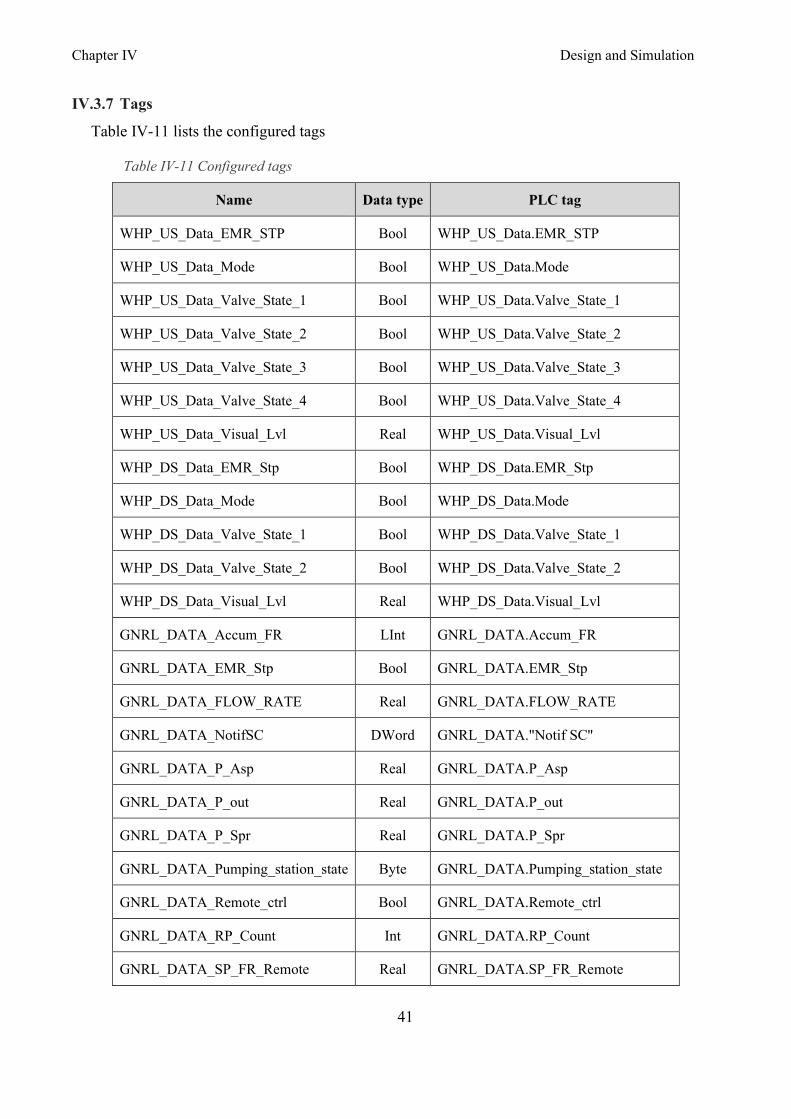
IV.3.7 Tags
Table IV-11 lists the configured tags
Table IV-11 Configured tags
Name Data type PLC tag
WHP_US_Data_EMR_STP Bool WHP_US_Data.EMR_STP
WHP_US_Data_Mode Bool WHP_US_Data.Mode
WHP_US_Data_Valve_State_1 Bool WHP_US_Data.Valve_State_1
WHP_US_Data_Valve_State_2 Bool WHP_US_Data.Valve_State_2
WHP_US_Data_Valve_State_3 Bool WHP_US_Data.Valve_State_3
WHP_US_Data_Valve_State_4 Bool WHP_US_Data.Valve_State_4
WHP_US_Data_Visual_Lvl Real WHP_US_Data.Visual_Lvl
WHP_DS_Data_EMR_Stp Bool WHP_DS_Data.EMR_Stp
WHP_DS_Data_Mode Bool WHP_DS_Data.Mode
WHP_DS_Data_Valve_State_1 Bool WHP_DS_Data.Valve_State_1
WHP_DS_Data_Valve_State_2 Bool WHP_DS_Data.Valve_State_2
WHP_DS_Data_Visual_Lvl Real WHP_DS_Data.Visual_Lvl
GNRL_DATA_Accum_FR LInt GNRL_DATA.Accum_FR
GNRL_DATA_EMR_Stp Bool GNRL_DATA.EMR_Stp
GNRL_DATA_FLOW_RATE Real GNRL_DATA.FLOW_RATE
GNRL_DATA_NotifSC DWord GNRL_DATA."Notif SC"
GNRL_DATA_P_Asp Real GNRL_DATA.P_Asp
GNRL_DATA_P_out Real GNRL_DATA.P_out
GNRL_DATA_P_Spr Real GNRL_DATA.P_Spr
GNRL_DATA_Pumping_station_state Byte GNRL_DATA.Pumping_station_state
GNRL_DATA_Remote_ctrl Bool GNRL_DATA.Remote_ctrl
GNRL_DATA_RP_Count Int GNRL_DATA.RP_Count
GNRL_DATA_SP_FR_Remote Real GNRL_DATA.SP_FR_Remote

Chapter IV Design and Simulation
42
Slaves_Data_pump_1 Pump Slaves_Data.pump_1
Slaves_Data_pump_2 Pump Slaves_Data.pump_2
Slaves_Data_pump_3 Pump Slaves_Data.pump_3
Slaves_Data_pump_4 Pump Slaves_Data.pump_4
Slaves_Data_pump_5 Pump Slaves_Data.pump_5
Valves_State_CR11_State Byte Valves_State.CR11.State
Valves_State_MAV_State Byte Valves_State.MAV.State
Valves_State_MSV_State Byte Valves_State.MSV.State
Valves_State_PC_BPV_State Byte Valves_State.PC_BPV.State
Valves_State_PC_DSV1_State Byte Valves_State.PC_USV1.State
Valves_State_PC_DSV2_State Byte Valves_State.PC_DSV2.State
Valves_State_PC_PCV1_POS Valve_PC Valves_State.PC_PCV1
Valves_State_PC_PCV2_POS Valve_PC Valves_State.PC_PCV2
Valves_State_PC_USV1_State Byte Valves_State.PC_USV1.State
Valves_State_PC_USV2_State Byte Valves_State.PC_USV2.State
Sreen number Int Internal tag

Chapter IV Design and Simulation
43
IV.4 Simulation
IV.4.1 Simulation values
Table IV-12 list values used during the simulation.
Table IV-12 Simulation values
Pump 1
State Stopped
Suction valve Opened
Discharge valve Opened
Pump 2
State Running
Suction valve Opened
Discharge valve Opened
Speed 935 tr
Motor current 490 A
Pump 3
State Running
Suction valve Opened
Discharge valve Opened
Speed 935 tr
Motor current 486 A
Pump 4
State Fault
Suction valve Closed
Discharge valve Closed

Chapter IV Design and Simulation
44
Table IV-12 (Continued)
Pump 5
State Running
Suction valve Opened
Discharge valve Opened
Speed 935 tr
Motor current 488 A
Flow rate
Instant 10,625 m3/h
Accumulated 1,125,620 m3
Pressure
Main suction pressure 6.31 bar
Main discharge pressure 12.09 bar
Downstream pressure 11.97 bar
Valves
Main suction Opened
Main Discharge Opened
Pressure control position 1 & 2 100
By-pass Opened
CR11 Opened
WHP surge tanks valves Opened

Chapter IV Design and Simulation
45
IV.4.2 Simulation results
Through the main screen, the operator can monitor the overall pumping station health, and
interact when necessary. As shown in figure IV-9, the elements that constitute the station are well
presented in a friendly user interface including the required information and functionalities.
The simulation scenario represents a normal operation condition, yet the pump number four is in fault
state, an alarm is triggered which the operator has to acknowledge.
Figure IV-5 Main screen simulation results

46
Figure IV-7 Alarm screen simulation results
Figure IV-6 Trend screen simulation results

47
Chapter V
General Conclusion

Chapter V General Conclusion
48
Remote management is a discipline which mainly depends on automation, electronics, IT and
telecommunications. It makes it possible to ensure the proper functioning of geographically distributed
industrial installations by its security, its surveillance, remote control and command.
In water management systems, the requirements for a uniform operator control and monitoring concept are
high in order to guarantee high operating conditions. Moreover, it is important for the maintenance of plants
which can reduce time during failures, maintenance works, or a plant expansion.
The SCADA system implemented allows the operator not only to monitor the flow rate and pressure
measurements, but also to have precise records of production states and cost that may be accessible
from anywhere. The managers may access this data that can be studied, compared in more efficient,
digital manner allowing them to have the most accurate knowledge from which to draw conclusions,
and hopefully lead them to quicker results and faster action.
The work carried out in this thesis presents a SCADA system for the monitoring and control of
Hassi Ben Okba pumping station used in the water distribution system of Oran city. It shows an
increase in system efficiency and reduced communication cost.
The development and simulation software used is highly reliable and significantly reduces
engineering time and effort.

49
References
1. Presentation of SEOR. SEOR official web site. [Online] https://www.seor.dz/presentation/. 2. Technical Documentation. SEOR, 2020.
3. Supervision and Monitoring Of Production Systems. M. Combacau, P. Berruet, E. Zamai, P. Charbonnaud, A. KhatabS. Grenoble, France : IFAC Management and Control of Production and Logistics, 2000.
4. Difference Between Monitoring, Remote Management and Supervision. CAREL INDUSTRIES . [Online] https://www.carel.nz/what-is-the-difference-between-monitoring-remote-management-and-supervision-.
5. Sara, Ikediche. Master thesis 'Etude et planification d’un système de supervision'. Université Djilali Bounaama Khemis Miliana. 2017/2018.
6. What is SCADA. inductive automation. [Online] September 12, 2018. https://inductiveautomation.com/resources/article/what-is-scada.
7. SCADA System: What is it? (Supervisory Control and Data Acquisition). electrical4u. [Online] March 4, 2020. https://www.electrical4u.com/scada-system/.
8. Features of SCADA. Inst Tools. [Online] https://instrumentationtools.com/features-of-scada/.
9. Where is SCADA Used. DPS Solutions. [Online] https://www.dpstele.com/scada/where-is-used.php.
10. SCADA System – Components, Hardware & Software Architecture, Types. Electrical Funda Blog. [Online] https://electricalfundablog.com/scada-system-components-architecture.
11. SCADA Communication and Protocols. Inst Tools. [Online] https://instrumentationtools.com/scada-communication-and-protocols/.
12. SCADA Communication & Protocols. J.Jayasamraj.
13. OPC Background and evolution. NOVOTEK. [Online] https://www.novotek.com/uk/solutions/kepware-communication-platform/opc-and-opc-ua-explained/.
14. OPC Data Access. Wikipidia. [Online] https://en.wikipedia.org/wiki/OPC_Data_Access.
15. OPC XML-DA. LOYTEC. [Online] https://www.loytec.com/products/functions/opc-xml-da.
16. OPC Data eXchange. matrikon. [Online] https://www.matrikonopc.com/downloads/143/specifications/index.aspx.
17. Communication with eWON Industrial Routers. promotic. [Online] https://www.promotic.eu/en/pmdoc/Subsystems/Comm/PLC/eWON.htm.
18. QuickOPC for OPC XML-DA. OPC Labs. [Online] https://www.opclabs.com/products/quickopc/opc-specifications/opc-xml-da.