analysis and application of soft reduction amount …train.esfahansteel.com/attachments/124_analysis...
TRANSCRIPT

© 2014 ISIJ 504
ISIJ International, Vol. 54 (2014), No. 3, pp. 504–510
Analysis and Application of Soft Reduction Amount for Bloom Continuous Casting Process
Cheng JI,* Sen LUO and Miaoyong ZHU
School of Materials and Metallurgy, Northeastern University, 3-11, Wenhua Road, Shenyang, Liaoning, 110819 China.
(Received on November 24, 2013; accepted on January 7, 2014)
Based on the principle of solidification shrinkage compensation, a soft reduction amount calculationmethod was derived for bloom continuous casting process, and the bearing steel GCr15 was chosen asspecific research steel to describe calculation process in detail. A two-dimensional heat transfer modelwas built to predict the solidification process of bloom, and the material properties of GCr15 were derivedby weighted averaging of the phase fractions. The predicted temperature and shell thickness were verifiedby a thermal infrared camera and nail shooting results, respectively. The soft reduction amount of typicalhigh carbon alloy steel blooms were calculated and discussed. The plant results showed that after theapplication of soft reduction to the bloom, centerline segregation and “V” type segregation were improvedsignificantly. The carbon and sulfur ratios of the bloom centerline were reduced from 1.39 to 1.09 and2.14 to 1.29, respectively.
KEY WORDS: bloom continuous casting; soft reduction; reduction amount; solidification shrinkage; highcarbon alloy steel; macro-segregation.
1. Introduction
Soft Reduction (SR) technology has proved to be aneffective method to reduce slab and bloom centerline segre-gation and porosity in many industrial practices.1–10) Theprinciple of SR is to impose a reasonable reduction rate/amount on the solidification end of the strand for compen-sating liquid core shrinkage and preventing the solute-enriched liquid flowing toward the center of the strand withoutcreating internal cracks.1,2,4) In bloom SR process, the reduc-tion is usually executed by 6–10 withdrawal units which arearranged in the air cooling zone with intervals of 1.0–3.5 m.Therefore the reduction interface is discontinuous, and theSR amount is generally selected as the primary controlparameter during the bloom SR process.
Since Miyazawa and Schwerdtfeger simulated the macro-segregation caused by bulging on slab continuous castingprocess in 1981,11) some researchers studied the flow fluidand macro-segregation induced by deformation of the solidskeleton in mushy zone.12–16) Recently, Menghuai Wu and etal.15,16) developed a two-phase columnar solidification mod-el to describe the effect of shell deformation, melt flow, den-drite growth on the macro-segregation behavior, andrevealed more detailed mechanism and principles of SR.However, due to the complicated coupled macro and micro
factors and variable industrial process, it is still difficult toprecisely quantify the SR amount, and more studies werecarried out with industrial trial method. At the same time,because of the different trial conditions, the empirical SRamount was significantly different, for example the 7.5±1.5mm for bloom thickness of 350 mm,2) 1.54–6.41 mm forbloom thickness of 380 mm,6) and 20–30 mm for bloomthickness of 400 mm.9) Therefore, it is difficult to form com-mon criteria from these industrial trail results only.
In this paper, based on the solidification shrinkage com-pensation principle, a calculation method for SR amount isderived, and bearing steel GCr15 was chosen as specificresearch steel to illustrate calculation process in detail. Aheat transfer model was developed to predict the bloom tem-perature distribution based on the specific parameters ofbloom continuous casting machine. In order to improve theaccuracy of the calculation results, the material properties ofGCr15 were derived by weighted averaging of the phasefractions, and the predicted temperature and shell thicknesswere verified by thermal infrared camera and nail shootingresults, respectively. According to the temperature distribu-tion and shell deformation of GCr15 bloom, the SR amountsunder different casting speeds were calculated. The SRamount of two other typical high carbon alloy steel, 82B and72A, were presented and applied to industrial practice aswell. Finally, the plant results without and with SR werecompared and discussed.
2. SR Amount Calculation Model
Figure 1 shows the schematic of the bloom SR process,
This article is one which was originally scheduled for publication in thespecial issue (Vol. 54, No. 2) on “Cutting Edge of Computer Simulation ofSolidification, Casting and Refining” and instead was specially published inthis regular issue.* Corresponding author: E-mail: [email protected]: http://dx.doi.org/10.2355/isijinternational.54.504

ISIJ International, Vol. 54 (2014), No. 3
505 © 2014 ISIJ
and the temperature distribution of transverse section on SRstart point, SR point under Unit 3 and SR end point corre-spond to the Figs. 2(a) to 2(c), respectively. It is obvious thatthe liquid core shrinks continuously due to the temperaturedecrease along the casting direction.
The mass flow rate of strand transverse section along thecasting direction at strand point zi could be calculated as:
.................. (1)
Where x, y and z are width, thickness, and length of thebloom, respectively, and ρ (x, y, z) is steel density functionwhich is related to temperature.
In ideal conditions, the liquid core shrinkage, as shown inFig. 2, would be supplied by free flowing liquid steel, anddM/dz is constant for the whole strand due to the mass con-servation along the casting direction. However, according tothe research by Takahashi et al.,17) the dendrites begin toform network and block liquid flow when the solid fraction,fs, becomes equal to 0.31, and the liquid steel could not besupplied deep into the mushy zone completely. In the non-free flowing zone, the mass difference between the i th andi-1th SR points can be calculated as follow:
................... (2)
Where, ΔLi is the length between the i th and i-1th strandpoints, m. The volume of required liquid steel, which isassumed to be supplied for the mass difference between thei th and i-1th strand points, could be calculated as:
................................ (3)
Where, ρ l is steel density at liquidus temperature, kg/m3.On the other hand, because the ΔVi is caused by solidifica-tion shrinkage between the i th and i-1th strand points, it alsocould be calculated as:
............................. (4)
Where, ΔAi is the shrinkage area between the i th and i-1th
strand points, m2.In order to reduce centerline segregation and porosity of
strand, the liquid core should be compensated with ΔAi asshown in Fig. 3. Combining the Eqs. (2)–(4), ΔAi could bederived by the following equation:
...... (5)
The deformation behavior as shown in Fig. 3 is anotherimportant factor which influences the SR effect, becausemost of SR amount is consumed on the bloom deformationprocess.15,18,19) The SR efficiency η i is defined to characterizethe relationship between SR amount on the strand surface andthe required SR amount of the shrinkage volume.18,20)
According to the authors’ previous work,19,21) the SR effi-ciency η i could be expressed as:
.................................. (6)
Where, the ΔSi is the surface shrinkage area on i th strandpoint shown in Fig. 3, m2, and it could be calculated as:
............................... (7)
Where, Ri is the surface SR amount in i th SR point shownin Fig. 3, m; Xi is the bloom width in i th strand point shownin Fig. 3, m.
Combining the Eqs. (5)–(7), the Ri could be expressed as:
.... (8)
3. Heat Transfer Model Description
In the present work, a 4-strand arc bloom continuous cast-ing machine is chosen as specific research objective, and itsschematic is shown in Fig. 4. The SR is executed by with-drawal units, which are located between 16.187 m and24.649 m of the distance from the meniscus as shown in Fig.4, and the bloom section was 325 mm × 280 mm at roomtemperature. In order to obtain the shrinkage compensation
Fig. 1. The schematic of the bloom SR process.
Fig. 2. The temperature distributions on the bloom transverse sec-tion.
dM
dzx y z dxdyi
i
XY ii= ( )∫∫ ρ , ,00
Δ ΔMdM
dz
dM
dzLi
i ii= −⎛
⎝⎜
⎞⎠⎟ ⋅−1
ΔΔ
VM
ii
l
=ρ
Δ Δ ΔV A Li i i= ⋅
Fig. 3. Schematic of the shell deformation during SR process.
ΔA
dM
dz
dM
dz
x y z dxdy x y z dxdy
i
i i
l
i
XY
iii
=−
=( ) − ( )
−
−∫∫
1
00 10
ρ
ρ ρ, , , ,XXY
l
ii −− ∫∫ 11
0
ρ
ηii
i
A
S=
ΔΔ
ΔS R Xi i i= ⋅
RA
X
x y z dxdy x y z dxdy
ii
i i
i
XY
i
XYii ii
=⋅
=( ) − ( )∫∫ ∫ −
−
Δη
ρ ρ, , , ,00 100
1−−∫( )⋅ ⋅
1
ρ ηl i iX

© 2014 ISIJ 506
ISIJ International, Vol. 54 (2014), No. 3
of liquid core, ΔAi, a heat transfer model of quarter bloomtransverse section was developed to predict the temperaturedistribution of whole strand under steady casting conditions.Based on some simplified assumptions,22) a two-dimensionaltransient heat conduction equation was employed todescribe the heat transfer behavior as follow:
........... (9)
Where, T and t are temperature, °C and calculation time,s, respectively. ρ(T ), c(T ), and λ(T) are the density, kg/m3,specific heat, J/(kg·°C), and heat conductivity, W/(m·°C),respectively.
In the present work, a kind of bearing steel, GCr15, waschosen as specific research steel grade, and its main compo-
sition was 1.00 Wt Pct C, 0.25 Wt Pct Si, 0.30 Wt Pct Mn,0.01 Wt Pct P, 0.01 Wt Pct S, and 1.45 Wt Pct Cr.
3.1. Material PropertiesIn order to obtain more accurate material properties of
GCr15 between the solidus and liquidus temperatures range,a one-dimensional direct finite-difference model was devel-oped to calculate the evolution of phase fraction and the sol-ute redistribution on the basis of the assumption of Ueshimaet al.23) Furthermore, the MnS inclusion precipitation duringthe solidification process was considered for the accuracy ofthe calculation results, and the rates of diffusion into solidand liquid phases were determined by diffusion coefficientsand equilibrium distribution coefficients of the ele-ments.23,24) The specific parameters and calculation processare described in detail by the present authors’ previouswork.25)
Figure 5(a) shows the evolution of phase fraction, inter-dendritic solute segregation ratio during the solidificationprocess of GCr15 with cooling rate of 0.25°C/s. It can beseen that the γ phase generated directly from liquid steelwithout forming δ phase in the solidification process. Theelement segregation ratio increases gradually at the initialstage of solidification and then increase rapidly at the endof solidification.
Figures 5(b), 5(c), and 5(d) show the density, enthalpy,and conductivity of GCr15, respectively, which were calcu-lated by weighted phase fraction equations which aredescribed in detail by Li and Thomas.26)
3.2. Boundary ConditionsThe finite element method was adopted to calculate Eq.
(1), and the initial temperature of all nodes was set as theFig. 4. The schematic of the bloom continuous casting machine.
ρ λ λT c TT
t xT
T
x yT
T
y( ) ( ) ∂
∂= ∂
∂( ) ∂
∂⎛⎝⎜
⎞⎠⎟
+ ∂∂
( ) ∂∂
⎛
⎝⎜
⎞
⎠⎟
Fig. 5. Phase fraction, solute segregation and material properties of GCr15: (a) phase fraction and solute segregation, (b)density, (c) enthalpy, and (d) conductivity.

ISIJ International, Vol. 54 (2014), No. 3
507 © 2014 ISIJ
casting temperature, 1 479°C, which is the most commontemperature in the industrial practice. The heat flux at thesymmetrical sides of the model is assumed to be zero.
3.2.1. In the MoldA simplified boundary condition equation of the form
proposed by Savage and Pritchard was used to calculate theheat flux of the surface center along the casting direction.27)
.......................... (10)
where, qcenter is the heat flux on the bloom surface center,MW/m2; t is time in the mold, s; A and B are coefficientswhich depend on the mold cooling conditions. In the presentwork, A varied between 1.25–1.45 × 10⁶, and B variedbetween 5.5–6.5 × 10⁴.
The heat flux decreases along bloom transverse surfacefrom surface center to corner due to the shell shrinkage, andtherefore the heat flux of bloom surface, qmold, should be cal-culated as:
.............. (11)
Where, a1 and a2 are parameters according to differentheight in mold, for example a1=68.5 and a2=11.7 on thebloom wide surface at the mold exit; x is the position fromsurface center to corner, m.
3.2.2. In the Secondary Cooling ZonesThe equivalent convection coefficients are usually
applied to calculate heat transfer in secondary coolingzones. According to the experimental results of Nozaki etal.,22) the equivalent convection coefficient of cooling waterand radiation, hi
ec, is expressed by:
...... (12)
The right of the Eq. (12) is composed of three parts forcalculating heat extraction of spray water, radiation, androller contact.
In the first part, αi is a modified parameter of i th coolingzone; Tw is cooling water temperature, °C; Wi(x) is the waterflux distribution in i th cooling zone, l/(m2·min), where x is thedistance from bloom surface center to corner, and Wi(x) wasmeasured by the nozzle characteristics of the testing stand.28)
In the second part, σ is Stefan-Boltzmann constant,5.67 × 10–8 W/(m2·K4); ε is steel emissivity; Tsurf and Tamb arethe surface temperature of the strand and the ambient tem-perature, respectively, K.
In the third part, hci is the heat transfer coefficient
between rollers and bloom in i th cooling zone, W/(m2·K); NRi
is the roller number of i th cooling zone; R iL is the contact
length between rollers and bloom in i th cooling zone, m; Z iL
is the total length of the i th cooling zone, m. According tothe previous research,29,30) hc
i is set as 0.3–3.6 kW(m2· K),and R i
L is equal to 0.02 m.
3.2.3. In the Air Cooling ZonesIn the air cooling zones, the equivalent heat transfer coef-
ficient h iair is composed by radiation and rollers contact, and
it is calculated as follows:
... (13)
3.3. Model ValidationThe model was verified by plant measured surface tem-
perature and shell thickness. The surface temperature wasmeasured by a thermal infrared camera (A40, FLIR), andthe shell thickness was measured by nail shooting method.Figure 6 shows the comparison between the predicted andthe measured results when the casting speed is 0.8 m/min.The relative error between the predicted and the measuredtemperature is less than ±0.84%, while the relative errorbetween the predicated shell thickness and nail shootingresults is less than 1.86%.
4. SR Amount Calculation and Application Results
4.1. SR Amount CalculationThe SR should act on the area where the liquid steel could
not flow freely. So based on the research of Takahashi17) theSR start point was chosen as fs=0.31 at strand centerline. Onthe other hand, the SR should be applied at the proper posi-tion to squeeze solute-enriched liquid out of the strand cen-ter, and so the SR end point was chosen as fs=0.92 at strandcenterline based on the present authors’ previous work.25)
Figure 7 compares the isolines of solid fraction 0.00,0.31, 0.92 and 1.00 in the bloom thickness direction withdifferent casting speed. It can be seen that the mushy zoneand SR zone are both prolonged and move towards the endof the strand with increase of the casting speed, because thetime for heat release decreases while the heat release speedin the air cooling zone remains almost unchanged. When thecasting speed increases every 0.05 m/min, the SR zone isprolonged by about 0.35 m, while the SR start point movestowards cast end with about 1.18 m.
The shrinkage area, ΔAi, between the SR point (fs=0.31–0.92) and SR start point (fs=0.31) could be calculated by Eq.(5) and the predicted temperature distribution. The calculat-ed results with different casting speeds are shown in Fig. 8.It can be seen that ΔAi increased almost linearly in the cast-ing direction with increasing distance from the SR startpoint. When the casting speed increases, the maximum ofΔAi (at the position of fs=0.92) also increases.
According to the present authors’ previous work,19) a
q A B tcenter = −
q q a x amold center= ⋅ − −( exp( ))1 1 2
h W x T
T T T T
eci
i i w
surf amb surf a
= ⋅ ⋅ −
+ ⋅ ⋅ + ⋅ +
α
σ ε
( ) ( . )
( ) (
.0 55
2
1 0 0075
mmbci
Ri
Li
Li
h N R
Z2 )+
⋅ ⋅
Fig. 6. Comparison between the predicted and measured surfacetemperature and shell thickness.
h T T T Th N R
Zeci
surf amb surf ambci
Ri
Li
Li
= ⋅ ⋅ + ⋅ + +⋅ ⋅
σ ε ( ) ( )2 2

© 2014 ISIJ 508
ISIJ International, Vol. 54 (2014), No. 3
three-dimensional thermal mechanical coupled model wasbuilt to describe the deformation behavior of continuouscasting bloom during SR process, and the relationshipbetween the SR efficiency and non-solidification ratio isshown in Fig. 9. It can be seen that the SR efficiencyincreases with the increase of non-solidification ratio whenthe SR amount is same. When the non-solidification issame, the SR efficiency increases rapidly with the increaseof SR amount at the beginning, then decrease slowly, andfinally tended to relative stability.
Based on the predicted results of temperature distribution,the non-solidification ratio of bloom transverse section withdifferent casting speed was calculated and is shown in Fig.10. It can be seen that the non-solidification ratio decreasesalmost linearly along with strand position.
According to above mentioned calculation results of ΔAi,the SR efficiency and the non-solidification ratio, the SRamount of the GCr15 strand surface were calculated fromEq. (8), and the results are listed in Table 1.
Table 1 shows that the total SR amount of 280 mm × 325mm section GCr15 bloom is 7.3–9.68 mm depending on thecasting speeds, while the SR amount of single withdrawalunit is 1.06–5.22 mm. The SR amount of units is decided byboth the shrinkage area and the deformation behavior. Withincreasing casting speed, more withdrawal units participatein SR process due to the prolonged mushy zone, but the totalSR amount decreases due to less shell deformation needed.
Besides of GCr15, the calculation method also had been
Fig. 7. The isolines of different solid fractions on bloom thicknessdirection with different casting speed.
Fig. 8. The shrinkage area between SR point and SR start pointwith different casting speed.
Fig. 9. The SR efficiency with different SR amounts and non-solidification ratios.
Fig. 10. The non-solidification ratio of bloom transverse sectionwith different casting speed.
Table 1. The calculation results of SR amount with typical castingspeeds.
Steelgrade
Casting speed(m/min)
SR amount of withdrawal units (mm)
Unit 1 Unit 2 Unit 3 Unit4 Unit 5 Unit 6 Total
GCr15
0.70 1.06 3.40 5.22 9.68
0.75 1.42 3.08 4.08 8.58
0.80 2.12 2.69 3.41 8.22
0.85 1.79 2.43 3.08 7.30
82B
0.75 2.64 4.36 7.00
0.80 3.13 3.71 6.84
0.85 0.53 2.68 3.32 6.53
0.90 0.69 2.46 3.03 6.18
72A
0.75 1.91 4.94 6.85
0.80 2.32 4.24 6.56
0.85 2.62 3.80 6.42
0.90 2.78 3.50 6.28

ISIJ International, Vol. 54 (2014), No. 3
509 © 2014 ISIJ
used to calculate SR amount of other high carbon alloyblooms, 72A (tire cord steel) and 82B (prestressed strandsteel), which main composition are listed in Table 2, andtheir calculation results of SR amount are listed in Table 1as well. With the typical casting speed of 0.75–0.90 m/min,the total SR amount of 280 mm × 325 mm section 82B and72A blooms are 6.18–7.00 mm and 6.28–6.85 mm, respec-tively. The 82B and 72A blooms need less SR amount thanthat of GCr15 to compensate solidification shrinkage fortheir lower carbon and alloy content.
4.2. Application ResultsThe SR amounts listed in Table 1 were applied to the
above mentioned bloom continuous casting machine. Withthe similar casting conditions listed in Table 3, the macro-graphs of the blooms longitudinal and transverse sectionbefore and after the SR application were compared in Figs.11 and 12.
The left column of Fig. 11 is the macrographs of theblooms longitudinal section without SR, and it is clear thatthe centerline segregation and “V” type segregation aremore and more serious with the increase of carbon and alloycontent. As shown in the right column of Fig. 11, the bloomscenter quality improved significantly after the SR applica-tion. There are some internal cracks which are perpendicularto the blooms centerline on the 1/4 location of bloom heightafter the SR application, and these cracks may be caused bythe amplified straightening stress, when the SR was execut-ed by units 1 to 3 which have straightening function besidesof withdrawal. Additionally, Fig. 12 shows the huge centerporosity with radius greater than 8 mm in the transverse sec-tion of GCr15 bloom was eliminated while the macrostruc-ture of whole section became homogeneous after the SRapplication.
The carbon and sulfur segregation ratios on the GCr15bloom centerline were measured quantitatively by the chem-ical analysis of drillings. The sampling positions are shownin Fig. 13.
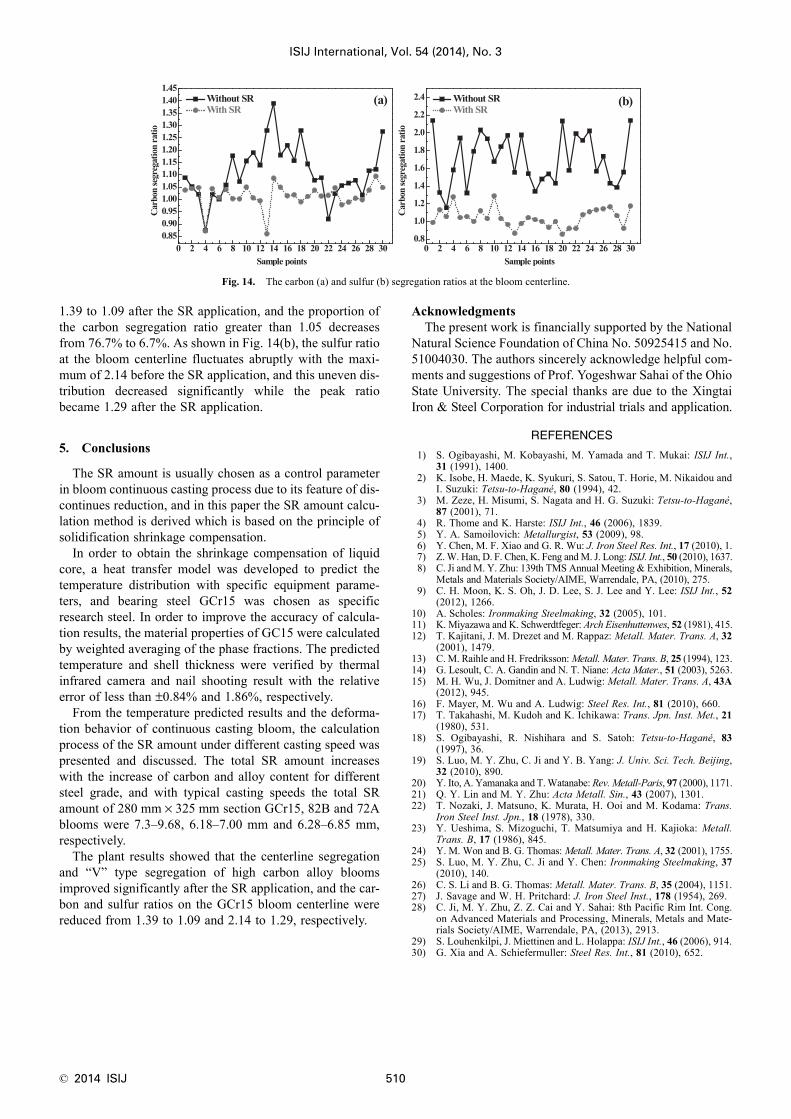
Figures 14(a) and 14(b) show the carbon and sulfur seg-regation ratios at the GCr15 bloom centerline, respectively.It is clear that the sulfur segregation is more serious com-pared to the carbon segregation. Figure 14(a) shows that themaximum of the carbon segregation ratio decreased from
Table 2. The Ts, Tl and main composition of steel (in mass%).
Steel grade Ts (°C) Tl (°C) C Si Mn P S Cr
GCr15 1 292.7 1 453.9 1.00 0.25 0.30 0.010 0.010 1.45
82B 1 317.3 1 464.5 0.83 0.23 0.80 0.008 0.015 0.28
72A 1 333.6 1 476.8 0.70 0.19 0.50 0.010 0.008 0.02
Fig. 11. Macrographs of longitudinal bloom section without SR:(a), (c) and (e); and with SR: (b), (d) and (f).
Fig. 12. Macrographs of transverse bloom section with (a) andwithout (b) SR for GCr15.
Fig. 13. Schematic illustration of sampling method.
Table 3. Parameters of the casting conditions.
Steelgrade
Castingspeed
(m/min)
Castingtemperature
(°C)
Water flowrate of secondary cooling zones (l/min)
Zone 1 Zone 2 Zone 3 Zone 4 Zone 5
I/O L/R I/O L/R I O L/R I O L/R I O L/R
GCr15 0.75 1 476–1 480 23.9 23.9 18.1 15.6 5.9 6.5 10.2 3.3 4.0 5.7 2.1 2.7 3.6
82B 0.80 1 480–1 488 26.3 23.9 29.0 25.0 9.6 10.5 16.5 5.4 6.4 9.2 3.4 4.4 5.9
72A 0.75 1 490–1 496 25.1 23.9 27.1 23.4 8.9 9.8 15.3 5.0 5.9 8.5 3.1 4.0 5.4
© 2014 ISIJ 510
ISIJ International, Vol. 54 (2014), No. 3
1.39 to 1.09 after the SR application, and the proportion ofthe carbon segregation ratio greater than 1.05 decreasesfrom 76.7% to 6.7%. As shown in Fig. 14(b), the sulfur ratioat the bloom centerline fluctuates abruptly with the maxi-mum of 2.14 before the SR application, and this uneven dis-tribution decreased significantly while the peak ratiobecame 1.29 after the SR application.
5. Conclusions
The SR amount is usually chosen as a control parameterin bloom continuous casting process due to its feature of dis-continues reduction, and in this paper the SR amount calcu-lation method is derived which is based on the principle ofsolidification shrinkage compensation.
In order to obtain the shrinkage compensation of liquidcore, a heat transfer model was developed to predict thetemperature distribution with specific equipment parame-ters, and bearing steel GCr15 was chosen as specificresearch steel. In order to improve the accuracy of calcula-tion results, the material properties of GC15 were calculatedby weighted averaging of the phase fractions. The predictedtemperature and shell thickness were verified by thermalinfrared camera and nail shooting result with the relativeerror of less than ±0.84% and 1.86%, respectively.
From the temperature predicted results and the deforma-tion behavior of continuous casting bloom, the calculationprocess of the SR amount under different casting speed waspresented and discussed. The total SR amount increaseswith the increase of carbon and alloy content for differentsteel grade, and with typical casting speeds the total SRamount of 280 mm × 325 mm section GCr15, 82B and 72Ablooms were 7.3–9.68, 6.18–7.00 mm and 6.28–6.85 mm,respectively.
The plant results showed that the centerline segregationand “V” type segregation of high carbon alloy bloomsimproved significantly after the SR application, and the car-bon and sulfur ratios on the GCr15 bloom centerline werereduced from 1.39 to 1.09 and 2.14 to 1.29, respectively.
AcknowledgmentsThe present work is financially supported by the National
Natural Science Foundation of China No. 50925415 and No.51004030. The authors sincerely acknowledge helpful com-ments and suggestions of Prof. Yogeshwar Sahai of the OhioState University. The special thanks are due to the XingtaiIron & Steel Corporation for industrial trials and application.
REFERENCES
1) S. Ogibayashi, M. Kobayashi, M. Yamada and T. Mukai: ISIJ Int.,31 (1991), 1400.
2) K. Isobe, H. Maede, K. Syukuri, S. Satou, T. Horie, M. Nikaidou andI. Suzuki: Tetsu-to-Hagané, 80 (1994), 42.
3) M. Zeze, H. Misumi, S. Nagata and H. G. Suzuki: Tetsu-to-Hagané,87 (2001), 71.
4) R. Thome and K. Harste: ISIJ Int., 46 (2006), 1839.5) Y. A. Samoilovich: Metallurgist, 53 (2009), 98.6) Y. Chen, M. F. Xiao and G. R. Wu: J. Iron Steel Res. Int., 17 (2010), 1.7) Z. W. Han, D. F. Chen, K. Feng and M. J. Long: ISIJ. Int., 50 (2010), 1637.8) C. Ji and M. Y. Zhu: 139th TMS Annual Meeting & Exhibition, Minerals,
Metals and Materials Society/AIME, Warrendale, PA, (2010), 275.9) C. H. Moon, K. S. Oh, J. D. Lee, S. J. Lee and Y. Lee: ISIJ Int., 52
(2012), 1266.10) A. Scholes: Ironmaking Steelmaking, 32 (2005), 101.11) K. Miyazawa and K. Schwerdtfeger: Arch Eisenhuttenwes, 52 (1981), 415.12) T. Kajitani, J. M. Drezet and M. Rappaz: Metall. Mater. Trans. A, 32
(2001), 1479.13) C. M. Raihle and H. Fredriksson: Metall. Mater. Trans. B, 25 (1994), 123.14) G. Lesoult, C. A. Gandin and N. T. Niane: Acta Mater., 51 (2003), 5263.15) M. H. Wu, J. Domitner and A. Ludwig: Metall. Mater. Trans. A, 43A
(2012), 945.16) F. Mayer, M. Wu and A. Ludwig: Steel Res. Int., 81 (2010), 660.17) T. Takahashi, M. Kudoh and K. Ichikawa: Trans. Jpn. Inst. Met., 21
(1980), 531.18) S. Ogibayashi, R. Nishihara and S. Satoh: Tetsu-to-Hagané, 83
(1997), 36.19) S. Luo, M. Y. Zhu, C. Ji and Y. B. Yang: J. Univ. Sci. Tech. Beijing,
32 (2010), 890.20) Y. Ito, A. Yamanaka and T. Watanabe: Rev. Metall-Paris, 97 (2000), 1171.21) Q. Y. Lin and M. Y. Zhu: Acta Metall. Sin., 43 (2007), 1301.22) T. Nozaki, J. Matsuno, K. Murata, H. Ooi and M. Kodama: Trans.
Iron Steel Inst. Jpn., 18 (1978), 330.23) Y. Ueshima, S. Mizoguchi, T. Matsumiya and H. Kajioka: Metall.
Trans. B, 17 (1986), 845.24) Y. M. Won and B. G. Thomas: Metall. Mater. Trans. A, 32 (2001), 1755.25) S. Luo, M. Y. Zhu, C. Ji and Y. Chen: Ironmaking Steelmaking, 37
(2010), 140.26) C. S. Li and B. G. Thomas: Metall. Mater. Trans. B, 35 (2004), 1151.27) J. Savage and W. H. Pritchard: J. Iron Steel Inst., 178 (1954), 269.28) C. Ji, M. Y. Zhu, Z. Z. Cai and Y. Sahai: 8th Pacific Rim Int. Cong.
on Advanced Materials and Processing, Minerals, Metals and Mate-rials Society/AIME, Warrendale, PA, (2013), 2913.
29) S. Louhenkilpi, J. Miettinen and L. Holappa: ISIJ Int., 46 (2006), 914.30) G. Xia and A. Schiefermuller: Steel Res. Int., 81 (2010), 652.
Fig. 14. The carbon (a) and sulfur (b) segregation ratios at the bloom centerline.