analog instruments 1 (for pdf) - virginia techdevenpor/aoe3054/manual/inst1/analog... · – the...
TRANSCRIPT

Analog Instruments
DC Power Supply, Multi-meter, Oscilloscope, Function Generator
and Frequency Counter.

Objectives
• Identify uses of lab equipment.• Be able to use cables and connect equipment.• Become familiar with using the basic analog
instruments for engineering.– DC Power Supply– Multi-Meter– Function Generator– Frequency Counter– Oscilloscope

DC Power Supply Objectives
• DC Power Supply– Produce positive, negative and multiple
voltages for test conditions.– Understand voltage control vs. current control

DC Power Supply
• Provides DC voltage source.• Tektronix CPS250 has one fixed 5 V and• Two variable 0-20 V outputs.

DC Power Supply• Several other industry standard voltages exist (just
considering DC sources).– 6V sealed lead acid Batteries.– 12V is common in cars and small airplanes.– 24V for newer light airplanes and industrial control
system voltage.– Other examples?
• More that 50 volts requires special safety consideration like personal protective equipment and special training.

Fixed 5V, Ground Referenced

Variable Output
• Analog meters indicate the voltage and current output of each variable supply (A or B individually). Use the switch to select the desired source to monitor.

Variable Output
• Variable outputs are controlled by the voltage and current knobs.
• Voltage is maintained until the current draw in the load reaches the set-point of the current control.
• The current control appears to do nothing until a load is present.

Variable Output, Ground Referenced

Multi-Meter Objectives
• Multi-Meter– Measure:
• Resistance• Voltage• Current

Multi-Meter
• Measures – Resistance– Voltage (AC and DC)– Current
• AC voltage is often called RMS.

Multi-meter Range settings• When measuring voltage, start with a range known
higher than the voltage to be measured and lower the scale until the best precision is obtained without going over range.
Start Here,
Then try lower.

Measuring resistance• Continuity Tests• To measure lead resistance, connect test leads together.• Resistance measurements must be out of circuit.• Google “resistor color codes” for calculators.
– http://www.dannyg.com/examples/res2/resistor.htm– http://samengstrom.com/elec/resistor/
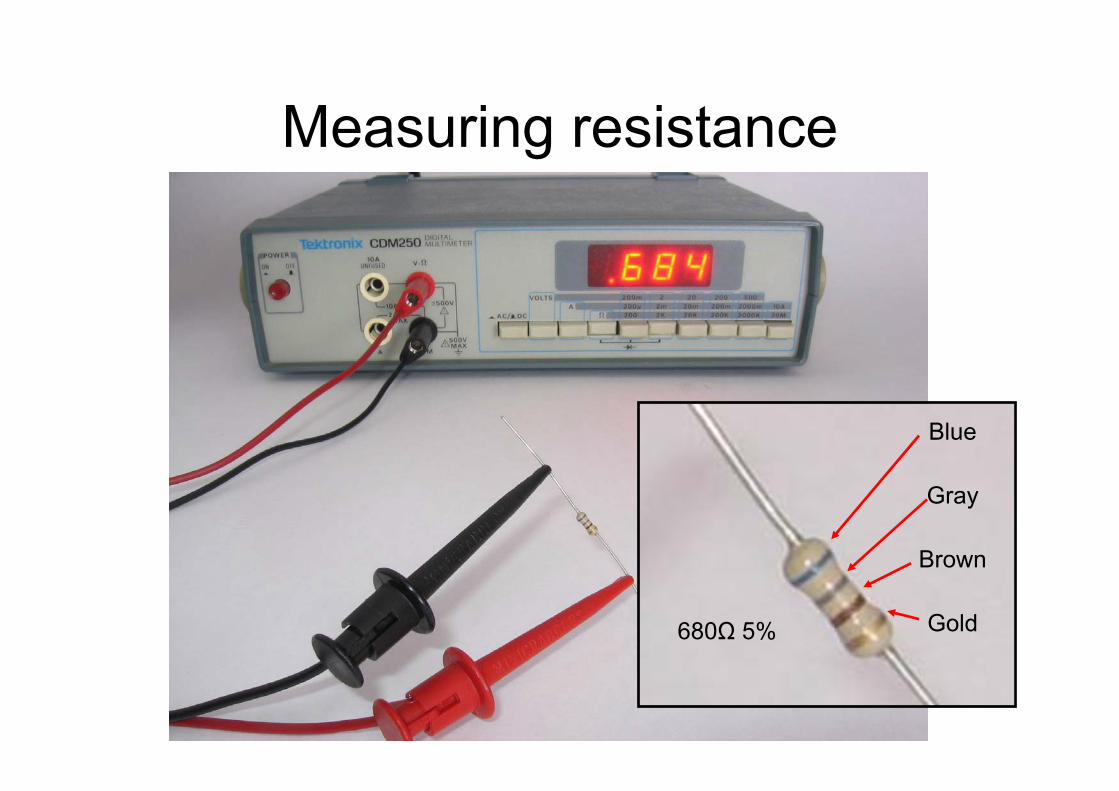
Measuring resistance
Blue
Gray
Brown
Gold680Ω 5%

Measuring resistance
• Notice the operation of the range switches.– The number for the switch is the maximum that
setting can display.– The multiplier is added to the result in the display.
Example: 20K setting with 8.20 in the display indicates an 8.2K Ohm or 8200 Ohm resistor.

DC Voltage Measurements• Now set up the
power supply to give 12V.
• Select a range higher than expected. Measuring a higher voltage on a low setting can damage a meter!

DC Voltage Measurements• Use the multi-meter
to measure the voltage.
• How do the multi-meter results compare to the indication of the power supply meters? Some can be pretty accurate and some off several volts. Which one is accurate?

DC Current Measurements• The setting on the meter for current is A, for Amps, the
standard unit for current.• Current measurements are possible, but not common.
Since all the current must pass through the measuring device, the meter or input device will influence the circuit more than making voltage measurements. An alternative would be to measure the voltage of a known resistance and calculate current.

DC Current Measurements• Most DAQ inputs are voltage only. Current input devices
are available but mainly for industrial control applications.
• Don’t try to measure current unless you have calculated the approximate current at the point of measurement.
• Calculate the power requirement of the component in the circuit to ensure it is suitable for the test procedure.

DC Current Measurements

Power Supply Modes• Connect power supplies A and B in parallel using the
cables, then do the same using the mode switch.• Try the same for series. Set up a 30 Volt source using
the multi-meter to measure the voltage. • Understand the connection of the independent power
supplies before using the mode switch.

Negative DC Voltage

Multiple voltages• Often signal amplifiers require +15 and -15 volt sources.• Do this by connecting two variable supplies together and
referencing the center to ground.• Voltage measurements are usually made relative to
ground. • Connect the common (black) lead of the meter to ground
and measure the other two voltages.

Multiple voltages, +/- 15

Oscilloscope for DC Objectives
• Oscilloscope– Hook up and obtain a visual representation of
a signal.– Measure DC Voltages– Use scaling properly

Oscilloscope
• Tektronix 2205 has features common to most all scopes.• The two most important controls are amplitude
corresponding to the Y value and,• Time base which corresponds to the X value.
X
YOne Division=
1cm
Position Controls

Oscilloscope• Once the scope is on and some part of the trace is visible, adjust the
amplitude and position until the trace is in the screen, then adjust the time base to get the best representation of the signal.
• For DC measurement, time base is irrelative, so set it to 1 or 2mSec/div.
• Then adjust the amplitude so the measured signal will fit on thescreen.
• Basic Setup– Locate the trace using the position control, the amplitude and the
time base. Beam find may be helpful here also. – The mode should be in auto most of the time. Once the scope is
set up, other modes may be useful.• The trace plots the voltage like an X-Y plot with time on the X
position. The division lines do not indicate the origin of the plot. The origin is adjustable using the position controls.
• The divisions and corresponding settings determine the values ofthe plotted signal.

Set up the Scope• Vertical
– Switches to CH1, NORM, ALT or CHOP.– VOLTS/DIV to 2– Cal fully clockwise to detent.– Coupling to DC.
• Settings:– Trigger
• Slope in upper setting• Level slightly left of center• Mode switch to P-P Auto
– Horizontal• MAG to x1.• SECS/DIV to 5ms/div• Cal fully clockwise to detent.
• Settings:– Intensity and focus as required.– Position trace using Horizontal and Vertical Position controls.

Connect Signals (6.2)• Using a double banana
connector and BNC cable, connect power supply to the CH1 BNC input below the VOLTS/DIV control.
• For now do not use a ground reference jumper on the power supply.

Connect Signals (6.2)• Set supply to around 6
volts.• Be certain of the
connection using the double banana plug. The shield of the BNC cable will be connected to ground through the scope, so only connect it to the common point on the power supply, in this case, the negative terminal.

DC Scope Measurements
• Coupling switch– Use the GND position to find a reference zero.– Set to DC to measure the mean and fluctuating parts.
(Fluctuating part of the power supply should be extremely minimal.)

Vertical Scale (6.3)• With the coupling switch set to GND, the position control
sets the origin by moving the trace up and down on the screen. Set it on the center line of the graph.
• Place the coupling switch back to DC to read the voltage.
• The trace should move 3 div up the display.• With the VOLTS/DIV on 2.0, that would indicate 6 volts.• Now vary the voltage and watch the trace move.• We will use this technique to set up the dynamic Beam
experiment.

Provide power to Sensor• Using a BNC alligator clip cable, connect to the com and
-18 on the sensor box located in the Dynamic Beam Box. (Black to common.)
• On the other end, put a tee connector and a BNC to Banana adapter to connect to the multi-meter.
• From the tee connector go to the power supply with another BNC cable and BNC–Banana adapter.
• Connect the adapter so the ground tab is in the positive terminal.
• Disconnect the red clip from the box and check the voltage. When satisfied it is correct, Hook up the Red lead.

Provide power to Sensor
To Sensor
Note: GND in + terminal Power
Supply only!
GND in com terminal

Connect to Scope and Meter• Using a BNC tee, connect the output cable from the
sensor to the Scope, and then to the multi-meter once the power supply is set. (Disconnect the -18VDC power supply from the multi-meter.)
• Scope Settings:– 2 Volts/Div– DC Coupling– 2ms Horizontal Time Base
• Align the sensor by adjusting the scope to detect all positions of the sensor relative to the ferrous metal piece attached to the beam.

Aligning the probe
Adjusting Knob
Steel Target
5 mm Gap

Connect Output• Connect the output wire to the scope, then to the meter
after disconnecting from the -18VDC Power Supply.

Function Generator Objectives
• Function Generator– Produce AC Signal voltages of desired
frequency and amplitude– Understand the difference between signal
voltage and a power supply.

Function Generator (4)
• Function buttons.• Range Buttons.• Frequency Control Knob.• Amplitude.• DC Offset.• Volts Out Button.

Signal Connection• Before turning on the function generator:
– Select sine wave.– Push the Duty knob in and sweep button out.– Push the DC Offset knob in.– Set up a 100Hz frequency.
• Select the 100Hz scale.• Adjust Frequency Control Knob to 1.0.
– Depress the 0-2 V peak-to-peak button.– Turn amplitude fully clockwise to set the output to the
max of the range. (When connected to the Dynamic Beam Experiment, set this knob fully counter-Clockwise to the minimum output!)

AC Multi-meter measurements• Multi-meter:
– Select AC.– Select 2 Volt Scale.
• Turn on the function generator.• What is the reading? Why is it not 2?• Try different waveforms.• Try 500Hz sine wave and 1kHz sine wave.• Turn on the DC Offset and adjust fully +.• Measure AC and DC Values.

AC scope measurement Objectives
• Oscilloscope – Unsteady Measurements– Hook up and obtain a visual representation of
a signal.– Measure peak-peak and amplitude voltages– Measure period and frequency– Use dual input mode– Use X-Y Mode to determine phase

Visualizing the Signal
Time
Am
plitu
de
TimeAmplitude

Connect the Scope
• Using BNC Tee connectors, connect CH1 of the scope to the test circuit.

Scope settings (summary)• Settings:
– Vertical• Switches to CH1, NORM, ALT.• Both VOLTS/DIV to .5• Cal fully clockwise to detent.• Coupling to DC.
– Trigger• Slope in upper setting• Level slightly left of center• Mode switch to P-P Auto
– Horizontal• MAG to x1.• SECS/DIV to 5ms/div• Cal fully clockwise to detent.
– Intensity and focus as required.– Position trace using Horizontal and Vertical Position controls.

Scope Triggering• Slope indicates the direction the
waveform is progressing.

Scope Triggering• Slope indicates the direction the
waveform is progressing.

Scope Triggering• Triggering indicates the time and Y
position on the screen the horizontal begins to sweep.

Three Types of AC Voltage Measurements
• Peak-Peak (Vp-p)• Peak or Amplitude (V)• RMS (Vrms)
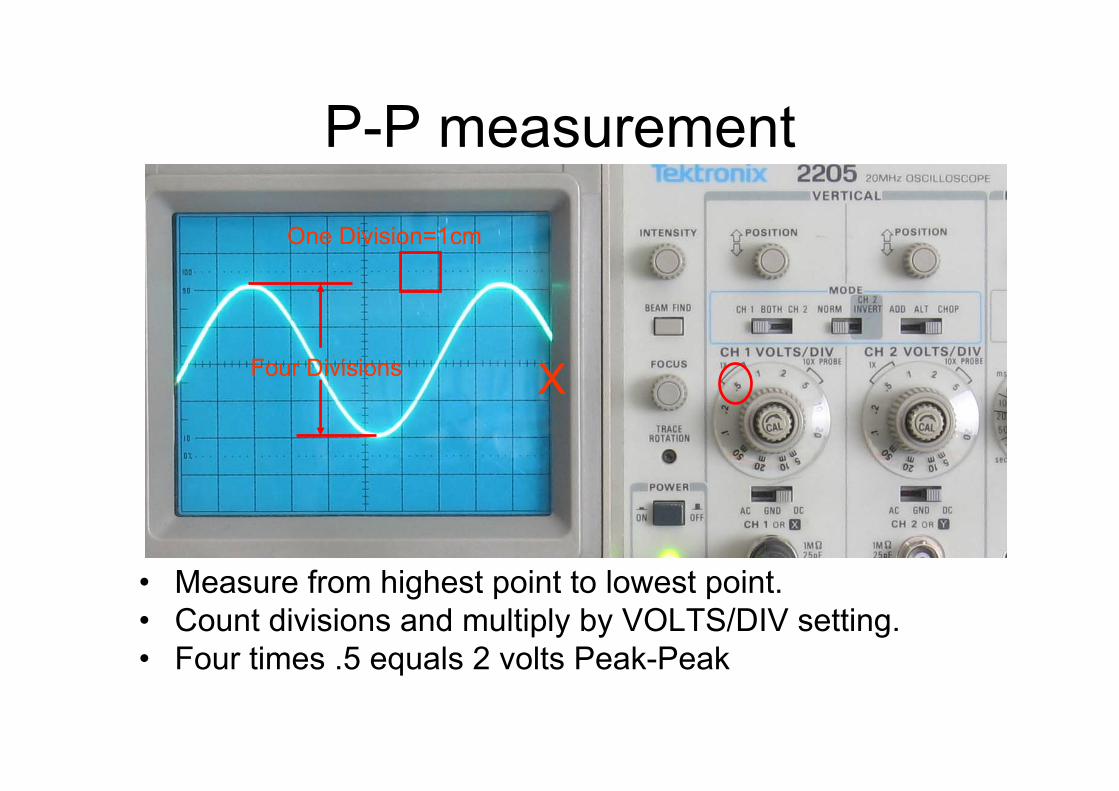
P-P measurement
• Measure from highest point to lowest point.• Count divisions and multiply by VOLTS/DIV setting.• Four times .5 equals 2 volts Peak-Peak
One Division=1cm
Four Divisions X
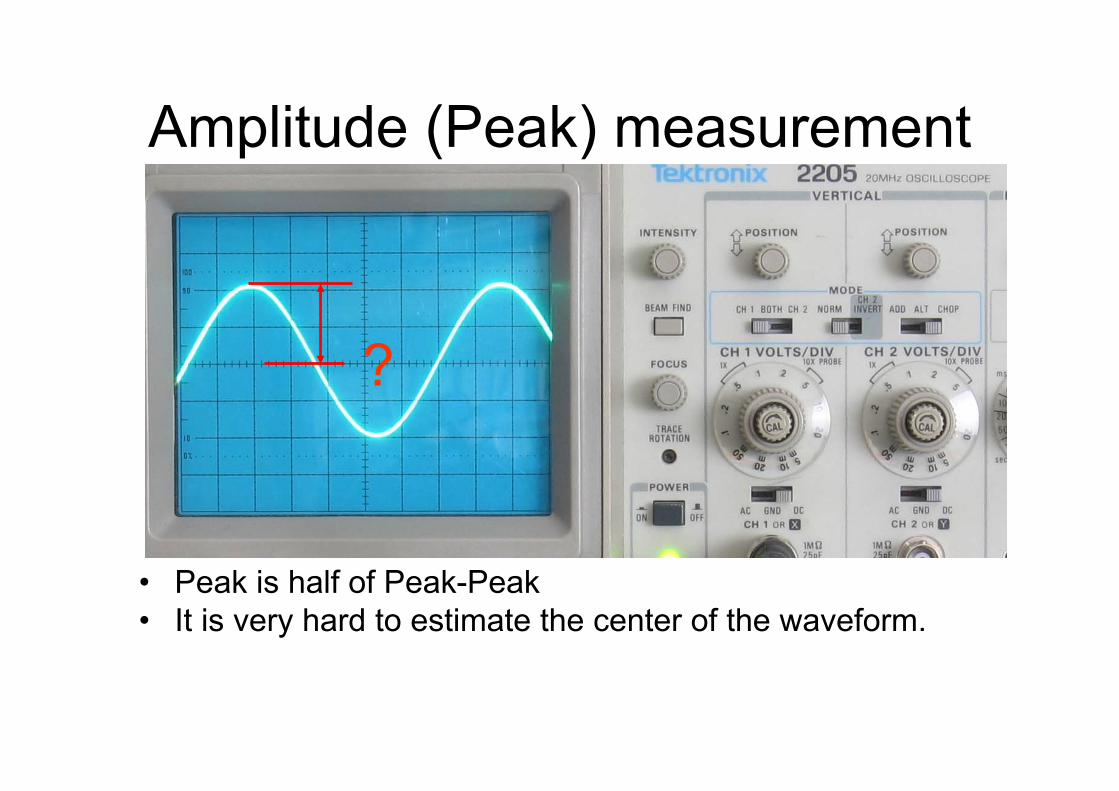
Amplitude (Peak) measurement
• Peak is half of Peak-Peak• It is very hard to estimate the center of the waveform.
?

Amplitude (Peak) measurement
• Measure from highest point to lowest point.• Count divisions and multiply by VOLTS/DIV setting then
divide by two.• Four times .5 / 2 equals 1 volts Peak Amplitude.
Four Divisions X
And divide by 2
Measure Peak-Peak,

RMS Measurement
• Use AC Volts mode of multi-meter.

Period and Frequency Measurement
• Measure from two similar points on the horizontal waveform. (Peaks or crossings)
• Count divisions and multiply by time-base (SEC/DIV) for period. (6.8 x 10ms = .068 sec period)
• Invert period for frequency. (14.7 Hz)
6.8 divisions

Frequency Counter Objectives
• Frequency Counter– Measure frequency– Understand the threshold and upper limits of
input

Frequency counter• Add the counter to the circuit using BNC Tee’s and
compare the previous findings. • The counter counts pulses or transitions of a signal.• If the signal is too small, it will not detect a countable
signal.• When using with the Dynamic Beam Experiment,
connect to the signal source, as opposed to the response, and the results will be more consistent since the amplitude of the generator output is fairly consistent.

Beckman Counter
• Set function to FREQ (this is default)• Press Gate (SEC) until desired time base is set.• A 10 Sec time base allows 1/10 Hz Frequency display.• This example is displaying 0.0142 kHz or 14.2 Hz.

Measuring Phase• X-Y Mode of the Oscilloscope will allow two signals to be
plotted against each other instead of one against time.• Two function generators can be used to generate two
separate signals.– A circular or line pattern indicates matched frequency.– Other shapes indicate common multiples of
frequencies.• Two signals that are of the same frequency, but shifted
by phase can be compared as in the Dynamic Beam Experiment or a filter test.