analizzatori introduzione chanstrpuccini.chimica.uniba.it/~losito/lezionichanstr/file pdf in...
TRANSCRIPT

Several types of mass analysers, the key components of mass spectrometers, are currently available in MS instrumentation.
A possible classification can be made according to operation mode:
continuous – a continuous flow of ions occurs through the device(magnetic sector, quadrupole)
pulsed mode – ions are transferred into the analyser only for short times, periodically (time of flight - TOF)
ion trapping mode – ions are trapped, through electromagneticfields, into a space region (quadrupole three-dimensional or linearion traps, ion cyclotron, Orbitrap)
Mass analysers

A further classification can be made according to the way ionseparation is performed:
scanning – a potential scan is required for ion separation in the space or time domain (magnetic sector, quadrupole and ion traps)
non scanning – no potential scan is needed (time of flight – TOF, ioncyclotron, Orbitrap)

Figures of merit for mass analysers
m/z range
Resolution / Mass Resolving Power
Mass Accuracy
Ion Transmission / Duty Cycle
Data acquisition rate
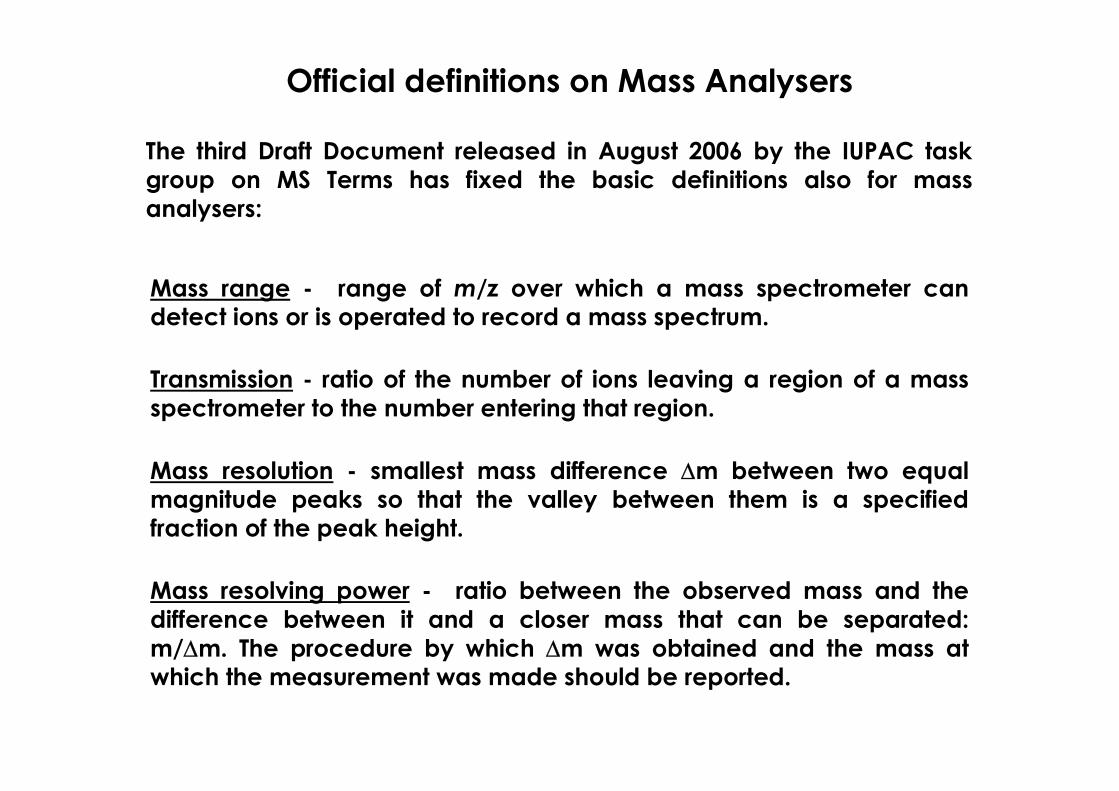
Mass range - range of m/z over which a mass spectrometer can detect ions or is operated to record a mass spectrum.
Transmission - ratio of the number of ions leaving a region of a mass spectrometer to the number entering that region.
Mass resolution - smallest mass difference m between two equalmagnitude peaks so that the valley between them is a specifiedfraction of the peak height.
Mass resolving power - ratio between the observed mass and the difference between it and a closer mass that can be separated: m/m. The procedure by which m was obtained and the mass at which the measurement was made should be reported.
Official definitions on Mass Analysers
The third Draft Document released in August 2006 by the IUPAC task group on MS Terms has fixed the basic definitions also for mass analysers:
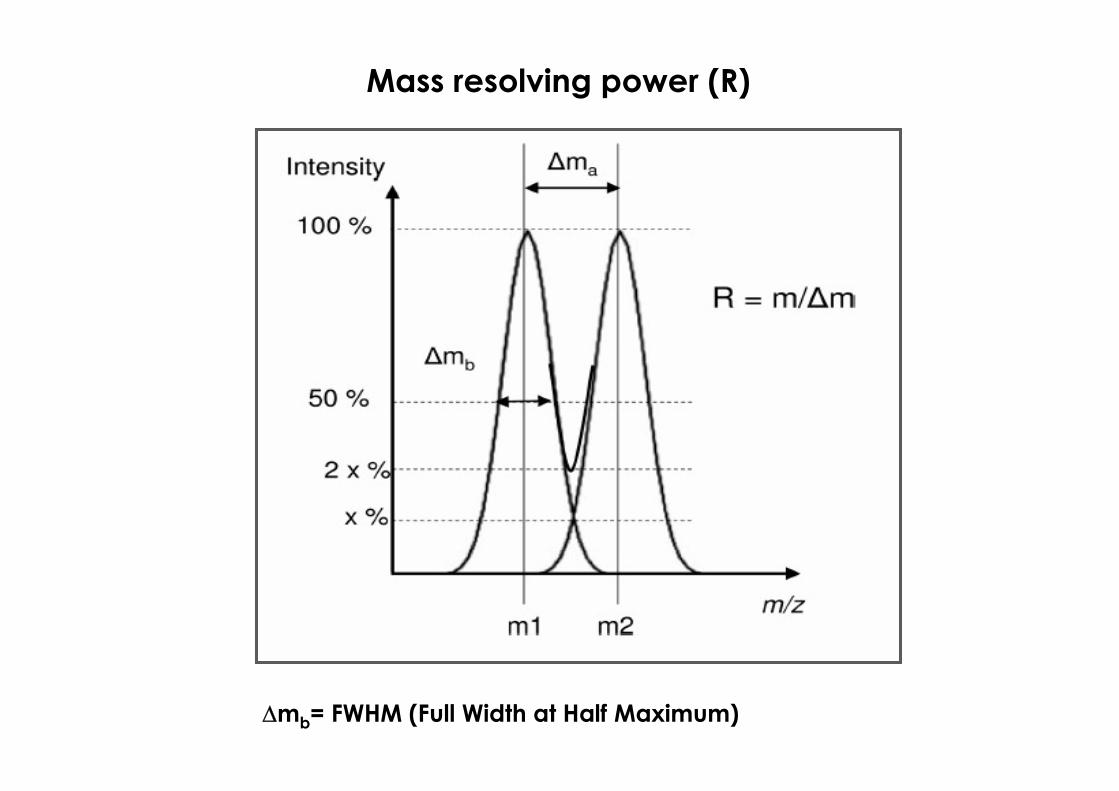
Mass resolving power (R)
mb= FWHM (Full Width at Half Maximum)

Resolution 0.5 u FWHM
Mass resolving power 1104 Mass resolving power 5520
Resolution 0.1 u FWHM
C27H30N5O6S
Effect of mass resolving power in a specific case
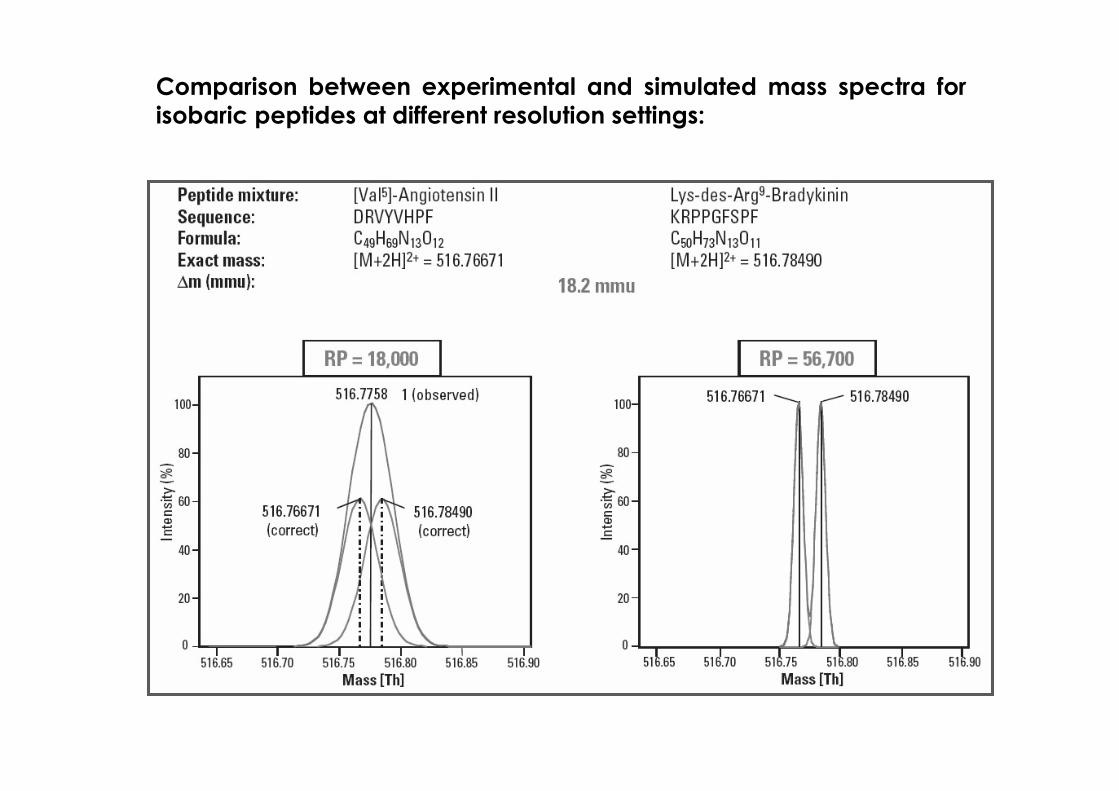
Comparison between experimental and simulated mass spectra forisobaric peptides at different resolution settings:

Tetra BDEs
Hepta-CBs
C12H679Br2O
C12H335Cl437Cl
323.8785
323.8647
RP = 23,500
M-2Br
M-2Cl
m=13.8 mmu
Interferences on Poly-Bromo-Diphenyl-Ethers (PBDE) determinations by GC-EI-MS
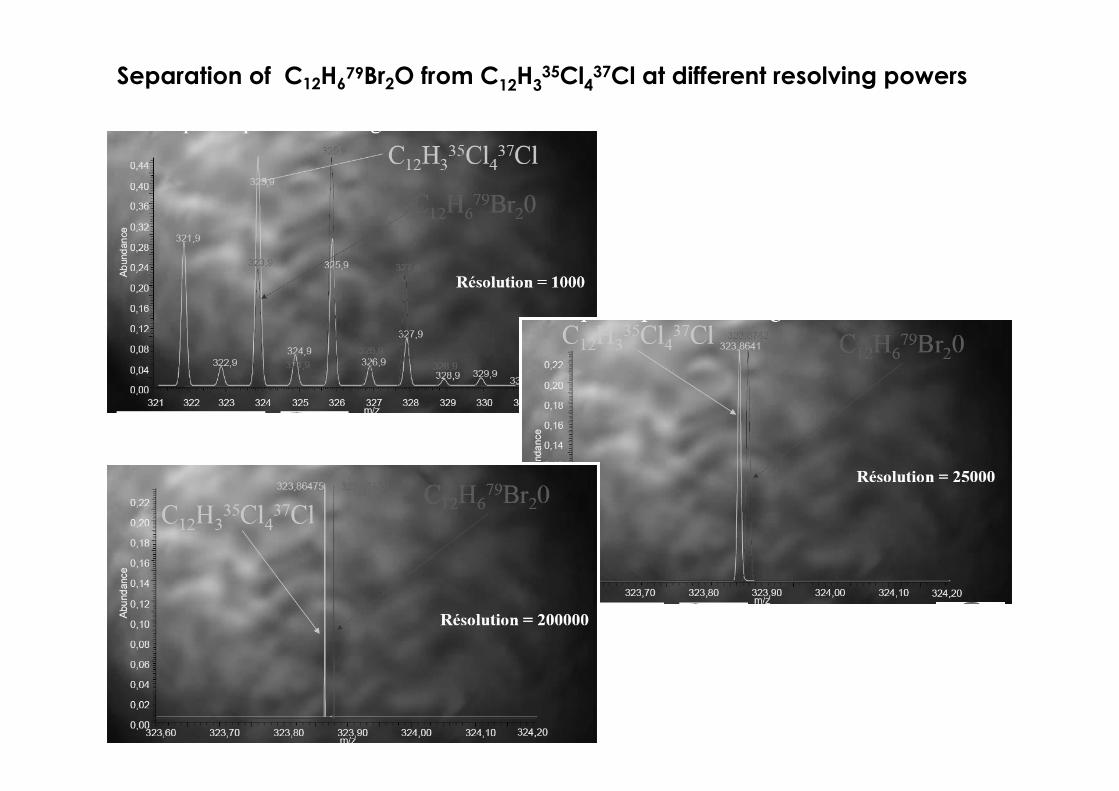
Separation of C12H679Br2O from C12H3
35Cl437Cl at different resolving powers
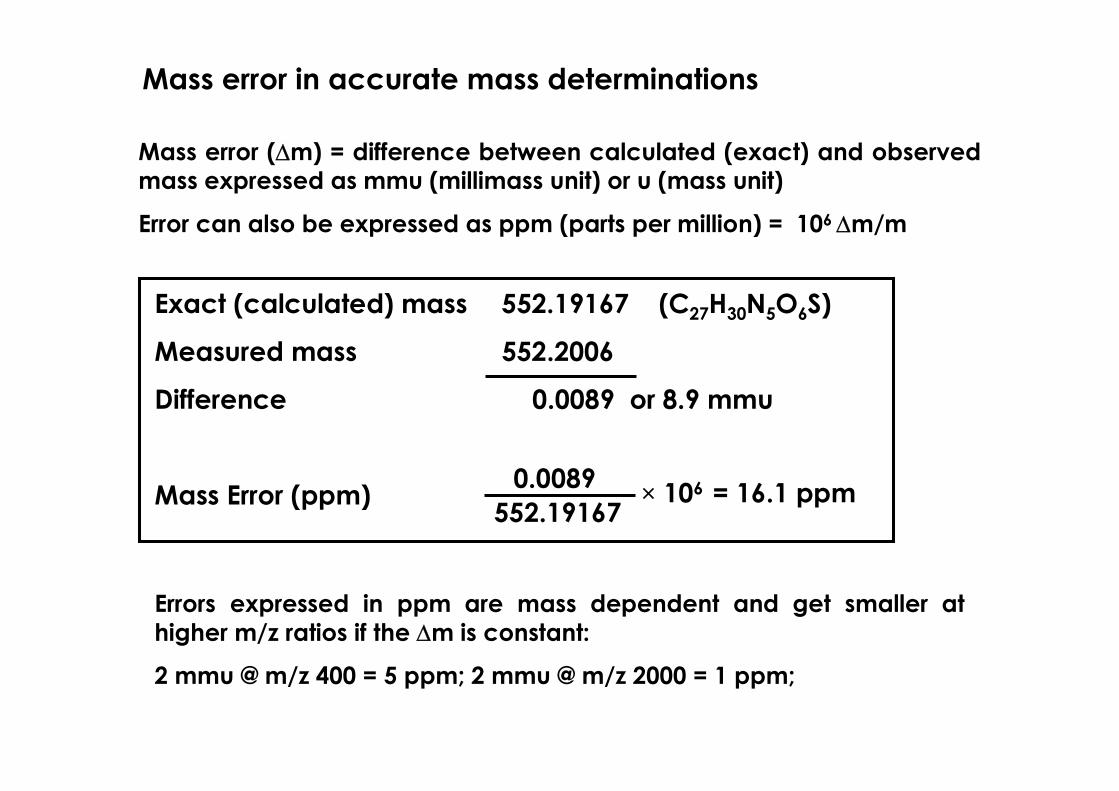
Exact (calculated) mass 552.19167 (C27H30N5O6S)
Measured mass 552.2006
Difference 0.0089 or 8.9 mmu
Mass Error (ppm)
Errors expressed in ppm are mass dependent and get smaller at higher m/z ratios if the m is constant:
2 mmu @ m/z 400 = 5 ppm; 2 mmu @ m/z 2000 = 1 ppm;
Mass error in accurate mass determinations
Mass error (m) = difference between calculated (exact) and observedmass expressed as mmu (millimass unit) or u (mass unit)
Error can also be expressed as ppm (parts per million) = 106 m/m
0.0089552.19167
× 106 = 16.1 ppm

Dedicated softwares are able to provide possible elemental compositionscorresponding to an accurate mass given as input:
Individuation of elemental composition from accurate mass determinations
A key constrain for the search is mass tolerance, i.e. the given mass error, related to the mass analyzer accuracy.
8.5 ppm8.5 ppm

1.7 ppm
The lower is the adopted tolerance the lower is the number of candidate elemental compositions:

The influence of mass error on the search output is more evident for high molecular weights, as apparent in the case of peptides with MW > 1000:
0 2 4 6 8 100
10
20
30
40
50
can
did
ate
seq
ue
nc
estolerance/ppm

The proportion of time (usually expressed as a percentage) in which a device or instrument is usefully operated is known as the duty cycle.
In the case of a mass analyser the duty cycle is the portion of time in which ions with a certain m/z ratio are effectively analyzed.
As an example, for a quadrupole mass spectrometer scanning fromm/z 50 to m/z 1050 the average dwell-time on each m/z channel in the spectrum must be less than 0.1% of the scan time.
Indeed, 1000, 1 m/z units-spaced, m/z channels are explored duringthe scan time, so 0.1 % of total time is dedicated to each channel(ion).
Only the 0.1% of the ions generated in the source are actuallyanalyzed, thus the duty cycle is very low.
Duty cycle