anaerobic treatability and biogas production …etd.lib.metu.edu.tr/upload/12620244/index.pdfof...
TRANSCRIPT
ANAEROBIC TREATABILITY AND BIOGAS PRODUCTION POTENTIAL
OF PISTACHIO PROCESSING WASTEWATER WITH UPFLOW
ANAEROBIC SLUDGE BLANKET (UASB) REACTOR
A THESIS SUBMITTED TO
THE GRADUATE SCHOOL OF NATURAL AND APPLIED SCIENCES
OF
MIDDLE EAST TECHNICAL UNIVERSITY
BY
ERAY GÜR
IN PARTIAL FULFILLMENT OF THE REQUIREMENTS
FOR
THE DEGREE OF MASTER OF SCIENCE
IN
ENVIRONMENTAL ENGINEERING
AUGUST 2016


Approval of the thesis:
ANAEROBIC TREATABILITY AND BIOGAS PRODUCTION POTENTIAL
OF PISTACHIO PROCESSING WASTEWATER WITH UPFLOW
ANAEROBIC SLUDGE BLANKET (UASB) REACTOR
Submitted by ERAY GÜR in partial fulfillment of the requirements for the degree of
Master of Science in Environmental Engineering Department, Middle East
Technical University by,
Prof. Dr. Gülbin Dural Ünver _________________
Dean, Graduate School of Natural and Applied Sciences
Prof. Dr. Kahraman Ünlü _________________
Head of Department, Environmental Engineering
Prof. Dr. Göksel N. Demirer _________________
Supervisor, Environmental Engineering Dept., METU
Examining Committee Members:
Prof. Dr. Faika Dilek Sanin _________________
Environmental Engineering Dept., METU
Prof. Dr. Göksel N. Demirer _________________
Environmental Engineering Dept., METU
Assist. Prof. Dr. Evren Doruk Engin _________________
Basic Biotechnology, Dept., Ankara University
Assoc. Prof. Dr. Tuba Hande Ergüder _________________
Environmental Engineering Dept., METU
Assoc. Prof. Dr. Emre Alp _________________
Environmental Engineering Dept., METU
Date: August 08, 2016

iv
I hereby declare that all information in this document has been obtained and
presented in accordance with academic rules and ethical conduct. I also declare that,
as required by these rules and conduct, I have fully cited and referenced all materials
and results that are not original to this work.
Name, Last Name: Eray Gür
Signature:

v
ABSTRACT
ANAEROBIC TREATABILITY AND BIOGAS PRODUCTION POTENTIAL OF
PISTACHIO PROCESSING WASTEWATER WITH UPFLOW ANAEROBIC
SLUDGE BLANKET (UASB) REACTOR
Gür, Eray
M.Sc., Environmental Engineering Department
Supervisor: Prof. Dr. Göksel N. Demirer
August 2016, 93 pages
Agro-industrial wastes cannot be treated in conventional wastewater treatment plants due
to high organic contents. However, they have a high potential as renewable energy
resources, and can be converted into valuable end products via application of appropriate
treatment technologies. Anaerobic digestion (AD) is a process which converts organic
materials into methane and carbon dioxide in the absence of oxygen. Therefore, well-
established anaerobic biotechnologies, such as up-flow anaerobic sludge blanket (UASB)
reactors, have been widely adopted worldwide as a tool for not only treatment but also
valorization of agro-industrial wastes.
In Turkey, 130000 tons of pistachio and 520000 tons of pistachio processing wastewater
are produced annually. However, academic studies on anaerobic treatability of pistachio
are limited.
The aim of this thesis is determination of the efficiency of AD process for the treatment
of pistachio processing wastewaters, a local agro-industrial waste, and production of
biogas as surplus renewable energy source during the treatment process. To this purpose:
(1) anaerobic treatment of the pistachio processing wastewater originated from peeling
process of outer fresh husk of pistachio in an UASB reactor; and (2) determination of the
biogas production during anaerobic treatment process were conducted. Average COD
removal efficiencies of four UASB reactors were varying from 73.8 % to 86.74 %.
Maximum COD removal efficiency observed in reactor UASB3 as 95.4 %. Average
methane yields observed in reactors ranged in between 154 – 305.49 ml CH4/g CODreduced.

vi
The results revealed that pistachio wastewater can be treated with UASB and biogas can
be produced.
Keywords: Pistachio, Pistachia vera L., Anaerobic Treatment, Up-flow Anaerobic
Sludge Blanket

vii
ÖZ
ANTEP FISTIĞI ATIK SUYUNUN YUKARI AKIŞLI ÇAMUR YATAKLI
ANAEROBİK (YAÇYA) REAKTÖR İLE ANAEROBİK OLARAK
ARITILABİLİRLİĞİ VE BİYOGAZ ÜRETİM POTANSİYELİ
Gür, Eray
Yüksek Lisans, Çevre Mühendisliği Bölümü
Tez Yöneticisi: Prof. Dr. Göksel N. Demirer
AĞUSTOS 2016, 93 sayfa
Yüksek organik içeriği olan tarımsal sanayi atıkları, konvansiyonel atık su arıtma
tesislerinde arıtılmaya uygun değildir. Buna ragmen, bu atıklar yenilenebilir enerji
kaynağı olarak kullanılma potansiyelleri yüksektir ve uygun arıtım teknolojileri
kullanılmasıyla değerli ürünlere dönüşebilirler. Anaerobik çürütme, organik bileşiklerin
oksijen yokluğunda metan ve karbondiokside kadar indirgendiği bir süreçtir. Bu sebeple,
Yukarı Akışlı Çamur Yataklı Anaerobik (YAÇYA) reaktörü gibi iyi anlaşılmış anaerobik
biyo-teknolojiler, dünya çapında yaygın olarak kullanılmakta ve sadece arıtım için değil
aynı zamanda tarımsal sanayi atıklarının değerlendirilmesinde önemli rol oynamaktadır.
Türkiye’de yılda ortalama 130000 ton Antep Fıstığı üretilmekte ve işleme sırasında
520000 ton atık su ortaya çıkmaktadır. Ancak, bu konuda yapılmış akademik çalışmalar
sınırlıdır.
Bu çalışmanın amacı, yerel bir atık olan antepfıstığı işleme atık suyunun anaerobik
metotlarla arıtılma verimlerini belirlemek ve bu süreçte ortaya çıkacak biyogazın
yenilenebilir enerji üretim potansiyelini belirlemektir. Bu amaçla tez sürecinde yapılan
çalışmalar: (1) Antep fıstığı üretim sürecinde, dış yaş kabuğun soyulmasından
kaynaklanan atık suyun YAÇYA reaktörü ile arıtılması; ve (2) bu süreçte oluşacak
biyogaz üretim potansiyelini belirlemektir. Kullanılan YAÇYA reaktörlerin ortalama
Kimyasal Oksijen İhtiyacı (KOİ) arıtım verimleri % 73,8 ile % 86,74 arasında
değişmektedir. Elde edilen maksimum KOİ giderim verimi YAÇYA 3’te % 95,4 olarak
gözlenmiştir. Reaktörlerde elde edilen metan üretim verimi 154 – 305,49 ml / g KOİgiderilen
viii
aralığındadır. Sonuçlar, antep fıstığı atık suyunun YAÇYA reaktöründe anaerobik olarak
arıtılabilir olduğunu ve süreçte biyogazın üretilebilir olduğunu göstermektedir.
Anahtar Kelimeler: Antepfıstığı, Pistachia vera L., Anaerobik Arıtım, Yukarı Akışlı
Anaerobik Çamur.

ix
DEDICATION
To my grandma (RIP)…

x
ACKNOWLEDGEMENTS
First of all, I would like to record my deepest gratitude to my supervisor Prof. Dr. Göksel
N. Demirer for his valuable advices, guidance and encouragement extended to me.
I wish to express my sincere to my committee members, Prof. Dr. F. Dilek Sanin, Assist.
Prof. Dr. Evren Doruk Engin, Assoc. Prof. Tuba H. Ergüder and Assoc. Prof. Emre Alp.
I'm very grateful for their feedbacks and valuable recommendations.
I would also like to thank Prof. Dr. Deniz Üner for gaining my life a new standpoint and
for being a motivation for returning to the university.
I also thank to my coworkers and lab partners; Ebru Koçak, Çağatay Erşan, İlke Çelik,
Mehmet Hamgül, İrem Kocatürk, Cansu Gece Öğüt, Burak Çakırlar from Department of
Environmental Engineering for their contribution to my laboratory studies.
I also specially thank to my friends and coworkers Ayşe Özgül Çalıcıoğlu, Emre
Hepgüneş, Eren Hepgüneş, Engin Koç, Oya Nihan Uncu Bilau, Nilüfer Demirci Ülgüdür,
Elif Küçük for their contribution to my whole study and being motivation for studying.
I want exclusively to thank my son, Oğuz Kağan Gür, with his birth and for being a deep
motivation not only for accomplishing this study but also for living.
It is impossible to express how I am thankful to my wife Şebnem Gür. Thank you for
your trust and patience. The idiom “Nice to meet you” have never been felt this
meaningful since I met with you. Thank you for believing in me, I love you.
Last, but not least, I would like to express my deepest gratitude to my mother Rahime
Gür, grandmother Kıymet Uğurman, grandfather Mete Uğurman, father-in-law Dr.
Bülent Aşkun and mother-in-law Prof. Dr. Tülin Aşkun for their support and endurance
throughout my studies. I am glad to have you.

xi
TABLE OF CONTENTS
ABSTRACT.................................................................................................................v
ÖZ .............................................................................................................................. vii
DEDICATION .......................................................................................................... ix
ACKNOWLEDGEMENTS ...................................................................................... x
TABLE OF CONTENTS ......................................................................................... xi
LIST OF TABLES .................................................................................................. xiii
LIST OF FIGURES ................................................................................................ xiv
ABBREVIATIONS .................................................................................................. xv
CHAPTERS ................................................................................................................ 1
1. INTRODUCTION ................................................................................................. 1
2. LITERATURE REVIEW ..................................................................................... 5
2.1 Pistachio ............................................................................................................ 5
2.1.1 Pistachio Production in the World ...................................................... 6
2.1.2 Pistachio Production in Turkey ........................................................... 8
2.1.3 Pistachio Processing in Turkey .......................................................... 10
2.1.4 Environmental Impacts of Pistachio Waste ..................................... 13
2.1.5. Uses of Pistachio Processing Wastes ................................................ 14
2.2 Anaerobic Digestion ....................................................................................... 15
2.2.1 Stages of Anaerobic Digestion ........................................................... 15
2.2.2 Factors Affecting Anaerobic Digestion ............................................. 18
2.2.3 Anaerobic Reactors ............................................................................. 22
2.3. Upflow Anaerobic Sludge Blanket (UASB) ................................................ 28
2.3.1. Development of UASB ....................................................................... 28
2.3.2. Technical Details of UASB ................................................................ 29

xii
2.3.3. Factors Influencing UASB Reactor Performance .......................... 33
2.3.4. Treatment of Different Wastewaters with UASB ........................... 34
2.3.5. Anaerobic Digestion of Pistachio Processing Wastes ..................... 37
3. MATERIAL AND METHODS ........................................................................... 39
3.1 Characterization of Pistachio Waste ............................................................ 39
3.1.1. Chemical Oxygen Demand (COD) ................................................... 40
3.1.2. Total Kjeldahl Nitrogen .................................................................... 40
3.1.3. Total Phosphorus............................................................................... 40
3.1.4. Total Solids......................................................................................... 40
3.1.5. Volatile Solids .................................................................................... 40
3.1.6. Total Suspended Solids ..................................................................... 41
3.2 Experimental Design and Setup .................................................................... 41
3.2.1. First Setup .......................................................................................... 41
3.2.2. Second Setup ...................................................................................... 44
3.3 Experimental Analyses .................................................................................. 47
4. RESULTS AND DISCUSSION........................................................................... 49
4.2. First Setup ...................................................................................................... 51
4.2.1. UASB 1 ............................................................................................... 53
4.2.2. UASB 2 ............................................................................................... 59
4.3. Second Setup .................................................................................................. 61
4.3.1. UASB 3 ............................................................................................... 62
4.3.2. UASB 4 ............................................................................................... 68
4.4. Overall Comparison of All Reactors ........................................................... 72
5. CONCLUSION ..................................................................................................... 77
FUTURE STUDIES ................................................................................................. 79
REFERENCES ......................................................................................................... 81
APPENDICES……………………………………………………………………...93

xiii
LIST OF TABLES
TABLES
Table 1. Polymeric matters and their monomers (Schwarzenbach et al., 2005) ... 16
Table 2. Feedstock used in Anaerobic Treatment Applications ........................... 22
Table 3. Wastes Treated with UASB .................................................................... 35
Table 4. Characterization of Granular Seed Taken From Anadolu Efes Beer Factory
............................................................................................................................... 42
Table 5. Basal Medium (Demirer and Speece, 1998) ........................................... 43
Table 6. Characterization of Granular Seed Taken From Amasya Özmaya Yeast Factory
............................................................................................................................... 46
Table 7. Operational Parameters ........................................................................... 47
Table 8. Pistachio Process Wastewater Characteristics (Demirer, 2016) ............. 50
Table 9. Fresh Pistachio Processing WW Characteristics .................................... 50
Table 10. Results of UASB1 & UASB2 ............................................................... 53
Table 11. Results of UASB3 & UASB4 ............................................................... 62
xiv
LIST OF FIGURES
FIGURES
Figure 1. Distribution of Pistachio Production in the World (FAOSTAT, 2016) .. 6
Figure 2. Total Pistachio Production in the World (FAOSTAT, 2016) ................. 7
Figure 3. Continental Distribution of Pistachio Production (FAOSTAT, 2016) ... 7
Figure 4. Top Five Pistachio Producers of the World (FAOSTAT, 2016) ............ 8
Figure 5. Total Pistachio Production in Turkey (FAOSTAT, 2016) ...................... 9
Figure 6. Flow Scheme of Pistachio Processing (Ocak, 2012) ............................ 11
Figure 7. Schematic diagram of carbon flow conversion in anaerobic digestion (Korsak
et al., 2008) ............................................................................................................ 16
Figure 8. Completely Mixed Suspended Growth Anaerobic Digester (Gerardi, 2003)
............................................................................................................................... 23
Figure 9. Anaerobic Contact Process (Khanal, 2008) .......................................... 24
Figure 10. Anaerobic Sequencing Batch Reactor (Dague, 1993) ........................ 25
Figure 11. Anaerobic Up-flow Packing Bed Reactor (de Lemos Chernicharo, 2007)
............................................................................................................................... 26
Figure 12. AFBR (Sancinetti et al., 2012) ............................................................ 27
Figure 13. UASB (Chong et al., 2012) ................................................................. 28
Figure 14. Drawings of UASB 1&2 Reactors and GLS Separators ..................... 42
Figure 15. Drawings of UASB 3&4 Reactors and GLS Separators ..................... 45
Figure 16. Water Displacement Device ............................................................... 48
Figure 17. UASB 1 ............................................................................................... 55
Figure 18. UASB 2 ............................................................................................... 58
Figure 19. UASB 3 ............................................................................................... 64
Figure 20. UASB 4 ............................................................................................... 69
xv
ABBREVIATIONS
AD : Anaerobic Digestion
AEBR : Anaerobic Expanded Bed Reactor
AFBR : Anaerobic Fluidized Bed Reactor
ASBR : Anaerobic Sequencing Batch Reactor
BM : Basal Medium
BMP : Biochemical Methane Potential
BOD : Biochemical Oxygen Demand
COD : Chemical Oxygen Demand
DO : Dissolved Oxygen
F/M : Food-to-Microorganism Ratio
GSL : Gas Solid Liquid
HRT : Hydraulic Retention Time
LCFA : Long Chain Fatty Acids
MSW : Municipal Solid Waste
OFMSW : Organic Fraction of Municipal Solid Waste
OLR : Organic Loading Rate
PGH : Pistachio Green Hull
PHP : Pistachio Hull Powder
RTD : Residence Time Distribution
SLR : Sludge Loading Rate
sCOD : Soluble Chemical Oxygen Demand
TAN : Total Ammonifiable Nitrogen
tCOD : Total Chemical Oxygen Demand
TKN : Total Kjeldahl Nitrogen
TN : Total Nitrogen
TP : Total Phosphorus
TS : Total Solids
TSS : Total Suspended Solids
UASB : Up-flow Anaerobic Sludge Blanket
VFA : Volatile Fatty Acids
VS : Volatile Solids
VSS : Volatile Suspended Solids

xvi
WAS : Waste Activated Sludge
WW : Waste Water
1
CHAPTER 1
INTRODUCTION
As a small tree, the pistachio (Pistacia vera L) produces seeds that are edible and widely
consumed. As a source of mastic, one of the oldest known high grade resins, Pistachia
lenticus, another pistachio species, has been cultivated since antiquity in Greece and the
Greek island of Chios. It is also known as the “mastic tree”. Pistachio is a deciduous tree
which grows slowly to a height and spread of 8 – 10 meters. Under inimical conditions,
with sparse precipitation and on stony terrain it can survive. Although it cannot tolerate
excess humidity and damp, the tree is durable to windy and cold weather. In spite of the
vast temperature difference, 45°C in summer and – 10°C during the winter months, it
flourishes in some regions of Iran.
With the high demand of the consumers, the pistachio is placed among the most valuable
nuts in economic terms, which makes pistachio production a rising trend in the World
(Schramm, 2014).
Of the total production of pistachio in the World (Polat et al., 2007; Zheng, 2011), Turkey
comes third after Iran and United States with a production of approximately 10.6% (Polat
et al., 2007).
Even though pistachio production takes place in 56 cities in Turkey, the leading producers
are concentrated in the south-east region of Turkey (Babadogan, 2007). Even the name
“Antep nut” comes from the region, Gaziantep, where pistachio is produced the most.
Between the years 2007-2009 (TUIK 2012), 94 % of the pistachio produced in Turkey
came from south-eastern Anatolia, and 45.44 % of it was produced in Gaziantep region.
2
In Turkey, around 130000 tons of pistachio is produced in average. The wastewater
generation from pistachio processing is around 4 m3 / ton of pistachio paired (Ocak,
2012). That means, 520000 m3 of pistachio processing wastewater is generated in average
in a year. The wastewater of the pairing process filtered from 2 – 3 mm sieves.
The retantate of the sieving process is named as pistachio solid waste. 1/5 of the total
weight of pistachio is the outer red - green soft husk. That means also 26000 tons of
pistachio solid waste is being generated in Turkey in a year.
The energy demand escalated as the population grew uncontrolled, urbanization increased
and industrialization accelerated. Currently fossil fuels are the prior source of energy and
they will continue to be consumed in a constant and unsustainable way (Park et al., 2010).
Using fossil fuels cause harmful after effects such as greenhouse gas emissions, climate
change, global warming and serious environmental changes like air pollution (Xie et al.,
2008). Aiming to solve these problems and develop a sustainable system, the demand for
renewable energy resource is getting higher.
The need for alternative energy and fuels has motivated researchers to focus on renewable
and sustainable means of energy production including energy production from wastes
such as anaerobic digestion.
Organic wastes are important sources of renewable energy that cannot be underestimated.
If not treated, the disposition of these wastes cause air and soil pollution, surface and
ground water degradation and greenhouse gas emissions. Organic wastes can be
decomposed to biohydrogen or methane via different biochemical systems. Such systems
contribute to the environment by reducing greenhouse gas emissions through waste
processing and play an important role in the production of renewable/ sustainable energy
(Giordano et al., 2010).
One of the most commonly used anaerobic reactors used to process industrial wastewaters
with high organic content is Upflow Anaerobic Sludge Blanket (UASB) reactor. In a
UASB reactor, a blanket of granular sludge carry out the anaerobic digestion process.
3
Anaerobic microorganisms forming the sludge blanket (degrade) the organics in
wastewater as it flows upwards through it. With this reactor type, the use of granular
sludge make good settling and solids/liquids separation possible (Lettinga et al., 1994).
UASB reactors are also preferable since they are highly tolerable to toxic shock loads and
high Organic Loading Rates (OLRs). This reactor configuration is versatile and has been
used for a variety of substrates; cheese whey, olive mill wastewater, olive pomace
leachate, potato waste leachate, thin stillage, slaughterhouse wastewater and dairy
manure, for treatment and renewable energy production purposes (Speece, 1996).
When it comes to the treatment of organic wastes, anaerobic digestion is both a common
solution well known around the world today (Ergüder et al., 2000; Clarke and Alibardi,
2010) and an appealing technique to generate renewable energy (Torres and Lloréns,
2008). Although so many organic wastes were examined as anaerobic substrates and
pistachio wastewater is a considerable strong organic waste, anaerobic treatability and
biogas production potential of pistachio wastewater were studied only in batch systems
(Çelik and Demirer, 2015; Demirer, 2016) but was not investigated in a continuous
anaerobic reactor before. Therefore, this is the first study that examines the anaerobic
treatability and biogas production potential of pistachio processing wastewater in a
continuous anaerobic reactor.
The aim of this study is to determine the anaerobic treatment performance and the biogas
production potential of pistachio processing wastewater with UASB reactors. For this
purpose, in this study, four lab scale UASB reactors were employed in two setups. The
reason for employing UASB reactors in this study is the advantages of UASB reactors in
treating industrial wastewaters (Kaviyarasan, 2014). These advantages can be
summarized as highly efficient COD removal performance of UASB reactors and being
able to operated at both mesophilic and thermophilic conditions. Due to the fact that
UASB is a well-known technology for high strength industrial wastewaters; the previous
modelsing approaches and kinetics derived so far for UASB reactors can also be applied
in order to improve the COD removal performance of the system and also biogas
production potential.

4
The wastewater, taken from Tadım Pistachio Processing factories’ pairing process, were
characterized and sieved. The reactors were fed once in two days and COD, produced
biogas volume and gas composition measurements were also done once in two days.
In second setup UASB reactors upgraded, new pumps were used, different granules were
employed, Hydraulic Retention Time (HRT) of the system were changed from 4 to 5.4
days and Basal Medium (BM) usage was limited (In UASB 3 only alkalinity addition was
applied).
5
CHAPTER 2
LITERATURE REVIEW
2.1 Pistachio
The seeds of the small tree called the pistachio (Pistacia vera L) are commonly consumed
as food. The family Anacardiaceae, which the pistachio is a member, houses also cashew,
mango, sumac and poison oak. Many of the about a dozen pistachio species exude
turpentine or mastic and some produce small nuts. The larger and edible pistachio which
is acceptable as a commercial product is only produced by pistachia vera. The name
pistachio was derived from the Persian name of these nuts “pisteh”. As a source of mastic,
as a high grade resins known to man in earliest times, another pistachia species, the
Pistachia lenticus, has been cultivated in Greece and the Greek island of Chios since
ancient times (Rosengarten Jr, 2004). The evidences found in Djarkutan, Uzbekistan
indicate that pistachio is consumed as food since the Bronze age (Potts, 2012).
As a deciduous tree, the Pistachia vera L. can grow up to 8 m and spread 10 m slowly. It
is durable to dry and adverse conditions. It can live even without rainfall for the most of
the year on stony terrain. While it can endure low temperatures and wind, it is not
tolerable to excessive dampness and humidity. Some regions of Iran constitute productive
lands for pistachio, where the temperatures differ from 45° C in summer to – 10° C during
the winter months.
Pistachio is one of oldest food known to men. There had been archaeological excavations
in a very early Neolithic settlement which thrived about nine thousand years ago, in
Hashemite Kingdom of Jordan, north of Petra, in Beidha. A series of well-preserved plant
impressions were found in one of the excavations from one of the antique residences. It
was evident that the residence was destroyed by a ferocious fire since clay, mortar and

6
plaster from roof and mud-brick walls were baked and solidified. Inside the residence, a
heap of carbonized pistachio nuts, which are estimated to have been in a large basket and
weigh around 18 kg originally, were found on the floor in excellent condition. Carbonized
pistachio nuts found at Beidha date back to 6750 B.C. according to the radio-carbon date
calculated by the Copenhagen Radiocarbon Laboratory, making them one of the oldest
original recorded edible nuts (Rosengarten Jr, 2004).
2.1.1 Pistachio Production in the World
Figure 1 shows the distribution of the pistachio production in the World. Although the
origin of the pistachio is Middle East and Anatolia, it spreads to all Mediterranean
countries and then to the World.
Figure 1. Distribution of Pistachio Production in the World (FAOSTAT, 2016)
Total pistachio production of the World is shown in Figure 2. Today pistachio’s
popularity among the consumers renders it to be one of the most important nuts in terms
of economic value. Therefore, the pistachio production has a rising trend in the world
(Figure 2).

7
Figure 2. Total Pistachio Production in the World (FAOSTAT, 2016)
Today, the continental distribution of the pistachio production for years 2005 – 2013 is
depicted in Figure 3. Asia is producing 75.9 % of the pistachio in the World. This
percentage is resulted from the fact that the countries Iran, Turkey, Syria, and China are
located in Asia. These are the four of the top 5 pistachio producers (Figure 4). In the
continent America, almost all of the production is made by USA. USA is the second
biggest producer in the world with a production of 177463.7 tons of pistachio per year
between 2005 and 2013.
Figure 3. Continental Distribution of Pistachio Production (FAOSTAT, 2016)
250000
500000
750000
1000000
1250000
2004 2005 2006 2007 2008 2009 2010 2011 2012 2013 2014
Ton
s /
year
Years

8
The top five pistachio producers of the World is given in Figure 4. Islamic Republic of
Iran is the world’s biggest pistachio producer with 395321.3 tons/year in average. Iran
produce 478600 tons of pistachio in 2013 and with this production, Iran supplies almost
52 % of total pistachio production in World alone.
Turkey produces approximately 10.6% of the total pistachio (Pistacia vera L.) production
in the World (Polat et al., 2007) . Average production value of 102658.7 tons/year
between 2005 and 2013 makes Turkey the third largest producer in the World, after Iran
and United States (Polat et al., 2007; Zheng, 2011). Turkey produced 88600 tons of
pistachio in 2013 and saved its place of third biggest pistachio producer in the World.
Figure 4. Top Five Pistachio Producers of the World (FAOSTAT, 2016)
2.1.2 Pistachio Production in Turkey
Although pistachio is produced in 56 cities in Turkey, it is mainly concentrated in the
South-Eastern Anatolia (especially Gaziantep region) possessing 84 % of total pistachio
industry of the country (TUIK 2012). It’s the climatic and geographic qualities this region
namely dry and hot summers and short and moderately warm winter conditions, that meet
the requirements of efficient pistachio production (Babadogan, 2007). In fact, in Turkey,
pistachio is named after the region it is produced the most, Gaziantep, as “Antep nut”. 94
% of pistachio production of Turkey is accomplished in South-Eastern Anatolia with
Gaziantep region controlling % 45.44 of the whole production in Turkey between the
0
50000
100000
150000
200000
250000
300000
350000
400000
450000
Iran (IslamicRepublic of)
United States ofAmerica
Turkey Syrian ArabRepublic
China, mainland
Ton
s /
year
9
years 2007-2009 (TUIK 2012). Moreover, these facts render the city and its surroundings
to be the processing and trade center of pistachio in the country.
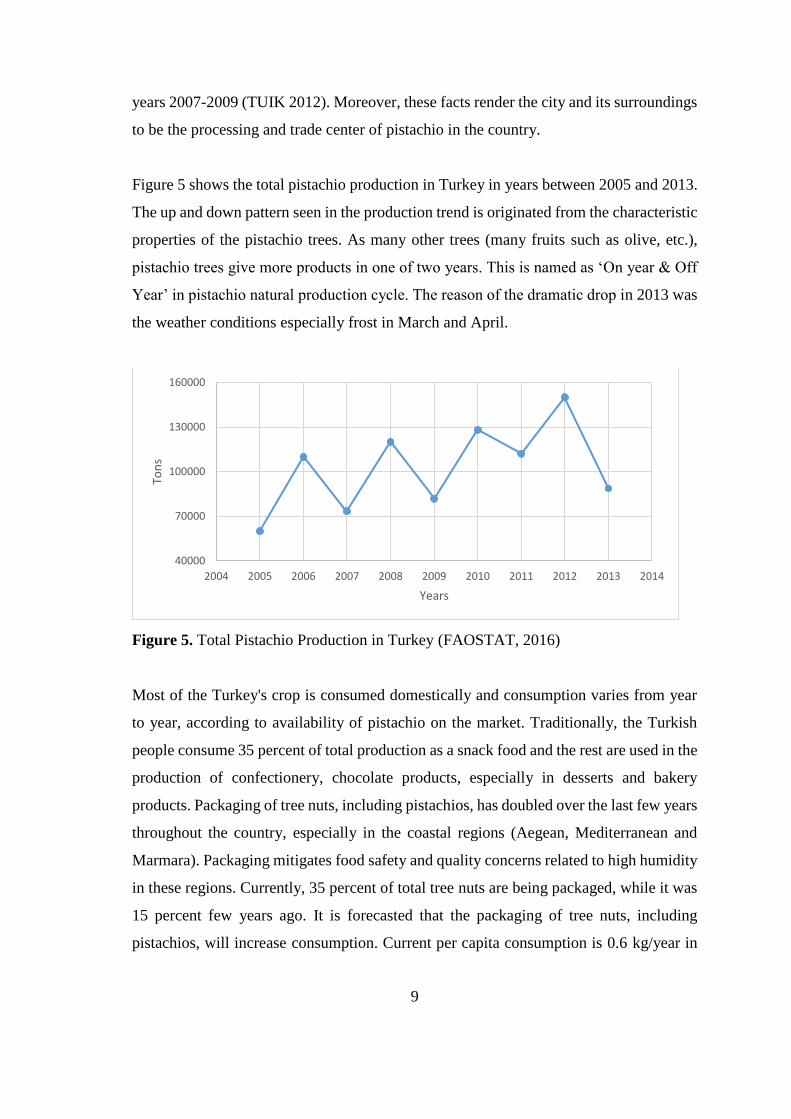
Figure 5 shows the total pistachio production in Turkey in years between 2005 and 2013.
The up and down pattern seen in the production trend is originated from the characteristic
properties of the pistachio trees. As many other trees (many fruits such as olive, etc.),
pistachio trees give more products in one of two years. This is named as ‘On year & Off
Year’ in pistachio natural production cycle. The reason of the dramatic drop in 2013 was
the weather conditions especially frost in March and April.
Figure 5. Total Pistachio Production in Turkey (FAOSTAT, 2016)
Most of the Turkey's crop is consumed domestically and consumption varies from year
to year, according to availability of pistachio on the market. Traditionally, the Turkish
people consume 35 percent of total production as a snack food and the rest are used in the
production of confectionery, chocolate products, especially in desserts and bakery
products. Packaging of tree nuts, including pistachios, has doubled over the last few years
throughout the country, especially in the coastal regions (Aegean, Mediterranean and
Marmara). Packaging mitigates food safety and quality concerns related to high humidity
in these regions. Currently, 35 percent of total tree nuts are being packaged, while it was
15 percent few years ago. It is forecasted that the packaging of tree nuts, including
pistachios, will increase consumption. Current per capita consumption is 0.6 kg/year in
40000
70000
100000
130000
160000
2004 2005 2006 2007 2008 2009 2010 2011 2012 2013 2014
Ton
s
Years
10
Turkey. However, higher prices in the last two years have slowed the increase in
consumption (Schramm, 2014).
Turkey is self-sufficient in pistachios and a minor amount of total production goes to
exports. Although there is no legal barrier to pistachio imports, there are always less
import than the market requires, especially during “off year” production periods. Because
marketing year 2013 as an “off year” and prices were high, imports doubled in marketing
year 2013 to 13,000 Tons. Exports in marketing year 2013 were considerably less than
the previous year. Italy is still the primary export market for Turkish pistachios. Other
significant markets include Israel, Saudi Arabia, Hong Kong and North African countries
such as Egypt and Libya (Schramm, 2014).
2.1.3 Pistachio Processing in Turkey
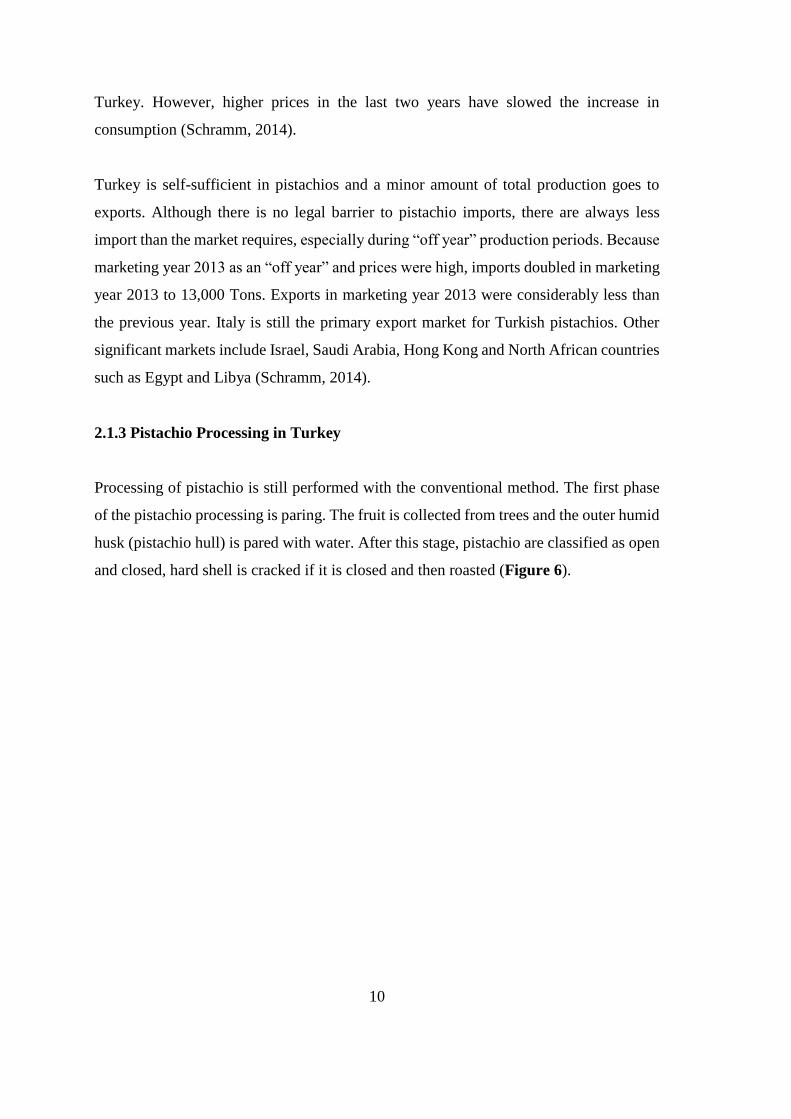
Processing of pistachio is still performed with the conventional method. The first phase
of the pistachio processing is paring. The fruit is collected from trees and the outer humid
husk (pistachio hull) is pared with water. After this stage, pistachio are classified as open
and closed, hard shell is cracked if it is closed and then roasted (Figure 6).
11
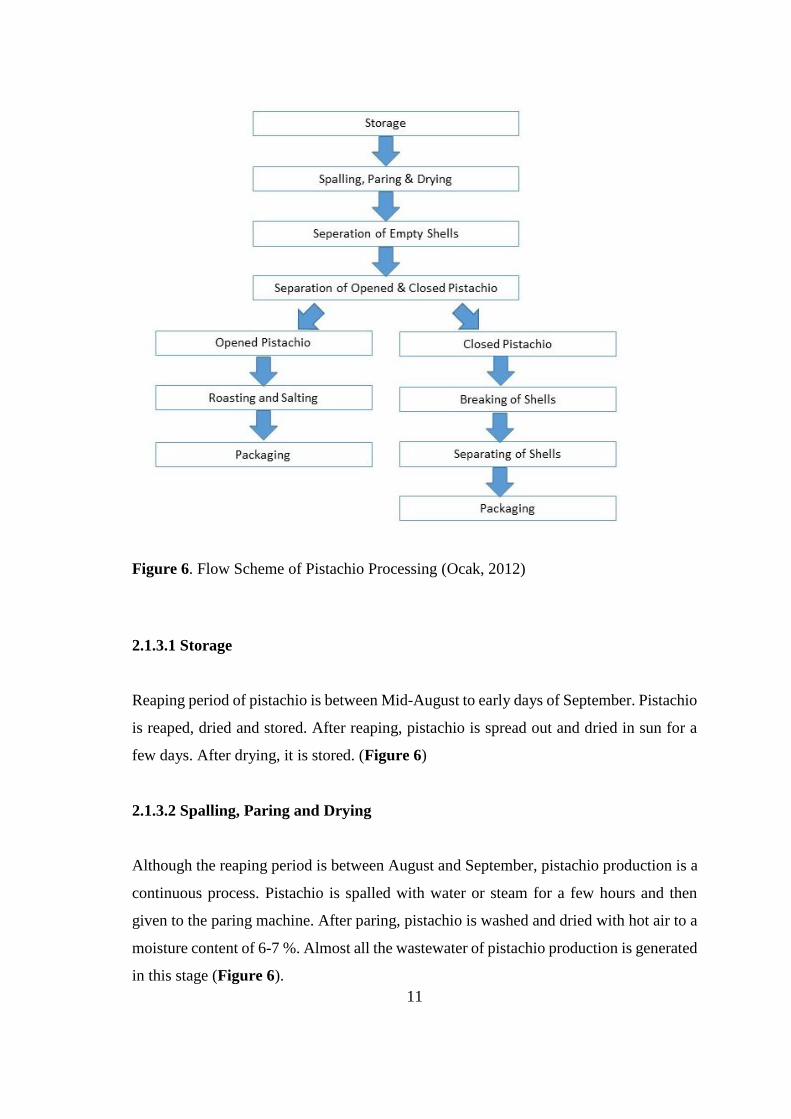
Figure 6. Flow Scheme of Pistachio Processing (Ocak, 2012)
2.1.3.1 Storage
Reaping period of pistachio is between Mid-August to early days of September. Pistachio
is reaped, dried and stored. After reaping, pistachio is spread out and dried in sun for a
few days. After drying, it is stored. (Figure 6)
2.1.3.2 Spalling, Paring and Drying
Although the reaping period is between August and September, pistachio production is a
continuous process. Pistachio is spalled with water or steam for a few hours and then
given to the paring machine. After paring, pistachio is washed and dried with hot air to a
moisture content of 6-7 %. Almost all the wastewater of pistachio production is generated
in this stage (Figure 6).

12
2.1.3.3 Separation of Empty Shells
Sometimes pistachio fruit may not grow. The red husk and shell is grown but the fruit is
not. So after paring of red husk, separation of empty shells is needed. The main reasons
of this are lack of male trees, apiculturing and other kind of fruits in near orchards, or
climatological effects (Figure 6).
2.1.3.4 Separation of Opened and Closed Shells
Some of the shells are opened during processing and some of them are not. In most races
of pistachio, 50 – 70 % are opened. Both mechanical and manual techniques are used to
open the closed ones. In Turkey opening process is made by hand. A worker can open
around 15 - 20 kg of pistachio in 1 day. A cracking machine which has been invented
locally in Gaziantep can open 210 – 400 kg of pistachio in 8 hours (Ocak, 2012).
2.1.3.5 Roasting and Salting
Pistachio trade is mainly done in two ways. First one is as dried fruit. Pistachio grows as
bunches. The outer ones grow faster than inner fruits and they fall from trees firstly. These
are considered the most delicious pistachios of the season and are traded as dried fruits.
The first harvest is traded as dried fruit directly without passing through any process. The
others are mostly used in chocolates, halvas or different kind of desserts. The processes
mentioned above are used for the second type of pistachios. Insignificant amount of water
is also used in the salting process. According to information taken from “TADIM
Kuruyemiş” Gaziantep pistachio factory, salt is used in 1/4 ratio of pistachio produced in
terms of weight and the amount of wastewater generated in this process is not significant
(Ocak, 2012).
13
2.1.4 Environmental Impacts of Pistachio Waste
In Turkey, around 130000 tons of pistachio is produced in average. 1/5 of the total weight
is pistachio hull. As wastewater generation 1 m3 for spalling, 4 m3 for paring and 0.3 m3
of water for washing is used for processing 1 ton of pistachio. The spalling water can used
many times and washing water can be reused in paring process directly (Ocak, 2012). In
average, 520000 m3 of pistachio processing wastewater and also 26000 tons of pistachio
solid waste is generated in Turkey in a year (Ocak, 2012; FAOSTAT, 2016).
For now, according to the information taken from TADIM Pistachio Factory, factories
filter their wastewater from 2 - 3 mm sieves and give it to the sewer system (Ocak, 2012).
The solid waste from the sieves is sand to landfill.
The pistachio waste has high solids concentration with high organic and phenolic content.
When the by-products of pistachio are considered, the most abundant ingredient is the
pistachio epicarp (53.5% of dry matter) followed by peduncles, leaves, mesocarp and
kernel (27.7%, 9.5%, 5.3% and 4.0% of dry matter, respectively) of the pistachio plant.
All of these by-products are obtained during the deshelling stage of the production. The
green hull of the plant is shown to be a rich source of nutrients such as protein, fat, mineral
salts, vitamins, one of the richest sources of antioxidant, phenolic compounds and
essential oil such as a-pinene and alpha-terpinolene (Goli et al., 2005; Chahed et al.,
2008). However, it is generally treated as agricultural waste, often mixed with soil or used
to feed cattle and ovine by local livestock farmers. Additionally, it is known to be used
as herbal medicine and human foods (mainly as pistachio hull jam) although to a lesser
extent. Some important characteristics of the pistachio hull such as chemical composition,
phenolics content, etc. vary and greatly depend upon the pistachio cultivar (Bohluli et al.,
2010), harvesting time, drying and de-hulling processes (Behgar et al., 2011). This fact
poses considerable problems of waste management which require careful planning and
implementation of waste management solutions.
14
2.1.5. Uses of Pistachio Processing Wastes
In literature, there are some studies that pistachio processing wastes and residuals were
examined and evaluated for potential uses.
In Iran, pistachio green hull was employed as absorbent in order to remove cyanide from
a syntactic wastewater (Moussavi and Khosravi, 2010) and also cationic dyes from
aqueous solutions (Moussavi and Khosravi, 2011). Moussavi and friends claim that
pistachio hull powder (PHP) was capable of reducing a high concentration of cyanide
ions (up to 200 mg/L) in a relatively short contact time with a low amount of adsorbent
(Moussavi and Khosravi, 2010) and also they conclude that hulls produced as an
agriculture waste material are a viable and very promising alternative adsorbent for color
removal from industrial wastewater (Moussavi and Khosravi, 2011).
Also in another study in Iran, Kazemi and coworkers, tried to use Pistachio Green Hull
(PGH) as a substrate for furfural production and showed that PGH is a lingo-cellulosic
material and have good potential for furfural production (Kazemi and Zand-Monfared,
2010).
PGH’s antioxidant activity was also examined in different studies. Rajaei and coworkers
reported that PGH can be used as a cheap and easily accessible source of natural bioactive
compounds and PGH aqueous extracts presents a strong antioxidant activity, inhibition
of the growth of the different pathogenic bacteria (Gram+) and anti-mutagenicity that can
causes health problems (Rajaei et al., 2010). Also Goli and coworkers claim that the PHE
possess antioxidant properties and could be used as alternative natural antioxidants (Goli
et al., 2005).
In Turkey, pistachio soft shell was analyzed for biofuel production. In the study, Demiral
et. al. conducted in Eskişehir Osmangazi University in 2008,pyrolysis of pistachio soft
shell was carried out in a fixed-bed reactor and the bio-oil produced from pistachio soft
shell was identified and presented as a bio-fuel candidate, that may be used as a source of
low-grade fuel directly, or it may be upgraded to higher quality liquid fuels by the

15
application of various processes (such as cracking, hydrogenation, etc.) (Demiral et al.,
2008).
Although there are some studies considering pistachio processing wastes and residuals as
a by-product, they are not implemented widely. Thus, pistachio processing wastes and
residuals are a significant threat to the environment. Most of the pistachio processing
solid waste is ended in landfills. The pistachio processing wastewater is discharged
directly to the natural receiving environments or into the sewer system bringing a heavy
load to the conventional wastewater treatment plants of the local municipalities.
2.2 Anaerobic Digestion
When it comes to the treatment of organic wastes, anaerobic digestion is both a common
solution (Ergüder et al., 2000; Clarke and Alibardi, 2010) and an appealing technique as
a form of renewable energy around the World today (Torres and Lloréns, 2008).
Anaerobic digestion (AD) can be defined as a process that involves decomposition of
organic matter, which can be referred as substrate, in molecular oxygen-free environment.
As a result of this process, methane, carbon dioxide and inorganic nutrients are produced
and the organic matter is converted into biogas (McCarty, 1964). Biogas contains 20-30
% CO2, 60-79 % CH4, 1-2% of hydrogen sulfide (H2S) and other gases (Parkin and Owen,
1986).
2.2.1 Stages of Anaerobic Digestion
AD process is comprised of various steps, each of which involves specific anaerobic
bacterial flora. These consecutive steps are (i) hydrolysis, (ii) acidogenesis, (iii)
acetogenesis and (iv) methanogenesis, which are further explained in this section.
Schematic diagram of carbon flow conversation in anaerobic digestion is given in Figure
7.
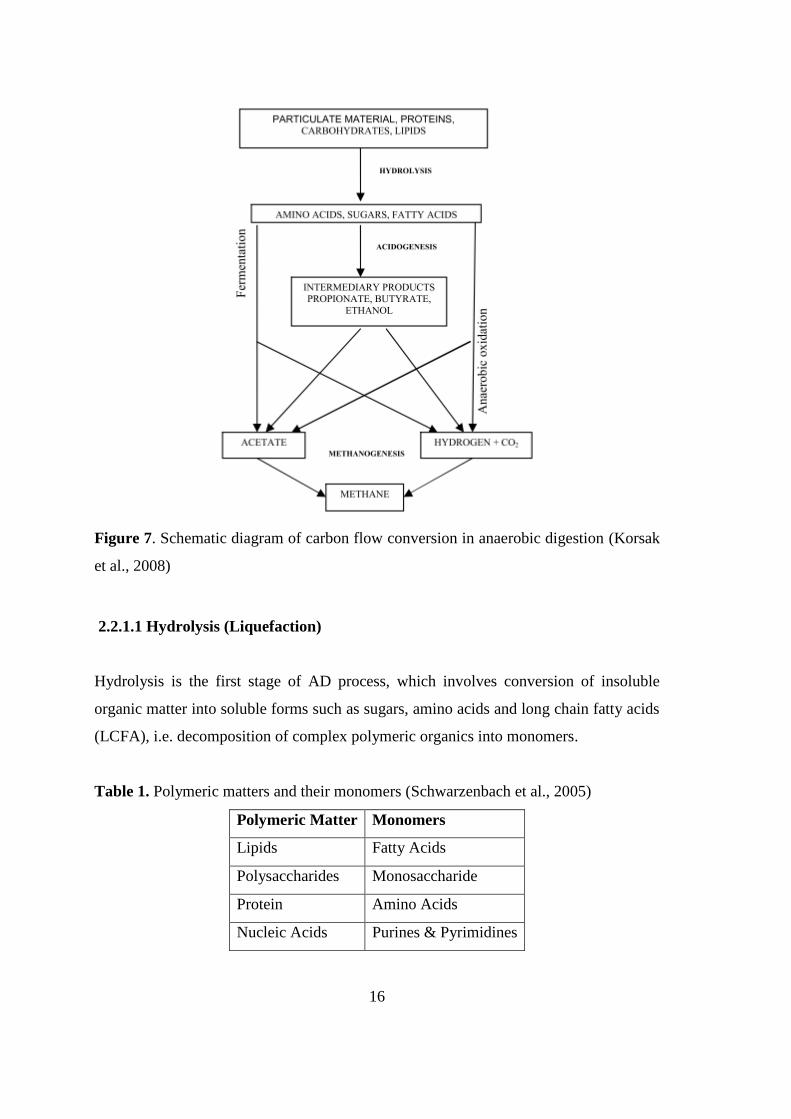
16
Figure 7. Schematic diagram of carbon flow conversion in anaerobic digestion (Korsak
et al., 2008)
2.2.1.1 Hydrolysis (Liquefaction)
Hydrolysis is the first stage of AD process, which involves conversion of insoluble
organic matter into soluble forms such as sugars, amino acids and long chain fatty acids
(LCFA), i.e. decomposition of complex polymeric organics into monomers.
Table 1. Polymeric matters and their monomers (Schwarzenbach et al., 2005)
Polymeric Matter Monomers
Lipids Fatty Acids
Polysaccharides Monosaccharide
Protein Amino Acids
Nucleic Acids Purines & Pyrimidines

17
Liquefaction of organic matter is an important stage, as can be rate limiting in systems
with high organic contents. Pretreatment alternatives such as chemical addition can be
applied to facilitate this stage (Verma, 2002).
2.2.1.2 Acidogenesis
In the second stage, acid formers, convert the products of the first phase to simple organic
acids, carbon dioxide and hydrogen. The principal acids produced are acetic acid
(CH3COOH), propionic acid (CH3CH2COOH), butyric acid (CH3CH2CH2COOH), and
ethanol (C2H5OH) (Verma, 2002).
2.2.1.3 Acetogenesis
Fermentative acetogenic bacteria convert volatile fatty acids synthesized in the previous
phase into hydrogen, acetate and carbon dioxide. Elevated hydrogen concentrations cause
inhibition of methane formation and increase in organic acid concentrations, therefore
play an essential role in methane formation (Parkin and Owen, 1986).
Acetogens are slow-growing bacteria and not resistant to abrupt organic load or physical
changes (Parawira et al., 2004).
2.2.1.4 Methanogenesis
Methanogens produce biogas via simultaneous utilization of the end product of previous
stage. Methanogens are strictly anaerobic organisms which are sensitive to environmental
conditions (McCarty, 1964; Speece, 2008). Methane is produced by bacteria called
methane formers (also known as methanogens) in two ways. It has been done either by
cleavage of acetic acid molecules to generate carbon dioxide and methane, or by reduction
of carbon dioxide with hydrogen (Equations 1, 2, 3). Reduction of carbon dioxide results
in higher methane production, but when the hydrogen concentration in digesters is
limited, the acetate reaction becomes the primary source of methane production (Omstead
et al., 1980). Methanogen organisms include: Methanobacterium, methanobacillus,

18
methanococcus and methanosarcina. These organisms can also be classified into two
groups as acetate consumers and H2/CO2 consumers. The species of Methanosarcina and
Methanothrix (also, methanosaeta) are significant in AD both as acetate and H2/CO2
consumers.
The methanogenesis reactions can be expressed as follows (Verma, 2002)
+ CO2CH3COOH CH4
(Acetic acid) (Methane) (Carbondioxide)
Equation 1
2C2H5OH + CO2 CH4 2CH3COOH+
(Ethanol) (Carbondioxide) (Methane) (Acetic acid)
Equation 2
CO2
(Carbondioxide)
+ 4H2CH4
(Methane)
2H2O
(Water)
+(Hydrogen)
Equation 3
2.2.2 Factors Affecting Anaerobic Digestion
Efficiency of anaerobic digestion (AD) process has a direct relation with balanced
microbial activity. In this section, AD process parameters, that should be restrained in
order to provide optimum growth conditions for microbial flora, will be discussed.
2.2.2.1 Nutrients
Not only aerobic microorganisms but also anaerobic ones utilize organic and inorganic
nutrients for growth and maintenance. Primarily, adequate amounts of nitrogen (N) which
is mainly responsible for amino acid and protein synthesis and phosphorus (P), to be used
for nucleic acid synthesis and energy should be provided in a balanced AD process
(Speece, 2008). Optimum range of element ratios in an AD process were found to be
between 20:1 to 30:1 for C:N (Yen and Brune, 2007) and 5:1 to 7:1 for N:P (Parkin and
Owen, 1986).
19
In AD process, another important parameter for measuring nutrient medium utility is
COD:N:P ratio. For systems with low organic load, a ratio of 350:7:1 (COD:N:P) is often
recommended, however for systems with high organic load, nutrient requirement
increases and the ratio becomes 1000:7:1 for COD:N:P. If waste has immense amount of
biodegradable material, together with high C:N or COD:N ratios can result in accelerated
acidification in AD process.
Besides, if C:N or COD:N ratios are low in an AD digester, ammonia can accumulate,
toxicity can occur and process can be inhibited (Speece, 2008). In anaerobic systems with
high ammonia concentration, which depends on total concentration of free ammonia and
ammonium ion, pH, temperature and pressure, free ammonia (NH3) causes toxification.
Free ammonia concentration increases with increasing pH and temperature, however it
decreases with increasing pressure due to formation of CO2. Systems without
acclimatization, even a concentration of 80 to 200 mg/L free ammonia can inhibit the
process. Inhibition is not only related with free ammonia but also with total ammonia
concentration. Total ammonia concentrations in the range of 1.5 - 7 g/L are found to be
toxic. But, if the process is adapted, it can endure concentrations up to 3-4g/L (Nielsen
and Angelidaki, 2008).
Apart from nitrogen (N) and phosphorus (P), elements like iron (Fe), nickel (Ni), cobalt
(Co), sulfur (S) and calcium (Ca), together with trace elements are required in small
quantities.
An anaerobic system usually requires lower amount of nutrient than an aerobic system.
Nonetheless, external nutrient addition can be necessary for an anaerobic system in rare
cases. (Speece, 2008)

20
2.2.2.2 pH
Different species of microorganisms which are mostly acid-intolerant are involved in an
AD process. Microorganisms responsible of biogas production mainly belong to three
groups, which are: Hydrolysis bacteria, acid forming bacteria and methane forming
bacteria. Acid forming bacteria, as the name indicates, tolerate acidic pH however the
optimum pH for this type is between 5.0 and 6.0. Specifically, growth of methanogens is
directly related with the pH of environment. Optimum pH values are found to lie between
6.6 and 7.6 for an AD process (McCarty, 1964). Moreover, methane forming bacteria has
the optimum pH range of 6.7 - 7.4. If the reactor operates out of approximate neutral
range (pH 6.0 - 8.0), the activity of methanogenic bacteria decreases, resulting in lower
reactor efficiency. The pH drop caused by acid forming bacteria can be controlled by the
bicarbonate which is formed as a result of methanogenic activity or added externally (Liu
and Tay, 2004).
Immense amounts of organic acid degradation lowers pH values (less than 6.0) and
inhibits activity of methanogenic microorganisms. This can be overcome by buffering the
system.
Bicarbonate system is mainly the source of alkaline conditions in AD process which
provides a buffer and prevents pH decline. In contrary, if alkalinity is high in the process,
it can also enhance ammonia toxicity (Parkin and Owen, 1986). An alkalinity range of
2000-4000 mg/L is enough to maintain pH around 7.0 (Soller et al., 2003).
2.2.2.3 Temperature
Psychrophilic (0-20 °C), mesophilic (30-38 °C) or thermophilic (50-60°C) temperature
ranges can be applied in AD process (McCarty, 1964) and conventional anaerobic
digesters are mainly run in mesophilic range (Parkin and Owen, 1986).

21
2.2.2.4 Toxicity
The concentration and acclimatization of a substance define its toxic potential in a system.
In general, variety of substances can be endured and mild concentration levels, but as
concentration increases, their potential to inhibit also increase. Substances which can
cause toxicity in AD process include: Sodium, potassium, calcium, magnesium, copper,
chromium, nickel, ammonia, formaldehyde, chloroform, sulfide, ethyl benzene, ethylene
dichloride, kerosene, alkali and alkaline earth-metals, heavy metals and detergents.
However, microorganisms can increase their tolerance against toxic substances via
acclimatization (Parkin and Owen, 1986).
2.2.2.5 Organic Loading Rate
The organic loading rate (OLR) is defined as the flux of organic matter fed to the system.
The unit of OLR is kg/m3/d (Zhou and Mancl, 2007). The degree of microbial nutrient
deprivation depends on OLR. At low OLR, microorganisms starve in contrary to high
OLR conditions at which rapid growth is observed. The latter condition can also lead to
intoxication due to excessive organic matter (Liu and Tay, 2004).
For a fast start-up, OLR can be regulated to yield 80% of COD reduction in an UASB
system (Fang and Chui, 1993). On the other hand, if OLR is regulated at a too high value,
the biogas can be produced at increasing rate, resulting in increased agitation, which
finally may be able to cause sludge washout (Liu and Tay, 2004).
2.2.2.6 Food to Microorganism Ratio
Ratio of chemical oxygen demand (COD) to volatile suspended solids (VSS), in other
words, food to microorganisms’ ratio (F/M) is defined as probable nutrient availability
for microorganisms (Droste, 1997). F/M is significant in terms of biodegradation of waste
(Grady, 1985). It was stated by Prashanth et al. (2006) that high F/M ratio can cause
toxicity however too low F/M ratio can hinder enzyme induction and adversely affect
biodegradation (Prashanth et al., 2006).

22
Table 2 summarizes some of the feedstocks that are commonly digested in anaerobic
biological treatment systems (Yilmazel, 2009).
Table 2. Feedstock used in Anaerobic Treatment Applications (Yilmazel, 2009)
Type of feedstock Reference(s)
Waste activated sludge (Bolzonella et al., 2005; Demirer and Othman, 2008;
Romano and Zhang, 2008)
Organic fraction of
municipal solid waste
(Hartmann and Ahring, 2005; Dogan et al., 2009)
Domestic wastewater (Monroy et al., 2000; Ergüder and Demirer, 2008)
Fruit and vegetable wastes (Bouallagui et al., 2005)
Animal manure (Güngör-Demirci and Demirer, 2004; Demirer and
Chen, 2005; Karim et al., 2005)
Sugar industry wastes (Hutnan et al., 2001; Farhadian et al., 2007)
Pulp and paper industry
wastes
(Grover et al., 1999; Tezel et al., 2001)
Food waste (Kim et al., 2006)
2.2.3 Anaerobic Reactors
The main AD processes used for wastewater treatment are classified into two groups:
Suspended growth processes and attached growth (biofilm) processes. The principle
behind these processes relies on microbial activity, and this activity is affected by certain
reactions, reaction kinetics, nutrient utilization, and environmental factors (Soller et al.,
2003).

23
2.2.3.1 Suspended Growth Treatment Processes
Microorganisms are suspended in anaerobic digester as a result of mixing, in suspended
growth systems. There are four types of anaerobic suspended growth systems, these are:
(1) Completely Mixed Suspended Growth Anaerobic Digester
This type digesters are the basic type of anaerobic digesters. First type of process does
not let recycling and concentration of biomass. Thus, sludge retention time (SRT) and
hydraulic retention time (HRT) are equivalent. Suspended growth anaerobic digesters are
commonly used at municipal wastewater treatment plants for the degradation of primary
and secondary sludge. These digesters produce several layers as a result of sludge
degradation. These layers are from top to bottom: biogas, scum, supernatant, active
biomass or sludge, and stabilized solids (Gerardi, 2003). This type of process can be used
in handling dilute toxic waste, soluble and colloidal waste and crude waste. But,
completely mixed suspended growth anaerobic digester process requires extensive
volume to fulfill the necessary sludge retention time (SRT) (Gerardi, 2003).
Figure 8. Completely Mixed Suspended Growth Anaerobic Digester (Gerardi, 2003)
24
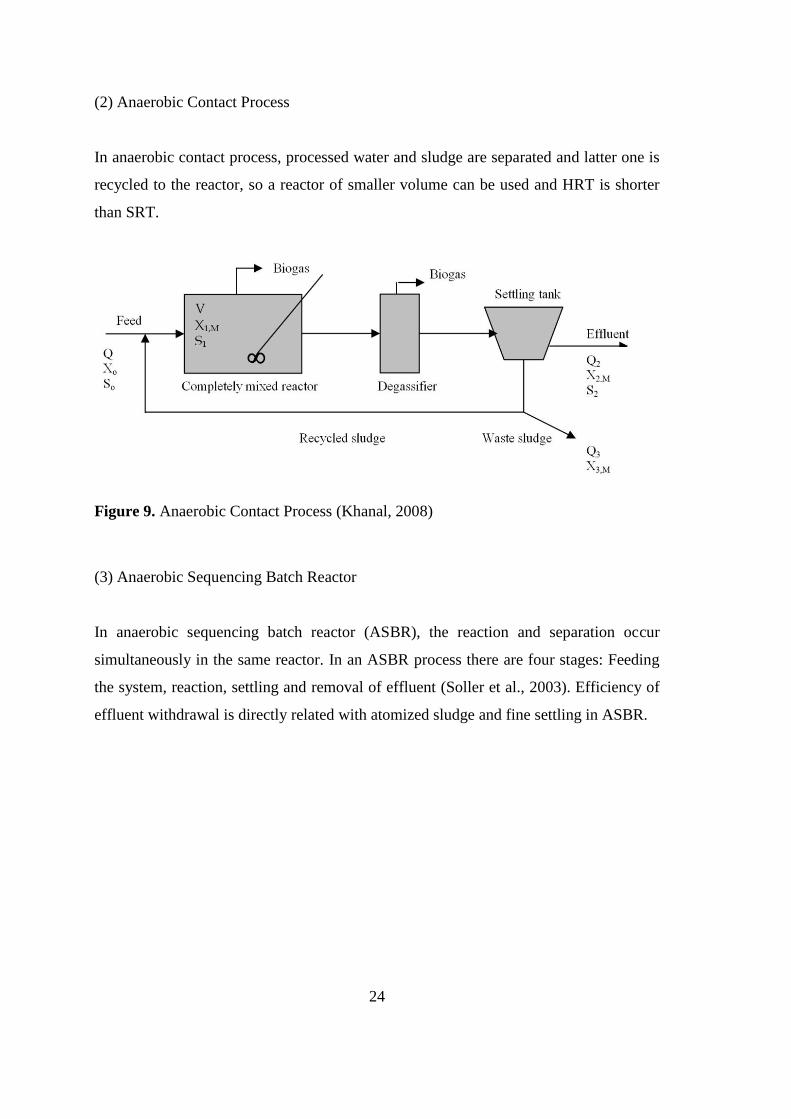
(2) Anaerobic Contact Process
In anaerobic contact process, processed water and sludge are separated and latter one is
recycled to the reactor, so a reactor of smaller volume can be used and HRT is shorter
than SRT.
Figure 9. Anaerobic Contact Process (Khanal, 2008)
(3) Anaerobic Sequencing Batch Reactor
In anaerobic sequencing batch reactor (ASBR), the reaction and separation occur
simultaneously in the same reactor. In an ASBR process there are four stages: Feeding
the system, reaction, settling and removal of effluent (Soller et al., 2003). Efficiency of
effluent withdrawal is directly related with atomized sludge and fine settling in ASBR.

25
Figure 10. Anaerobic Sequencing Batch Reactor (Dague, 1993)
2.2.3.2. Attached Growth Anaerobic Treatment Reactors
There are four types of up-flow attached growth anaerobic reactors:
1) The Anaerobic Up-flow Packed Bed Reactor: Packing material is stabilized and the
wastewater flows through the packed bed covered by the biofilm. Rock or synthetic
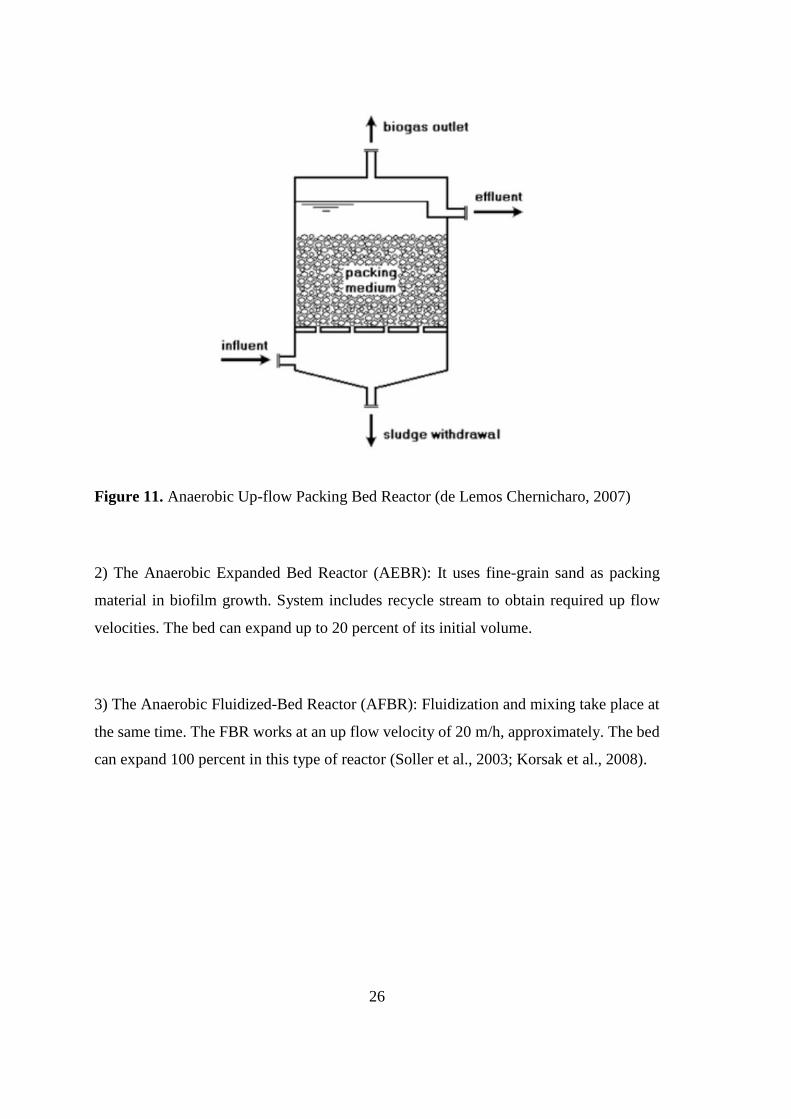
plastic can be used as packing material.
26
Figure 11. Anaerobic Up-flow Packing Bed Reactor (de Lemos Chernicharo, 2007)
2) The Anaerobic Expanded Bed Reactor (AEBR): It uses fine-grain sand as packing
material in biofilm growth. System includes recycle stream to obtain required up flow
velocities. The bed can expand up to 20 percent of its initial volume.
3) The Anaerobic Fluidized-Bed Reactor (AFBR): Fluidization and mixing take place at
the same time. The FBR works at an up flow velocity of 20 m/h, approximately. The bed
can expand 100 percent in this type of reactor (Soller et al., 2003; Korsak et al., 2008).

27
Figure 12. AFBR (Sancinetti et al., 2012)
4) The up-flow anaerobic sludge blanket (UASB).
Up-flow anaerobic sludge blanket reactor (UASB) is one of the most commonly used
anaerobic reactor. UASB was developed in Netherlands by Lettinga and his colleagues
in the second half of 1970’s. Forming a dense atomized sludge is the key of UASB
operation. UASB is consist of granular sludge (Figure 13). Any other packing material
is not needed in UASB reactors. Sludge concentration can be in the range of 5-40 g/L at
the top of the reactor and two to ten times higher at the bottom (50-100 g/L). Greater
COD load can be applied than other AD processes due to the formation of sludge layer
(Lettinga et al., 1980).
Detailed information about UASB is given in part 2.3. UASB.
28
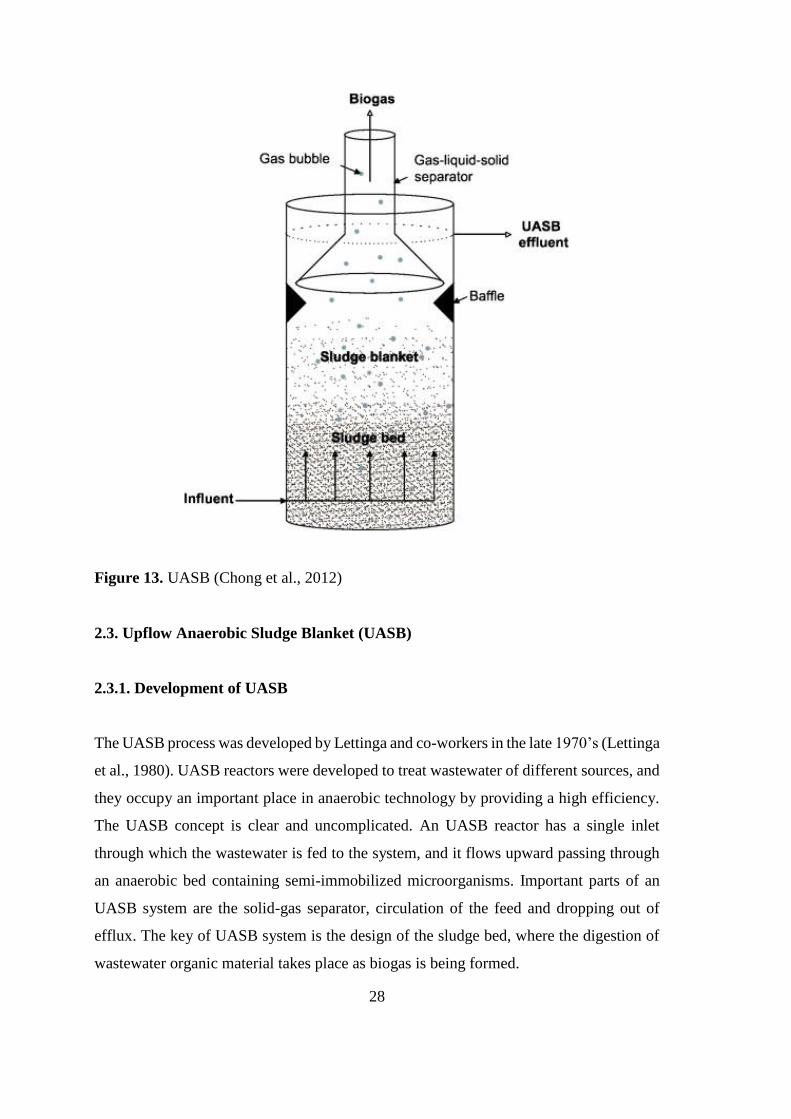
Figure 13. UASB (Chong et al., 2012)
2.3. Upflow Anaerobic Sludge Blanket (UASB)
2.3.1. Development of UASB
The UASB process was developed by Lettinga and co-workers in the late 1970’s (Lettinga
et al., 1980). UASB reactors were developed to treat wastewater of different sources, and
they occupy an important place in anaerobic technology by providing a high efficiency.
The UASB concept is clear and uncomplicated. An UASB reactor has a single inlet
through which the wastewater is fed to the system, and it flows upward passing through
an anaerobic bed containing semi-immobilized microorganisms. Important parts of an
UASB system are the solid-gas separator, circulation of the feed and dropping out of
efflux. The key of UASB system is the design of the sludge bed, where the digestion of
wastewater organic material takes place as biogas is being formed.

29
The biogas formed in digestion zone creates a hydraulic turbulence when flowing upward
in the reactor. By doing so, it provides necessary agitation in the reactor without any need
of additional mixing. The 3-phase separator disassociates liquid phase (water) from solids
and gas, which is placed at the top of an UASB reactor and enhances detainment of
granules (Lettinga, 1995).
Suspended solids which are introduced to the system accumulate in the reactor and
generate the sludge bed where bacteria grow. When conditions are favored in up-flow
anaerobic medium, bacteria commonly amass themselves and form granules and flocs
(Lettinga, 1995).
2.3.2. Technical Details of UASB
The size of the granulated sludge particles ranges from 1.0 to 3.0 mm in diameter (Chou
and Huang, 2005; Veronez et al., 2005; Vlyssides et al., 2008; Yetilmezsoy and Sakar,
2008). Since these aggregates have much higher settling velocities (20-80 m/h) than the
up-flow velocities (0.1-1 m/h), large biomass quantities can accumulate at the bottom. In
this way, a high sludge loading rate (SLR) can be applied (up to 5 g COD / g VSS / day)
with a relatively short hydraulic retention time (HRT), less than 4 hours (Kalyuzhnyi et
al., 2006).
In an UASB reactor, depending upon the concentration levels of accumulated compounds
in the reactor; three distinct zones can be observed which are: A viscous sludge bed zone
at the bottom containing accumulated biomass, a layer covering the sludge bed and
containing suspended solids and the third zone of treated water without any solids in the
inner part (Kalyuzhnyi et al., 2006). The solids concentration can range from 50 to 100
g/L at the bottom and 5 to 40 g/L in a more diffuse zone at the top the UASB sludge
blanket (Soller et al., 2003).
A removal efficiency of 90 to 95 percent for COD has been achieved at COD loadings
ranging from 12 to 20 g COD / l / d on a variety of wastes at temperatures from 30 to

30
35°C (Lettinga, 1995). This loading rates agrees with a survey of 682 full/scale
installations that reported that the average loading rate was 10 g of COD / l / d (Frankin,
2001).
Even the principle of an UASB reactor is simple; the reactions taking place within the
reactor are very complicated. In the sludge bed, the efflux and granulated material form
a solid-liquid system which is in the form of dispersion at up-flow velocities between 0.1-
1.0 m/h (Zeng et al., 2005). Nonetheless, the biogas formed creates a perturbence and
solid-liquid systems turns out to be solid-liquid and gas, which can change the
hydrodynamic behavior of the system. The up-flowing biogas can negatively affect the
complete performance of the system. Although it provides a fine mixing within the
reactor, it also causes some biomass to be lost due to turbulence and launching. It is found
that; biogas provides higher agitation than the up-flow velocities in the system (Gonzalez‐
Gil et al., 2001).
Changes in hydraulic rate directly affect the efficiency of the treatment operations due to
two reasons one of which is associated with hydraulic retention time (HRT). At high
wastewater feeding rates, the water goes through the bed fast enough to hinder the organic
matter utilization. However, high speed can enhance agitation and improve the mass
transfer rate, resulting in an increase in reactor’s performance.
As mentioned above, UASB system improves granulated material formation which
contains high amount of microorganisms in a gram of biomass. None of these
microorganisms alone is able to decompose the organic matter in the wastewater. The
overall decomposition of the substrates is due to the combined effect of many species
(Liu and Tay, 2002).
It is crucial to keep the optimum conditions for anaerobic granules to grow and well
function, if it is aimed to reach a desired level of degradation. The organic loading rate
(OLR) must be high enough to prevent microbial starvation and low enough to control
the growth (Bitton, 1999).

31
Biofilm theory is the most commonly used method to study organic matter decomposition
in the granules. This theory states that substrate transport rate in the film layer controls
the conversion rate in degradation. When the film layer reaches a certain thickness, it
limits mass transfer and some capacity remains unused in the reactor and influent and/or
effluent streams determine the reaction rate (Gonzalez‐Gil et al., 2001).
Substrate is carried via flow in the liquid phase. A boundary layer has been formed near
biofilm surface and at the boundary the flow behavior shifts to laminar. Mass transfer
occurs via diffusion between the turbulent region in the liquid phase and laminar region
at the surface. Substrate is transported by molecular diffusion in the biofilm layer. If the
rate of substrate diffusion in the film and from the surface to the bulk liquid are equal,
substrate does not accumulate on film surface (Christiansen et al., 1995).
There are many studies on the effect of mass transfer on substrate utilization in anaerobic
medium. It is also found that external mass transfer does not limit an anaerobic process
under normal conditions (up-flow velocity greater than 1m/h) (Gonzalez‐Gil et al., 2001).
However, the decrease in mass transfer resistance in the bulk liquid and lower mass
transfer coefficients combined with higher up-flow velocity can improve agitation in the
reactor. The effect of the flow velocity may then be attributed to the reduction of
preferential channeling of the influent wastewater and not to any direct effect on transport
phenomena in the anaerobic biofilm. Moreover, it has to be underlined that biogas
production is much more effective than up-flow velocity on the agitation (Gonzalez‐Gil
et al., 2001).
The main transport mechanism in the biofilm is molecular diffusion, in other words
internal mass transfer. Brito and Melo (1999) stated that, internal mass transfer coefficient
remains constant in laminar flow region, without being affected by hydrodynamic state
of the liquid phase (Brito and Melo, 1999). Moreover, Ting and Huang (2006) claimed
that internal mass transfer resistance must be considered because it is related to total
nitrate removal rate in an UASB system (Ting and Huang, 2006). Kitsos (1992) also
found that at steady-state, diffusivity in an anaerobic film is lower than that in water
(Kitsos et al., 1992).
32
Gonzales-Gil (2001) stated that, concentration of biomass and size of granulated matter
strongly affects the relative substrate uptake rate (Gonzalez‐Gil et al., 2001). Huang
(2003) studied the relation between granule size and reaction kinetics in an UASB system
(Huang et al., 2003). They found that, when UASB reactor operates at high up-flow
velocity, the distance between bulks liquid and solid-liquid interface decreases which
results in increased discharge of COD and bigger granules.
Yan (1997) define an UASB reactor as a “high-rate methane bioreactor with a sludge bed,
or blanket of settled microorganisms through which the wastewater flows upwards” (Yan
and Tay, 1997). The primary asset of a UASB system is that, the highly dense anaerobic
sludge does not require any support for holding (Lettinga et al., 1980; Elias et al., 1999;
Zoutberg and Eker, 1999). Nonetheless, presence and sustainability of precipitable
biomass, either in the form of granules (0.5 to 2.5 mm in diameter) or flocs, are required
due to lack of vector compounds (Callander and Barford, 1983; Lettinga, 1995). There is
no need for pumps to recycle the efflux in a UASB system (Lettinga and Pol, 1991;
Rajeshwari et al., 2000). Since UASB reactors have high-density structure and the sludge
within the reactor is very dissoluble, they work well at high up-flow velocities without
sludge washout (Lettinga and Pol, 1991; Zoutberg and Eker, 1999).
However, there are also some challenges and disadvantages of a UASB system, especially
if the influx rate is low and the influent are not well distributed. If the system is fed too
fast or if biogas is produced intensely, the bed may be perturbed. Then, the UASB reactor
cannot treat the granules and reactor’s performance drops. Other disadvantage is that, to
start-up the process rapidly, sludge should be particulate. However, UASB system
requires less cost than fluidized bed or anaerobic filter systems. Moreover, it is normal to
face sludge washout at the start-up of the process, therefore experience is needed while
operating.
Higher OLR’s are possible in UASB reactors than flocculent sludge bed reactors
(Lettinga et al., 1982). In a flocculent sludge bed reactor, if there is not enough
degradable organic matter in the wastewater, activity of methanogenic bacteria rapidly

33
decreases due to the entrapped dissolved solids. Besides, the drop in methanogenic
activity is irreversible and expected granulation cannot be achieved.
A seed sludge must involve the necessary microbial flora to function well in an UASB
reactor (Tay and Zhang, 2000). Sludge granules grow if there is enough acetate,
propionate, and butyrate in the medium. In mesophilic range, sludge granules can be
classified into three types. Classification is based on the utilization of acetate substrate by
the methanogens bacteria (Lettinga et al., 1984):
1. Rod-type granules: Consist of rod-shaped bacteria in fragments of four to five
cells, (i.e. Methanothrix).
2. Filament-type granules: Consist of long multicellular rod-shaped bacteria.
3. Sarcina-type granules: Developed in the presence of high acetic acid
concentration.
2.3.3. Factors Influencing UASB Reactor Performance
UASB reactor performance depends on several factors such as pH, temperature, nutrients,
toxicity, OLR, F/M ratio, HRT and up-flow velocity.
Effects of nutrients, pH and temperature in UASB are same to all other anaerobic
treatment reactors and explained in Section 2.2.2. Effects of OLR in UASB reactors are
also given in Section 2.3.2. (Technical Details).
2.3.3.1. Hydraulic Retention Time (HRT) and Up-Flow Velocity
The hydraulic retention time (HRT) is defined as the “time that the influent water remains
inside the reactor” (Bitton, 2005). The up-flow velocity is “the liquid velocity crossing a
transverse-cross section of the UASB reactor” whose units are m3 / m2 / h. An increase in
the up-flow velocity may cause a decrease in the fixed film surrounding a granule. It is
aimed to decrease the mass transfer resistance in the bulk liquid surrounding the granule.
Thus, mass transfer between bulk liquid and granule will increase by also increasing the

34
substrate utilization and growth of the bacteria. The range of up-flow velocity is 0.1-1.4
m/h (Kalyuzhnyi et al., 2006; Korsak et al., 2008). In an UASB reactor, both the blanket
and the sludge bed have dissolved particles, and wastewater to be refined flows upward
through them together with the formed biogas. So, even the influx wastewater is fed at a
slow rate, flow behavior cannot be uniform because of the mixing caused by biogas and
the existence of granules. All of these, regulates the “residence time distribution” (RTD).
There are many studies on predicting the hydraulic conditions within an UASB system,
in which residence time distribution (RTD) tests were applied (Levenspiel, 1999; Borroto
et al., 2003; Singh et al., 2006; Atmakidis and Kenig, 2009). In the study of Atmakidis
and Kenig (2009), resident time distribution in a fixed bed reactor was investigated via
tracer and post-processing method. Tracer method suggests injecting an inert tracer into
the reactor, whereas the post-processing method is based on velocities and measures the
residence time distribution directly from them. Atmakidis and Kenig (2009) concluded
that, both methods yielded close results and there is no significant difference between
them. However, the post-processing method has an advantage over the trace method,
which is the minor requirement for computational time.
2.3.4. Treatment of Different Wastewaters with UASB
World facing severe problems of collection, treatment and disposal of effluents due to
rapid industrialization and urbanization. UASB is one of the anaerobic treatment
reactors that converts the waste water organic pollutants into small amount of sludge
and large amount of biogas as a source of energy (Hampannavar and Shivayogimath,
2010). UASB is applicable for treating variety of industrial wastewaters like, sugar
industry waste water, dairy waste water, textile waste water, slaughterhouse waste
water, oil industry waste water, potato processing waste water, distillery waste water
and domestic wastewater (Table 3).

35
Table 3. Wastes Treated with UASB
Type of
WW
Influent
COD
(g/l)
OLR
(g COD
/ l/d)
HRT
(d)
COD
Removal
Eff (%)
Methane
Production
or Yield
(l CH4/d)
References
POME 42.50 10.63 4.00 96.00 6.90 (Borja and Banks,
1994)
POME 30.60 30.00 1.02 90.00 7.00 (Borja et al., 1996)
POME 50.00 15.50 3.33 80.50 7.00 (Chaisri et al.,
2007)
POME 5.8
gvs/l/d 5.00 >90
436 (ml CH4 /
g vs)
(Fang, Sompong,
et al., 2011)
POME deoiled 2.6
gvs/l/d 5.00
600 (ml CH4 /
g vs)
(Fang, Sompong,
et al., 2011)
Recalcitrant
Distillery 10.00 19.00 0.53 67.00 3.50
(Harada et al.,
1996)
Malt whiskey 20.92 17.20 1.22 92.00
238.00 (ml
CH4 / g
COD)
(Uzal et al., 2003)
Grape wine
Distillery 30.00 18.00 1.67 90.00
(Wolmarans and
De Villiers, 2004)
Grain Distillation 5.10 18.40 0.28 90.00 (Laubscher et al.,
2001)
Winery 6.40 5.10 1.25 86.00 (Keyser et al.,
2003)
Potato 2.5/5.1 4 / 10 240 (ml CH4 /
g vs)
(Fang, Boe, et al.,
2011)
Potato 5.30 /
18.10 14 0.6 / 6 75.00
(Kalyuzhnyi et al.,
1998)
Potato 20.3 1.5 / 6.1 13.2 /
2.8 93.00
230 (ml CH4
/ g COD)
(Parawira et al.,
2006)
Olive mill 5 0.33 /
1.67 3 35 / 70
(Katsoni et al.,
2014)
Olive mill 40 8 5 80 / 85 300 (ml CH4 /
g COD)
(Sabbah et al.,
2004)
Dairy 37.00 6.20 6.00 98.00 (Gavala et al.,
1999)

36
Table 3 Cont.
Dairy 79.00 7.50 0.66 74.00 16.00 (Nadais et al.,
2006)
Dairy 13.50 22.00 2.00 97.00 54.00 (Nadais et al.,
2005)
Dairy 12.48 12.48 1.00 90.00 (García et al.,
2008)
Digested cowdung
slurry 1.80 13.50 0.13 90.00
(Ramasamy et al.,
2004)
Cheese whey 55.10 11.10 4.95 95.00 424 (ml CH4 /
g COD
(Ergüder et al.,
2001)
Cheese whey 0,5 /
28.5
2.5 /
10.5 >95
(Kalyuzhnyi et al.,
1996)
Cheese whey 37.00 6.20 6.00 98.00 (Gavala et al.,
1999)
Cheese whey -
Dairy Manure 35.30 20.90 2.20 95.75
13,2
(l CH4/l/d) (Rico et al., 2015)
Dairy Manure 16.5-
20.43 8.90 2.00 84.90
368
(ml/ g COD)
(García et al.,
2008)
Mixed Sardine
&Tuna Canning 2.72 8.00 0.33 80 / 90
(Palenzuela-
Rollon et al.,
2002)
Slaughterhouse
Waste 1.20 3.50 0.33 70.00 6500.00
(Sayed et al.,
1984)
Poultry Slaughter 5.50 28.70 0.19 95.00 (Chávez P et al.,
2005)
Slaughterhouse
Waste 4.20 4.60 0.92 89.00
(Caixeta et al.,
2002)
Slaughterhouse 2.87 30.00 0.10 90.00 280.00 (Torkian et al.,
2003)
Piggery Waste 8.12 1.62 5.00 75.00 2.37 (Sanchez et al.,
2005)
Domestic WW 0.39 1.21 0.32 85.00 (Behling et al.,
1997)
Municipal WW 3.20 1.05 0.42 86.00 1.10
(Singh and
Viraraghavan,
1998)

37
2.3.5. Anaerobic Digestion of Pistachio Processing Wastes
Anaerobic treatability and biogas production potential of pistachio wastewater were
studied only in batch systems by our research group (Çelik and Demirer, 2015; Demirer,
2016). These studies indicated that anaerobic digestion can be an attractive option not
only for the management of pistachio processing wastes, but also producing renewable
energy in the form of biogas (Demirer, 2016).
It’s reported by Demirer that pistachio processing solid waste and mixtures in various
ratios was anaerobically digestable in varying levels of performance such that one liter of
pistachio processing wastewater which has a COD concentration of 30 g/l produced 0.7
liters of methane, one liter of pistachio processing wastewater which has 20 g addition of
pistachio de-hulling solid waste produced 1.25 liters of methane and one gram of
pistachio de-hulling solid waste produced 62.6 ml of methane (Demirer, 2016).
Also pretreatment studies for pistachio de-hulling solid waste were conducted. Çelik and
Demirer indicated that in chemical pre-treatment of pistachio de-hulling processing solid
waste NaOH and HCl were used and 13 – 26.4 % and 4.4 – 6.2 % of solubilisation of
COD achieved, respectively in chemical pre-treatment. Thermal pre-treatment studies
were conducted by using an autoclave at 121 °C and 15 Psi for two different time periods,
namely 5 and 15 min were used, which provided COD solubilisation values of 1 ± 0.86
% and 4.50 ± 1.27 % respectively for 5 and 15 minutes and an oven at 121 °C for two
different time periods, namely 5 and 15 min were used and for oven pre-treatment and
0.50 ± 0.37 % and 2.30 ± 1.11 % of COD solubilisation achieved respectively for 5 and
15 minutes thermal treatment. (Çelik and Demirer, 2015). After pre-treatment studies
Biochemical Methane Potential (BMP) tests were also conducted and it was reported that
both COD removal values and observed methane yields were improved relative to raw
samples from 13.1 – 35.7 % to 36.2 – 54.9 % and from 42.2 – 73.4 ml CH4 / g COD to
78.5 – 213.4 ml CH4 / g COD respectively (Çelik and Demirer, 2015).

38
39
CHAPTER 3
MATERIAL AND METHODS
This chapter covers the material and methods, and experimental procedures of the study.
As mentioned in Section 2.1.2 (Pistachio Industry in Turkey), in this study the
wastewater, which is generated in the pairing stage of pistachio and filtered from 2 -3 mm
sieves was examined. In this study, main tasks conducted were characterization of
pistachio wastewater, setting up and operating the UASB reactors, effluent
characterization and biogas measurement. As it is explained in Section 3.2, four UASB
reactors were used in the experiments.
The feeding process was done at two-day intervals. Pistachio processing wastewater,
stored in the refrigerator, used for experiments. After COD analysis of pistachio
wastewater, it is diluted for the organic loading rate (OLR) adjustment and BM or
alkalinity was added. Pistachio processing wastewater was fed to the UASB reactors after
the preparation stage complete.
3.1 Characterization of Pistachio Processing Wastewater
First step of the study was characterization of the pistachio processing wastewater. The
wastewater was produced in pistachio paring process and taken from TADIM Gaziantep
Pistachio Processing Factory. Before being used the wastewater was filtered from 2 mm
pore size course filter. The retantate and filtrate of filtering process was named as solid
waste and wastewater, respectively. The characterization studies were conducted by the
measurement of Chemical Oxygen Demand (COD), Total Kheldal Nitrogen (TKN), Total
Phosphorus (TP), Total Solids (TS), Volatile Solids (VS), Total Suspended Solids (TSS),
Volatile Suspended Solids (VSS) parameters for wastewater and Soluble Chemical
Oxygen Demand (sCOD), Total Chemical Oxygen Demand (tCOD), TS, VS for solid
waste. The methods employed were described in the following sections.

40
3.1.1. Chemical Oxygen Demand (COD)
Two main methods are used in COD determination tests. For solid waste standard
methods 5220 B : Open Reflux Method (APHA, 2005) was used. For wastewater COD
analysis EPA approved reactor digestion method (for COD range of 0-1500mg/l) (Hach
Water Analysis Handbook, 2012). For wastewater COD analysis Aqualytic AL 38 heater
and PC Multidirect Spectrophotometer (program 130-131) were used.
3.1.2. Total Kjeldahl Nitrogen
TKN analysis are done by standard methods 4500-Norg B. Macro Kjeldahl Nitrogen
method (APHA, 2005).
3.1.3. Total Phosphorus
TP analysis are done by standard methods ‘4500-P F. Automated Ascorbic Acid
Reduction Method’(APHA, 2005).
3.1.4. Total Solids
TS determination are done with standard methods ‘2540 B Total Solids Dried at 103–
105°C method. (APHA, 2005)
3.1.5. Volatile Solids
Volatile Solids analyses are done by standard methods ‘2540 E Fixed and Volatile Solids
Ignited at 550°C’ method.
41
3.1.6. Total Suspended Solids
For determining TSS value, standard methods ‘ 2540 D. Total Suspended Solids Dried at
103–105°C’ (APHA, 2005) method is used.
3.2 Experimental design and setup
Lab-scale UASB (Up-flow Anaerobic Sludge Blanket) reactors were used in the
experiments. Study includes two experimental setups. Two different granules, two
different HRTs and two different reactor models were used to control the applicability of
UASB reactors for the anaerobic treatability of pistachio processing wastewater and
biogas producing potential. In second setup, the HRT was adjusted as 5.4 days, the closest
to the first setups HRT which was 4 days, in the constraints of the pump. In both setups
two UASB reactors were employed. The reactors in the first and second setups were
named as UASB 1 and UASB 2 and UASB 3 and UASB 4, respectively.
3.2.1. First Setup
In first setup, two UASB reactors (Figure 14), with 700 ml effective volumes, were
employed. The granular anaerobic sludge taken from Anadolu Efes Beer Factory
wastewater treatment plant were used as seed in both reactors. Characterization of the
granules taken from Anadolu Efes Beer Factory is given in Table 4. Cole Parmer
Masterflex C/L peristaltic pumps were used to feed the reactors.

42
Table 4. Characterization of Granular Seed Taken From Anadolu Efes Beer Factory
Parameters Granules from Anadolu Efes Beer Factory
tCOD (mg/l) 25469 ± 218
TS (mg/l) 26354 ± 311
VS (mg/l) 21032 ± 108
VS/TS (%) 79.8
TKN (mg/l) 985 ± 35
TP (mg/l) 562 ± 48
The dimensions of the first two reactors were given in Figure 14.
Figure 14. Drawings of UASB 1&2 Reactors and GLS Separators
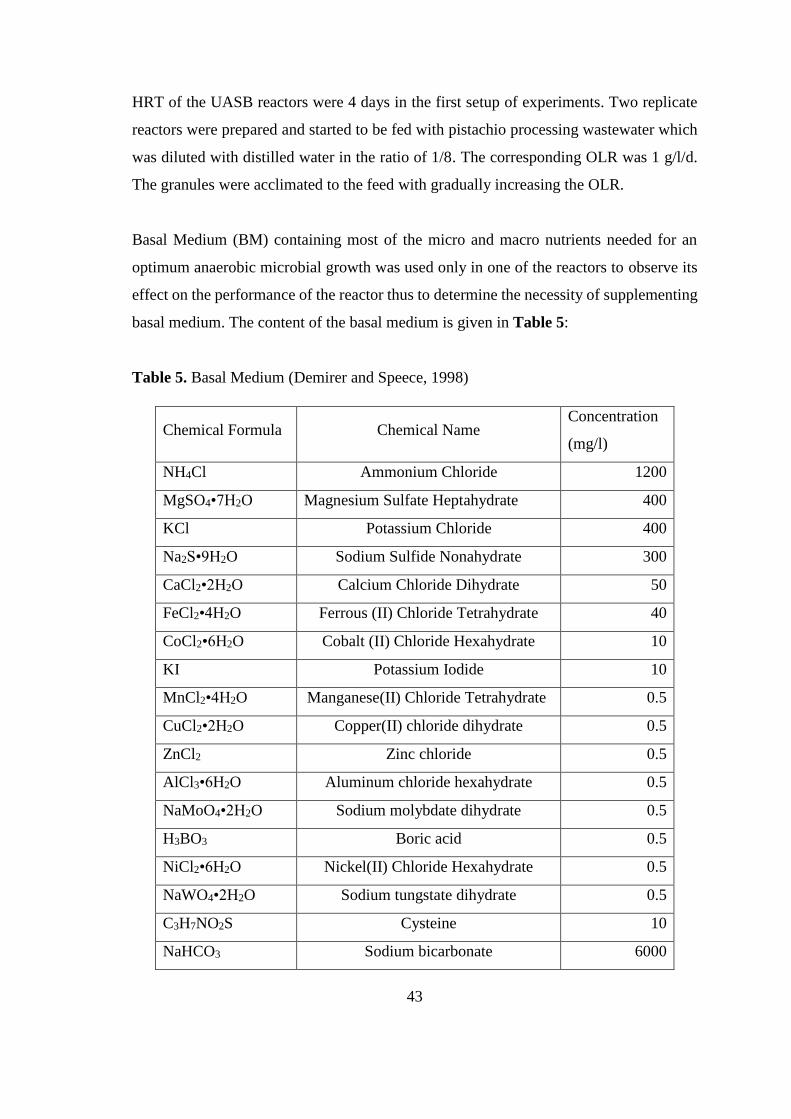
43
HRT of the UASB reactors were 4 days in the first setup of experiments. Two replicate
reactors were prepared and started to be fed with pistachio processing wastewater which
was diluted with distilled water in the ratio of 1/8. The corresponding OLR was 1 g/l/d.
The granules were acclimated to the feed with gradually increasing the OLR.
Basal Medium (BM) containing most of the micro and macro nutrients needed for an
optimum anaerobic microbial growth was used only in one of the reactors to observe its
effect on the performance of the reactor thus to determine the necessity of supplementing
basal medium. The content of the basal medium is given in Table 5:
Table 5. Basal Medium (Demirer and Speece, 1998)
Chemical Formula Chemical Name Concentration
(mg/l)
NH4Cl Ammonium Chloride 1200
MgSO4•7H2O Magnesium Sulfate Heptahydrate 400
KCl Potassium Chloride 400
Na2S•9H2O Sodium Sulfide Nonahydrate 300
CaCl2•2H2O Calcium Chloride Dihydrate 50
FeCl2•4H2O Ferrous (II) Chloride Tetrahydrate 40
CoCl2•6H2O Cobalt (II) Chloride Hexahydrate 10
KI Potassium Iodide 10
MnCl2•4H2O Manganese(II) Chloride Tetrahydrate 0.5
CuCl2•2H2O Copper(II) chloride dihydrate 0.5
ZnCl2 Zinc chloride 0.5
AlCl3•6H2O Aluminum chloride hexahydrate 0.5
NaMoO4•2H2O Sodium molybdate dihydrate 0.5
H3BO3 Boric acid 0.5
NiCl2•6H2O Nickel(II) Chloride Hexahydrate 0.5
NaWO4•2H2O Sodium tungstate dihydrate 0.5
C3H7NO2S Cysteine 10
NaHCO3 Sodium bicarbonate 6000

44
Basal medium was not used in the start-up of the reactors due to the fact that earlier
experimental work in our laboratory to determine the Biochemical Methane Potential
pistachio wastes revealed that treatment efficiency and methane yield were not improved
by adding Basal medium input at lower COD concentrations. Basal medium addition was
started after the influent COD concentration of the wastewater reached to 10000 mg/l.
3.2.2. Second Setup
In second experimental setup, two UASB reactors were used. In the first setup, the
effluent weir was rarely blocked because of the washout granules. When the effluent weir
is blocked, the effluent filled into the gas collecting bags. Therefore UASBs were
redesigned and used in the second series of the experiments. Effective volume of the
reactors were expanded from 700 ml to 2 l, one more baffled section was added therefore,
baffled section had been extended. Effluent weir was also enlarged (Figure 15).
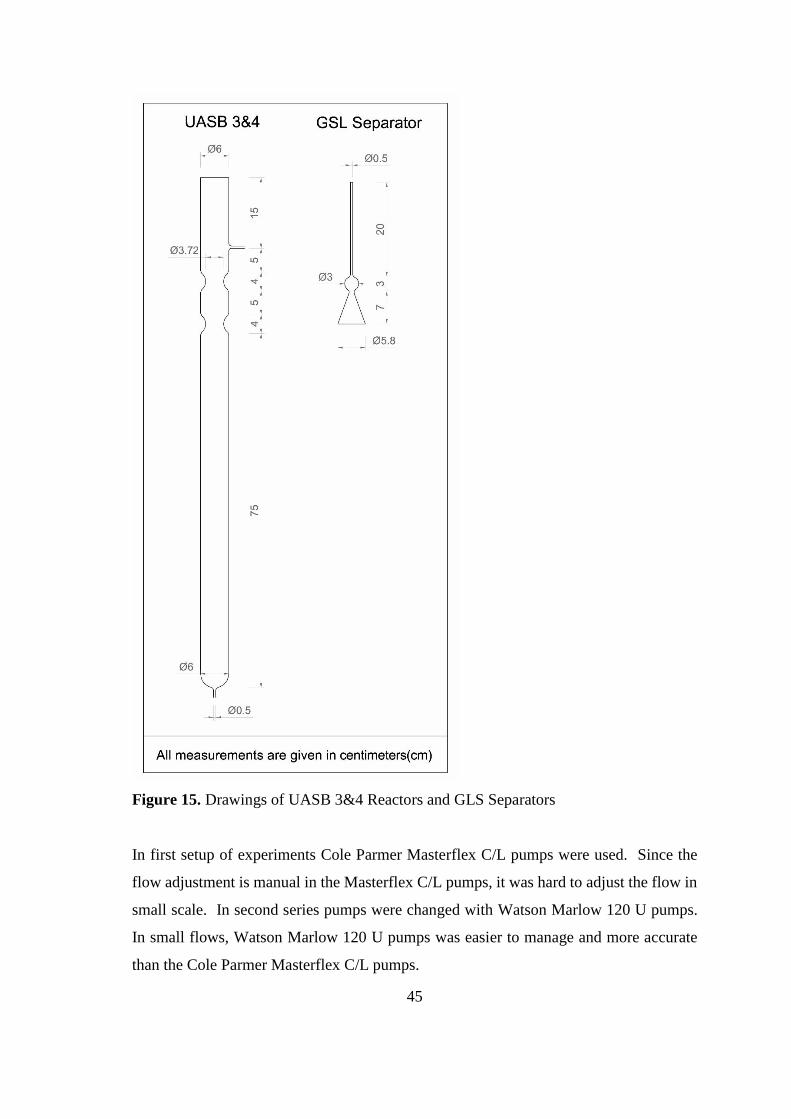
45
Figure 15. Drawings of UASB 3&4 Reactors and GLS Separators
In first setup of experiments Cole Parmer Masterflex C/L pumps were used. Since the
flow adjustment is manual in the Masterflex C/L pumps, it was hard to adjust the flow in
small scale. In second series pumps were changed with Watson Marlow 120 U pumps.
In small flows, Watson Marlow 120 U pumps was easier to manage and more accurate
than the Cole Parmer Masterflex C/L pumps.

46
In this experimental setup, the granules taken from Amasya Özmaya Yeast Factory
Wastewater Treatment Plant were used as the seed (Table 6).
Table 6. Characterization of Granular Seed Taken From Amasya Özmaya Yeast Factory
Parameters Granules from Amasya Özmaya Yeast Factory
tCOD (mg/l) 27106 ± 152
TS (mg/l) 34310 ± 232
VS (mg/l) 29850 ± 132
VS/TS (%) 87
TKN (mg/l) 896 ± 21
TP (mg/l) 482 ± 36
The same basal medium (Table 5) was used from the start up in second set of reactors
but only in one of the reactors. The UASB 3 reactor was ran without BM except alkalinity
addition. The reason for operating the UASB 3 reactor was examining the effects of the
BM in anaerobic treatability of pistachio waste. As experienced from the first set of
UASB reactors, alkalinity addition was needed to stabilize pH, therefore only alkalinity
addition was applied. For alkalinity addition sodium bicarbonate was used. The UASB 4
was operated with BM. All the other parameters (influent COD, HRT, OLR, pH,
Temperature) were the same for UASB 3 and UASB 4.
After the first set, it was decided to increase the HRT for increasing the treatment
efficiency and biogas yield. In second set, the UASB reactors were operated with the HRT
of 5.4 days. The reactors were fed with diluted pistachio wastewater as in the first set.
The dilution ratio was arranged to set the OLR to 1 g/l/d. The OLR increased regularly
with the acclimation of the granules (Section 4.2 & 4.3; Figure 17, Figure 18, Figure
19, Figure 20). COD removal efficiency was considered as an indicator of steady state
phase. When the deviation in the COD treatment efficiency became less than 10 % for 3
- 5 measurements it was accepted as steady state. When reactors reached the steady state,
OLR was increased.

47
In second series pH of the reactors ranged between 7.8 & 8.2.
The wastewater was taken again from TADIM Gaziantep Pistachio Processing Factory.
But for the second experimental setup, the wastewater was received in two different
batches. Sufficient the wastewater was kept in – 20 ºC deep freeze refrigerator until used.
The operation parameters such as effective volume of reactors, times of operation, HRT
of the reactors and BM usage for reactors in both setups are given in Table 7.
Table 7. Operational Parameters
Reactor
Name
Operational Parameters
Effective
Volume (ml)
Operated
Days
HRT
(days) BM Addition
UASB 1 700 180 4 BM Addition (days 60 – 177)
UASB 2 700 150 4 BM Addition ( days 0 – 149)
UASB 3 2000 145 5.4 Only Alkalinity Addition
( days 0 - 143 )
UASB 4 2000 145 5.4 BM Addition ( days 0 – 143)
3.3 Experimental Analyses
Reactors were fed continuously. In every two days, the substrate was prepared for
feeding. In this preparation, the wastewater’s COD measurement was done and diluted
with distilled water. The dilution rate was arranged according to the experimental
configuration. In both of the experimental setups, COD analyses of influent and effluent
were done once in two days. All the analyses were done with duplicates and the average
values were used to draw the graphs.
Gas measurements were done once every two days. Initially, the biogas produced was
directly collected in the water displacement device. But after experiencing some technical
inadequacies, the produced biogas was collected in 10 L tedlar bags. The volume of the
gas produced was measured in water displacement device (Figure 16). Biogas

48
composition was periodically determined with a gas chromatograph (Thermo Electron
Co.) equipped with a thermal conductivity detector (TCD). Produced biogas was
separated as H2, CO2, O2, CH4 and N2 by using serially connected columns (CP-Moliseve
5A and CP- Porabond Q) at a fixed oven temperature of 45 ºC. Helium was used as carrier
gas at 100 kPa constant pressure. The inlet and detector temperatures were set to 50 ºC
and 80 ºC, respectively.
Figure 16. Water Displacement Device

49
CHAPTER 4
RESULTS AND DISCUSSION
In this chapter, the characterization of the pistachio processing wastewater used and the
experimental results obtained from the UASB reactors operated are presented.
4.1. Characterization of Pistachio Processing Wastewater
The results of the characterization of pistachio processing wastewater is given in Table 8.
Based on the COD values, this wastewater could be considered as a high strength
wastewater. Thus, it is not feasible to treat this wastewater with conventional activated
sludge process.
C/N/P ratio is 1000/1.06/4.26. It is observed that TKN of the pistachio wastewater is
below the desired values but this can be overcome by BM addition. Phosphorus
concentration is in agreement with desired C/N/P ratio for optimum anaerobic treatment.
The influent total solids concentration should be less that 10000-15000 mg/l for a UASB
reactor. Thus, it has to be filtered before feeding the UASB to prevent clogging.

50
Table 8. Pistachio Process Wastewater Characteristics (Demirer, 2016)
Parameter Pistachio Process Wastewater
Total Chemical Oxygen Demand (tCOD) 41400 mg/l
Soluble Chemical Oxygen Demand (sCOD) 27000 mg/l
Total Kjehldal Nitrogen (TKN) 28.47 mg/l
Total Phosphorus (TP) 115.0 mg/l
Total Solids (TS) 27953 mg/l
Volatile Solids (VS) 16653 mg/l
Total Suspended Solids (TSS) 15575 mg/l
Volatile Suspended Solids (VSS) 14800 mg/l
In the harvesting season fresh pistachio processing wastewater was taken from Gaziantep
Tadım Pistachio Processing Factory. After the fresh pistachio processing wastewater
were taken, it was used in the reactors. In the section 4.2 and 4.3, the reasons and the time
of the fresh pistachio processing wastewater usage was explained. The fresh pistachio
processing wastewater characteristics were given in the Table 9.
Table 9. Fresh Pistachio Processing WW Characteristics
Parameter Fresh Pistachio Processing WW
Total Chemical Oxygen Demand (tCOD) 49800 mg/l
Soluble Chemical Oxygen Demand (sCOD) 35362 mg/l
Total Kjehldal Nitrogen (TKN) 27.95 mg/l
Total Solids (TS) 26521 mg/l
Volatile Solids (VS) 17016 mg/l

51
4.2. First Setup
In first setup, two 700 ml UASB reactors were used. UASB 1 and UASB 2 were
replicates. They both had the same operation conditions and therefore had the same
problems. At first, both reactors had a pH drop caused by lack of alkalinity which is
explained in part 4.2.1.
As can be followed from the Figure 17 & Figure 18, beyond the period of low pH values
(days 50 - 70 for UASB 1 & 10 – 40 for UASB 2 ), the COD removal efficiency of the
UASB 1 and UASB 2 increased to 73.8 and 90%., respectively (Figure 17, b & Figure
18, b).
In both UASB 1 and UASB 2 reactors (Figure 17, b & Figure 18, b), there were some
decrease in COD removal efficiency between the days 70 – 100 for the first reactor and
between the days 30 – 60 for second reactor. During these periods, the COD removal
efficiencies were 63.45 ± 7.42 and 71.18 ± 5.92 for UASB 1 and UASB 2, respectively.
Feeding was immediately stopped and a series of tests were done to find the origin of the
problem. UASB 1 and UASB 2 reactors were not operated for 5 days. The gaps in the
Figure 17 and Figure 18 were reasoned from this situation. The parameters alkalinity,
TAN, TKN and Nitrate analyses were made to find the problem. The origin of the nitrate
was found as the distilled water used for dilution of the wastewater for OLR adjusting
purposes. Technical problems in the water distillation unit caused the increase of nitrate
in the distilled water to 40 ± 2.3 mg/l. As the performance of the reactors increase after
the nitrate inhibition stopped, it was decided that the nitrate inhibition was the factor
causing the drop in COD removal and biogas production performance. After the problem
found and solved, the COD removal efficiencies of both reactors were increased (Figure
17, b & Figure 18, b).
In both reactors, biogas production was observed. At first, the system was directly
connected to water displacement device but some problems were encountered. Because
of the pressure difference between water displacement device and water source of the
system, water level was not stable in the UASB. Thus, the measurement system was
52
changed and 10 L tedlar bags were used to collect the produced biogas. Then, the biogas
collected in tedlar bags was transferred to the water displacement device to determine the
volume of the produced biogas.
The highest methane yield observed was 262 ml CH4/ g CODreduced in UASB 1 reactor
and 363 ml CH4 / g CODreduced in UASB 2 reactor. For the UASB 1, the maximum
methane yield was observed between the days 108 – 119 with the OLR increase from 1.2
– 1.5 g/L/d to 2.9 – 3.3 g/L/d (Figure 17, f). But after days 135 - 140, COD removal
efficiency of the UASB 1 reactor dropped. Thus, the OLR was decreased to 1.5 g/L/d to
prevent overloading and acidification of the reactor. After the COD removal performance
increased to % 80 (Figure 18, b), the OLR was increased to 3.5 – 4.5 g/l/d but the
maximum methane yield of 262 ml CH4/ g COD reduced could not be reached again.
After the first reactors performance recovered, the COD removal efficiency was stabilized
around 80 % (Figure 18, b). The maximum COD removal efficiencies observed in the
UASB 1 and the UASB 2 reactor were % 88.9 and % 91.3, respectively.
The summary of the operational parameters and performance of the first setup is provided
in Table 10.

53
Table 10. Results of UASB1 & UASB2
Stage 1 Stage 2 Stage 3 Stage 4 U
AS
B 1
Days 0 - 108 108 - 127 127 - 145 145 - 177
Influent COD (mg/l) 5503.22
± 1087.62
11613.57
± 1097.91
7543.03
± 71.04
19971.05
± 3583.11
Ave. OLR (g/l/d) 1.375 ±
0.275
2.88 ±
0.33
1.89 ±
0.02
4.99 ±
0.94
Ave. COD Removal Efficiency (%) 70.8 ± 9.9 78.51 ±
4.25
75.27 ±
2.12
83.65 ±
4.55
Ave. Methane Yield (ml/g) 131.00 ±
7.86
178.48 ±
5.35
187.70 ±
1.21
140.20 ±
1.26
UA
SB
2
Days 0 - 76 76 - 96 96 - 114 114 - 149
Influent COD (mg/l) 4476.45
± 926.31
11528.57
± 1239.99
7543.03
± 71.04
19754.09
± 3494.14
OLR (g/l/d) 1.07 ±
0.479
3.21 ±
0.80
1.81 ±
0.08
6.05 ±
1.27
Ave. COD removal Efficiency % 70.82 ±
6.93
82.35 ±
3.32
77.80 ±
1.54
86.18 ±
5.61
Ave. Methane Yield (ml/g) 110.92 ±
5.24
205.42 ±
9.09
146.60 ±
4.98
165.37 ±
3.21
4.2.1. UASB 1
During first 30 days (average Inf COD = 6084.14 ± 1292.12, average OLR = 1.47 ± 0.28),
COD removal efficiency increased from 50% to 82% in UASB 1. However, the COD
removal efficiency started to decrease afterwards and a dramatic pH drop to 5.5 was
observed after day 60. BM addition was started on the day 60 to solve this problem. The
pH was increased to 7.5 in the UASB 1 reactor by adding BM but the COD removal
efficiency remained to be around 55%. Between days 60 and 85, the reactor was
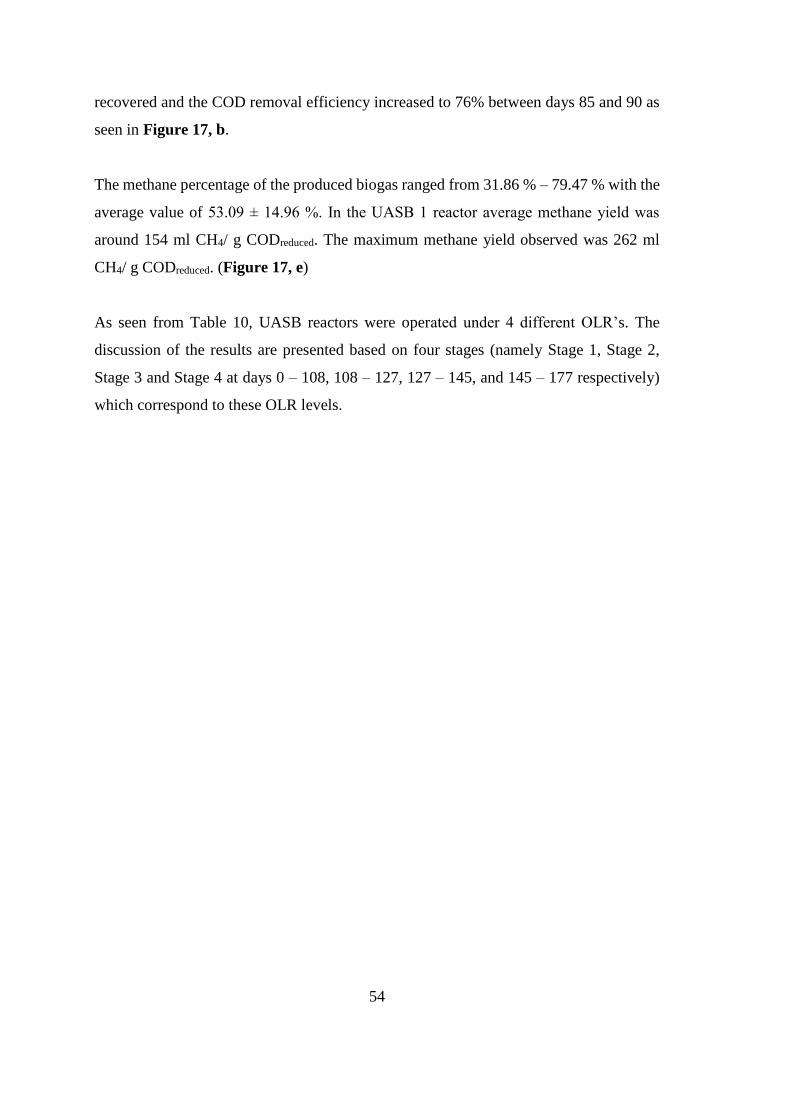
54
recovered and the COD removal efficiency increased to 76% between days 85 and 90 as
seen in Figure 17, b.
The methane percentage of the produced biogas ranged from 31.86 % – 79.47 % with the
average value of 53.09 ± 14.96 %. In the UASB 1 reactor average methane yield was
around 154 ml CH4/ g CODreduced. The maximum methane yield observed was 262 ml
CH4/ g CODreduced. (Figure 17, e)
As seen from Table 10, UASB reactors were operated under 4 different OLR’s. The
discussion of the results are presented based on four stages (namely Stage 1, Stage 2,
Stage 3 and Stage 4 at days 0 – 108, 108 – 127, 127 – 145, and 145 – 177 respectively)
which correspond to these OLR levels.
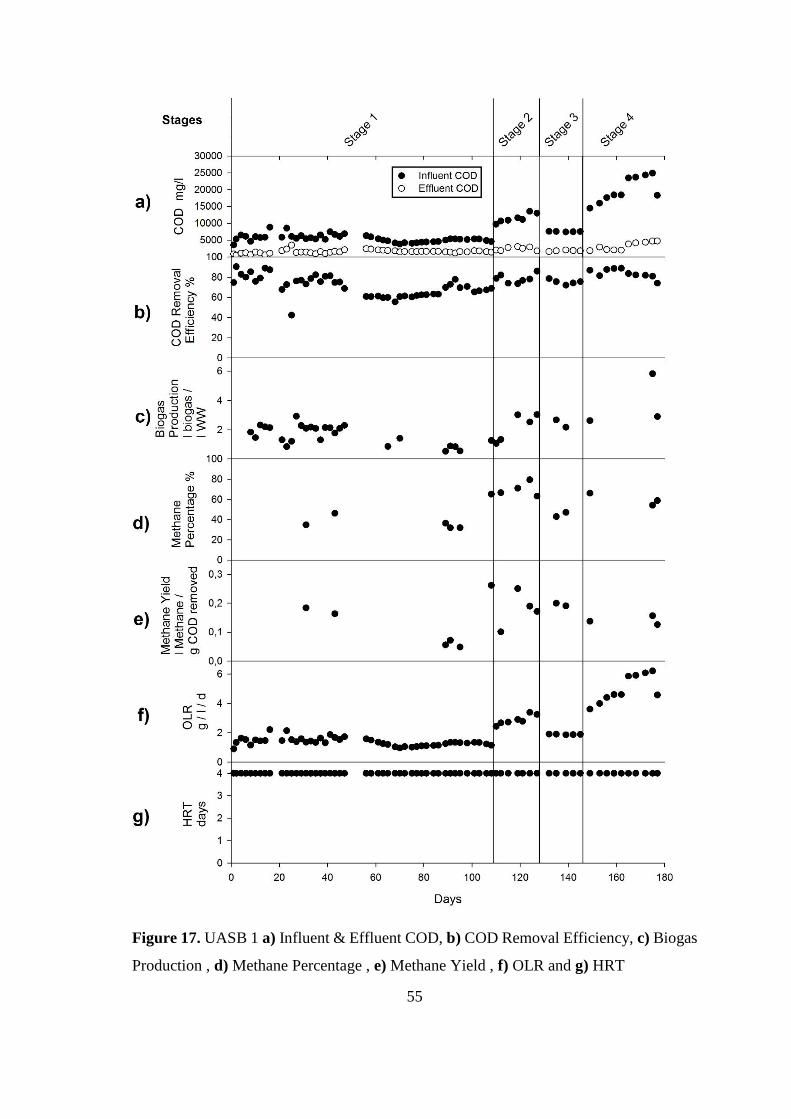
55
Figure 17. UASB 1 a) Influent & Effluent COD, b) COD Removal Efficiency, c) Biogas
Production , d) Methane Percentage , e) Methane Yield , f) OLR and g) HRT

56
4.2.1.1. Stage 1
The first stage of the UASB 1 reactor was 108 days. Initially, the OLR was adjusted to 1
– 1.5 g/l/d. The average OLR value was 1.375 ± 0.275 g/l/d.
Initially, the wastewater was diluted with distilled water with a ratio of 1/8. It was planned
to operate the reactor in the same conditions until it reached to steady state conditions and
then the OLR would be increased gradually. The expected period was around 30 - 40 days
for stage 1. But there was a very high fluctuation in the COD removal efficiency and the
biogas yield. Therefore, Stage 1 was extended way beyond 30-40 days. After 20 days of
operation, the COD removal efficiency started to decrease and after 30 days, a pH
dramatic drop was observed. As a response, BM addition was started. After the pH
problem was handled, UASB 1 was recovered in two weeks. But another inhibition was
observed after day 47 (Figure 17 , b). Biogas production stopped and the COD removal
efficiency dropped from 78% to 60 %. After a series of tests the problem was determined.
Nitrate concentration of the dilution water was measured to be 40 ± 2.3 mg/l which was
due to problem in the water distillation equipment. To solve this problem, the dilution
water was replaced with ultra-pure water. This change resulted in the recovery of the
performance of the reactor in around 30 days and the UASB 1 reached back to steady
state conditions.
In Stage 1, the average COD removal efficiency was 70.8 ± 9.9 %. The average COD
removal efficiency before the nitrate inhibition was 77.4 ± 9.6 %. It was reduced to 63.45
± 7.42 due to nitrate problem. Banihani (2009) reported that 8.3 – 121 mg/l NO3-N may
cause nitrate inhibition and negative effects on anaerobic processes (Banihani et al.,
2009). NO3-N of the dilution water was measured as 40 mg/l and the recovery of the
reactor after changing the dilution water source is in agreement with the literature about
nitrate inhibition.
57
4.2.1.2. Stage2
The second stage of the operation of UASB 1 reactor was lasted between the days 108
and 127. The OLR was adjusted to 2.43 – 3.25 g/l/d by increasing the influent COD. Since
the HRT of the system was constant, OLR was directly proportional to influent COD. The
OLR was increased gradually from 2.43 to 3.25 g/l/d (Figure 17, b). The average OLR
was 2.88 ± 0.33 g/l/d. COD removal efficiency in Stage 2 was higher than Stage 1. The
increase in the OLR affected the performance of the system and the average COD removal
efficiency was observed as 78.51 ± 4.25 %.
4.2.1.3. Stage 3
The third stage of the operation of UASB 1 reactor lasted between the days 127 and 145.
The average OLR was 1.89 ± 0.02 g/l/d. The significant decrease in OLR was due to the
stalling of the remaining pistachio wastewater used. As mentioned in literature review
part (Section 2.1.3.1), pistachio harvested in September and stored. The pairing process
is done throughout the year. The fresh pistachio processing wastewater was collected and
used in and beyond Stage 3 (Table 9). Due to the use a different batch of wastewater, the
OLR was decreased to 1.9 g/l/d for acclimation of the reactor. The reactor stabilized
around two weeks and then the OLR was increased again.
4.2.1.4. Stage 4
In the fourth Stage which was between days 145 to 177, the OLR was kept between 3.62
and 6.22 g/l/d. Average OLR in Stage 4 was 4.99 ± 0.94 g/l/d. Since the granules were
acclimated to the feed in the earlier stages, OLR was increased sharply (Figure 17, f).
The maximum influent COD is given to the reactor at the day 168 and was around 23690
mg/L. Average COD removal efficiency in Stage 4 was 83.65 ± 4.55 % and the maximum
COD removal efficiency was observed as 88.96 % at the day 162.

58
Figure 18. UASB 2 a) Influent & Effluent COD, b) COD Removal Efficiency, c) Biogas
Production , d) Methane Percentage , e) Methane Yield , f) OLR and g) HRT

59
4.2.2. UASB 2
The UASB 2 collapsed due to pH drop caused by the lack of alkalinity. After this incident,
the UASB 2 cleaned and started up again but with BM from the first day. The results
presented for UASB 2 are given in Figure 18, included the period beyond the second start-
up. Differences in operation period between the UASB 1 and UASB 2 reactors were due
to this situation.
The initial influent COD concentration was around 3500 mg/l and increased gradually to
around 25000 mg/ as seen in Figure 18, a.
The effluent COD concentration was always below 5000 mg/L (Figure 18, a). The COD
concentration level for discharging to the sewer system is defined as 1000 mg/L with the
agreements between the Municipality and the pistachio industries in Gaziantep.
Therefore, a polishing treatment step is further needed for discharge of the wastewater
after the UASB reactor.
The methane percentage of the produced biogas ranged from 15.71 % – 75.7 % with the
average value of 50.09 ± 18.44%. In UASB 2 reactor average methane yield was around
200 ml CH4/ g COD reduced, and the maximum methane yield was 363 ml CH4/ g
CODreduced (Figure 18, e)
4.2.2.1. Stage 1
The first stage of the UASB 2 reactor was operated between days 0 to 76. The OLR was
adjusted to 1 – 1.5 g/l/d. Average OLR value was 1.07 ± 0.479 g/l/d. The expected
operation time in Stage 1 was not as long as 76 days in UASB 2 reactor. Similar to UASB
1, some mechanical problems were encountered.
The performance of the reactor in terms of COD removal and biogas production went
down around day 26 as seen in Figure 18, b & c. Similar to UASB 1, the reason was
determined to be the nitrate inhibition. After the source of the dilution water was replaced,

60
the reactor was recovered faster than the UASB 1 reactor as seen in Figure 17 & Figure
18. UASB 2 reactor was operated with BM supplementation from the beginning which
was the only difference from the UASB 1. The reactor with the BM recovered after nitrate
inhibition rapidly when compared to UASB 1. After recovery period it took around 30
days to reactor reach to the steady state (Figure 18).
In this stage of operation, the average COD removal efficiency was 70.82 ± 6.93 %. COD
removal efficiency was more stable compared to the UASB 1 reactor which can be
attributed to nutrient (BM) supplementation.
There is no study to compare the performance obtained in this study. However, the
performance of the c.
4.2.2.2. Stage 2
The second stage of the operation of UASB 2 reactor was lasted between the days 76 and
96.The OLR was set to 2 – 4 g/l/d by increasing the influent COD. Since the HRT of the
system was constant, OLR was directly proportional to influent COD. The average OLR
value was 3.21 ± 0.80 g/l/d. COD removal efficiency in Stage 2 was higher than the first
stage. The increase in the OLR affected the treatment efficiency positively. The average
COD removal efficiency was 82.35 ± 3.32 %. Treatment efficiency of the UASB 2 was
higher than the UASB 1 for similar OLR values.
4.2.2.3. Stage 3
The second stage of the operation of UASB 2 reactor was lasted between the days 96 and
114. The average OLR was 1.81 ± 0.08 g/l/d. The significant decrease in OLR was
resulted from the composition of the wastewater as already explained for UASB 1 in
Section 4.2.1.3. (Stage 3 of UASB 1). As the UASB 1 reactor, the wastewater was
replaced and OLR adjusted to a lower level for acclimation. After the Stage 3, the fresh
pistachio processing wastewater was used. The reactor stabilized around two weeks and
61
then the OLR was increased again to 4.78 g/l/d (Figure 18, f). Average COD removal
efficiency was determined as 77.80 ± 1.54 % in Stage 3.
4.2.2.4. Stage 4
In the fourth stage which lasted between the days 114 to 149, the OLR increased from
4.78 to 7.55 g/l/d. Average OLR in the stage was 6.05 ± 1.27 g/l/d. Since the granules
acclimated well the OLR increasing done sharply. The maximum influent COD is given
to the reactor at the day 168 and was around 24960 mg/L. Average COD removal
efficiency in this stage was 86.18 ± 5.61 % and the maximum COD removal efficiency
was observed as 91.37 % on day 128.
4.3. Second Setup
As seen from Table 11, UASB reactors were operated under 4 different OLR levels as it
was in first setup. The discussion of the results are presented based four stages (namely
Stage 1, Stage 2, Stage 3 and Stage 4 at days 0 – 29, 29 – 66, 66 – 108, and 108 – 143)
which correspond to these OLR levels. The UASB 3 and 4 were operated in the absence
and presence of BM in the feed, respectively. The obtained experimental results for the
second setup reactors (UASB 3 & UASB 4) are provided in this section.

62
Table 11. Results of UASB3 & UASB4
Stage1 Stage 2 Stage 3 Stage 4
UA
SB
3
Days 0 - 29 29 - 66 66 - 108 108 - 143
Influent COD (mg/l) 7409.00
±1091.22
15010.28
±2251.66
21553.81
±3742.06
24650.00
±2339.20
Ave. OLR (g/l/d) 1.37 ±
0.2
2.78 ±
0.42
3.899 ±
0.698
4.56 ±
0.87
Ave. COD Removal Efficiency (%) 85.24 ±
6.48
87.49 ±
4.98
85.47 ±
5.5
89.77 ±
2.47
Ave. Methane Yield (ml/g) 272.98 ±
58.89
326.64 ±
71.46
300.05 ±
63.40
332.56 ±
104.55
UA
SB
4
Days 0 - 29 29 - 66 66 - 108 108 - 143
Influent COD (mg/l) 7719.67
±1594.42
15953.89
±2789.17
21170.24
±5149.97
26010.00
±5517.21
OLR (g/l/d) 1.43 ±
0.29
2.90 ±
0.41
4.86 ±
1.18
5.98 ±
1.27
Ave. COD removal Efficiency % 77.38 ±
6.048
82.23 ±
6.43
71.51 ±
9.36
70.72 ±
6.61
Ave. Methane Yield (ml/g) 268.62 ±
75.41
287.398
± 74.09
300.05 ±
63.40
280.32 ±
103.81
4.3.1. UASB 3
The initial influent COD concentration was 5000 mg/L in UASB 3 and increased
gradually to 30000 mg/L (Figure 19). The effluent COD values are ranged from 395 –
4000 mg/L (Figure 19). When the influent COD concentration was increased, a slight
decrease in the COD removal efficiency was observed (Figure 19), but it was recovered
in a few days.
63
OLR was started from low levels and gradually increased to test the treatability and
observe the adaptation trend in the reactor. OLR of the reactor is ranged from 0.8 – 5.8
g/L/d. The HRT of the system was adjusted to 5.4 days.
The COD removal efficiency of the UASB 3 reactor ranged between 74.53 % – 95.84 %
and the average COD removal efficiency was 86.74 ± 5.69 %.
The methane percentage of the produced biogas ranged from 47.16 % – 72.01 % with the
average value of 64.84 ± 5.03%.
The average methane yield was 305.49 ± 87.23 ml CH4/g COD reduced.
The maximum COD removal efficiencies, above 95 %, were observed in different OLR
values as 3.91 g/L/d., 4.01 g/L/d and 4.87 g/L/d.

64
Figure 19. UASB 3 a) Influent & Effluent COD, b) COD Removal Efficiency, c) Biogas
Production , d) Methane Percentage , e) Methane Yield , f) pH , g) OLR and h) HRT

65
4.3.1.1. Stage 1
The Stage 1 of UASB 3 lasted until day 29. The OLR was adjusted to 1 - 1.5 g/l/d.
Average OLR value was 1.37 ± 0.2 g/l/d. The HRT of the reactor was kept constant at
5.4 days. The effluent pH value was 7.53 in average.
The wastewater of pistachio processing factory was diluted in the ratio of ¼ with ultra-
pure water initially and then the COD concentration was gradually increased. The average
influent and effluent COD were 7409 ± 1091 and 1106.33 ± 543.7 mg/L, respectively.
In this stage of operation, the average COD removal efficiency was 85.24 ± 6.48 %
(Figure 19, b). COD removal efficiency was more stable than the first series of reactors
(UASB 1 and 2 (Figure 17 & Figure 18)).
Biogas production was calculated as 3.17 L biogas / L wastewater in average. Average
methane percentage was 59.098 ± 3.45 % in this stage. Methane yield was determined as
272.98 ± 58.89 ml CH4/ g CODreduced (~ 442.26 ml CH4/ g VS) in average in Stage 1.
Katsoni et al. (2014) used an UASB reactor for the treatment of diluted olive pomace
leachate and reported maximum COD treatment efficiency as %70. The OLR and HRT
used in this study were 0.33-1.67 g/l/d and 3 d, respectively which were similar to the
values used in this study. Moreover, Fang et al. (2011) used raw palm oil mill effluent as
carbon source within UASB reactor configuration which was operated 5 days of HRT. In
this study methane yield was reported as 436 ml CH4/ g VS. The COD removal efficiency
and average methane yield (442.26 ml CH4/ g VS) determined for the UASB 3 were
comparable to these studies that also conducted for high strength agro-industrial
wastewaters.
66
4.3.1.2. Stage 2
The second stage of the operation of UASB 3 reactor was lasted between the days 29 and
66. The OLR was adjusted to 2 - 3 g/l/d. Average OLR value was 2.78 ± 0.42 g/l/d. The
HRT of the reactor was kept constant at 5.4 days. The average effluent pH was around 8.
After pH value increased because of the alkalinity addition dosage, calculated
theoretically, overcame the needed dosage, the gas production efficiency was increased.
Especially the methane percentage of the gas increased from 59.098 % to 64.21 %. The
corresponding methane yield was 326.64 ± 71.46 ml CH4/ g COD reduced.
Dilution ratio of the wastewater was set as ½ in Stage 2 of UASB 3 operation. The average
influent and effluent COD were 15010.28 ± 2251.66 and 1872.22 ± 773.95 mg/L,
respectively. This corresponded to average COD removal efficiency of 87.49 ± 4.98 %.
Sabbah et al. (2003) also employed UASB reactors to treat raw and pretreated olive mill
wastewater with HRT of 5 days and reported that olive mill wastewater could be treated
with COD removal efficiency and biogas yield of 80 - 90 % and 300 l/kg CODreduced,
respectively. It was clear that pistachio wastewater treatment efficiencies were higher
than these values at comparable operational conditions.
4.3.1.3. Stage 3
The third stage of the operation of UASB 3 reactor was lasted between the days 66 and
108. The OLR was adjusted between 3 – 4.5 g/l/d with an average of 3.899 ± 0.698 g/l/d.
The effluent pH of UASB 3 was in the range of 7.88 – 8.2 with an average of 7.98. The
HRT of the reactor was 5.4 days.
In Stage 3, UASB 3 was fed with the pistachio wastewater diluted with pure water in the
ratio of 3/4. The influent COD was 21553.81± 3742.06 mg/l in average. Average effluent
COD was 3236.07 ± 1294.44 mg/l. The average COD removal efficiency was 85.47 ± 5.5
%.

67
Average methane percentage of the produced biogas was 66.84 ± 4.11 %. Biogas
production in the Stage 3 was 7.54 ± 2.18 l biogas/ l wastewater. Methane yield in the
Stage 3 was 300.05 ± 63.40 ml CH4/ g COD reduced (486 ml CH4 / g VS).
Gavala (1999) obtained COD removal efficiency of 79 – 91% lab scale UASB which was
used to examine the treatment efficiency of dairy wastewater. The operation parameters
were OLR of 2.5 - 4.5 g/l/d and HRT of 10 – 20 days (Gavala et al., 1999). Moreover,
Garcia et al. (2008) operated a UASB reactor with OLR of 5 g/l/d and influent COD
concentration of 16512 – 20434 mg/l to treat the liquid fraction of dairy manure. They
reported a COD removal efficiency of 87.1 % and methane yield of 362 ml CH4/ g COD
(García et al., 2008). Anaerobic COD removal efficiency of pistachio processing
wastewater by UASB (85.5 %) was comparable with both of the studies above but
methane yield was slightly lower (300.05 ± 63.40 ml CH4 / g COD reduced) than those
reported by Garcia et al. (2008) study.
4.3.1.4. Stage 4
The operation of UASB 3 between days 108 and 143 was named as Stage 4. The OLR
was adjusted to the range between 4 – 6 g/l/d. Average OLR was 4.56 ± 0.87 g/l/d. The
pH was kept constant in the range of 7.98 – 8.05 and the average was 8.01 (Figure 19, f).
The HRT of the reactor was 5.4 days as in other UASB reactors.
In Stage 4, UASB 3 was fed directly with pistachio processing wastewater. The BM was
added in concentrated form. The influent COD was 24650 ± 2339.20 mg/l in average.
Average effluent COD was 2511.33 ± 717.68 mg/l. COD removal efficiency of the third
stage was 89.77 ± 2.47 % in average (Figure 19, b)
Average methane percentage of the produced biogas was 67.64 ± 1.52 %. Biogas
production in this stage was 10.74 ± 2.59 l biogas/ l wastewater. Methane yield in the
third stage was 332.56 ± 104.55 ml CH4/ g COD reduced (Figure 19, d & e).

68
Gavala et al. (1999) reported that in a UASB with OLR and HRT of 6.2 g/l/d and 6 days,
respectively, the observed treatment efficiency was between 85 -90 % of dairy wastewater
. In another study, Kalyuzhnyi et al. (1996) reported that the COD treatment efficiency
was close to 95% in a UASB reactor which was employed to treat cheese whey
wastewater with an OLR of 6.5 g/l/d. The COD removal efficiency obtained in the Stage
4 of the operation of UASB 3 reactor was comparable with both of these studies which
were focused on well-known wastes in literature.
4.3.2. UASB 4
The UASB 4 was operated in the presence of BM. COD influent of UASB 4 was started
from around 4500 mg/l and increased gradually to 30000 mg/l. The corresponding
effluent COD values ranged from 502 – 8890 mg/l. In higher COD values, the adaptation
period of the fourth reactor was shorter than the third one; however, the overall efficiency
of the third reactor was higher.
OLR of the reactor ranged from 0.81 – 7.78 g/l/d. Initially the OLR was adjusted to around
1 g/l/d and gradually increased to 8 g/l/d. Similarly, the HRT of the system was fixed to
5.4 days in fourth reactor, therefore the OLR increase was directly connected to COD
increase.
The COD removal efficiency of UASB 4 ranged between 50.36 % – 94.90 % and the
average COD removal efficiency was 75.33 ± 8.92. This value was lower than that of the
UASB 3.
The methane percentage of the biogas produced in the UASB 4 ranged from 52.23 % -
72.01 % and the average was 64.89 ± 4.92. The methane yield was calculated as 290.50
± 28.49 ml CH4/g COD reduced.
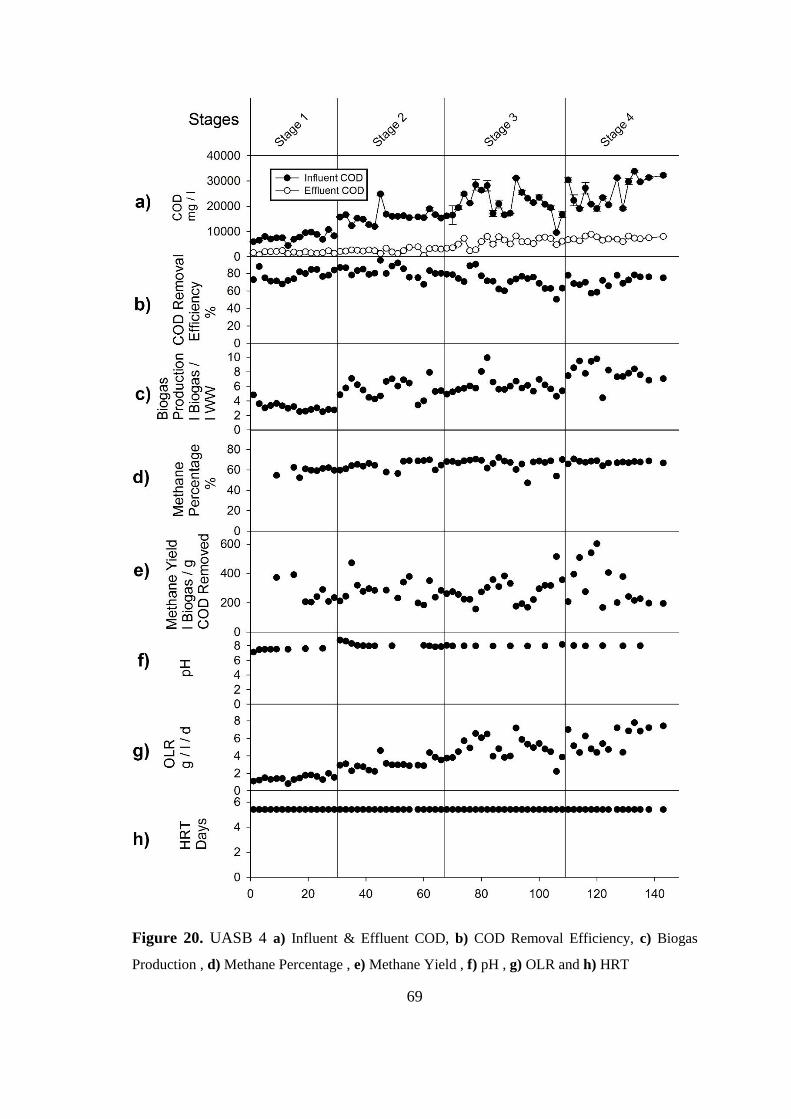
69
Figure 20. UASB 4 a) Influent & Effluent COD, b) COD Removal Efficiency, c) Biogas
Production , d) Methane Percentage , e) Methane Yield , f) pH , g) OLR and h) HRT
70
4.3.2.1. Stage 1
The first stage of the UASB 4 operation was continued until day 29. The OLR was
adjusted to 1 – 1.5 g/l/d. Average OLR value was 1.43 ± 0.29 g/l/d. The HRT of the
reactor was kept constant at 5.4 days. The pH value was 7.49 in average. (Figure 20, f
&h)
The wastewater of pistachio processing factory diluted in the ratio of ¼ with ultra-pure
water. Average influent COD was 7719.67 ± 1594.42 mg/l. Effluent COD was 1708 ±
447.88 mg/l in average (Figure 20, a).
In this stage the average COD removal efficiency was 77.38 ± 6.048 % (Figure 20, b).
COD removal efficiency was more stable than the first series of reactors but the treatment
efficiency was lower than the UASB 3.
Biogas production was calculated as 3.13 ± 0.59 l biogas / l wastewater in average.
Average methane percentage was 59.098 ± 3.45 in this stage. Methane yield determined
as 268.62 ± 75.41 ml CH4/ g CODreduced in average in the first stage. (Figure 20, c, d &
e)
4.3.2.2. Stage 2
The second stage of the operation of UASB 4 reactor was lasted between the days 29 and
66. The OLR was adjusted to 2 - 3 g/l/d. Average OLR value was 2.90 ± 0.41 g/l/d. The
HRT of the reactor was hold in 5.4 days. The pH value was 8.13 in average.
Dilution ratio of the wastewater was 1/2 in the second stage. Average influent COD was
15953.89 ± 2789.17 mg/l. Similar to UASB 3 there was a slight fluctuation in the influent
COD. Effluent COD was 2495.69 ± 898.24 mg/l in average.
In this operational stage, the average COD removal efficiency was 82.23 ± 6.43 %. COD
removal efficiency was also upgraded with the increasing pH and OLR (Figure 20). The

71
reason of pH increasing was the alkalinity addition to the wastewater. The alkalinity
dosage was calculated theoretically but after the pH increase, the alkalinity addition
dosage recalculated and regulated. After the recalculation pH were keep constant.
Methane percentage of the gas increased from 59.098 % to 64.21 %. In connection with,
biogas production also developed from 3.13 l CH4/l WW to 5.66 l CH4/l WW and the
methane yield was upgraded to 287.398 ± 74.09 ml CH4/ g CODreduced (~464.94 ml CH4/
g VS) (Figure 20, e)
In literature, Fang et al. (2011) observed that the methane yield was 240 ml/ g vs added
in a UASB reactor which was operated at an OLR range of 2.5 – 3.2 g COD/l/d and HRT
of 8 days treating potato juice. Methane yield was clearly superior in pistachio wastewater
treatment experiments than potato juice treatment. Parawira et al. (2004) also used an
UASB reactor for potato waste leachate which had operation conditions as OLR between
(1.5 – 7 g/l/d.) and HRT between (2.9 – 13.2 days). COD removal efficiency was 95.3
and methane yield was 110 ml CH4/ g COD reduced when OLR was 3 g/l/d. Although
the COD removal efficiency of pistachio wastewater slightly lower than this study, the
methane production potential was clearly higher.
4.3.2.3. Stage 3
The operation between the days 66 and 108 were named as Stage 3. The OLR was
adjusted to the range between 3 – 5 g/l/d. Average OLR was 4.86 ± 1.18 g/l/d.
The influent COD was 21170.24 ± 5149.97 mg/l in average. Average effluent COD was
5769 ± 1761.16 mg/L. COD removal efficiency of the third stage was 71.51 ± 9.36 % in
average.
pH was stable in the range of 7.88 – 8.2 and the average was 7.98. The HRT of the reactor
was again 5.4 days.

72
Average methane percentage of the produced biogas was 66.84 ± 4.11 %. Biogas
production in the stage was 7.54 ± 2.18 l biogas/ l wastewater. Methane yield in the third
stage was 300.05 ± 63.40 ml CH4/ g COD reduced. (Figure 20, c, d & e)
4.3.2.4. Stage 4
The operation between the days 108 and 143 were named as stage 4. The OLR was
adjusted to the range between 4.3 – 7.78 g/l/d. Average OLR was 5.98 ± 1.27 g/l/d. in the
fourth stage. pH was hold stable in the range of 7.98 – 8.05 and the average was 8. The
HRT of the reactor was again 5.4 days.
In this stage of operation, UASB 4 was fed with directly pistachio wastewater. The BM
was added in concentrated form. The influent COD was 26010 ± 5517 mg/l in average.
Average effluent COD was 7325 ± 801 mg/l. The average COD removal efficiency was
70.72 ± 6.61 % in average.
Average methane percentage of the produced biogas was 67.52 ± 1.54 %. Biogas
production in the stage was 5.65 ± 2.03 l biogas/ l wastewater. Methane yield in the stage
4 was 280.32 ± 103.81 ml CH4/ g COD reduced. (Figure 20)
4.4. Overall Comparison of All Reactors
This study revealed that pistachio processing wastewater is anaerobically treatable. In all
UASB reactors significant percentages of COD removal was achieved. In first setup,
many problems were faced and solved. After the problems were solved the COD removal
efficiency increased but biogas production performance could not reach the performance
of second setup reactors.
The summary of the results of all reactors are given in Table 12.

73
Table 12. Results Summary of All Reactors
UASB 1 UASB 2 UASB 3 UASB 4
Average COD
Removal Efficiency % 74.4 76.8 86.7 75.3
Maximum COD
Removal Efficiency % 88.9 91.3 95.9 94.9
Average Methane Yield
(ml CH4 / g CODreduced) 262 200 306 290
Average Methane
Percentage %
53.1 50.1 64.8 64.9
Average COD removal efficiency of UASB 1 was 74.4% and the maximum COD
removal efficiency was 88.9. Average methane percent of the biogas produced by UASB
1 was 53.1% and the average methane yield calculated was 262 ml CH4 / g CODreduced.
The second reactor (UASB 2) had a slightly higher COD removal efficiency than UASB
1. In average, COD removal efficiency of UASB 2 was 76.8%. Although the problems
were faced in first setup, the maximum COD removal efficiency of UASB 2 surpassed
the 90% level and reached 91.3%. Average methane percentage in the produced biogas
was 50.1% in the second reactor. Average methane yield of UASB 2 was 200 ml CH4 / g
CODreduced.
The maximum COD removal efficiency of 95.84% was observed in the UASB 3 reactor
at an OLR of 4.87 g/l/d and HRT of 5.4 days (Figure 19). In average 86.7% COD removal
was achieved in UASB 3. Average methane percentage of the produced biogas by UASB
3 was 64.8% and the average methane yield was calculated as 306 ml CH4 / g CODreduced.
UASB 3 was the most efficient reactor in terms of COD removal, biogas production and
methane yield.
UASB 4 had an average and maximum COD removal efficiency of 75.3% and 94.9%,
respectively. The average methane percentage in the biogas was 64.9% and the methane
yield was 290 CH4 / g CODreduced.
74
It was shown that the anaerobic treatment efficiency could be reached to 90 % in terms
of COD removal. Anaerobic treatability of pistachio wastewater with considerably high
COD removal efficiency was shown in both of the experimental setups. Even the type of
the seed, operation pH and operation HRT were different from each other, in terms of
COD removal efficiency, biogas production and methane yield in both setups indicated
that pistachio wastewater was anaerobically treatable and had a considerable biogas
production potential.
Katsoni and coworkers (2014) used an UASB reactor for the treatment of diluted olive
pomace leachate and reported maximum COD treatment efficiency as %70. The OLR and
HRT used in this study were 0.33-1.67 g/l/d and 3 d, respectively.
Fang and coworkers (2011) used raw palm oil mill effluent as carbon source within UASB
reactor configuration which was operated with a HRT of 5 days. In this study methane
yield was reported as 436 ml CH4/ g VS.
Sabbah and coworkers (2003) also employed UASB reactors to treat raw and pretreated
olive mill wastewater with HRT of 5 days and reported that olive mill wastewater could
be treated with COD removal efficiency and biogas yield of 80 - 90 % and 300 l/kg
CODreduced, respectively.
Gavala (1999) obtained COD removal efficiency of 79 – 91% lab scale UASB which was
used to examine the treatment efficiency of dairy wastewater. The operation parameters
were OLR of 2.5 - 4.5 g/l/d and HRT of 10 – 20 days (Gavala et al., 1999).
Gavala and coworkers (1999) reported that in a UASB with OLR and HRT of 6.2 g/l/d
and 6 days, respectively, the observed COD removal efficiency was between 85 - 90 %
of dairy wastewater.
Garcia et al. (2008) operated a UASB reactor with OLR of 5 g/l/d and influent COD
concentration of 16512 – 20434 mg/l to treat the liquid fraction of dairy manure. They
reported a COD removal efficiency of 87.1 % and methane yield of 362 ml CH4/ g COD
(García et al., 2008).

75
Kalyuzhnyi and coworkers (1996) reported that the COD treatment efficiency was close
to 95% in a UASB reactor which was employed to treat cheese whey wastewater with an
OLR of 6.5 g/l/d.
Fang and coworkers (2011) observed that the methane yield was 240 ml/ g vs added in a
UASB reactor which was operated at an OLR range of 2.5 – 3.2 g COD/l/d and HRT of
8 days treating potato juice.
Parawira and coworkers (2004) also used an UASB reactor for potato waste leachate
which had operation conditions as OLR between (1.5 – 7 g/l/d.) and HRT between (2.9 –
13.2 days). COD removal efficiency was 95.3 and methane yield was 110 ml CH4/ g
CODreduced when OLR was 3 g/l/d.
As this was the first study that was conducted for determining the anaerobic treatability
performance and biogas production potential of pistachio processing wastewater with
continuous reactors in literature, discussions and comparisons (COD removal and
methane yield) were done with different studies, mentioned above in this section, which
employed UASB reactors. In these studies UASB reactors were operated with similar
conditions (OLR, HRT and Inf COD) with this study and used for treating various
wastewaters.
All the reactors’ performances are comparable with literature. Especially the most
efficient reactor, UASB 3’s COD removal performance and biogas production potential
are comparable with different kind of strength industrial wastewaters such as olive
pomace leachate, palm oil mill effluent, olive mill wastewaters, dairy wastewaters, liquid
fraction of dairy manure, cheese whey wastewaters, potato juice and potato processing
wastewaters although this was the first and pioneering study.
As a summary, performance of UASB reactors in treating pistachio processing
wastewaters have a significant achievement when compared with literature.

76

77
CHAPTER 5
CONCLUSION
In this study, anaerobic treatability in UASB reactors and biogas production potential of
pistachio processing wastewater were examined. Based on the results of this study, the
following conclusions could be made.
Both anaerobic granular seed cultures taken from Anadolu Efes Beer factory and
Amasya Özmaya Yeast Factory could be acclimated and used for the treatment of
pistachio processing wastewater efficiently.
After the acclimation period, the COD treatment percentages were greater than 88
% in all reactors.
Wastewater of pistachio processing factories could be treated with high rate
UASB (Upflow Anaerobic Sludge Blanket) reactors.
BM addition may be necessary for startup period of reactors but after the startup,
only alkalinity addition is adequate for reactors. The reactors that BM was added
from the beginning, were observed as more resistant to unexpected negative
conditions. The recovery period of UASB 2 from nitrate inhibition was more rapid
than the UASB 1’s recovery period. After the granules were adapted, it was
observed that the UASB 3 was the most efficient reactor, which had only
alkalinity addition.

78
If the annual pistachio processing wastewater of 520000 m3 is treated with
anaerobic methods, 13000 tons COD can be removed and 3.9 million m3 of
methane can be produced in Turkey. The energy equivalent of the produced
biogas is around 28200 mwh per year.

79
FUTURE STUDIES
Reactors should be operated in different HRT values and optimisation of COD
removal efficiency and HRT should be done. The lower HRT means, the lower
investment cost for treatment plants, therefore, the lower HRT values should be
investigated first.
The reactors were operated in 35 °C in this study. COD treatment efficiency and
gas production potential were determined for mesophilic conditions. Similar
investigations should be done in thermophilic conditions in order to upgrade the
COD removal efficiency and biogas production potential.
Study should be repeated in pilot scale reactors operated on site. Minor problems
caused from small equipments in lab scale can be excluded in pilot scale
experiments and also problems due to the stalling of the waste can be eliminated
by locating the system on site.
Solid waste of pistachio should be investigated as a renewable energy source.
When pistachio solid waste compared with wastewater of pistachio, solid waste
has a greater potential as a renewable energy source due its high organic content.
The residue sludge should be examined as an anaerobic organic fertilizer.
Co-digestion opportunities of pistachio waste with other wastes produced locally
(chicken manure etc.) should be investigated.
With metagenomic methods, specialized seed culture or granule development
should be investigated for pistachio processing wastewater and pistachio solid
waste.

80

81
REFERENCES
APHA, A. (2005). WEF, 2005. Standard methods for the examination of water
and wastewater, 21.
Atmakidis, T., & Kenig, E. Y. (2009). CFD-based analysis of the wall effect on
the pressure drop in packed beds with moderate tube/particle diameter ratios in
the laminar flow regime. Chemical Engineering Journal, 155(1), 404-410.
Babadogan, G. (2007). Turkey Prime Minister, Foreign Trade Consulting. Export
Development Studies Center, Ankara.
Banihani, Q., Sierra-Alvarez, R., & Field, J. A. (2009). Nitrate and nitrite
inhibition of methanogenesis during denitrification in granular biofilms and
digested domestic sludges. Biodegradation, 20(6), 801-812.
Behgar, Ghasemi, Naserian, Borzoie, & Fatollahi. (2011). Gamma radiation
effects on phenolics, antioxidants activity and in vitro digestion of pistachio
(Pistachia vera) hull. Radiation Physics and Chemistry, 80(9), 963-967.
doi:http://dx.doi.org/10.1016/j.radphyschem.2011.04.016
Behling, E., Diaz, A., Colina, G., Herrera, M., Gutierrez, E., Chacin, E., . . .
Forster, C. (1997). Domestic wastewater treatment using a UASB reactor.
Bioresource technology, 61(3), 239-245.
Bitton, G. (1999). Sludge microbiology. Wastewater Microbiology, Third Edition,
321-344.
Bitton, G. (2005). Wastewater microbiology: John Wiley & Sons.
Bohluli, A., Nasserian, A., Valizadeh, R., & Eftekhar, S. F. (2010). The Chemical
Composition, In Vitro Gas Production And Digestibility Of Pistachio By-
Products.
Bolzonella, D., Pavan, P., Battistoni, P., & Cecchi, F. (2005). Mesophilic
anaerobic digestion of waste activated sludge: influence of the solid retention time
in the wastewater treatment process. Process Biochemistry, 40(3), 1453-1460.
Borja, R., & Banks, C. (1994). Anaerobic digestion of palm oil mill effluent using
an up-flow anaerobic sludge blanket reactor. Biomass and Bioenergy, 6(5), 381-
389.
Borja, R., Banks, C. J., & Sánchez, E. (1996). Anaerobic treatment of palm oil
mill effluent in a two-stage up-flow anaerobic sludge blanket (UASB) system.
Journal of Biotechnology, 45(2), 125-135.
82
Borroto, J., Domınguez, J., Griffith, J., Fick, M., & Leclerc, J. (2003).
Technetium-99m as a tracer for the liquid RTD measurement in opaque anaerobic
digester: application in a sugar wastewater treatment plant. Chemical Engineering
and Processing: Process Intensification, 42(11), 857-865.
Bouallagui, H., Touhami, Y., Cheikh, R. B., & Hamdi, M. (2005). Bioreactor
performance in anaerobic digestion of fruit and vegetable wastes. Process
Biochemistry, 40(3), 989-995.
Brito, A., & Melo, L. (1999). Mass transfer coefficients within anaerobic biofilms:
effects of external liquid velocity. Water Research, 33(17), 3673-3678.
Caixeta, C. E., Cammarota, M. C., & Xavier, A. M. (2002). Slaughterhouse
wastewater treatment: evaluation of a new three-phase separation system in a
UASB reactor. Bioresource technology, 81(1), 61-69.
Callander, I., & Barford, J. (1983). Precipitation, chelation, and the availability of
metals as nutrients in anaerobic digestion. I. Methodology. Biotechnology and
Bioengineering, 25(8), 1947-1957.
Chahed, T., Dhifi, W., Hosni, K., Msaada, K., Kchouk, M. E., & Marzouk, B.
(2008). Composition of Tunisian Pistachio Hull Essential Oil during Fruit
Formation and Ripening. Journal of Essential Oil Research, 20(2), 122-125.
doi:10.1080/10412905.2008.9699971
Chaisri, R., Boonsawang, P., Prasertsan, P., & Chaiprapat, S. (2007). Effect of
organic loading rate on methane and volatile fatty acids productions from
anaerobic treatment of palm oil mill effluent in UASB and UFAF reactors.
Songklanakarin J. Sci. Technol, 2, 311-323.
Chávez P, C., Castillo L, R., Dendooven, L., & Escamilla-Silva, E. M. (2005).
Poultry slaughter wastewater treatment with an up-flow anaerobic sludge blanket
(UASB) reactor. Bioresource technology, 96(15), 1730-1736.
doi:http://dx.doi.org/10.1016/j.biortech.2004.08.017
Chong, S., Sen, T. K., Kayaalp, A., & Ang, H. M. (2012). The performance
enhancements of upflow anaerobic sludge blanket (UASB) reactors for domestic
sludge treatment–A State-of-the-art review. Water Research, 46(11), 3434-3470.
Chou, H.-H., & Huang, J.-S. (2005). Comparative granule characteristics and
biokinetics of sucrose-fed and phenol-fed UASB reactors. Chemosphere, 59(1),
107-116.
Christiansen, N., Hendriksen, H. V., Jarvinen, K. T., & Ahring, B. K. (1995).
Degradation of chlorinated aromatic compounds in UASB reactors. Water Science
and Technology, 31(1), 249-259.

83
Clarke, W. P., & Alibardi, L. (2010). Anaerobic digestion for the treatment of
solid organic waste: what’s hot and what’s not. Waste Management, 30(10), 1761-
1762. doi:http://dx.doi.org/10.1016/j.wasman.2010.06.019
Çelik, İ., & Demirer, G. (2015). Biogas production from pistachio (Pistacia vera
L.) processing waste. Biocatalysis and Agricultural Biotechnology, 4(4), 767-772.
Dague, R. R. (1993). Anaerobic sequencing batch reactor: Google Patents.
de Lemos Chernicharo, C. A. (2007). Anaerobic reactors. Water Intelligence
Online, 6, 9781780402116.
Demiral, I., Atilgan, N. G., & Şensöz, S. (2008). Production of biofuel from soft
shell of pistachio (Pistacia vera L.). Chemical Engineering Communications,
196(1-2), 104-115.
Demirer, G. (2016). Biogas Production from Pistachio (Pistacia Vera L.) De-
Hulling Waste. International Journal of Green Energy(just-accepted).
Demirer, G., & Chen, S. (2005). Two-phase anaerobic digestion of unscreened
dairy manure. Process Biochemistry, 40(11), 3542-3549.
Demirer, G., & Speece, R. (1998). Anaerobic biotransformation of four3-carbon
compounds (acrolein, acrylic acid, allyl alcohol and n-propanol) in UASB
reactors. Water Research, 32(3), 747-759.
Demirer, G. N., & Othman, M. (2008). Two-phase thermophilic acidification and
mesophilic methanogenesis anaerobic digestion of waste-activated sludge.
Environmental Engineering Science, 25(9), 1291-1300.
Dogan, E., Dunaev, T., Erguder, T., & Demirer, G. (2009). Performance of
leaching bed reactor converting the organic fraction of municipal solid waste to
organic acids and alcohols. Chemosphere, 74(6), 797-803.
Droste, R. L. (1997). Theory and practice of water and wastewater treatment:
John Wiley & Sons Incorporated.
Elias, D. A., Krumholz, L. R., Tanner, R. S., & Suflita, J. M. (1999). Estimation
of methanogen biomass by quantitation of coenzyme M. Applied and
environmental microbiology, 65(12), 5541-5545.
Ergüder, T., Tezel, U., Güven, E., & Demirer, G. (2001). Anaerobic
biotransformation and methane generation potential of cheese whey in batch and
UASB reactors. Waste Management, 21(7), 643-650.
Ergüder, T. H., & Demirer, G. N. (2008). Low-strength wastewater treatment with
combined granular anaerobic and suspended aerobic cultures in upflow sludge
blanket reactors. Journal of Environmental Engineering, 134(4), 295-303.

84
Ergüder, T. H., Güven, E., & Demirer, G. N. (2000). Anaerobic treatment of olive
mill wastes in batch reactors. Process Biochemistry, 36(3), 243-248.
doi:http://dx.doi.org/10.1016/S0032-9592(00)00205-3
Fang, C., Boe, K., & Angelidaki, I. (2011). Biogas production from potato-juice,
a by-product from potato-starch processing, in upflow anaerobic sludge blanket
(UASB) and expanded granular sludge bed (EGSB) reactors. Bioresource
technology, 102(10), 5734-5741.
Fang, C., Sompong, O., Boe, K., & Angelidaki, I. (2011). Comparison of UASB
and EGSB reactors performance, for treatment of raw and deoiled palm oil mill
effluent (POME). Journal of hazardous materials, 189(1), 229-234.
Fang, H. H., & Chui, H. (1993). Maximum COD loading capacity in UASB
reactors at 37 C. Journal of Environmental Engineering, 119(1), 103-119.
FAOSTAT. (2016). Food And Agriculture Organization Of The United Nations
Statistics Division. Retrieved from http://faostat3.fao.org/browse/Q/QC/E
Farhadian, M., Borghei, M., & Umrania, V. V. (2007). Treatment of beet sugar
wastewater by UAFB bioprocess. Bioresource technology, 98(16), 3080-3083.
Frankin, R. (2001). Full-scale experiences with anaerobic treatment of industrial
wastewater. Water Science and Technology, 44(8), 1-6.
García, H., Rico, C., García, P., & Rico, J. (2008). Flocculants effect in biomass
retention in a UASB reactor treating dairy manure. Bioresource technology,
99(14), 6028-6036.
Gavala, H., Kopsinis, H., Skiadas, I., Stamatelatou, K., & Lyberatos, G. (1999).
Treatment of dairy wastewater using an upflow anaerobic sludge blanket reactor.
Journal of Agricultural Engineering Research, 73(1), 59-63.
Gerardi, M. H. (2003). The microbiology of anaerobic digesters: John Wiley &
Sons.
Goli, A. H., Barzegar, M., & Sahari, M. A. (2005). Antioxidant activity and total
phenolic compounds of pistachio (Pistachia vera) hull extracts. Food Chemistry,
92(3), 521-525. doi:http://dx.doi.org/10.1016/j.foodchem.2004.08.020
Gonzalez‐Gil, G., Seghezzo, L., Lettinga, G., & Kleerebezem, R. (2001). Kinetics
and mass‐transfer phenomena in anaerobic granular sludge. Biotechnology and
Bioengineering, 73(2), 125-134.
Grady, C. (1985). Biodegradation: its measurement and microbiological basis.
Biotechnology and Bioengineering, 27(5), 660-674.
85
Grover, R., Marwaha, S., & Kennedy, J. (1999). Studies on the use of an anaerobic
baffled reactor for the continuous anaerobic digestion of pulp and paper mill black
liquors. Process Biochemistry, 34(6), 653-657.
Güngör-Demirci, G., & Demirer, G. N. (2004). Effect of initial COD
concentration, nutrient addition, temperature and microbial acclimation on
anaerobic treatability of broiler and cattle manure. Bioresource technology, 93(2),
109-117.
Hampannavar, U., & Shivayogimath, C. (2010). Anaerobic treatment of sugar
industry wastewater by upflow anaerobic sludge blanket reactor at ambient
temperature. International journal of environmental sciences, 1(4), 631.
Harada, H., Uemura, S., Chen, A.-C., & Jayadevan, J. (1996). Anaerobic
treatment of a recalcitrant distillery wastewater by a thermophilic UASB reactor.
Bioresource technology, 55(3), 215-221.
Hartmann, H., & Ahring, B. K. (2005). Anaerobic digestion of the organic fraction
of municipal solid waste: influence of co-digestion with manure. Water Research,
39(8), 1543-1552.
Huang, J. S., Jih, C. G., Lin, S. D., & Ting, W. H. (2003). Process kinetics of
UASB reactors treating non‐inhibitory substrate. Journal of Chemical Technology
and Biotechnology, 78(7), 762-772.
Hutnan, M., Drtil, M., Derco, J., Mrafkova, L., Hornak, M., & Mico, S. (2001).
Two-step pilot-scale anaerobic treatment of sugar beet pulp. Polish Journal of
Environmental Studies, 10(4), 237-244.
Kalyuzhnyi, S., de los Santos, L. E., & Martinez, J. R. (1998). Anaerobic
treatment of raw and preclarified potato-maize wastewaters in a USAB reactor.
Bioresource technology, 66(3), 195-199.
Kalyuzhnyi, S., Gladchenko, M., Mulder, A., & Versprille, B. (2006).
DEAMOX—new biological nitrogen removal process based on anaerobic
ammonia oxidation coupled to sulphide-driven conversion of nitrate into nitrite.
Water Research, 40(19), 3637-3645.
Kalyuzhnyi, S., Sklyar, V., Davlyatshina, M., Parshina, S., Simankova, M.,
Kostrikina, N., & Nozhevnikova, A. (1996). Organic removal and microbiological
features of UASB-reactor under various organic loading rates. Bioresource
technology, 55(1), 47-54.
Karim, K., Klasson, K. T., Hoffmann, R., Drescher, S. R., DePaoli, D. W., & Al-
Dahhan, M. (2005). Anaerobic digestion of animal waste: Effect of mixing.
Bioresource technology, 96(14), 1607-1612.

86
Katsoni, Α., Mantzavinos, D., & Diamadopoulos, E. (2014). Sequential treatment
of diluted olive pomace leachate by digestion in a pilot scale UASB reactor and
BDD electrochemical oxidation. Water Research, 57, 76-86.
Kaviyarasan, K. (2014). Application of UASB Reactor in Industrial Wastewater
Treatment–A Review. International Journal of Scientific & Engineering
Research, 5(1), 584.
Kazemi, M., & Zand-Monfared, M. R. (2010). Furfural production from
pisthachio green hulls as agricultural residues. Journal of Applied Chemical
Researches Winter, 3(12).
Keyser, M., Witthuhn, R., Ronquest, L.-C., & Britz, T. (2003). Treatment of
winery effluent with upflow anaerobic sludge blanket (UASB)–granular sludges
enriched with Enterobacter sakazakii. Biotechnology Letters, 25(22), 1893-1898.
Khanal, S. K. (2008). Anaerobic biotechnology for bioenergy production.
Principles and Application Willey and Blackwell, 161-186.
Kim, J. K., Oh, B. R., Chun, Y. N., & Kim, S. W. (2006). Effects of temperature
and hydraulic retention time on anaerobic digestion of food waste. Journal of
Bioscience and Bioengineering, 102(4), 328-332.
Kitsos, H., Roberts, R., Jones, W., & Tornabene, T. (1992). An experimental study
of mass diffusion and reaction rate in an anaerobic biofilm. Biotechnology and
Bioengineering, 39(11), 1141-1146.
Korsak, L., Cabezas, A., & Moreno, L. (2008). A model of kinetics and mass
transfer in an UASB reactor. Paper presented at the The Fourth International
Conference on Environmental Science and Technology, July 28-31, 2008,
Houston, Texas, USA.
Laubscher, A., Wentzel, M., Le Roux, J., & Ekama, G. (2001). Treatment of grain
distillation wastewaters in an upflow anaerobic sludge bed (UASB) system. Water
SA, 27(4), 433-444.
Lettinga. (1995). Anaerobic digestion and wastewater treatment systems. Antonie
van leeuwenhoek, 67(1), 3-28.
Lettinga, G., & Pol, L. H. (1991). UASB-process design for various types of
wastewaters. Water Science and Technology, 24(8), 87-107.
Lettinga, G., Pol, L. H., Koster, I., Wiegant, W., De Zeeuw, W., Rinzema, A., . .
. Hobma, S. (1984). High-rate anaerobic waste-water treatment using the UASB
reactor under a wide range of temperature conditions. Biotechnology and genetic
engineering reviews, 2(1), 253-284.

87
Lettinga, G., Roersma, R., Grin, P., Zeeuw, W. d., Pol, L. H., Velsen, L. v., . . .
Zeeman, G. (1982). Anaerobic treatment of sewage and low strength waste
waters. Paper presented at the Anaerobic digestion 1981: proceedings of the
Second International Symposium on Anaerobic Digestion held in Travemhunde,
Federal Republic of Germany, on 6-11 September, 1981/editors, DE Hughes...[et
al.].
Lettinga, G., Van Velsen, A., Hobma, S. W., De Zeeuw, W., & Klapwijk, A.
(1980). Use of the upflow sludge blanket (USB) reactor concept for biological
wastewater treatment, especially for anaerobic treatment. Biotechnology and
Bioengineering, 22(4), 699-734.
Levenspiel, O. (1999). Chemical reaction engineering. Industrial & engineering
chemistry research, 38(11), 4140-4143.
Liu, Y., & Tay, J.-H. (2002). The essential role of hydrodynamic shear force in
the formation of biofilm and granular sludge. Water Research, 36(7), 1653-1665.
Liu, Y., & Tay, J.-H. (2004). State of the art of biogranulation technology for
wastewater treatment. Biotechnology Advances, 22(7), 533-563.
doi:http://dx.doi.org/10.1016/j.biotechadv.2004.05.001
McCarty, P. L. (1964). Anaerobic waste treatment fundamentals. Public works,
95(9), 107-112.
Monroy, O., Famá, G., Meraz, M., Montoya, L., & Macarie, H. (2000). Anaerobic
digestion for wastewater treatment in Mexico: state of the technology. Water
Research, 34(6), 1803-1816.
Moussavi, G., & Khosravi, R. (2010). Removal of cyanide from wastewater by
adsorption onto pistachio hull wastes: Parametric experiments, kinetics and
equilibrium analysis. Journal of hazardous materials, 183(1), 724-730.
Moussavi, G., & Khosravi, R. (2011). The removal of cationic dyes from aqueous
solutions by adsorption onto pistachio hull waste. Chemical Engineering
Research and Design, 89(10), 2182-2189.
Nadais, H., Capela, I., Arroja, L., & Duarte, A. (2005). Optimum cycle time for
intermittent UASB reactors treating dairy wastewater. Water Research, 39(8),
1511-1518.
Nadais, H., Capela, I., Arroja, L., & Duarte, A. (2006). Treatment of dairy
wastewater in UASB reactors inoculated with flocculent biomass. Water SA,
31(4), 603-608.
Nielsen, H. B., & Angelidaki, I. (2008). Strategies for optimizing recovery of the
biogas process following ammonia inhibition. Bioresource technology, 99(17),
7995-8001.
88
Ocak, H. (2012) TADIM Pistachio Producing Factory, The Director of Technical
Services , Aydınlar Mahallesi 03005 No lu Cadde No:20 Şehitkamil 27850
Gaziantep , Phone : 0 262 672 75 70.
Omstead, D. R., Jefferies, T. W., Naughton, R., & Gregor, H. P. (1980).
Membrane-controlled digestion: anaerobic production of methane and organic
acids.
Palenzuela-Rollon, A., Zeeman, G., Lubberding, H., Lettinga, G., & Alaerts, G.
(2002). Treatment of fish processing wastewater in a one-or two-step upflow
anaerobic sludge blanket (UASB) reactor. Water Science and Technology, 45(10),
207-212.
Parawira, W., Murto, M., Zvauya, R., & Mattiasson, B. (2004). Anaerobic batch
digestion of solid potato waste alone and in combination with sugar beet leaves.
Renewable Energy, 29(11), 1811-1823.
doi:http://dx.doi.org/10.1016/j.renene.2004.02.005
Parawira, W., Murto, M., Zvauya, R., & Mattiasson, B. (2006). Comparative
performance of a UASB reactor and an anaerobic packed-bed reactor when
treating potato waste leachate. Renewable Energy, 31(6), 893-903.
Parkin, G. F., & Owen, W. F. (1986). Fundamentals of anaerobic digestion of
wastewater sludges. Journal of Environmental Engineering, 112(5), 867-920.
Polat, R., Gezer, I., Guner, M., Dursun, E., Erdogan, D., & Bilim, H. C. (2007).
Mechanical harvesting of pistachio nuts. Journal of Food Engineering, 79(4),
1131-1135. doi:http://dx.doi.org/10.1016/j.jfoodeng.2006.03.023
Potts, D. T. (2012). A companion to the archaeology of the ancient Near East:
John Wiley & Sons.
Prashanth, S., Kumar, P., & Mehrotra, I. (2006). Anaerobic degradability: effect
of particulate COD. Journal of Environmental Engineering, 132(4), 488-496.
Rajaei, A., Barzegar, M., Mobarez, A. M., Sahari, M. A., & Esfahani, Z. H.
(2010). Antioxidant, anti-microbial and antimutagenicity activities of pistachio
(Pistachia vera) green hull extract. Food and chemical toxicology, 48(1), 107-112.
Rajeshwari, K., Balakrishnan, M., Kansal, A., Lata, K., & Kishore, V. (2000).
State-of-the-art of anaerobic digestion technology for industrial wastewater
treatment. Renewable and Sustainable Energy Reviews, 4(2), 135-156.
Ramasamy, E., Gajalakshmi, S., Sanjeevi, R., Jithesh, M., & Abbasi, S. (2004).
Feasibility studies on the treatment of dairy wastewaters with upflow anaerobic
sludge blanket reactors. Bioresource technology, 93(2), 209-212.
89
Rico, C., Muñoz, N., Fernández, J., & Rico, J. L. (2015). High-load anaerobic co-
digestion of cheese whey and liquid fraction of dairy manure in a one-stage UASB
process: limits in co-substrates ratio and organic loading rate. Chemical
Engineering Journal, 262, 794-802.
Romano, R. T., & Zhang, R. (2008). Co-digestion of onion juice and wastewater
sludge using an anaerobic mixed biofilm reactor. Bioresource technology, 99(3),
631-637.
Rosengarten Jr, F. (2004). The book of edible nuts: Courier Corporation.
Sabbah, I., Marsook, T., & Basheer, S. (2004). The effect of pretreatment on
anaerobic activity of olive mill wastewater using batch and continuous systems.
Process Biochemistry, 39(12), 1947-1951.
Sanchez, E., Borja, R., Travieso, L., Martın, A., & Colmenarejo, M. (2005). Effect
of organic loading rate on the stability, operational parameters and performance
of a secondary upflow anaerobic sludge bed reactor treating piggery waste.
Bioresource technology, 96(3), 335-344.
Sancinetti, G. P., Sader, L. T., Varesche, M. B. A., Amorim, E. L. C., Omena, S.
P. F., & Silva, E. L. (2012). Phenol degradation in an anaerobic fluidized bed
reactor packed with low density support materials. Brazilian Journal of Chemical
Engineering, 29, 87-98.
Sayed, S., de Zeeuw, W., & Lettinga, G. (1984). Anaerobic treatment of
slaughterhouse waste using a flocculant sludge UASB reactor. Agricultural
wastes, 11(3), 197-226.
Schramm, W. A., Inc. (2014). World Pistachio Trade Report. First Eddition.
Schwarzenbach, R. P., Gschwend, P. M., & Imboden, D. M. (2005).
Environmental organic chemistry: John Wiley & Sons.
Singh, K. S., & Viraraghavan, T. (1998). Start-up and operation of UASB reactors
at 20 C for municipal wastewater treatment. Journal of fermentation and
Bioengineering, 85(6), 609-614.
Singh, K. S., Viraraghavan, T., & Bhattacharyya, D. (2006). Sludge blanket height
and flow pattern in UASB reactors: Temperature effects. Journal of
Environmental Engineering, 132(8), 895-900.
Soller, J. A., Olivieri, A. W., Crook, J., Cooper, R. C., Tchobanoglous, G., Parkin,
R. T., . . . Eisenberg, J. N. (2003). Risk-based approach to evaluate the public
health benefit of additional wastewater treatment. Environmental science &
technology, 37(9), 1882-1891.
90
Speece, R. E. (2008). Anaerobic biotechnology and odor/corrosion control for
municipalities and industries: Archae Press.
Tay, J.-H., & Zhang, X. (2000). A fast predicting neural fuzzy model for high-
rate anaerobic wastewater treatment systems. Water Research, 34(11), 2849-
2860.
Tezel, U., Guven, E., Erguder, T. H., & Demirer, G. N. (2001). Sequential
(anaerobic/aerobic) biological treatment of Dalaman SEKA Pulp and Paper
Industry effluent. Waste Management, 21(8), 717-724.
Ting, W.-H., & Huang, J.-S. (2006). Enhancement of denitrification in upflow
sludge bed reactors with sludge wasting. Journal of Environmental Engineering,
132(4), 468-475.
Torkian, A., Eqbali, A., & Hashemian, S. (2003). The effect of organic loading
rate on the performance of UASB reactor treating slaughterhouse effluent.
Resources, Conservation and Recycling, 40(1), 1-11.
Torres, M. L., & Lloréns, M. d. C. E. (2008). Effect of alkaline pretreatment on
anaerobic digestion of solid wastes. Waste Management, 28(11), 2229-2234.
Uzal, N., Gökçay, C. F., & Demirer, G. N. (2003). Sequential (anaerobic/aerobic)
biological treatment of malt whisky wastewater. Process Biochemistry, 39(3),
279-286.
Verma, S. (2002). Anaerobic digestion of biodegradable organics in municipal
solid wastes. Columbia University.
Veronez, R., Orra, A., Ribeiro, R., Zaiat, M., Ratusznei, S., & Rodrigues, J.
(2005). A simplified analysis of granule behavior in ASBR and UASB reactors
treating low-strength synthetic wastewater. Brazilian Journal of Chemical
Engineering, 22(3), 361-369.
Vlyssides, A., Barampouti, E. M., & Mai, S. (2008). Determination of granule
size distribution in a UASB reactor. Journal of environmental management, 86(4),
660-664.
Wolmarans, B., & De Villiers, G. H. (2004). Start-up of a UASB effluent
treatment plant on distillery wastewater. Water SA, 28(1), 63-68.
Yan, Y.-G., & Tay, J.-H. (1997). Characterisation of the granulation process
during UASB start-up. Water Research, 31(7), 1573-1580.
Yen, H.-W., & Brune, D. E. (2007). Anaerobic co-digestion of algal sludge and
waste paper to produce methane. Bioresource technology, 98(1), 130-134.
91
Yetilmezsoy, K., & Sakar, S. (2008). Improvement of COD and color removal
from UASB treated poultry manure wastewater using Fenton's oxidation. Journal
of hazardous materials, 151(2), 547-558.
Yilmazel, Y. D. (2009). submitted by YASEMlN DiLSAD YILMAZEL in partial
fulfillment of the. MIDDLE EAST TECHNICAL UNIVERSITY.
Zeng, Y., Mu, S., Lou, S., Tartakovsky, B., Guiot, S., & Wu, P. (2005). Hydraulic
modeling and axial dispersion analysis of UASB reactor. Biochemical
Engineering Journal, 25(2), 113-123.
Zheng, Z. (2011). World production and trade of pistachios: the role of the US
and factors affecting the export demand of US pistachios.
Zhou, L., & Mancl, K. (2007). Calculating Loadings Rates for Design of Small
Flow Onsite Wastewater Treatment Systems Hydraulic vs. Organic Loading. The
Ohio State University, 2.
Zoutberg, G. R., & Eker, Z. (1999). Anaerobic treatment of potato processing
wastewater. Water Science and Technology, 40(1), 297-304.

92

93
APPENDIX A
CALIBRATION CURVES FOR BIOGAS COMPOSITION ANALYSIS
Figure A-1. Calibration Curves of CH4, N2, CO2 & H2 for Biogas Composition Analysis
y = 1E-12x + 9E-09R² = 0,9999
0
0,0000002
0,0000004
0,0000006
0,0000008
0,000001
0,0000012
0,0000014
0,0000016
0,0000018
0 500000 1000000 1500000 2000000
CH4
y = 9E-13x - 1E-08R² = 0,9997
0
5E-08
0,0000001
1,5E-07
0,0000002
2,5E-07
0,0000003
3,5E-07
0 100000 200000 300000 400000
N2
y = 2E-12x + 4E-09R² = 0,9999
0
0,0000001
0,0000002
0,0000003
0,0000004
0,0000005
0,0000006
0,0000007
0,0000008
0,0000009
0,000001
0 200000 400000 600000
CO2
y = 4E-11x - 9E-08R² = 0,9932
0
5E-08
0,0000001
1,5E-07
0,0000002
2,5E-07
0,0000003
3,5E-07
0 5000 10000 15000
H2