anaerobic digestion of classified digestion of classified msw is attractive since it pro-duces a...
TRANSCRIPT

ANAEROBIC DIGESTION OF CLASSIFIED
NN NICIPAL SOLID WASTES
By
Michael K. Stenstrom
Associate Professor andPrincipal Investigator
and
Adam S . NgPrasanta K. BhuniaSeth D . Abramson
Graduate Research Assistants
A Final Report to Cal Recovery Systems, Inc .
and Southern California Edison Company
October 1981

ACKNOWLEDGMENTS
This work was supported by the Southern California
Edison Company . The first year it was funded directly by
Southern California Edison . During the second year it was
funded by Edison through Cal Recovery Systems of Richmond,
California .
The authors are appreciative of the help and sugges-
tions of Mr. Lory Larsen of Edison and Dr . Luis Diaz of
Cal Recovery Systems .
i

ABSTRACT
Municipal Solid Waste is presently a serious problem in urban areas
such as Los Angeles . There is an increasing demand for more landfill
area, but political pressure and the mushrooming cost of real estate
makes acquisition of new landfill sites nearly impossible .
In response to the need for municipal solid waste disposal, a number
of alternative disposal systems have been proposed . Many are based on
classification of waste followed by some type of thermal processing . An
alternate method is to use anaerobic digestion of a portion of the organic
materials in the waste . Anaerobic digestion has the advantage of produc-
ing a medium BTU gas which can be used for electric power production or
can be upgraded to produce home heating fuel .
This report discusses the results of a two-year investigation to
determine the suitability of Los Angeles area municipal solid waste for
producing digester gas . An experimental study was conducted using four
50 gallon pilot-scale digesters . The digesters were operated at organic
loading rates ranging from 0 .10 lb VS/ft3 day to 0 .25 lb VS/ft3 day and
over hydraulic retention times ranging from 15 to 30 days . Feed solids
concentration ranged from 3 .1 to 10 .1% VS . In all cases the municipal solid
waste was blended with raw, primary sludge obtained from the Hyperion
Treatment Plant in a ratio of 80% waste to 20% sludge, on a volatile solids
mass basis .
The results of the experimental investigation show that a medium BTU
gas (55-60% methane) can be produced at a rate of 6 .5 to 7 .5 ft3 gas/lb VS
ii
applied . The highest gas productions were obtained at the lowest load-
ing rate . At higher loading rates reduced gas productions were observed,
and this reduction is attributed to the inability to adequately mix the
digesters .
iii

iv
TABLE OF CONTENTS
ACKNOWLEDGEMENT
ABSTRACT
TABLE OF
LIST OF TABLES
LIST OF FIGURES
INTRODUCTION
CONTENTS
i
ii
iv
vii
viii
1
LITERATURE REVIEW 3
I . Background 3
II . The Anaerobic Digestion Process 5
III . Technical Evaluation 7
A. Sources, Quantity, and Characteristics of MSW 9
1 . Moisture Content 19
2 . Particle Size 19
3 . Particle Density 20
4 . Chemical Composition 20
5 . Mechanical Properties 21
B. Preprocessing Unit Operations for Resource Recovery 21
1 . Shredders 22
2 . Screens 23
3 . Air Classifiers 24
4 . Magnetic Separators 24
C. Preprocessing Systems for Energy Recovery 25

v
D. Pretreatment 26
E . MSW Digestion Performance Parameters 32
1 . Nutrient Requirements 32
2 . Organic Loading Rate and Hydraulic RetentionTime
33
3 . NSW Feed Slurry Concentration 35
4 . Temperature 35
5 . Mixing 36
6. Gas Quantity and Quality 38
7. Dewatering Characteristics and Residue Disposal 40
8 . Reactor Design 42
IV . Economic Studies 43
V .
EXPERIMENTAL
Summary
PROCEDURES
48
51
I . Feedstock 51
II . Experimental Apparatus 53
III . Start-Up Procedure 53
IV . Feeding Procedures 55
V . Analytical Methods 55
A. pH, Alkalinity, Ammonia 55
B . Volatile Fatty Acids, Gas Composition 56
C . Solids Analysis 57
RESULTS AND DISCUSSION 58
I . Santa Monica Survey 58
II . Digestion Results 58

vi
III . Effects of Organic Loading Rate and HydraulicRetention Time in Digesters
74
CONCLUSIONS AND RECOMMENDATIONS 81
REFERENCES CITED 84

1 .
2 .
3 .
4 .
5 .
6 .
7 .
8 . Methods for Treatment of Cellulose to Increase Digestibility 30
9 .
10 .
vii
LIST OF TABLES
Typical Operational Criteria for the Anaerobic DigestionProcess- Mesophilic Range
8
Projection of Municipal Solid Waste Generation Rates 10
Refuse Composition Data 11
Estimated Average Municipal Solid Waste Composition, 1970 15
Quantities and Percentages of Municipal Refuse 16
Municipal Refuse Composition, Percent by Weight 17
Comparative RDF Characteristics 28
Alternate Reactor Designs 44
State of the Art Design Criteria for MSW Digestion 50
Survey Categories for Santa Monica Municipal Solid Waste 52
Results of the Santa Monica Municipal Solid Waste Survey 59
Gas Production per Unit Volatile Solids Summary 65
Digester Parameter Summary 66
Municipal Solid Waste to Methane Studies 82

viii
LIST OF FIGURES
1 . Anaerobic Digestion Preprocessing Systems 27
2 . Flow Process Diagram of Anaerobic Digestion Usedfor Dynatech Economic Analysis
45
3 . Pilot Scale Digester 54
4 . Gas Production for Digester Number 1 60
5 . Gas Production for Digester Number 2 61
6 . Gas Production for Digester Number 3 62
7 . Gas Production for Digester Number 4 63
8 . Digested Sludge pH as a Function of Time 67
9 . Digested Sludge Alkalinity 68
10 . Digested Sludge Ammonia Concentration 69
11 . Digested Sludge Total Volatile Acids Concentration 70
12 . Digested Sludge Total Solids Concentration 71
13 . Digested Sludge Volatile Solids Concentration 72

LIST OF FIGURES (Continued)
ix
14 . Gas Production as a Function of Organic Loading Rate 76
15 . Volatile Solids Destruction as a Function of OrganicLoading Rate
77
16 . Total Volatile Solids as a Function of OrganicLoading Rate
78
17 . Gas Production as a Function of HydraulicRetention Time
80
INTRODUCTION
The recent upward trend in energy costs has created renewed
interest in novel, or heretofore uneconomical energy production
techniques . A number of alternate technologies have been evaluated,
including well-known methods such as passive solar heating, to poorly
understood methods such as wave energy generation .
Energy production from biomass has become an important research
topic . Many methods are being developed, including fermentation tech-
niques to produce alcohols, combustion of waste biomass, and novel pyroly-
sis techniques . Anaerobic digestion of wastewater derived sludges is a
particularly well-known biomass energy production technique, and has
been used extensively at wastewater treatment plants to reduce mass
and volume of waste sludges . Anaerobic digestion of waste sludges
with energy recovery has been a commercially viable energy production
technology for over 50 years .
Application of anaerobic digestion to other wastes has not found
widespread commercial acceptance . A number of farm wastes, such as cow
manure, have been treated in anaerobic lagoons for many years, but this
application is primarily a waste disposal technique, rather than an energy
production technique . One application of anaerobic digestion which appears
attractive is the anaerobic digestion of classified municipal waste (MSW,
garbage and refuse which has been shredded and sorted) .
Solid waste production is an increasingly more important problem in
urban areas . The volume of waste production is increasing rapidly, while

the availability of landfill sites is declining . Existing landfills
are being exhausted and the legal and financial problems of opening
new landfills are causing delays which severely limit the availability
of disposal sites . Anaerobic digestion of municipal solid waste is
finding renewed interest due to this shortage .
Anaerobic digestion of classified MSW is attractive since it pro-
duces a medium BTU gas (550-650 BTU/ft 3 ) without producing the air pollu-
tion associated with incineration . In many urban areas, especially areas
with air pollution problems like Los Angeles, this can be a major advan-
tage . Unfortunately, much of the pilot scale experience with digestion
of classified MSW has been poor, in direct contrast with bench scale
studies . The difficulties with larger scale devices is partly attributed
to insufficient classification and pretreatment, and partly due to mixing
problems . It appears that many of the pretreatment techniques do not re-
move a sufficient portion of the indigestibles .
The objective of the study herein was to evaluate the Cal Recovery
preprocessing technique in medium scale pilot (50 gallon) digesters to
determine if economical gas production rates could be obtained . The
effect of organic loading rate, influent solids concentration and reten-
tion time were also evaluated .

LITERATURE REVIEW
I .
BACKGROUND
Anaerobic digestion has been used as a means of wastewater sludge
volume reduction and stabilization for many years . The low-to-medium BTU
gas generated from the process provides a portion of heat and power re-
quirements to treatment plants . The successful application of anaerobic
digestion in wastewater treatment plants led to the attempt by Babitt (1936)
to treat domestic solid wastes by the anaerobic digestion process ; however,
these early results were generally unsuccessful and consequently the feas-
ibility of the concept was not pursued for many years .
Interest in the digestion of municipal solid waste (MSW) was revived
in the late 1960's principally by its potential for energy recovery . The
thrust of research was initiated by Golueke and co-workers at the University
of California, Berkeley . As part of a five-year comprehensive study on solid
waste management, Golueke, et al . (1971) examined the feasibility of digesting
"synthetic" MSW with sewage sludge and animal manure . Their results showed
that a high percentage of the organic refuse could be anaerobically digested
to form methane and carbon dioxide gases . In line with Golueke's preliminary
work, Klein (1972) and McFarland, et al . (1972) investigated the technical
feasibility of digesting "as received" MSW with minimal pretreatment (shred-
ding only) . In these studies, a 400 gallon pilot-scale digester was operated
to determine the effect of the solid wastes on the digestion process and its
potential for reducing the bulk of the input material . Their 18-week results
confirmed Golueke's initial laboratory findings and further demonstrated
that a high proportion of the "as received" MSW could be digested with
3

sewage sludge over an extended period of time . Brown, Pfeffer and Liebman
(1976) at the University of Illinois conducted a major study investigating
the economic feasibility of digesting processed MSW with limited addition
of sewage sludge . The main objective of their four-year program was to
determine the cost of methane production through a multi-step process which
included pretreatment of the MSW, digestion, gas separation, sludge dewater-
ing and residue disposal . Using a 100-gallon pilot plant operated at thermo-
phillic temperatures and processed MSW from three geographical locations,
the investigators examined the effects of recycling, nutrient addition and
caustic pretreatment on MSW digestion, and the settability and dewatering
characteristics of the resulting sludge . Computer simulation of their results
showed that the overall process is economically sound with the economics being
most sensitive to the credit allowed for refuse disposal .
Ongoing research in this field includes work from private business and
Governmental agencies . Among the most active are Biogas of Colorado, Cal
Recovery Systems, Institute of Gas Technology, Dynatech, Systems Technology
Corporation, Southern California Edison, California Energy Commission, and
the U .S . Department of Energy (DOE) .
Presently, the only large scale MSW digester in operation is the Refuse
Conversion to Methane (RefCom) facility in Pompano Beach, Florida . This
process, now sponsored by the DOE, includes primary shredding followed by
ferrous metals recovery, secondary shredding, trommeling, and air classifica-
tion . The resulting material is then introduced to a pre-mix tank, where it
is blended with ra' sludge, nutrients, and water and subsequently transported
pneumatically into two mechanically agitated anaerobic digesters . The RefCom
facility is designed to process up to 100 tons of MSW per day, and its primary
4
technical objective is the demonstration of long-term and economically
attractive gas production rates . The experimental program is divided into
three phases including start-up, experimental programs and steady-state
operation at optimum conditions . The independent variables to be evaluated
are temperature, solids loading, feed slurry concentration and solid size .
A final report to DOE is scheduled to be submitted in late 1981 .
II . THE ANAEROBIC DIGESTION PROCESS
The anaerobic digestion process is a biological process used in waste
treatment for the controlled destruction of biodegradable organic material .
This process is currently applied at most major municipal wastewater treat-
ment plants and less frequently for the treatment of several types of indus-
trial and agricultural wastes . As a result of its widespread use for treating
municipal sewage sludge, an abundance of literature exists for its practical
application . However, despite the availability of the voluminous information,
development of process control parameters have been largely emphirical due
primarily to the extreme complexities in elucidating the microbial metabolic
pathways involved in the process . Much of the current research in anaerobic
digestion is directed towards understanding the complex ecosystem in the
digester with the objective of securing a more confident and reliable design
of the overall process . In this respect, reference is made to reviews by
Mah, et al . (1977), Zehnder (1978), Wolfe et al . (1979), and Zeikus (1980)
for a comprehensive microbiological and biochemical analysis of anaerobic
processes .
Anaerobic digestion commonly takes place in a closed reactor (i .e .,
concrete or steel tank) under controlled conditions . Two types of digestion
5

processes are now in common use : standard-rate and high-rate . In the
standard rate digestion process, the contents of the digester are usually
unheated and unmixed . Retention times for this process vary from 30 to 60
days . In the high-rate digestion process, the contents of the digester
are heated and completely mixed . The required retention time is usually
10 days or more . A combination of these two basic processes is known as
the two-stage digestion process . The primary function of second stage
(standard rate digester) is to separate the digested solids from the super-
nantant liquor .
To facilitate a basic understanding of anaerobic digestion, the diges-
tion process can be considered to be accomplished in two distinct phases :
acid fermentation and gas formation . In the first phase, the organic matter
to be digested is in solid form and, in order to become available to bacteria,
it is hydrolyzed by external enzymes produced by the bacteria and dissolved
in the liquid medium which surrounds them . The acid-forming bacteria then
take these dissolved compounds (simple sugars, long chained fatty acids,
etc .) and metabolize them into various volatile acids (acetic, butyric, etc .)
which serve as a source of food for the methane producing bacteria in the
second phase of methanogenesis . Certain species of the methane-producing
bacteria (methanogens) are also capable of reducing carbon dioxide to form
methane gas . In the overall process, the final end products of the complete
conversion of organic matter under anaerobic conditions will be methane and
carbon dioxide gas .
The two phases - opear to involve at least two physiological different
groups of bacteria . It also appears that the acid-forming bacteria possesses
a much higher growth rate and are fairly resillient,making them better able
to withstand sudden changes in environmental conditions than their
6

counterparts, the methanogens . In this sense, the conversion of volatile acids
(principally acetic acid) by the methanogens to methane is considered the
rate-limiting step in the digestion process . In a properly operating di-
gester, the two groups of bacteria reach an equilibrium at steady state
conditions . Careful control of the digestive process is required to main-
tain proper population balance between the acid forming and methane producing
bacteria . Control of the process is currentlfaccomplished by maintaining
favorable environment conditions for balanced microbial growth . Control
parameters include organic loading rate, feed quality, temperature, pH, and
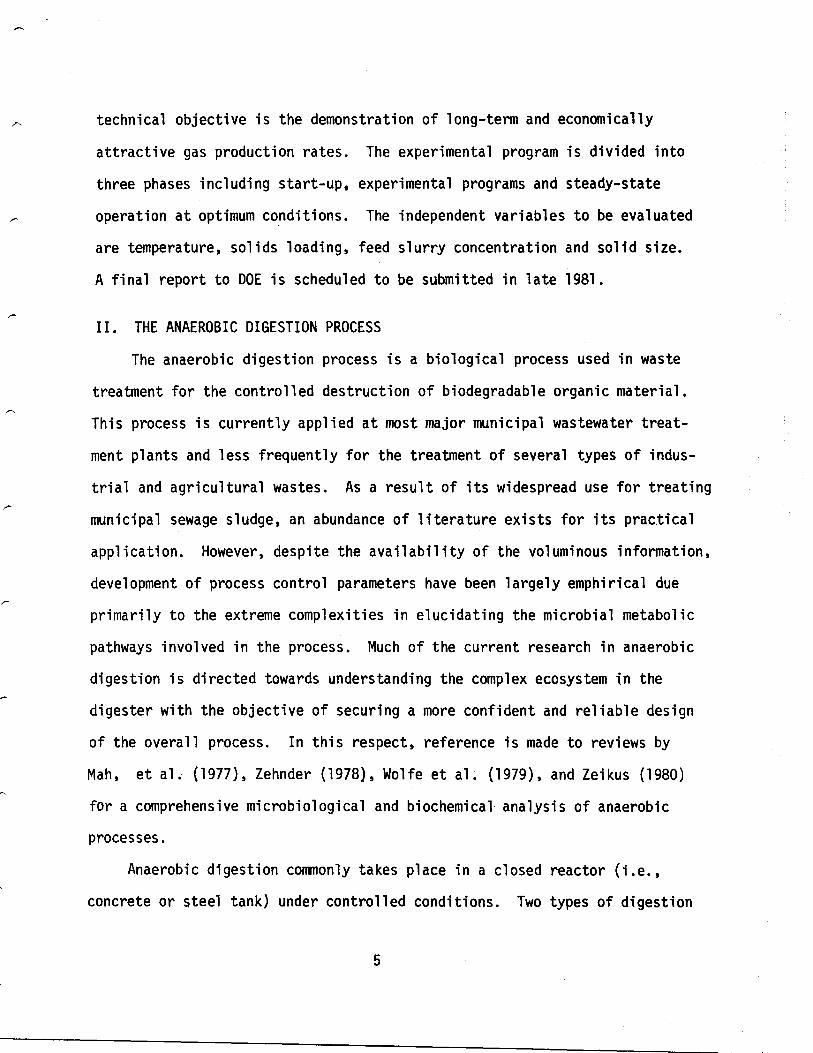
solids retention time . Current design procedures for sewage sludge digesters
are shown in Table 1 .
III . TECHNICAL EVALUATION
Much of the current knowledge and technology of MSW digestion is drawn
from the substantial amount of literature and field experience accrued through
years of digesting wastewater derived sludges . As such, most of the process
parameters describing digestion of sewage sludge and MSW are identical . In
general, MSW digestion for the volume reduction and the production of methane
involves four major elements : preprocessing, digestion, gas recovery, and
residue disposal . In the following sections, the more important considerations
for establishing MSW digestion process design criteria will be discussed . These
include the sources and characteristics of MSW ; MSW preprocessing and pretreat-
ment ; digester performance parameters such as nutrient requirements, organic
loading rate, retention time ; feed slurry concentration, temperature, and
mixing ; gas quantity and quality ; residue dewatering characteristics and
ultimate disposal, and reactor design .
7
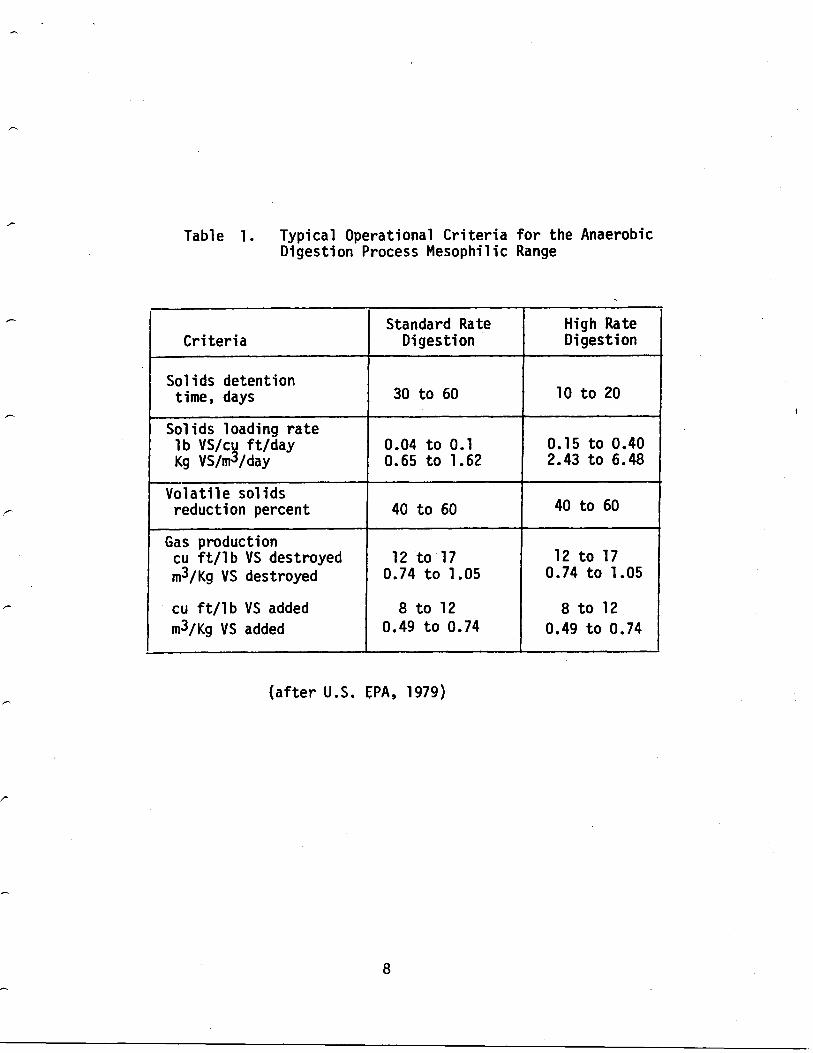
Table 1 .
Typical Operational Criteria for the AnaerobicDigestion Process Mesophilic Range
(after U .S . EPA, 1979)
8
CriteriaStandard RateDigestion
High RateDigestion
Solids detentiontime, days 30 to 60 10 to 20
Solids loading ratelb VS/cy ft/dayKg VS/m /day
0 .04 to 0 .10 .65 to 1 .62
0 .15 to 0 .402.43 to 6 .48
Volatile solidsreduction percent 40 to 60 40 to 60
Gas productioncu ft/lb VS destroyed 12 to 17 12 to 17m3/Kg VS destroyed 0 .74 to 1 .05 0 .74 to 1 .05
cu ft/lb VS added 8 to 12 8 to 12m3/Kg VS added 0 .49 to 0 .74 0 .49 to 0 .74

A . Sources, Quantity and Characteristics of MSW
MSW characteristics can vary significantly with respect to geograph-
ical location and time of year . Depending on the source of the MSW and its
characteristics, one of several configurations can be developed to preprocess
and/or pretreat the MSW to meet the requirements of the digestion process . In
this regard, evaluation of the characteristics of MSW from site-specific sources
is a critical factor in the determination of potential MSW to methane applicabil-
ity .
A standard definition of solid waste is essential for the estimation of
quantities and composition of solid waste . The recovery of resources from
"post consumer solid waste" includes solid waste generation from private
houses and apartments, small commercial businesses, and office buildings .
This definition excludes mining wastes, agricultural wastes, industrial process-
ing waste, demolition and construction debris, and wastewater-derived sludges .
The post consumer waste thus defined is commonly referred to as "Municipal Solid
Waste (MSW) ." In general, this is the waste "that the garbage trucks take away ."
In 1975 the Environmental Protection Agency (EPA), using government and
trade association statistics, estimated that an annual solid waste production
of 136 million tons are generated by residential and commercial sections in
the United States . This is equivalent to 3 .4 lb.of solid waste/capita/day .
The EPA then projected the solid waste generation for the years 1980, 1985,
and 1990 using the data generated by specialized'agencies that routinely
collect data . This data is summarized in Table 2 .
The compositio- of MSW varies with time, location and local conditions .
For example, the amount of yard waste is very sensitive to geographical
location, seasons and type of dwelling . In Table 3, MSW composition data
9

Table 2 . Projection of Municipal Solid WasteGeneration Rates
a : Residential and commercial sector generation only
b : Net waste is referred to total gross discards minus recovered .
(after EPA-OSWMP, 1975)
10
YearMillion Tons/Year lbs/Capita/Day
Total Gross Discard a Net Waste b^
1975 136 128 3 .40
1980 175 156 4 .28
1985 201 166 4 .67
1990 225 167 5 .00

Table 3 . Refuse-Composition Data
LocationFood
Notes
WastesYard
Wastes Misc . Ceramics MetalPaperProducts
Leather,Plastics & Rubber Textiles
Oil, PaintWood Chemicals Total
References
De Kalb County, Residential-from 16 .10 3 .76 5.50 5.17 8 .71 52.78 2.39 2.38 3 .21 100 .0 Daniels (1970a)
GA 12/11/68-12/13/68,
Delaware County
as received-averageM 'cipal, commercial, 17 .12 0 .32 3.19 11 .68 8.15 52 .40 3.66 2 .10 1 .3C 100 .0 Hahn (1970a)
Broomal, PA industrial from1/26/70-1/30/70,
New Orleans, Eastas received-average
9.81 7 .09 9 .50 8.21 44.18 3 .48 3 .32 2 .95 100 .0 Hahn (1970b)Residential, Commercial, 11 .46from 2/10/69-2/14/69,
City of Memphis,
as received-average
Residential-from 19 .70 12 .13 12 .53 9 .78 6 .63 29 .67 3 .05 4 .79 1 .72 100 .0 Achinger (1970)
TN 7/29/68-8/1/69--
Fulty County, GA
average
Commercial, Industrial, 13.08 1 .40 3.18 9.82 8.72 58 .34 3 .25 1 .78 0.43 100 . 0 Daniels (1970b)
Altanta Area
Southeastern
Municipal-as receivedaverage
Residential-as fired 20 .3 11 .1 11 .1 10 .5 6 .8 30 .2 3 .1 5 .2 1 .7 100 .0 Niessen (1970)
Community #1Southeastern
basisResidential-as fired 11 .0 9 .8 6 .9 9 .5 8 .1 44 .9 3.5 3 .2 3 .1 100 .0 Niessen (1970)
Community #2
Southeastern
basis
Residential-as fired 17.5 2.8 3.4 6 .5 8 .8 53 .2 2 .6 2 .0 3 .2 100 .0 Niessen (1970)Community #3Southeastern
basisResidential, Commercial, 12 .2 1 .6 3 .4 10 .3 8 .6 58 .7 3 .0 1 .8 0 .4 100 .0 Niessen (1970)
Community #4Long Island, NY
Industrial-as fired basisPredominantly household 10 .0 5 .0 6 .0 12 .0 10.0 47 .0 3 .00 (4 .0) 1 .0 3 .0 3 .0 100 .0 Kaiser, et al . (1971)
Town of Babylon
City of Berkeley,
minor quantities com-mercial & industrialResidential, Commercial 20.06 5.02 7.10 11 .33 8 .71 44 .61 1 .06 100 .0 Golueke et al . (1970)1 .85(2 .11)0 .26
CA 1967-as received basis

Location
Long Island, NY
City of New OrleansLA
4-City, NJ Region
Composite
Hempstead, LongIsland, NY
Johnson City, TN
Weber County, UT
Cincinnati, OH
Alexandria, VA
San Diego, CA
Genesee County,NY
Flint, MI
Notes
Household-June 1966Household-Feb . 1967
Household Average-j9) May 15, 1978
Average for Paterson,Clifton, Passaic, Wayne
As collected, includes9.05 adjusted moisture
Predominantly Resi-dential-as received
Residential andCommercial excludingbulky & industrial
Table 3 (continued)
Residential, 10/67Municipal, 7/68
Residential & Com-mercial, 4/68
Residential, 10/66
Residential & Com-mercial, 5/68
Residential & Can-mercial, 1967
As collected, includescommercial, industrial,domestic, & demolitionwastes
Annual Average
1 1
FoodWastes
YardWastes
GlassMisc .
Ceramics MetalPaper
ProductsLeather,
Plastics & Rubber Textiles WoodOil, PaintChemicals Total References
9 .89 26.17 9 .62 8 .05 36 .26 2 .95 3.16 3 .90 100 .0 Mear Symposium (1967)~~
u
w16 .70 0 .26 11 .37 10 .60 53 .33 3 .54 2 .24 1 .46 100 .0
18 .90 9.20 16 .2 12 .2 39 .4 1 .5 2 .6 100.0 Switzger (1969)
8.3 13.3 8.96 6 .44 9.44 43 .87 2 .66 4 .52 2 .96 100 .49 Ingram, et al . (1968)
8.40 6 .88 10 .01 6.85 52 .70 1 .52 0.76 0 .76 2.29 99 .98 Kaiser (1968a)
10.9 17 .6a 9 .6 8 .5 42 .6 4 .6 3 .1 3 .2 Kaiser et al . (1968b)
3 .012 .0 20 8 46.0 4 7 .0 100.0 Kaiser et al . (1967)
26 .1 1 .6 1 .0 11 .0 10 .9 45 .0 1 .7 1 .0 1 .4 0 .4 100 .01 Willson (1977)
34.6 2 .3 0 .2 9.0 10 .4 34 .9 3 .4 2 .4 2 .0 0 .8 100 .0
8 .5 4 .2 5 .9 4.6 8 .4 61 .8 2 .5 2 .0 2 .2 100 .1
28 .0 6 .4 - 7.5 8 .7 42 .0 1 .6 1 .0 1 .4 2 .7 99 .3 U .S . PHS (1966)
7 .5 9 .5 3 .4 7 .5 8 .2 55 .3 3 .1 3.7 1 .7 99 .9 Willson (1977)
0.8 21 .1 8 .3 7 .7 46 .1 0 .3 4 .7 3.5 7 .5 100.0U .S . PHS (1967)
7 .11 1 .99 23 .62 3 .34 4 .64 20 .39 1 .49 3 .01 22 .41 12 .00 100 .0U.S. DHEW (1968a)
32 . 13 .5 0 .3 17 .9 14 .5 17 .5 2 .3 0 .5 0 .9 100 .0U .S . DREW (1968)

I
Location
Notes
Table 3 (continued)
Food
Yard
Glass
Paper
Leather,
Oil, PaintWastes Wastes Misc .
Ceramics Metal
Products Plastics & Rubber Textiles Wood Chemicals Total References
Genesee County,MI
Santa Clara, CA
Philadelphia, PA
Jefferson County, KY
New Jersey
Ohio
Arizona
California
Tennessee
General Analysis
Hamilton, Canada
Domestic
collected, domestic,average
Includes significantquantities of indus-trial wastes, ascollected
As collected, residen-tial ; average 66/67
As collected
As collected
As collected
As collected
As collected
From study made byPurdue University
June 28-July 26
26.0
2 .3
5 .0
19 .8
10 .0
28.0
22.0
15.0
26.0
12.0
31 .0
10 .8
23 .8
-
12 .0
13 .0
0 .2
16.4
1 .3
-
14.5
14 .3
11 .8
12 .7
7.6
9.1
8 .4
10.5
9.3
4.0
8.0
8.0
9.0
8.0
10.0
2 .0
7.0
11 .0
11 .0
6.0
8.0
7.0
5 .0
34.0
47 .5
54 .4
59 .1
51 .0
42 .0
43 .0
54 .0
46.0
42.0
33 .0
1 .0
0 .2
1 .8
1 (ave .)
0 .4
1 .2
2 .6
0 .7
1 (ave .)
2 .4
4 .0
3 .0
2 .0
2 .0
0 .3
2 .4
6 .0
- .
-
-
0 .8
100 .0
100 .0
100 .0
100 .0
81 .0
93.50
86 .0
82 .0
99 .3
100 .0
99 .0
U .S . OHEW (1968b)
FMC Corporation (1968)
Purdom (1966)
U.S. DHEW (1967)
Hickman (1968)
U.S. DHEW (1968c)
Willson (1977)
1 .5
4 .0
3 .0
1 .0
2 .0
5 .0
1 .0
1 .0
0 .6
2 .0
0 .7
1 .3
&Average of four tests, percent of yard wastes : 6/1/66, 33.3 ; 6/23/66, 19.0; 2/21/67, 0 .3 ; 4/3/67, 17 .9 .

are shown for various geographical locations within the United States as
presented by Wilson (1977) . The composition data were generated by methodo-
logical sampling, segregation and weighing of MSW .
Table 4 shows the seasonal variation of municipal solid waste-composition
for the southern parts of the United States . The results in Table 4 have
been adjusted, category by category, to a moisture level basis correspond-
ing to the manufactured state of the material entering the refuse storage
bins on an "as discarded" basis . The discarded solid waste mixed with other
refuse materials may either lose or gain moisture . For example, food wastes
transfer significant amounts of moisture to paper and textiles . The "as dis-
carded" basis is useful for true relative magnitude of waste generation of
various categories, for estimating garbage potential and forecasting refuse
generation rates .
Brown and Caldwell (1979) presented data on the composition and projected
quantities of MSW generated in Southern California . This is shown in Table 5
and 6. The composition data for Los Angeles County was developed by a weight
averaging survey from the City of Los Angeles with an estimate of the commer-
cial waste generated in the county . The national average composition of MSW
prepared from surveys reported between 1968 and 1972 is also included in
Table 6 .
From Table 6, Brown and Caldwell (1979) reported the following trends
for the composition of MSW in Los Angeles :
Over a six-year period, there was a'substantial decline in the
proportion of mixed paper in MSW . This was accomplished by a
small reduction in the newspaper component and an increase in
yard trimmings . The net effect is that total digestible organics
have declined by almost 20 percent within six years .
14

Table 4 . Estimated Average Municipal Solid Waste Composition, 1970(weight % as discarded)
a : The refuse composition in winter in southern states is similar tothat shown in fall .
(after Wilson, 1977)
15
Average
Category Summer Fall Winter Spring AsDiscarded
AsMixed
Paper 31 38 .9 42 .2 76 .5 37 .4 44 .0
Yard Waste 27 .1 6 .2 0 .4 14 .4 13 .9 9 .4
Food Waste 17 .7 22 .7 24 .1 20 .8 20 .0 17 .1
Glass 7 .5 9 .6 10 .2 8 .8 9 .8 8 .8
Metal 7 .0 9 .1 9 .7 8 .2 8 .4 8 .6
Wood 2 .6 3 .4 3 .6 3 .1 3 .1 3 .0
Textiles 1 .8 2 .5 2 .7 2 .2 2 .2 2 .6
Leather & Rubber 1 .1 1 .4 1 .5 1 .2 1 .2 1 .5
Plastics 1 .1 1 .2 1 .4 1 .1 1 .4 1 .4
Miscellaneous 3 .1 4 .0 4 .2 3 .7 3 .4 3.6
Total 100 .0 100 ..0 100 .0 100 .0 100 .0 100 .0

Table 5 . Quantities and Percentages of Municipal Refuse
(After Brown and Caldwell, 1979)
16
1980 1990 200 0
County Quantitytons/day of
Percenttotal
Quantitytons/day
Percentof total
Quantitytons/day of
Percenttotal
Los Angeles 17,000 61 18,200 54 19,000 50
Orange 5,700 20 7,300 22 8,600 23
Riversidea 1,800 6 2,600 8 3,200 8
San Bernardinoa 2,400 8 3,300 9 3,900 10
Ventura 1,500 5 2,400 7 3,400 9
Total 28,500 100 33,800 100 38,100 100

Table 6 . Municipal Refuse Composition, Percent by Weight
aSource : Envirogenics Systems Co . Systems Engineering Analysis of Solid Waste Managementin the SCAG Region . June 1973
bSource : Alpern, Robert M . 1974 . As reported in Zinder, et al . Quantity and Compositionof Organic Solid Wastes in Southern California and Their Potential as Substratesfor Microbial Methane Production . 1978 .
cSource : Alpern, Robert M . Interdepartmental Correspondence to Mr . William Guber, Assist .Director, Bureau of Sanitation, City of Los Angeles . July 1977 .
dSource : Huitric, Ray . Personal Communication . Los Angeles County Sanitation Districts,February 1979 .
.Weighted average of "1976-' 7 City of Los Angeles" and "Commercial ."(National Center for ResourLa Recovery, Inc . Municipal Solid Waste . . . Its Volume, Composi-
tion and Value, NCRR Bulletin, Volume III, No . 2 . Spring 1973 .
(After Brown and Caldwell, 1979)
17
Item City of Los Angeles Commercial d Los AngelesCountryAverage
NationalAveragef1968-721971-72a
1973-74b
1976-77 c
Digestible OrganicsPaper
Cardboard 3 .7
10.1
3.6 5 .4 7 .6 11 .6Newspaper 11 .3
8.9
7 .8 4 .2 9 .1 8 .6
Mixed Paper 25 .2
4.6
3.9 2 .0 4 .4 22 .3Food Waste 5 .4
4.3
4.3 3 .7 6 .4 14 .6Yard Trimmings 26 .9
31 .7
34.8 1 .1 23 .0 12 .5
Subtotal 72 .5
59.6
54.4 16 .4 50 .5 69 .6
Undigestible OrganicsPlastics 2 .3
3.4
3 .4 3 .1 5 .3 1 .7Textiles 2 .3
3 .3
4.3 2 .2 4 .9 2 .4Leather & Rubber 0 .5
1 .4
1 .7 0 .5 1 .5 1 .8Lumber 2 .1
6.3
6 .7 8.4 12 .6 2 .5
Subtotal 7 .2
14 .4
16.1 14 .2 24 .3 8 .4
InorganicsMetals
Ferrous 5 .2
3.5
4 .8 2 .6 5 .5 6 .7Aluminum 0 .7
1 .6
0.9 0 .4 1 .0 0 .9Other 0 .2
0.6
0 .4 0 .2 0 .4 0 .4Glass 7 .3
4.3
7.1 3 .4 7 .9 10 .3Ceramics & Stone 0 .7
1 .9
2.5 0 .1 1 .7 NADirt & Miscellaneous 6 .2
14.4
13.8 0 .0 8 .6 4 .5
Subtotal 20 .3
26.3
29.5 6 .7 25 .1 22 .8
TOTAL 100 .0
100.3
100.0 37 .3 99 .9 100 .8

•
Plastics have increased by about 50 percent, textiles by
more than 80 percent, and lumber by more than 200 percent .
Overall total undigestible organics have increased by more
than 120 percent .
• A threefold increase in ceramics and stone and a doubling
of the dirt and miscellaneous category are evident . Total
inorganics have increased by about 10 percent .
Comparing the county data with the national data revealed the following :
•
Total digestible organics for the county, 50 .5 percent, are
significantly less than the national average of 69 .6 percent .
•
Total indigestible organics for the county, 24 .3 percent,
are greater than the national average of 8 .4 percent .
Total inorganics for the county, 25 .1 percent, are slightly
higher than the national average of 22 .8 percent .
The data presented here on generation rate and composition of MSW within
Los Angeles County and the nation are indicative of MSW variability in time
and location . As such, care should be exercised before extrapolating results
from one source of MSW to a new source of MSW . Because of the great variabil-
ity of generation rate and composition, the design of solid waste management
systems must provide high safety factors for the capacity and flexibility
of operation, and must be designed for extraordinary contingencies . This
requirement of-L •i results in overdesign, and under-utilization, in order to
be able to process all refuse material . For the design of resource recovery
equipment and control of processes, knowledge of the physical, chemical and
biological properties of mixed refuse and its components is essential . The
18

characteristics which are of most interest are moisture content, particle
size, particle density, chemical composition and mechanical properties .
i) Moisture content :
Moisture content of various components of refuse changes with time
because the
transfer of moisture occurs at storage tanks and at the time
of transport of mixed refuse . According to Hickman (1976) the moisture
content is very important for the design of storage and conveying equipment
because changes in moisture content alters the material characteristics such
as size, density, and abrasiveness . Trezek and Savage (1975) have shown that
moisture content in the feed has a significant influence on shredding energy
requirements with energy requirements being minimum for moisture content in
the range of 35 to 40 percent . In the case of permanent magnet systems for
ferrous recovery, Blayden (1976) reported that the moisture content has an
effect on recovery and purity, both decreasing with an increase in moisture
content ; however, for electronic separators Blayden found that recovery
increases with increases in moisture content . For pyrolysis, Sullivan,
et al . (1972) determined that the moisture content of the feed has an in-
fluence on end product formation and that lower moisture content requires
less heat to reach operating temperatures, thereby reducing the overall energy
requirements in pyrolysis operation .
ii) Particle size
Particle size is an important parameter in resource recovery
operation because most separation processes require specific and relatively
uniform size for efficient operation . The measurement of particle size of
municipal solid waste (MSW) is difficult because of its odd shape . The
common procedure for measurement of particle size is by sieving . Particle
size has a significant effect on all eddy current processes in resource
19

recovery (Vesilind & Reimer, 1981) . Particle size also has a significant
effect on landfill gas production in that smaller particles produce more
gas . Dewalle, et al ., (1978) proposed that a decrease in size of refuse
particles by a factor of 10 increases landfill gas production by a factor
of 4 .4 . It also appears that digester efficiency and mixing requirements
are a function of particle size . Unfortunately, the energy consumption of
MSW preprocessing systems is inversely related to particle size .
iii) Particle Density
Material densities have a strong effect on disposal as well as
resource recovery operation . The low initial density and poor compaction
property (at moderate pressures) of municipal solid waste decreases carrying
capacity and contributes to high-cost collection and hauling . Density of
shredded refuse is also important for the design of storage tanks and re-
trieval systems because of its changes with time due to gravity . Chain, et al .
(1977) has reported that the density of refuse has an effect on landfill gas
production with greater densities decreasing gas production . Dewalle, et al .
(1976) proposed that this effect may be due to the reduction of exposed sur-
face area available for enzymatic hydroloysis .
iv) Chemical Composition
The economic recovery of materials and/or energy depends on the
chemical composition of the refuse and its heating value . The chemical compo-
sition of the refuse changes with both time and location . The presence of
toxic substances and caustic materials in municipal refuse enhances corrosion
in refuse processing equipment ; can be a potential source of air and/or water
pollution ; and can inhibit digester performance . Wilson (1977) reported that
hydrocholoric acid is formed from plastics (i .e ., polyvinyl chloride and
20

vinylidene chloride) commonly found in refuse, when burned in air . Other
chemical characteristics of MSW such as its carbon/nitrogen ratio can have
a detrimental effect on the digestion process since many sources of MSW
are nitrogen poor .
v) Mechanical Properties
Information on mechanical properties of material is important for
the identification and quantification of the parameters governing the com-
minution of heterogeneous material such as municipal solid waste . Stress
strain data is especially important for the design of shredding equipment .
B . Preprocessing Unit Operations for Resource Recovery
Various systems have been attempted on a commercial scale for the
processing of MSW to recover valuable materials (aluminum, glass, etc .) and
to produce an organic fraction commonly referred to as refuse derived fuel
(RDF) . The types of systems developed and employed are largely determined
by specific requirements, market conditions, and other constraints depending
on any particular project . However, despite the commercial availability of
unit processing modules, a universally accepted preprocessing system does
not yet exist (Wright, 1978) . Lack of sufficient operating information and
experience ; the heterogeneous characteristics of MSW, and diverse site-specific
objectives have caused this void .
Although there are a number of possible arrangements of unit modules for
a given system, a typical material processing system will employ common units
such as shredders, tromels, air classifiers, magnetic separators and glass
extractors . The RDF production plants presently in operation are representa-
tive of first-generation facilities whose processes have and are continuing
to undergo extensive modifications . The MITRE Corporation (1979), under a DOE
contract, has summarized existing RDF facilities . A number of these facilities
21

are operational and others are evolving process configurations . For the
purposes of this report, the following sections will provide a brief descrip-
tion of unit operations
utilized in material processing systems . A
more complete analysis on function and design of unit modules is given by
Vesilind & Reimer (1981) .
i) Shredders
Size reduction of MSW is important and required for the conversion
of solid waste to a source of energy . The objective of shredding is volume
and particle size reduction . According to Ham (1975) shredded refuse is more
uniform in size, closer to homogeneity, and more compacted than unshredded
refuse . Shredding also reduces landfill volume requirements and is sometimes
justified solely on this basis . Shredding technology, borrowed largely from
mining industries, is difficult to apply in resource recovery because of the
non-homogeneity of MSW . Most of the machines used for shredding MSW are gen-
erally of the hammermill type . These include vertical axis hammermills (Tolle-
Mache Ltd . ; London, England and Heil Inc . ; Milwaukee, Wisconsin), horizontal
axis hammermills (Broyeurs Gonard ; Paris, France and Jeffrey Manufacturing Co . ;
Pennsylvania), vertical axis grinders (Eidal-International Corp .) and horizontal
axis impactors (Hazernag Co . ; New York, NY) .
The hammermill consists of a central rotor with radial hammers which are
free to move on pins, and are enclosed in a heavy-duty casing . In a horizontal
hammermill, the rotor is supported on both ends and feed is introduced by grav-
ity on a conveyor . The grate below the rotor controls the size of materials
because only material smaller than the grate opening is able to escape from
the casing . The vertical hammermill consists of a vertical shaft with a heavy-
duty casing, and clearance of the mill and casing reduce gradually downward
and thus reduce the size of the material as it moves through the machine .
22

The parameters controlling the size reduction of refuse are flow rate,
refuse moisture content, amount of material held within the shredder, resi-
dence time, and physical size of the shredder. According to Shiflett and
Trezek (1979) the product particle size distribution is a function of feed
particle size and mean residence time, while energy requirement is a function
of holdup and moisture content of the refuse . Trezek and Savage (1975) pro-
posed that higher speeds produce finer particle sizes, but require more
energy . The authors also state that the energy consumption increases with
higher feed flow rate and decreases with increasing moisture content, with
a minimum energy requirement at a moisture content range of 35 to 40 percent .
ii) Screens
The objective of screening is separation of material by size .
Screens used at the beginning of a resource recovery facility are for the
rough sorting of the refuse and screens used towards the end of the process-
ing system are for reclaiming organic materials and glass from shredded refuse .
There are basically two types of screens used for resource recovery : 1) recip-
ricating screens and 2) revolving screens (also refererd to as trommels) .
According to Savage and Trezek (1976) trommel screens are superior to
reciprocating screens because of lower capital cost and lower power consumption .
They reported that high flow rate reduces the efficiency of screens and the
rate of reduction is higher for vibrating screens than for trommels . They
also found that a trommel screen requires about 12 percent of the energy
required for a -omparable vibrating screen and that trommels operate at an
overall efficiency of about 90 percent compared to 72 percent for the vibrat-
ing screens .
23

iii) Air Classification
Air classification is a process used to separate light, mostly
organic material and heavy inorganic material from MSW by using a stream
of air . Shredded MSW is introduced near the mid-point of a vertical shaft,
and air is introduced in the bottom of the shaft at a high rate . The dense
particles move downward in the shaft . while the light particles rise . The
lighter particles are usually separated from the air stream by a cyclone .
Air classificiation geometry can have a significant effect on process per-
formance .
Worsel and Vesilind (1979) introduced a "total efficiency" parameter
(the product of light and heavy fraction recovered under a specific set of
conditions) for the evaluation of air classifier performance . They reported
that this parameter is an acceptable indicator of performance which can be
used to facilitate the evaluation and specification of air classifiers .
They also demonstrated that recovery of material is a function of air speed,
and that recovery appears to be maximum at an air speed of 1500 ft/min .
Murry and Liddel (1977) proposed that moisture content has little effect in
the recovery of light products, and that efficiency decreases by about 5
percent if moisture content is doubled . They also report a deterioration
in the recovery of lights with higher feed rates .
iv) Magnetic Separation
Magnetic separators are used primarily for the separation of ferrous
naterial from MSW . In a resource recovery system, magnetic separators are
used with two objectives : 1) the recovery of saleable material and, 2) to
increase the heat content and purity of OF for energy recovery by combustion
24

methods or digestion. Magnetic separators also reduce the wear on downstream
processing equipment by reducing the amount of abrasive ferrous material .
The magnetic separator is usually located after the primary shredder and some-
times following air classification .
Two types of magnetic separators frequently used for resource recovery
are 1) holding type separators and 2) suspended type separators . In the case
of holding type separators, the shredded MSW is fed directly onto the collect-
ing surface, whereas in suspended type separators, the collecting surface
moves above a conveyor belt loaded with shredded MSW .
C . Preprocessing Systems for Energy Recovery
Technology for the extraction of energy from MSW can be categorized
into two conversion processes : physiocochemical and biological . The physico-
chemical process involves various types of combustion methods and incineration
while the biological processes include anaerobic digestion and fermentation
schemes for alcohol production . The practical application to either process
requires preliminary separation into combustible-noncombustible and fermentable
nonfermentable fractions of MSW for efficient conversion .
The MITRE Corporation (1979) has categorized preprocessing sysetms into
five categories according to their product : coarse RDF, fine RDF, densified
RDF, powdered RDF and wet pulped RDF . Briefly, coarse RDF is produced by a
single pass through a shredding device that reduces MSW particle size and
homogenizes the combustible elements . Fine RDF is produced by adding a second
grinding or a shredding process to reduce the particle size even further .
Densified RDF is the product that results from processing fine RDF through
pellet mills commonly employed in the animal feed industry . Powdered RDF is
25

MSW turned into powder by a combination of mechanical, chemical and thermal
action . The resulting product is dry and free flowing . In wet pulping,
water is used as a medium for size reduction, inert separation, surge storage
and conveyance. Size reduction is accomplished by a wet pulper that grinds
MSW in a water medium into particles one inch or less in size while all other
material is rejected . Comparative RDF characteristics are shown in Table 7 .
Several patented preprocessing systems presently exist : Combustion
Equipment Associates (Bridgeport, Conn .) market powdered RDF known as Eco-
Fuel II while the Black Clawson process developed by Parsons and Whittermore,
Inc . (.Hempstead, NY) produces a pulped fiber RDF . The systems mentioned
above produce a RDF compatible with physiochemical methods for energy recovery .
Some preprocessing systems as applied to physiochemical processes will not neces-
sarily yield a readily digestible fraction for biological energy conversion .
As such, several preprocessing systems have been attempted to produce a RDF
specifically for digestion . These are shown in Figure 1 .
The Cal Recovery System appears to hold the most promise of the schemes
shown in Figure 1, as it provides a means of separating a highly organic or
digestible portion from the fiber portion of RDF . Cal Recovery's innovative
features may be a key determinant of economic feasibility of methane gas pro-
duction from anaerobic digestion . A description of the Cal Recovery System
may be reviewed from the work of Savage, Diaz and Trezek (1975) .
D . Pretreatment
Review of pretreatment technologies as applied to anaerobic digestion
processes include those in the preprocessing steps described in the last
section . Rationale for most-types of pretreatment methods lies in the fact
26

MSW-PSTORAGE-+ SHREDDER -+ TROMMEL -+ MAGNETIC-AIR CLASSIFICATION--p- LIGHT ORGANICS--* DIGESTIBLESSEPARATION (RD_
INERT FINES FERROUS
HEAVY INERT
1 . POMPANO, BEACH, FLA . - DEMONSTRATION PLANT(After Pfeffer, J.T ., 1976)
LIGHTS
LIGHTS
-IP. CYCLONE--* STORAGE BIN --
STONER --* ROTARY -OFIBERIZER--e'RDF --*DIGESTIBLES
<1 .5"
SCREEN <3/8"MSW-+PRIMARY SHREDDER-+AIR CLASSIFICATION
I HEAVIES•
MAGNETIC SEPARATION2. IGT'S CONCEPTIONAL BIOGAS SYSTEM
(After Ghosh, et al ., 1977)(Conceptual Design)
3. CAL RECOVERY SYSTEM(After Wright, 1978)
3 .. ,
lFERROUS
LIGHTS
90% IRECEIVING AND STORAGE -+SHREDDING 9 _AIR CLASSIFICATION
FIBER FRACTION90% 1/4"
•
PRIMARY TROMMEL -P SECONDARY TROMMEL
I HEAVIESop,MAGNETIC SEPARATION--* HEAVIES
1FERROUS
REJECTS TO LANDFILL
Figure 1 . Anaerobic Digestion Preprocessing Systems
DIGESTIBLES

Table 7
Comparative OF Characterists
NA : Not Available
(After Mitre Corp ., 1974)
a : Mitre Corp . (1979)b : Even (1977)c : Systems Technology Corp . (1977)d : Beningson (1975)e : U .S . EPA (1975)f : Mitre Corp. (1979)
Coarsea Fineb Densifiedo Powderedd Wet-Pulpede
Higher Heating Valueas Received (BTU/lb) 5,319 5,610 6,000 7,740 3,600
Ash (percent) 15-17 17 25 15-25f 25
Moisture (percent NA 23 10-16 2 .0 55
Nominal Particle Size(in .) 4-6 1 .5 0 .5x 1 .25 0.015 NA (<1)
Bulk Density (lb/ft3 ) 4-6 (est .) 8 28 30-34 NA
Handling/StorageCharacteristics Poor Poor Good Good NA

that the digestible portion of MSW consists primarily of paper products
containing about 75 percent carbohydrates, mostly in the form of cellulose .
Although cellulose is readily digestible, the portion that is tied up in
the lignin/cellular matrix is probably less than 50 percent degradable .
Since lignin is not fermentable under anaerobic conditions, it is probable
that more than 50 percent of the apparently digestible/pprtion of MSW re-
mains undigested over an extended period of time (Brown-Caldwell, 1978) .
In addition, the undigested lignin/cellulal material tends to build up in
the digester, creating mixing and scum problems . These problems will be
discussed further in the section entitled Mixing .
Pretreatment of the MSW or removal of a substantial portion of the
cellulose material from the MSW prior to digestion (as in the Cal Recovery
process) are two possible alternatives to deal with this problem) . In general,
pretreatment of MSW prior to biological conversion processes can be classified
into three methods ; physical, chemical-thermal or a combination of both . Vari-
ous methods of the pretreatment of cellulose to increase digestibility are
listed in Table 8 .
In regard to physical pretreatment, size reduction and separation of
inorganics appears to have the most significant impact on the economics of
biological conversion processes . Studies conducted by Ghosh, et al . (1976)
at the Institute of Gas Technology have shown that refuse particle size has
a significant effect on refuse digestibility . Their laboratory experiments
using refuse having median sizes of 10 .1 to 5 .1 mm demonstrated that lower
gas yields and gas production rates were obtained with the coarser refuse .
Unfortunately, the cost-effectiveness of various degrees of size reduction
and separation efficiencies for anaerobic digestion is not well established .
29
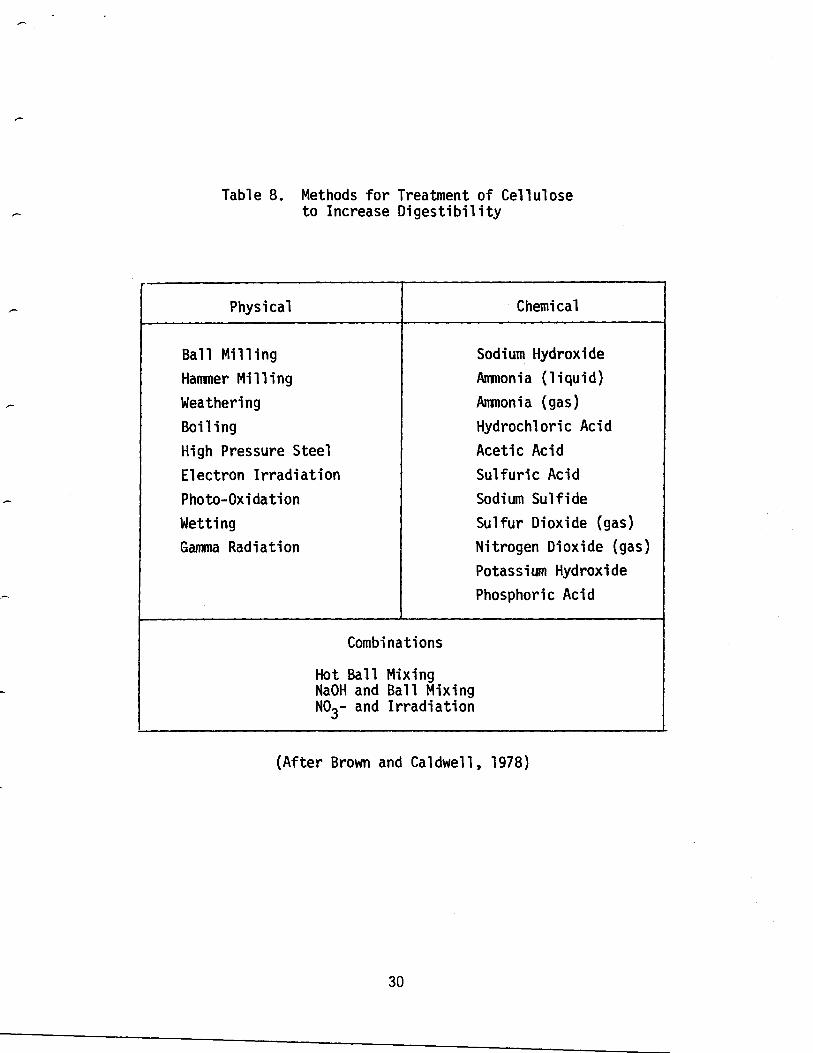
Table 8 . Methods for Treatment of Celluloseto Increase Digestibility
(After Brown and Caldwell, 1978)
30
r
Physical Chemical
Ball Milling Sodium Hydroxide
Hammer Milling Ammonia (liquid)
Weathering Ammonia (gas)
Boiling Hydrochloric Acid
High Pressure Steel Acetic Acid
Electron Irradiation Sulfuric Acid
Photo-Oxidation Sodium Sulfide
Wetting Sulfur Dioxide (gas)
Gamma Radiation Nitrogen Dioxide (gas)
Potassium Hydroxide
Phosphoric Acid
Combinations
Hot Ball MixingNaOH and Ball MixingN03- and Irradiation
Waste-Management, Inc ., is currently investigating the effect of particle
size and separation efficiency of the material handling and mixing systems
at the Pompano Beach facility . Results from this study should yield valuable
information concerning the relationship between particle size and biodegrad-
ibility and the amount of size reduction and separation necessary to facili-
tate material handling and mixing of solid waste slurries .
Several methods of chemical and thermal pretreatment for the bioconver-
sion of MSW to methane have been investigated at the bench scale . At present,
the most promising appears to be heat treatment under alkaline condition . It
has been reported that the mechanism by which alkali pretreatment increases
digestibility involves a swelling of the substrate resulting in an increase
in the size of pore spaces . Lignin is solubilized to phenols, isolating the
carbohydrate fraction and allowing greater accessability to microbial enzymes .
Elevated temperature and pressure aid in breaking down chemical bonds to yield
a product which is more susceptible to hydrolytic activity during anaerobic
digestion . McCarty (1976) has shown that peak biodegradability of alkaline
heated MSW occurs at pH 13 and 480•F . Further work (1977) demonstrated that
heat pretreatment of newspapers and alkaline conditions increased methane
production by 25 percent to 70 percent . Brown et al . (1976) showed that for
a caustic dose of 3g/lOOg of refuse and heating at 130•C for one hour, an
increase of over 30 percent in biogas production is observed in laboratory
digesters . In addition, it was discovered that the rate of substrate utiliza-
tion is increased therefore implying that the treatment could be effective
at shorter retention times .
The various experimental results cited indicate that alkali pretreat-
ment at elevated temperatures is an effective method to increase digestibility
31
of MSW ; however, there are unanswered questions with respect to scale-up
potential, disposal of the non-biodegradable, solubilized lignins in the
digester effluent and the cost effectiveness of such treatment .
E . MSW Digestion Performance Parameters
After the source of MSW has been carefully quantified, character-
ized, and preprocessed (which may include various degrees of physical, chemi-
cal/thermal pretreatment) to yield a rich organic fraction of MSW, it is ready
for digestion . Several parameters are important for the design and control of
MSW digestion with respect to the objective of achieving optimal performance
in terms of gas production and volatile solid destruction . Among these are
nutrient requirements ; organic loading rate and hydraulic retention time ;
feed slurry concentration ; temperature, and mixing .
i) Nutrient requirements :
Typical MSW is deficient in both nitrogen and phosphorus with
respect to microbial growth requirements in anaerobic digesters . Based on
typical refuse characteristics, Pfeffer, et al . (1976) performed a nitrogen
balance on an anerobic digester system and determined that the amount of
supplemental nitrogen required per pound of volatile solids fed to the system
is 19 .32 lbs/ton of volatile solids fed . Less information is available on
phosphorus requirement although it is generally considered to be much less
than nitrogen . Nutrient requirements can be satisfied by chemical addi-
tion or by introduction of organic materials rich in the needed nutrients
such as sewage sludge or animal waste. Chemical addition of nutrients
can become a significant cost factor in the overall process economics,
and it appears that nutrient supplementation from organic residue is a
32

preferred approach at this time . Mah, et al . (1980) at UCLA conducted a
series of laboratory digestion studies to assess the effect of nutrient
addition to MSW digestibility and gas production by adding various levels
of animal manure, sewage sludge, or a combination of both . Results indi-
cated that while a highly processed MSW (obtained from the Cal Recovery
System) could be digested without nutrient supplementation up to a loading
rate of 0 .1625 lb VS/ft3 day at an efficiency of 4 .17 ft3 day/lb VS added,
sufficient enhancement of gas production and a more stable process could
be achieved under conditions of nutrient addition . MSW supplemented with
35 percent raw sludge at a loading rate of 0 .12 lb VS/ft3 day yielded 6 .10 ft3
methane day/lb VS added . Digestion of raw sludge, feedlot waste, and MSW in
the proportion of .14/ .6/ .70 respectively at an organic loading rate of
0 .23 lb VS/ft 3 day gave an optimal yield of 6 .42 ft3 methane/lb VS added.
Ghosh and Klass (1977), Diaz, et al . (1974,1977), Klein (1972), Pfeffer
and Liebman (1976) all investigated the digestion of MSW supplemented with
raw sewage sludge . Diaz and Trezek (1978) and Mah, et al . (1980) showed
that optimum gas production could be achieved with a mixture of 80 percent
refuse and 20 percent sludge .
ii) Organic Loading Rate and Hydraulic Retention Time
The rate at which organic matter is introduced into the digester
has a strong influence on the stability of the process . One main effect of
an increased feeding rate is the rapid increase in the population of the
acid-forming bacteria relative to the slower growing methanogenic bacteria .
If continued, overloading occurs, causing unstable conditions which may
eventually lead to process failure if not corrected in time . The organic
33

loading rate (OLR) and the hydraulic retention time (defined as the theoret-
ical time that a given input volume remains in the digester) are mutually
dependable variables . They are interrelated in that the OLR and the solid
feed concentration define the retention time for a given volume . Therefore,
for a given OLR, retention time can only be increased by decreasing the feed
solids concentration . At long retention times, the conversion of biodegrad-
ible organic solids will be essentially complete ; however, retention times
are usually shorter to affect the most cost efficient and economical design.
Typical OLRs and retention times for the design of sewage sludge digesters
are 0 .2 to 0 .4 lb VS/ft3 day and 10 to 15 days, respectively .
OLR and retention times reported in the various studies on MSW diges-
tion have ranged from 0 .07 to 0 .35 lb VS/ft3 day and from 10 to 30 days,
respectively . Most of these studies have included co-digestion with raw
sewage sludge . Ghosh and Klass (1977) reported OLRs of 0 .07 to 0 .14 lb VS/ft3
day with a retention time of 12 days . Diaz, et al . (1974,1977) reported using
OLRs from 0 .07 to 0 .4 lb/VS/ft3 at retention times of 15 and 30 days . Results
from Diaz, et al . (1977) indicated that at a 15-day retention time, loadings
higher than 0 .3 lb VS/ft3 day did not perform well . Mah, et al . (1980) re-
ported optimal digestion of Cal Recovery RFD supplemented with 15 percent raw
sludge and 15 percent feedlot wastes at an OLR of 0 .35 lb VS/ft 3 day and a
retention time of 10 days .
There is little doubt that optimal loading rates and retention time
for methanogenic digestion will depend upon the quality of the feedstock and
on the desired efficiency of the overall process . For the most cost effective
operations, it is important to operate at the highest loading rate possible
34

within the process constraints, in order to achieve the least investment
cost .
iii) MSW Feed Slurry Concentration
MSW feed slurry concentration is important in many respects for
the operational design and performance of anaerobic digesters . It determines
the handling and pumping properties of the influent feed and influences the
degree of mixing required for efficient operation . Little information
is available for determining the optimal MSW feed slurry concentration ;
therefore, it has been largely determined by the constraints of organic
loading rate, retention time and physical processing limitations . Accord-
ing to values reported in the literature, a reasonable upper limit of the
range of total solids content appears to be about 8 percent, based on
pumping and mixing limitations .
iv) Temperature
The rate of anaerobic digestion of organic waste is influenced by
temperature . Digester operations fall into two temperature ranges : mesophillic
and thermophillic . Thermophillic digesters are operated in the range of 100 •F
to 140•F with the optimum at about 130•F while mesophillic digestion occurs
between 80•F to 110•F with the optimum at approximately 95 •F . Although
thermophillic digestion usually results in higher gas yeilds and production
rates, it is rarely applied to the municipal sludge digestion facilities
primarily due to inexperience with the process and increased heating require-
ments .
35

In contrast to sewage sludge digestion, little information is
available for determining optimal temperatures for large scale MSW digestion .
Pfeffer (1974) conducted a series of laboratory digester experiments at
various retention times employing shredded MSW to study the effect of tempera-
ture on the rate of methane production . His results showed that the optimum
mesophillic temperature is 107 •F, while the optimum thermophillic temperature
is at least 140• F. He also observed that thermophillic digestion yielded
higher rates of gas production although increases between the two optimum
temperatures generally inhibited rather than enhanced gas production . Ghosh
et al . (1977) reported slightly different results using laboratory digesters
at a retention time of 12 days . Data from their runs show that the optimum
mesophillic digestion of refuse-sludge mixtures occur in the temperature
range of 95•F to 104•F when using a low loading rate (0 .07 lb VS/ft3 day) .
However, at a higher loading rate (0 .14 lb VS/ft3 day) the optimum mesophillic
temperature was 95• F . Optimum thermophillic temperature for the digestion of
MSW was observed to be 131 •F . Their study also indicated that, for a given
loading and detention time, a higher gas yield and a better effluent quality
are obtained from MSW digestion at the optimum mesophillic temperature, than
at the optimum thermophillic temperature . Both Pfeffer and Ghosh observed
that the carbon dioxide content increased with digester temperature .
v) Mixing
Adequate mixing of digester contents is essential in order to achieve
proper digestion performance . Experience with sewage sludge digesters in
optimization of digester rates and gas production has shown that high-volume
mixing is definitely beneficial in the overall digestion process (Torpey ; 1954 .
36

1955) . Most mixed digesters have the mixing energy provided by gas recircula-
tion . Other means available are mechanical mixing and liquid recirculation .
One major problem consistently reported in MSW digestion literature is
inadequate mixing, resulting in the formation of thick scum layers which re-
duce the efficiency of digester operation . McFarland (1972) and Diaz, et al .
(1978) reported mixing problems in their MSW pilot studies using the recircu-
lation mode of mixing . Jarvis, et al . (1978) encountered similar problems in
laboratory studies conducted at the Franklin, Ohio Environmental Complex .
Using hydropulped MSW as substrate in 55 gallon digesters, Jarvis observed
that the material accumulated as a fibrous mat on the uppermost part of the
reactor with cellulosic fibers tending to float on the surface of the liquid,
adhering to one another on contact during mixing, forming increasingly larger
mats of fibrous scum . Following these laboratory observation%Swartzbaugh,
et al . (1979) conducted a pilot study (100,000 gallons) to test and compare
two methods of mixing, a mechanical agitator mounted in the center of the
digester, and three gas mixing units located inside the digester in a equi-
lateral triangle at approximately half the radius of the vessel . The investi-
gators examined the effect of various feed ratios of MSW to sewage sludge,
organic loading rates and feed solid concentrations on the efficiency of diges-
ter performance as related to the two modes of mixing and the resulting solids
distribution in the digester . They concluded the folowing :
•
A 4 percent total solids slurry can be satisfactorily
digested on a short term basis .
•
Both the gas mixing system and the mechanical agitator
maintain fairly uniform solids distribution in the lower
and middle level of the vessel .
37
•
Both mixing systems tested allow the build-up of a 1- to 3-
foot fibrous scum layer of 20 to 25 percent total solids
within a month of operation .
•
Grit content in the feedstock must be minimized to avoid
using abrasion resistant slurry pumps .
•
The properties of MSW are sufficiently different from
sewage sludge that direct application of wastwater treat-
ment practice to the anaerobic digestion of MSW is not
feasible .
The results of the Franklin, Ohio facility and the preliminary
problems encountered at the ReCom facility in Pompano Beach, Florida
indicate that mixing of RDF slurries still remains a significant operational
problem in terms of matting on the surface and cellulosic stringers binding
mixing shafts and impellers . It appears that this is the major operational
difficulty that needs to be addressed prior to any further large-scale under-
takings in MSW digestion .
Factors influencing mixing such as the degree of feedstock preparation,
MSW size, impeller and reactor design, and shaft speed need to be examined
with respect to achieving acceptable mixing .
vi) Gas Quality and Quantity
Several important technical and economic considerations are related
to the gaseous end products of anaerobic digestion . These include gas quantity,
gas quality, gas processing and the potential market for gas utilization .
In general, the volume of gas produced in a digester will depend on the
feedstock characteristics and digester operational parameters . For mesophillic
domestic sewage sludge digesters, the gas produced should average between 16
38

and 18 cu ft/lb VS destroyed (about 10 cu .ft/lb VS added) . Gas yields for
MSW digestion are substantially less . Mah, et al . (1980) determined that
RDF from preprocessing systems at San Diego and Berkeley produced 3 .9 and
7 .2 cu/ ft/lb VS added respectively when digested without nutrient supple-
ments . These results confirm Pfeffer's earlier work (1974) in that MSW
sources and preprocessing schemes can account for large differences in gas
yields . Moreover, Pfeffer (1974), Brown et al . (1976), and Ghosh (1977)
demonstrated that MSW gas production rates are strongly influenced by
temperature, retention time and loading rate .
There is little doubt that the addition of nutrients in the form of
sewage sludge or animal wastes enhances the organic destruction and gas pro-
duction rates in MSW digestion . Diaz, Kurtz, Trezek (1974) ; Diaz, Trezek (1978) ;
and Mah (1980) reported gas yields using various ratios of highly processed
MSW and raw sludge . Their average results were about 7 .8, 9 .3, and 8.8 cu. ft/
lb VS added respectively . Differences in the reported values may be attribu-
ted to a number of variables including consistency of feedstock quality, MSW/
raw sludge ratio, retention time and organic loading rate . An upper limit of
gas production from MSW has not yet been determined, although Mah (1980) has
reported that an optimal yield of 10 .2 cu/ft/lb VS added (18 .5 cu . ft/lb VS
destroyed) can be achieved using a feedstock blend of 70 percent MSW, 15 percent
raw sludge, 15 percent feedlot waste at an organic loading rate of 0 .35 lb VS/
cu ft day and a 10-day retention time .
The gas produced by the anaerobic digestion process consists primarily
of methane and carbon dioxide with trace amounts of hydrogen sulfide and
nitrogen . Typical gas composition for domestic sewage sludge digesters range
from 60 to 70 percent methane and 30 to 35 percent carbon dioxide with a heat-
ing value of approximately 600 BTU/ft 3 (Metcalf & Eddy, 1979) . In contrast,
39
results from various studies indicate that gas composition from MSW diges-
tion typically range from 50 to 60 percent methane and 40 to 45 percent carbon
dioxide with a heating value of about 550 BTU/ft 3 .
Digester gas without scrubbing is wet and mildly corrosive with about
half the heating value of natural gas . Treatment of the product gas will
depend on its intended use . In wastewater treatment plants with proper
piping and storage facilities, treatment is minimal or unnecessary if the
gas is used as fuel for boiler and internal combusion engines . If the gas
is to be used as a natural gas substitute, it must be upgraded to a high-
BTU equivalent of pipeline quality by removing the carbon dioxide and
hydrogen sulfide . Particulates in the gas may be removed in large sedimenta-
tion traps while water can be removed with strategically placed traps along
the pipeline. A recent review of available gas purification systems (Ashare
et al . 1978) indicated that commercially available methods for treatment of
digester gas include physical absorption ; chemical absorption, adsorption,
and membrane separation processes . Large scale experience with MSW digester
gas treatment is limited at this time ; however, problems of applying current
gas purification processes to MSW product gas are not anticipated .
vii) Dewatering Characteristics and Residue Disposal
The dewatering characteristics of MSW digester effluent is a
critical consideration from the standpoint of the economics in the overall
MSW to methane process . As in the case of sewage sludge digester effluent,
the solid residue must be separated and dewatered to the maximum extent for
economical disposal . Low moisture content in the residue is desirable to
accomplish the following objectives :
40

•
Rendering the sludges odorless and less putrescible .
Reduction of fuel requirements if incineration is used
as a means of final disposal .
•
Reduction of hauling costs to landfills or drying fields .
•
Reduction of leachate production at the landfill site .
Various technologies and alternatives have emerged for the processing
of digester effluent and for the ultimate disposal of the material resulting
from processing . These are discussed in a comprehensive report prepared by
LA/OMA (1979) . For digested sewage sludges, available dewatering processes
include vacuum filtration, centrifugation, filter presses, horizontal belt
filtration, sand drying beds, and lagoons .
Pfeffer et al . (1974) has conducted extensive laboratory studies on the
dewatering characterisitcs of MSW digested sludge . He tested the applicability
of vacuum filtration and centrifugation as a means of dewatering and also ex-
amined the effects of recycling and chemical conditioning prior to the dewater-
ing step . Tests using Buckner funnels and filter test leaf technique demon-
strated that vacuum filtration digested MSW sludge (5 to 6 % TS) can result
in a 20 to 25 percent solid cake with a solids capture of 90 to 95 percent .
Cake solid could be increased to an excess of 30 percent with a solid capture
of 95 to 95 percent if chemical pretreatment is applied ; however, Pfeffer
noted that the cost of the polymer is not offset by the savings in the overall
processing costs . Recycling of filtrate to the process resulted in a build-
up of fine particles that eventually reduced the filter rate and solid cake
content . In centrifugation tests, cake solid concentrations varying between
27 and 40 percent and 4 solids capture of 61 to 88 percent was observed
41

depending largely on the type of centrifugation vessel used . Based on these
results, Pfeffer concluded that centrifugation is a lower total cost system
than vacuum filtration, provided the solids lost in the centrate are not
important and that incineration of the resulting cake solid is used . Pfeffer's
overall work supports the contention that existing technologies for dewater-
ing domestic sludges can be successfully applied to digested MSW sludge with-
out significant modifications . Brown and Caldwell (1978) have suggested the
use of filter presses to dewater high solids concentration MSW slurries having
sizable quantities of fine particles ; however, supporting experimental evi-
dence for their conclusion is not yet available .
The method used for the ultimate disposal of digested sludge after
treatment depends on site-specific economics and governmental regulations .
Common disposal methods include landfilling, incineration, pyrolysis, solar
drying fields, and sludge storage basins . Information relating the advan-
tages and disadvantages of various disposal methods to MSW sludges is lacking ;
however, it appears now that combustion methods with heat recovery will provide
more beneficial effects than landfilling, especially since acceptable land-
filling sites are becoming very scarce in major parts of the country (Brown
and Caldwell, 1978) .
viii) Reactor Desiqn
One major drawback of conventional digester design is the large volume
required. Several variations in digester design have been proposed with the
objective of reducing capital and operating costs through digester volume
reduction . The success of an innovative design could have a significant
impact on the economics of a MSW-to-methane process since it is estimated
that the digestion steps represent 28 percent of the process energy consump-
42

tion and 35 percent of the capital cost in the overall conversion process
(Kispert, et al ., 1974) .
Alternate design concepts have been reviewed and discussed in a report
by MITRE Corporation (1979) . They are summarized here in Table 9 .
There appear to be several concepts that may well be superior to the
conventional digester for the efficient production of methane gas . However,
the technology of these novel concepts are at a formative stage of develop-
ment and are unproved at the practical level . Detailed studies, including
economic analysis of these concepts should be made in order to incorporate
any of the advantages into what appears to be the "established," conventional
system.
IV . ECONOMIC STUDIES
A number of studies on the projected economics of specific MSW to
methane processes have been undertaken . Kispert, Sadek and Wise (1974)
developed a computer model with the objective of sizing the processing
equipment required for producing methane gas at the lowest cost based on
the 1000 ton/day Dynatech system shown in Figure 2 . The model provided
for the analysis of capital and operating costs, credits for handling MSW
(tipping fee) and sewage sludge, and penalties for the disposal of the
effluent . To account for uncertainties in the values used in their analyti-
cal description of the system, the investigators also conducted a sensitivity
study to evaluate the impact of technological advances or economical changes
on the process . Their results indicated that the process economics are most
sensitive to the digestible fraction of MSW and tipping fees . Other major
factors relating to the overall economics of the process included digester
43
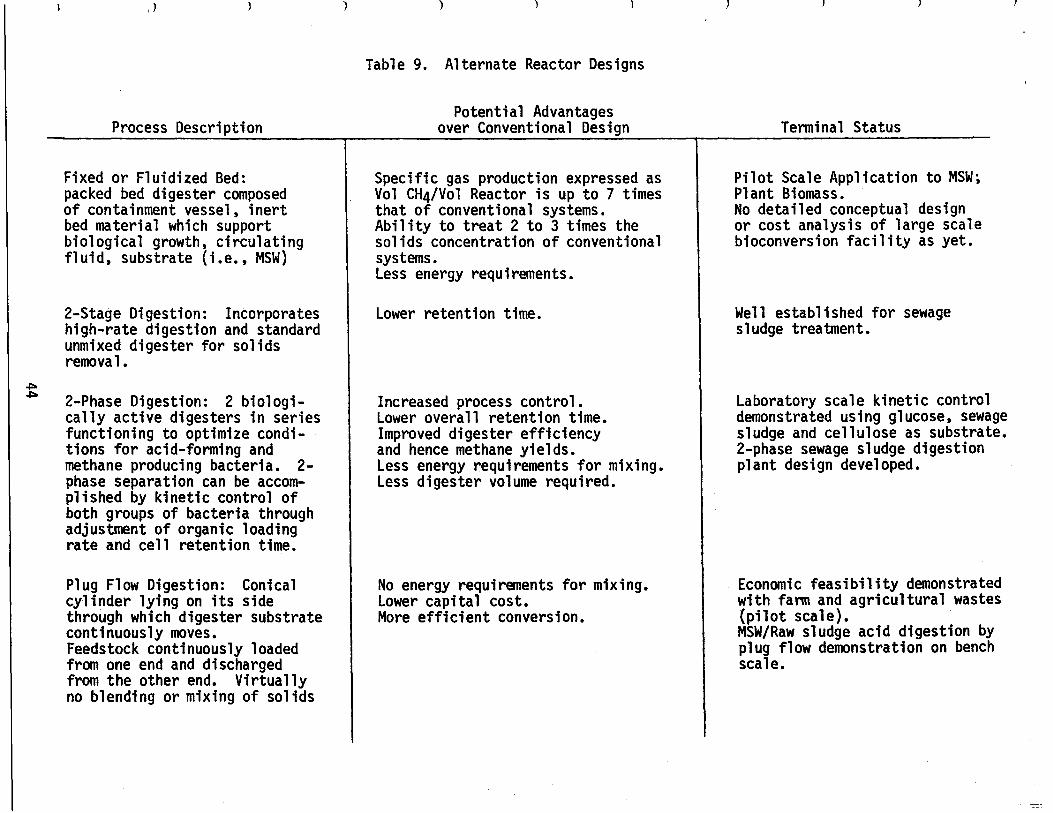
Process Description
Fixed or Fluidized Bed :packed bed digester composedof containment vessel, inertbed material which supportbiological growth, circulatingfluid, substrate (i .e ., MSW)
2-Stage Digestion : Incorporateshigh-rate digestion and standardunmixed digester for solidsremoval .
2-Phase Digestion : 2 biologi-cally active digesters in seriesfunctioning to optimize condi-tions for acid-forming andmethane producing bacteria . 2-phase separation can be accom-plished by kinetic control ofboth groups of bacteria throughadjustment of organic loadingrate and cell retention time .
Plug Flow Digestion : Conicalcylinder lying on its sidethrough which digester substratecontinuously moves .Feedstock continuously loadedfrom one end and dischargedfrom the other end. Virtuallyno blending or mixing of solids
Table 9 . Alternate Reactor Designs
Potential Advantagesover Conventional Design
Specific gas production expressed asVol CH4/Vol Reactor is up to 7 timesthat of conventional systems .Ability to treat 2 to 3 times thesolids concentration of conventionalsystems .Less energy requirements .
Lower retention time .
Increased process control .Lower overall retention time .Improved digester efficiencyand hence methane yields .Less energy requirements for mixing .Less digester volume required .
No energy requirements for mixing .Lower capital cost .More efficient conversion .
Terminal Status
Pilot Scale Application to MSW ;Plant Biomass .No detailed conceptual designor cost analysis of large scalebioconversion facility as yet .
Well established for sewagesludge treatment .
Laboratory scale kinetic controldemonstrated using glucose, sewagesludge and cellulose as substrate .2-phase sewage sludge digestionplant design developed .
Economic feasibility demonstratedwith farm and agricultural wastes(pilot scale) .MSW/Raw sludge acid digestion byplug flow demonstration on benchscale .

1
)
)
)
)
)
)
)
)
)
DYNATECH'S HYPOTHETICAL SYSTEM
CH4 f-- GASCO2 I---SCRUBBER
RECEIVING '-PSHREDDER -. MAGNETIC -+ TRaMMEL -.AIR CLASSIFIER -+ SHREDDER--4 MIXING -+DIGESTER -.DEWATERINGAREA
SEPARATOR . SCREEN
TANK
MATERIAL RECOVERY
MODULES WATERTO RECYCLE
TO TREATMENTPLANT
SEWAGESLUDGE
Figure 2 . Flow Process Diagram of Anaerobic DigestionUsed for Dynatech Economic Analysis
CAKE TODISPOSAL

operating conditions, dewatering costs and financing options (i .e ., public
vs . private) . The authors concluded that the cost of methane production is
economically acceptable when compared with projected costs of natural or
synthetic gas . The MITRE Corporation (1979) reviewed and updated Kispert's
original report incorporating additional considerations such as the cost of
disposal facilities for trammel screen unders, air calssification of heavies,
dewatered cake, increased electric power requirements,,and .operating personnel .
Their analysis indicated that the economic feasibility of the process was not
encouraging and that a tipping fee of $15 .60/ton (without incinceration) to
$19 to $22/ton (with incineration) would be required as the major source of
revenue to offset costs .
Brown and Caldwell (1978) examined the technical and ecomomic feasibility
for various MSW to methane processes based on four major process steps :
feedstock preparation ; feedstock pretreatment ; digestion and gas production ;
and residue disposal . After detailed screening of candidate processes, four
alternatives were identified and cost estimates were prepared
for production plants with the capacity to use 1000, 2000, and 3000 tons per
day of MSW . Their analysis demonstrated that a number of process variables
affect the cost of gas production for the four alternative processes . Among
the more influential variables are the manner of financing, feedstock prepra-
tion costs and tipping fees . The following conclusions were reached in the
analysis :
•
Minimum cost gas would be produced from .MSW which has undergone
only shredding with ferrous metals removed prior to digestion
at maximum possible loading rates .
•
Feed concentration should be as high as possible, consistent with
mixing availability.
46

• The residue, after dewatering, should be thermally processed,
and the recovered heat used to operate the plant ; excess
steam should be sold .
•
The Cal Recovery process appears to be the most cost-effective
above 1000 tons/day if all excess steam can be sold and if
organic loading rates are restricted to the lower range .
•
The economics of fuel gas production are less affected by process
variation than by external factors such as tipping fees, sewage
sludge disposal credits and the method and cost of digested
residue disposal .
Brown and Caldwell (1979) later conducted site-specific economic studies on
the digestion of MSW with thermal processing of the residue . They identified
five general factors that are important in establishing the economic feasibil-
ity of any energy from a refuse project :
•
Facility s capital cost,
•
Facility's operation and maintenance cost,
Market for steam from thermal processing of non-digestible
fraction or demonstration of feasible pyrolytic thermal
processing unt for non-digestible fraction,
•
Land acquisition and development cost,
•
Tipping fee revenue expected .
The first three factors are a function of process selection and facility
design, while the remaining two are site specific . Among the major conclus-
ions reached in the study are :
•
A facility designed for anaerobic digestion and thermal processing
of MSW in Southern California can produce a medium Btu and/or steam
47

steam product at a cost as low as $6 .00/106 BTU .
•
The apparent most cost-effective option involves mesophillic
digestion of the non-cellulose organic fraction, with thermal
processing of the non-digestible fraction .
•
Energy recovery from the thermal processing step is necessary
for the economic feasibility of the process .
Wastee and Water International (1981), under contract by the EPA
recently completed a general cost evaluation of the co-digestion of MSW
and sewage sludge based on certain assumptions . Their major assumptions
included a resource recovery plant sized at 2500 metric tons MSW/day ; use of
Cal Recovery feedstock ; digester operating conditions as specified by Pfeffer
and Liebmann (1976) ; vacuum filtration for dewatering ; and landfilling for
the residue disposal . According to their analysis, the largest expense will
be incurred by the vacuum filter dewatering equipment . They calculated that
the difference in costs between the system with and without dewatering is
$25 .7 million per year not taking the tipping fee into account . The authors
concluded that although lower disposal fees are expected for dewatered solids,
the savings are not substantial enough to augment the capital and operating
costs of the filtering equipment .
V . SUMMARY
Technology for MSW digestion is at a formative stage of development .
The technical and economic feasibility of the overall process is dependent
on a number of factors that are external to and within the process itself.
The most important of these factors includes the site-specific sources and
48

characteristics of MSW ; land availability ; local economics and potential
market for recovered material ; and development of "optimal" preprocessing
configuration and methods of pretreatment for increased feedstock digesti-
bility .
Evaluation of work related to MSW digestion performance parameters
has revealed that much research remains undone, especially in the areas of
optimum particle sizes, feed slurry concentration and acceptable mixing .
Anaerobic digestion of MSW has been demonstrated to be a viable alternative
for the volume reduction of solid waste and for energy recovery from other-
wise useless material . However, continued research is required to "optimize"
such a process into an economically attractive one .
In general, the best economical process-design criteria for MSW diges-
tion can be established from existing knowledge and experience .
shown in Table 10.
49
This is
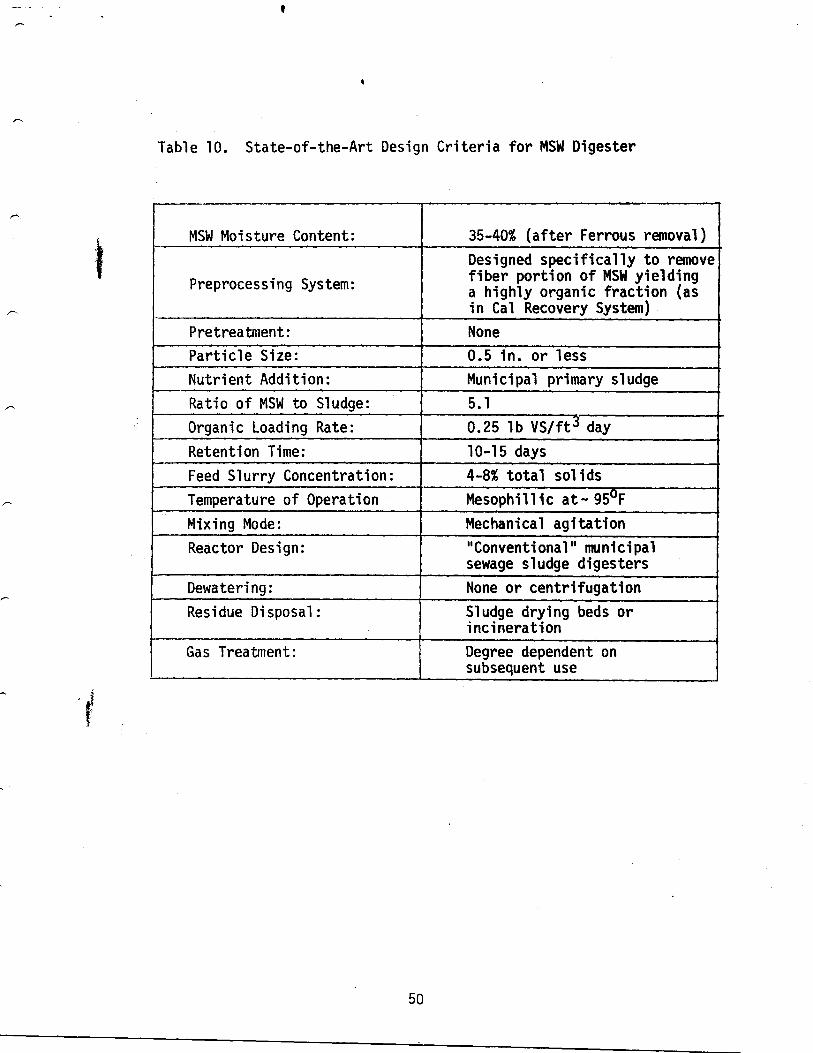
f
Table 10 . State-of-the-Art Design Criteria for MSW Digester
50
MSW Moisture Content : 35-40% (after Ferrous removal)
Preprocessing System :
Designed specifically to removefiber portion of MSW yieldinga highly organic fraction (asin Cal Recovery System)
Pretreatment : None
Particle Size : 0 .5 in . or less
Nutrient Addition : Municipal primary sludge
Ratio of MSW to Sludge : 5 .1
Organic Loading Rate : 0 .25 lb VS/ft 3 day
Retention Time : 10-15 days
L
Feed Slurry Concentration : 4-8% total solids
Temperature of Operation Mesophillic at- 950F
Mixing Mode : Mechanical agitation
Reactor Design : "Conventional" municipalsewage sludge digesters
Dewatering : None or centrifugation
Residue Disposal : Sludge drying beds orincineration
Gas Treatment : Degree dependent onsubsequent use

I .
FEEDSTOCK
The feedstock used in this study was selected to simulate municipal
waste from Santa Monica, California . A survey was made of the Santa
Monica waste on three separate occasions, in order to determine the
seasonal variability. The survey procedure was supplied by Cal Recovery
Systems .
Each survey was conducted over a one-week period with two truck
samplings per day. Trucks were selected from specific routes in the
city in order to quantify the waste from the specific areas in the city .
Each truck to be sampled was routed to an isolated point at the Santa
Monica transfer station and the contents were dumped onto the concrete
transfer station's foundation . The truck was dumped while jogging in for-
ward in order to distribute the waste over a 25-foot section . Next, a
10-foot by 25-foot sheet of plastic was spread next to the column of waste .
A garden rake was used to transfer between 250 and 300 pounds to the sheet .
Waste was raked from the pile to the sheet along the entire length of the
pile . An effort was made to rake a representative sample from the pile .
Finally, the sample was hand sorted into the categories shown in Table 11
and weighed . Weight percentages were then calculated .
Cal Recovery Systems used the survey information to select areas
adjacent to U .C . Berkeley Richmond Field Station similar in composition
to the Santa Monica Waste . Cal Recovery Systems shipped the waste to UCLA
in 40 to 70 lb cardboard drums . The waste was refrigerated at 4•C until used
EXPERIMENTAL PROCEDURES
51

P
Table 11 . Survey Categories for Santa MonicaMunicipal Solid Waste
52
Mixed Paper
Newsprint
Corrugated
Plastic
Yard Waste
Food Waste
Other Combustibles
Ferrous Metals
Aluminum
Other Non-Combustibles
Glass
Miscellaneous

I
II .
EXPERIMENTAL APPARATUS
Experiments were carried out with four 50-gallon cylindrical stain-
less steel digesters (alloy 304), each with a working volume of approxi-
mately 45 gallons . The details of the digester design and external
apparatus are shown in Figure 3 . Briefly, each digester was construc-
ted with a sloping bottom and a 2-inch exit port for sludge withdrawal .
The top plate of the digesters had entry ports and fittings for the gas
outlet, pH sensor ; float level ; thermometer ; RDF temperature sensor and
feeding . Mixing was accomplished by a top mounted 1/4 hp Bodine motor
with a 2-impeller vertical shaft extending approximately 5/6 the distance
to the bottom of the digester . The digester temperature was controlled
at 37•C by an automatic temperature sensor having externally wrapped
heating tapes and fiberglass insulation . Gas measurements were taken by
bubbling the product gas into a 2 percent solution of sulfuric acid in a
closed flask connected to a Precision Wet Test Meter. -PH control, which
was occasionally necessary in the start-up stage of the experiments , was
accomplished by the manual addition of a solution of sodium carbonate .
III .
DIGESTER START-UP PROCEDURE
Seeding was accomplished by filling each digester with mesophillic
digested sewage sludge from the Los Angeles Hyperion Treatment Plant to
full working volume . Initially, raw sewage sludge was fed at an organic
loading rate of .04 lb VS/ft3 day ( .. 1 gal . raw sludge/day) until the gas
production rate and volatile fatty acid concentration in each digester
stabilized (approximately 2 weeks) . The feedrate was increased to
0 .1 lb VS/ft3 day (- 2 gal . raw sludge/day) until a new level of stable
53

f
i
IIi
IIII
11
PLAN
ELEVATION
24"
INVERTED PLAN
Figure 3 . Pilot Scale Digester
54
t
II
KEY :1 . FLOAT LEVEL2. SPARE3. FEEDING PORT4. THERMOMETER5. pH SENSOR6. RTD TEMPERATURE SENSOR7. SPARE8. GAS OUTLET9. MOTOR MOUNT
10. MOTOR11 . DRAIN

gas production and acids concentration was obtained . Following this
initial period of acclimination, experiments with MSW began in three of
the digesters, with the fourth digester retained as a control (fed with
raw sludge only) .
IV . FEEDING PROCEDURE
The following procedure was developed to load the digester :
•
Based on the organic loading rate (OLR) the amount of refrig-
erated MSW for each digester was weighed on a Mettler Gray
balance and placed into wide mouth 1 gallon jars (-300 gins/jar) .
•
Based on hydraulic retention time, the appropriate volume of
sludge was withdrawn and wasted . An excess volume of approxi-
mately 1 gallon of digested sludge per 0 .25 Kilogram of MSW
to be fed was then withdrawn for loading purposes .
•
Tap water was added to the dry MSW to bring the total weight
of MSW plus tap water to equal the weight of the feed volume,
assuming specific gravity of 1 .0 . Excess withdrawn digested
sludge was added to top off the jars and then the resulting
mixture of MSW, tap water and digested sludge was vigorously
shaken into a slurry that could be poured easily into the
feeding port of the digester .
•
Supplemental raw sludge (20 percent of OLR) was measured in
premarked gallon containers and fed accordingly .
V .
ANALYTIC METHODS
Alkalinity, Ammonia, pH : Alkalinity and ammonia determinations were
made at least once a week. Ammonia was measured by an Orion Research 407A
55
I 4
meter with a specific ion electrode . The meter was calibrated by standard
solutions prepared in the laboratory . Alkalinity determinations were made
in accordance to the procedure (sec . 405) described in Standard Methods (1) .
PH data was collected daily using a Corning Model 12 meter .
Analysis of Organic Acids : Samples to be analyzed for volatile fatty
acids were acified to pH 3 with concentrated ortho-phosphoric acid and centri-
fuged . A Hamilton 7105 syringe was used to inject 2-ul supernatant samples
into a Varian (Series 1400) gas chromatograph equipped with a flame ioniza-
tion detector and a 1-mV Varian recorder . A 6-foot glass column (OD, 1/4",
ID, 2 mm) was packed with 15 percent SP-1220 chromosorb AW with 1 percent
phosphoric acid and mesh size 100/120 + conditioned overnight at 160 •C .
Operating conditions were : Column temperature, 130•C ; Injector temperature,
160•C ; Carrier gas ; Helium at a flow rate of 30 ml/min ., H2 at 30 ml/min .,
and Oxygen at 300 ml/min . Analysis for volatile fatty acids (VFAS),including
acetic, propionic, butyric, iso-butyric, valeric and iso-valeric acids, were
made at least once a week .
Analysis of Gases : CH4 and C02 were analyzed at least once a week by
gas chromotography using a Varian Aerograph 920 gas chromatograph equipped
with thermal conductivity detector . Gas samples were collected in a
vacuumed bottle and injected (5 ml sample) into the Varian gas chromato-
graph with a hypodermic needle . Separation of constituent gases was
achieved by using a 12-foot stainless steel column of 1/4" OD packed with
activated charcoal . The injector, detector, column temperatures were
operated at 60•C, 60•C, and 180•C respectively . The filament current was
set at 190 mA .
Helium was used as the carrier gas at a flow rate of of
60 ml/min .
56

SolidsAnalysis
Digester effluent total and volatile solids were analyzed accord-
ing to the procedures described in Sections 208A and 208E of Standard
Methods (1975) ; however, determinations of percent total solids and
percent volatile solids were based on a gram/gram sample rather than
on a volumetric basis (as precribed by Standard Methods) . This was
done because an accurate volumetric measure was sometimes not possible
due to the digester effluent bulky characteristics .
Digester influent total and volatile solids were calculated based
on the following formula :
Volume Fed xgm
Total Solidsx % Volatility = % VSday
Volume Fed
Calculations were based on the assumption of 5 .5 % total solids for raw
sludge . Percent volatility of raw sludge and the MSW were experimentally
determined according to Standard Methods (1975) . Volume fed/day and total
solids/volume fed was predetermined by organic loading rate and hydraulic
retention time .
Percent volatile solids destruction was calculated by the following
formula :
% VS Influent-% VS Effluent X 100 = % VS Destroyed% VS Influent
57

RESULTS AND DISCUSSION
I . Santa Monica Survey
Municipal solid waste was surveyed three times at the Santa Monica
transfer station during the periods of August 11, 1980 to August 15, 1980,
December 16, 1980 to December 22, 1980 and February 17, 1981 to February
23, 1981 . The survey results are shown in Table 12 . The results for the
various categories are remarkably consistent for the three sampling periods .
The greatest variability is for the yard waste category which shows an
increase of almost four percentage points between the August and December
surveys . One would expect a large variability in yard waste, since the
season was changing between surveys ; however, one normally expects to find
the greatest yard waste in the summer, during the growing season . The
opposite trend was observed here, but this might be explained by the rain-
fall pattern in Southern California, where August is the driest month .
The news print category shows a large increase through survey, but there
is no explanation for this at present .
Cal Recovery Systems selected an MSW similar to the Santa Monica
Waste for digester feed preparation . The Cal Recovery feed material
average 80% solids (20% moisture) and the dry solids averaged 60% volatile
matter, by weight .
II . Digestion Results
Figures 4', 5, 6 and 7 show daily gas production for the stable periods
of operation . The horizontal axis shows the day of the year . The day
begins at 270, which corresponds to September 26, 1980 . Days numbered
greater than 365 correspond to days in 1981, and continues to the end of
the project . The straight lines between groups of data points correspond

SurveyCategory 8/11/80-8/15/80
Table 12 . Results of the Santa Monica MunicipalSolid Waste Survey
Numbers denote weight percents
Survey12/16/80-12/22/80
59
Survey
3 Period2/17/81-2/23/81
Average
AverageStandard
Deviation AverageStandard
DeviationStandard
Average Deviation
Mixed Paper 10 .40 5 .38 9 .94 4 .8 10 .6 5 .81 10 .31
News Print 12 .10 4 .01 13 .76 4 .7 15 .3 4 .98 13 .72
CorrugatedPaper . 19.30 5 .28 19 .49 6 .6 18.6 7 .41 19 .13
Plastics 7 .94 2 .26 6 .15 2 .06 6 .19 2 .20 6 .96
Yard Waste 16 .2 12 .0 20 .03 17 .9 17 .77 15 .58 18 .0
Food Waste 7 .07 2 .73 1 .46 2 .37 9 .88 3 .88 8 .14
OtherCombustibles 5 .88 5 .30 5 .65 7 .12 4 .95 3 .44 5 .49
FerrousMetals 5 .12 2 .61 3 .62 1 .50 4 .44 3 .51 4 .39
Aluminum 0 .961 0.25 1 .22 2 .43 0 .751 0 .45 0 .978
Other Non-Combustibles 0 .709 1 .09 1 .43 2 .62 0 .28 0 .72 0.806
Glass 11 .96 4 .2 10 .63 4 .86 9.29 4 .86 10 .62
Miscellaneous 1 .16 0 .65 0 .85 0.24 1 .84 2 .18 1 .28
TOTAL 98 .8 99 .96 99.95 99 .57

OU,
0.065--#* 0 .10 --*s.---
G ;G I
•270.00
292 .00
314.00
336.00
358.00
330.00
402.00
424.00
446.00T I ME (DRY 51
0.16
4 4--0.2021
Figure 4 . Gas Production for Digester Number 1
0.23
4b8 .00
490.00
512.00
534.00
556.00
576.00
600.00

0-0
F-u..
0N
I1+-- 0.065 40.10* 0.154+
0.21
00
•270 .00
292 .00
3'14 .00
u
336 .00 358.00 380 .00
0.25
402 .00
424.00
446.00T I ME (DRY S)
468 .00 490 .00
512.00
Figure 5 . Gas Production for Digester Number 2
0.16
534 .00 556 .00 578 .00 600 .00

^ C)m .O* C3-
LL-H
MOED n
F r -L)
DC)0cc,d, .N
OO
f----0.10 - 0 .16
x270.00
292 .00
314.00
336.00
358.00
380.00
402.00
424 .00
4116 .00TIME (DRYS)
Figure 6 . Gas Production for Digester Number 3
468 .00
490.00
512.00
534.00
556.00
578.00 600 .00

0Ln
O03270 .00
292.00
314.00
336.00
358.00
380.00
402.00
424.00
446.00T I ME (DAYS)
Figure 7 . Gas Production for Digester Number 4
468 .00
490.00
512.00
534.00
556.00
578.00 600 .00

to periods when operational problems existed . The primary operational
problems were gas leaks o faults in the metering system, lack of municipal
solid waste for feed, and upsets due to scum blanket accumulations .
Figure 7 shows the control digester (Number 4) which was operating entirely
on raw primary sludge obtained from the Hyperion treatment plant . Figures
4, 5, 6 correspond to digesters one, two and three, respectively which were
operated on MSW and raw sludge . Gas composition for the MSW digesters
ranged between 55% and 60% methane during stable operation .
Table 13 show the gas production rates per unit mass of volatile
solids applied . The table is arranged to show the effect of organic load-
ing rate and hydraulic retention time . Table 14 shows the remaining para-
meters for the stable periods of operation . The number shown in Tables 13
and 14 represent the mean parameter values for the stable periods shown
in Figures 4 through 7 .
The variability of the measured operating parameters is shown in
Figures 8 through 13 . The pH of all digesters is shown in Figure 8 . The
control digester, treating raw primary sludge, consistently had the
highest pH, ranging in the 7 .4 to 7 .8 region . The high pH is partially
attributed to the high ammonia concentration of the raw sludge . The pH
of the urban solid waste digesters fluctuated more widely than the control
digester. At one point during the study the pH dropped to below 6 .8,
near day 300 . This drop was caused by increasing the organic loading
rate too quickly . During this particular upset, sodium carbonate was
added to increase alkalinity and pH which accounts for the rapid return
of digesters to neutral pH . After the digesters were acclimated to the
feed distribution and loading rate, no base additions were required. A
similar drop in pH occured around day 450 and this pH drop was controlled
64
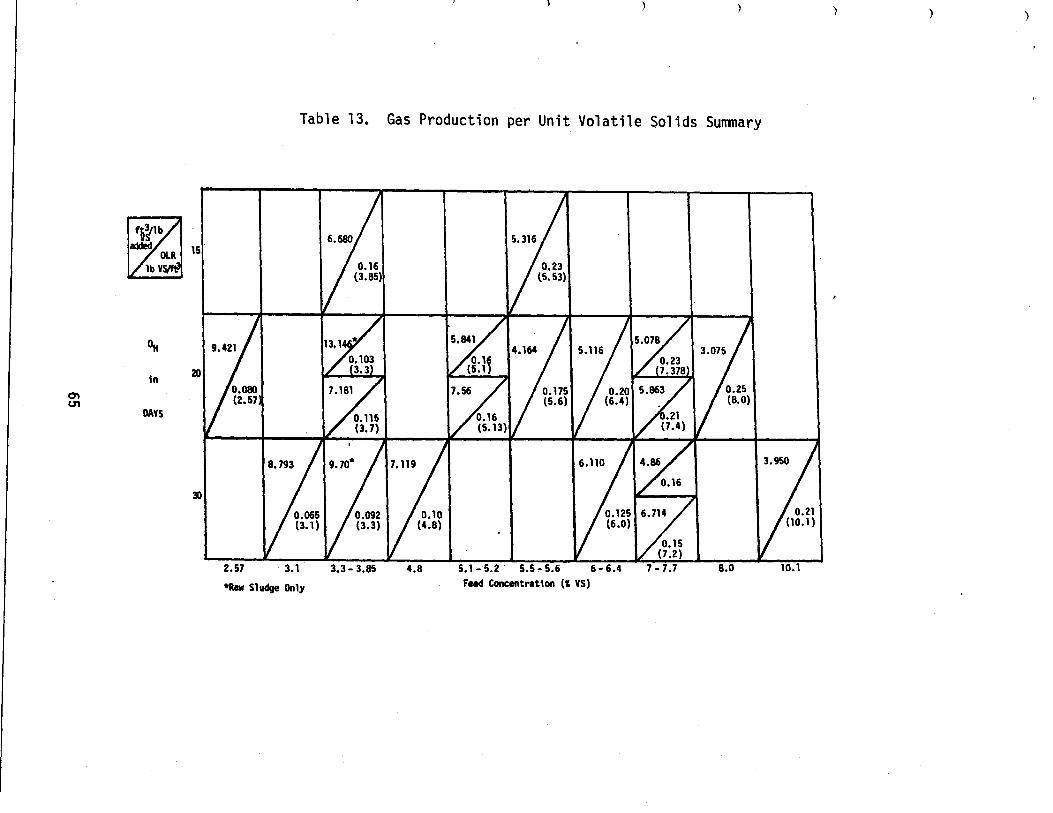
OH
in
DAYS
15
20
3D
2 .57
3.1
*Raw Sludge Only
3.3-3.86 4 .8
Table 13 . Gas Production per Unit Volatile Solids Summary
5.1-5.2
5.5-5.6
6-6.4Feed Concentration (% VS)
7-7.7 8.0 10 .1
6.680
0.16(3 .85)
5.316
0,23(5 .53)
5 .0783 .075
0.103 0.233 .3 7.378
0 .175 0.20 0.25(2 .57 (5 .6) (6 .4) (8 .0)
0.115 0.16 .21(3 .7) (5.13) (7.4)
9.70* 6 .110 3.950
0.065 0.092 0.10 0 .125 0.21(3 .1) (3 .3) (4 .8) (6 .0) (10 .1)
0.15(7 .2)
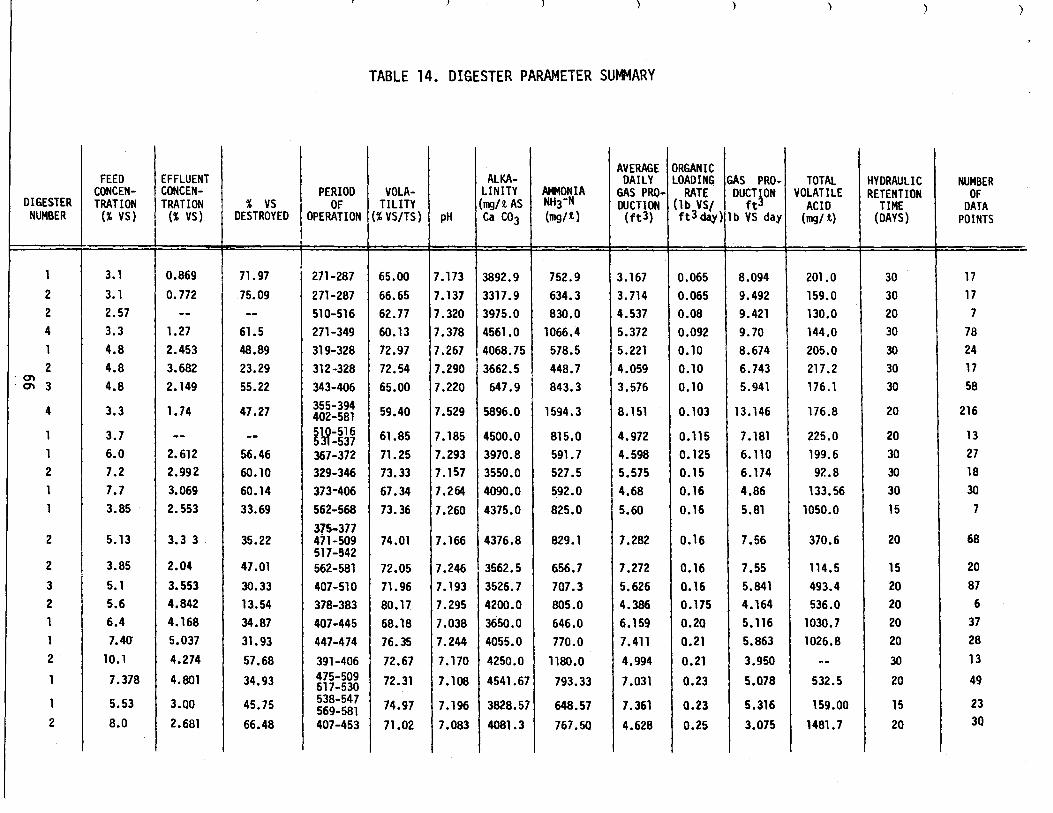
TABLE 14 . DIGESTER PARAMETER SUMMARY
DIGESTERNUMBER
FEEDCONCEN-TRATION(% VS)
EFFLUENTCONCEN-TRATION(% VS) .
% VSDESTROYED
PERIODOF
OPERATION
VOLA-TILITY
(% VS/TS) pH
ALKA-LINITY(mg/t ASCa C03
AMMONIANH3 -N(mg/t)
AVERAGEDAILY
GAS PRO-DUCTION(ft3)
ORGANICLOADING
RATE(lb VS/ft3 day)
GAS PRO •DUCTION
ftlb VS day
TOTALVOLATILE
ACID(mg/ t)
HYDRAULICRETENTION
TIME(DAYS)
NUMBEROFDATA
POINTS
1 3.1 0.869 71 .97 271-287 65 .00 7.173 3892 .9 752 .9 3.167 0 .065 8 .094 201 .0 30 17
2 3.1 0.772 75.09 271-287 66.65 7.137 3317 .9 634.3 3.714 0.065 9 .492 159 .0 30 17
2 2.57 -- -- 510-516 62 .77 7.320 3975 .0 830 .0 4.537 0.08 9 .421 130 .0 20 7
4 3.3 1 .27 61 .5 271-349 60.13 7.378 4561 .0 1066 .4 5.372 0 .092 9.70 144 .0 30 78
1 4.8 2.453 48 .89 319-328 72 .97 7 .267 4068.75 578.5 5.221 0.10 8.674 205.0 30 24
2 4.8 3 .682 23.29 312-328 72.54 7 .290 3662.5 448.7 4 .059 0 .10 6 .743 217.2 30 17
rn 3 4.8 2.149 55.22 343-406 65.00 7 .220 647 .9 843.3 3 .576 0 .10 5 .941 176 .1 30 58
4 3.3 1 .74 47.27355-394
59.40 7 .529 5896 .0 1594 .3 8 .151 0 .103 13 .146 176 .8 20 216402-581
1 3 .7 -- -- J117 :536 61 .85 7 .185 4500 .0 815 .0 4 .972 0.115 7 .181 225 .0 20 13
1 6.0 2.612 56.46 367-372 71 .25 7.293 3970.8 591 .7 4.598 0.125 6.110 199.6 30 27
2 7 .2 2.992 60 .10 329-346 73 .33 7.157 3550.0 527 .5 5.575 0.15 6 .174 92 .8 30 18
1 7.7 3.069 60 .14 373-406 67 .34 7.264 4090.0 592 .0 4 .68 0.16 4 .86 133.56 30 30
1 3.85 2.553 33.69 562-568 73 .36 7.260 4375 .0 825 .0 5.60 0 .16 5 .81 1050.0 15 7
375-3772 5.13 3.3 3 35 .22 471-509 74 .01 7 .166 4376 .8 829.1 7 .282 0 .16 7 .56 370 .6 20 68
517-9422 3.85 2.04 47.01 562-581 72.05 7 .246 3562.5 656 .7 7 .272 0.16 7 .55 114 .5 15 20
3 5.1 3.553 30.33 407-510 71 .96 7 .193 3526 .7 707 .3 5.626 0.16 5.841 493.4 20 87
2 5.6 4 .842 13.54 378-383 80 .17 7 .295 4200 .0 805 .0 4.386 0.175 4.164 536 .0 20 6
1 6 .4 4 .168 34.87 407-445 68 .18 7 .038 3650 .0 646 .0 6.159 0.20 5.116 1030.7 20 37
1 7.40' 5.037 31 .93 447-474 76 .35 7.244 4055.0 770 .0 7.411 0 .21 5 .863 1026 .8 20 28
2 10.1 4.274 57 .68 391-406 72.67 7 .170 4250.0 1180 .0 4.994 0.21 3.950 -- 30 13
1 7.378 4.801 34.93 475-509 72.31 7 .108 4541 .67 793 .33 7 .031 0.23 5.078 532 .5 20 49517-530
1 5.53 3.00 45.75 538-547 74.97 7 .196 3828 .57 648 .57 7.361 0.23 5.316 159.00 15 23569-581
2 8 .0 2.681 66.48 407-453 71 .02 7 .083 4081 .3 767 .50 4.628 0.25 3.075 1481 .7 20 30
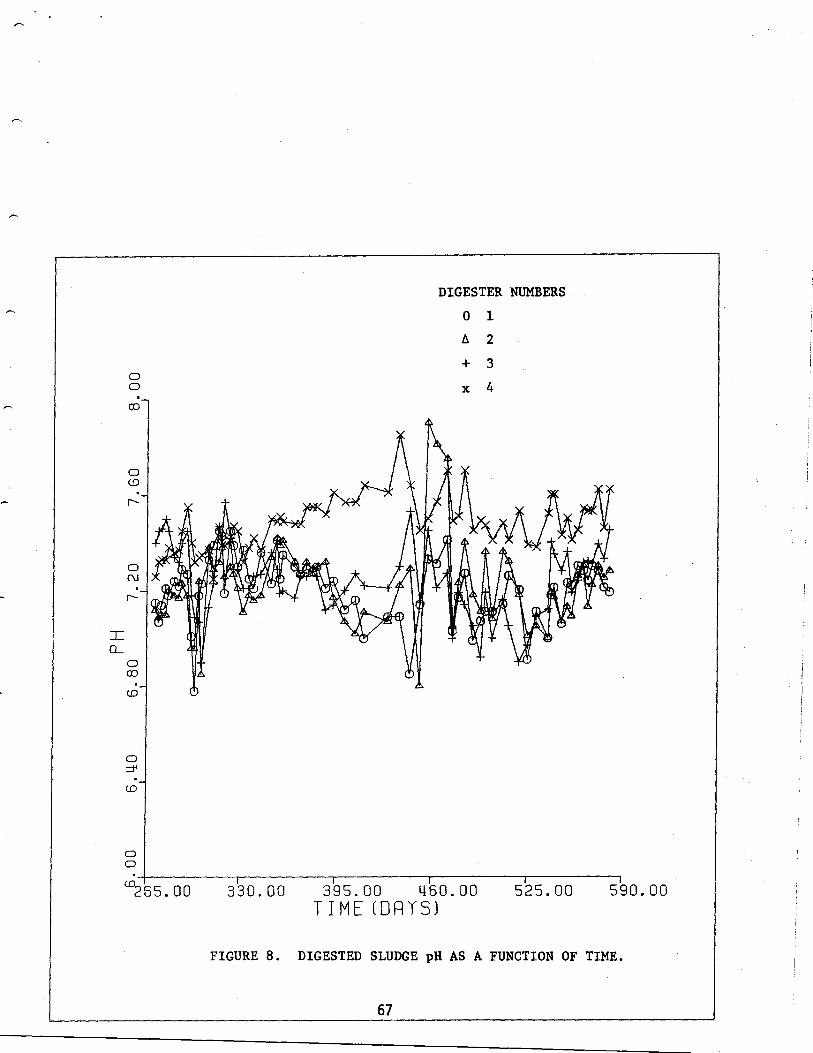
t
i
I
I
330 .00
395.00
460.00
525.00
590.00T I ME (DAYS)
FIGURE 8 . DIGESTED SLUDGE pH AS A FUNCTION OF TIME .
67
x

DIGESTER NUMBER
JQ0O
•265 .00
330 .00
395.00
460.00
525.00
590.00T I ME (DAYS)
FIGURE 9 . DIGESTED SLUDGE ALKALINITY .
68

CD0
000-m
CD
"'265 .00
330.00
395.00
460 .00
525 .00
590.00T I ME (DAYS)
FIGURE 10 . DIGESTED SLUDGE AMMONIA CONCENTRATION .
69

DIGESTER NUMBER
I
330 .00
395.00
460.00
525.00
590.00T I ME (DAYS)
FIGURE 11 . DIGESTED SLUDGE TOTAL VOLATILEACIDS CONCENTRATION .
70

(n cu
~ OJ0in
0NO
J coCE o~ o -H-
DIGESTER NUMBER
0 1
A 2
+ 3
X 4
Raw Sludge
I
i
I330 .00
395.00
460 .00
525 .00
590 .00T I ME (DRYS)
FIGURE 12 . DIGESTED SLUDGE TOTAL SOLIDS CONCENTRATION .
71

MEAN VOLATILE SOLIDS (G/G) VS . TIME (DAYS)
4
Raw Sludge
330 .00
395.00'
460 .00
525.00
590 .00TIME (DAYS)
FIGURE 13 . DIGESTED SLUDGE VOLATILESOLIDS CONCENTRATION.
72
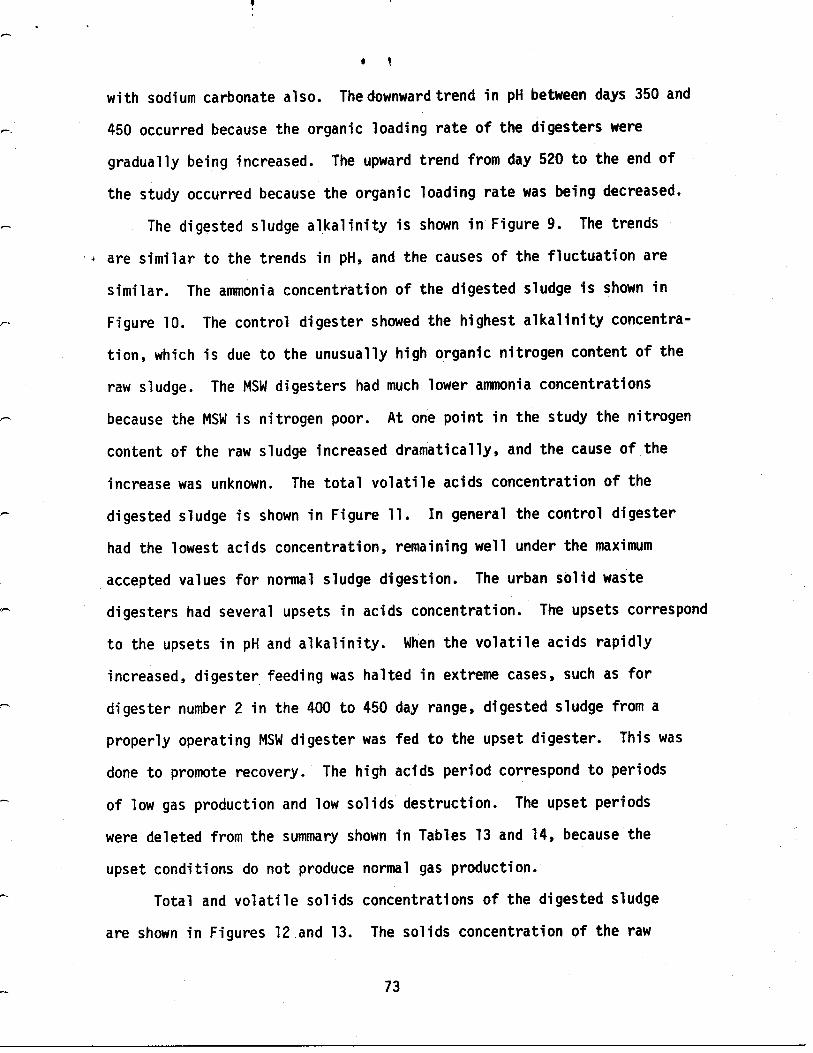
I
r
with sodium carbonate also . The downward trend in pH between days 350 and
450 occurred because the organic loading rate of the digesters were
gradually being increased . The upward trend from day 520 to the end of
the study occurred because the organic loading rate was being decreased .
The digested sludge alkalinity is shown in Figure 9 . The trends
are similar to the trends in pH, and the causes of the fluctuation are
similar . The ammonia concentration of the digested sludge Is shown in
Figure 10 . The control digester showed the highest alkalinity concentra-
tion, which is due to the unusually high organic nitrogen content of the
raw sludge . The MSW digesters had much lower ammonia concentrations
because the MSW is nitrogen poor . At one point in the study the nitrogen
content of the raw sludge increased dramatically, and the cause of the
increase was unknown . The total volatile acids concentration of the
digested sludge is shown in Figure 11 . In general the control digester
had the lowest acids concentration, remaining well under the maximum
accepted values for normal sludge digestion . The urban solid waste
digesters had several upsets in acids concentration . The upsets correspond
to the upsets in pH and alkalinity . When the volatile acids rapidly
increased, digester feeding was halted in extreme cases, such as for
digester number 2 in the 400 to 450 day range, digested sludge from a
properly operating MSW digester was fed to the upset digester . This was
done to promote recovery . The high acids period correspond to periods
of low gas production and low solids destruction . The upset periods
were deleted from the summary shown in Tables 13 and 14, because the
upset conditions do not produce normal gas production .
Total and volatile solids concentrations of the digested sludge
are shown in Figures 12 . and 13 . The solids concentration of the raw
73

sludge fluctuated widely, and this was due largely to the operation of the
Hyperion treatment plant. On several occasions raw sludge collection was
suspended due to the low solids concentration . A second source of vari-
ability is the analytical procedure . It is extremely difficult to obtain
representative samples of raw sludge . The scale of this operation also
makes it difficult to obtain representative samples . At small, bench-top
scale, it is possible to use inexpensive blending equipment to thoroughly
mix the entire gravity of raw sludge to be fed to the digester, which
makes sample collection much simpler . At very large scale and full scale
operation, the volume of raw sludge to be fed to the digester is large
enough to require sophisticated mixing and feeding equipment . At medium
scale the volume of feed material is too large to use standard laboratory
equipment, but too small to justify the expense of sophisticated, full
scale equipment .
The mixture of urban solid waste and raw sludge was analyzed at the
beginning of the sludge . It was impossible to obtain representative
samples . The use of a blender to produce representative samples was
precluded because a blender would have changed the particle size distribu-
tion of the MSW .
III . Effects of Organic Loading Rate and Hydraulic Retention Time onDigesters
A major objective of this research project was to determine the
effect of organic loading rate and hydraulic retention time on digester
performance . The experimental procedure was designed to provide a matrix
of experimental results which could be used to evaluate the effects of
these operating parameters . These results were shown previously in
Table 13 for gas production per unit mass of volatile solids applied .
74
The table shows that gas production rapidly declines as organic loading
rate is increased, and as hydraulic retention time is decreased. Generally
one would expect performance to decline as the digesters are more heavily
loaded, but the decline in performance is greater than was anticipated .
To further show the experimental results, gas production per unit
mass of volatile solids applied is plotted as a function of organic load-
ing rate in Figure 14 . The figure shows a decline from approximately
9 .0 ft3/1bVS applied day at an organic loading rate of 0 .07 lbVS/ft3 day
to less than 4 .0 ft 3 /1bVS applied day at 0 .25 1bVS/ft3 day . This reduc-
tion in gas production is in direct contrast to the results of Mah et al
(1980) who found more sustained gas productions at higher loading rates .
The difference in values is attributed to the difference in mixing regimes .
The digesters used by Mah, et al . (1980) were bench scale units having
volumes less than 10 liters . In a digester this small it is much easier
to obtain adequate mixing .
The mixing observed in the 50 gallon digesters used in this study was
often inadequate . On several occasions scum blankets were removed from
the heavily loaded digesters . The scum layers were 8" to 12" thick which
further reduced the mixing . The existence of a scum layer tends to create
more mixing problems, resulting in more scum generation .
Figures 15 and 16 show volatile solids destruction and total volatile
acids as a function of organic loading rate . The declining volatile solids
destruction with increasing organic loading rate verifies the declining
gas productions shown in Figure 15 . Increasing total volatile acids
concentration with increasing organic loading rate is to be expected . It
should be noted however that the acids concentrations found in this study
are generally lower than results for similarly sized equipment treating
similar MSW .
75

D C)WD cc)DCL
OOO -
n- OOCnNCLLD
OO
•0 .00 0 .05
0 .10
0 .15
0 .20
0 .25OLB (LB VS/FTxx3 DAY)
FIGURE 14 . GAS PRODUCTION AS A FUNCTIONOF ORGANIC LOADING RATE .
76

,<o0
71 CLED cc)F--4
UC)
LEomoo_WO
(f)OMoF~ .
O0
0o_
W CD
H .0-
CE NJCD
CDCD
oO00
0 .06
0 .12
0 18
0 .21
0 .30ORGANIC LOAD I NNG RATE (LB/FT)-x3 DAY)
FIGURE 15 . VOLATILE SOLIDS DESTRUCTION AS AFUNCTION OF ORGANIC LOADING RATE .
77

CD0
0
CD0
X o0N _
W o_J (DH
-CE
F---CE~-CEJCD~o>o_m
JQH-CD~o0
•0 . 00
vO
O
0 .05
0 1.10
0 .15
0 1.20
0.25OLH (LB VS/FTx-x3 DRY)
FIGURE 16 . TOTAL VOLATILE ACIDS AS A FUNCTION OFORGANIC LOADING RATE .
78
The effect of hydraulic retention time on digester performance is not
clear . Figure 17 shows gas production as a function of hydraulic retention
time . It is surprising to see the gas production increasing with decreas-
ing retention time because the opposite trend usually occurs . One possible
explanation of the reverse trend is the feed solids concentration and its
effect on mixing . At the lower hydraulic retention time, the feed solids
concentration is much lower, resulting in a thinner slurry which is easier
to mix .
79

M
W C)O CD
O ~-CE
U -)
~oO .
m
1-1
2 oED o
FmU
OO~o
(Numbers indicate OLR)
00
010 .00
15.00
20.00
25.00
30.00
35.00DETENTION TIME (DAYS)
FIGURE 17 . GAS PRODUCTION AS A FUNCTION OFHYDRAULIC RETENTION TIME .
80

CONCLUSIONS AND RECOMMENDATIONS
The results of this study show that MSW, after classification with
the Cal Recovery Process is a material suitable for anaerobic digestion
in combination with a nutrient and alkalinity source, such as raw primary
sludge . Gas productions ranged from a high of 9 ft 3/1bVS applied to
4 ft3/1bVS applied . This corresponds to the range of 8 to 12 ft3/1bVS
applied for raw sludges alone . The major difficulty encounter in the
study was mixing of the digester at high organic loading rates, which
appears to be the main cause of poorer performance at the higher loading
rates . The results of this study can be compared to other MSW-anaerobic
digestion studies shown in Table 15 .
The most reasonable interpretation of the experimental results
indicates that approximately 6-8 ft3/1bVS applied of medium BTU digester
gas (55-60% methane) can be produced from MSW classified by the Cal Recovery
Process . At present, this conclusion is restricted to loading rates less
than 0 .15 1bVS/ft 3 day . Higher loading rates are possible but this study
indicates that mixing problems must be overcome before adequate gas
productions will be obtained .
Anaerobic Digestion of MSW is a much more sensitive process than
anaerobic digestion of raw sludge alone . The MSW digesters were easily
overloaded, producing high volatile acids concentration . It was demonstrated
that digester failure could be avoided by pH control using sodium carbonate
and by temporarily reducing feeding rate . In extreme cases, feeding digested
sludge was necessary to insure prompt recovery .
The pattern of impending upset was similar to the predictions made by
Gray and Andrews (1974) . The indicator responding most quickly to digester
8 1

A - HandsortingB - ShreddingC - Fiberized RDF0 - Tertiary GradingE - Dry Milling
TABLE 15 . MUNICIPAL SOLID WASTE TO METHANE STUDIES
F - Air ClassificationG - Fine ShredH - ScreeningI - TromnellingJ - Drying
K - 2nd Tromnelling
i, - Averaged ValuesL - Stoner
* - Calculated from 4 .35 lb VS/daya - Garrett System
inputb - Cal Recovery
+ - Calculated from CH4 Conversionz - Calculated from CH4 Conver-
efficiency of 3 .4 and 3 .8sion efficiencies
Feed
Source
RDF Size &Pr processing‚eatures
Exp •Scale
(gallons) Temp . •C
OLR(lb VS/ft 3 day)
R -T(days)
Gas ConversionMixing
(ft3/lbVS added)%
CH4%
Dest .Period ofOperation
MajorProblem References
50% MSW
New Mexico B, 400 gal 350 0 .077 30 Recirculation 7 .0 55-60 64 .5 18 weeks Scum McFarland et al .
50% RS
Oklahoma (1/2-3/4") Layer 1972
MSW/RS
Illinois A,B(1/2-1") 100 gal 600 0.325* 10 Mechanical 6 .28 53 57 3 months Temp . Brown, Pfeffer1976etal .
Wisconsin A,B(1/2-1") 10 Paddle 5.22 7 months Control
Missouri A,B(1") 50-80% 36 rpm 4.99 25 months
o Recycling Study Ghosh et al .MSW/RS
Indianapolis C,D 106 gal 35 (0 .1-0 .2) Mechanical 5.8 58 .6' 50 .5 123 days 1977(80/20)
IN continuous
MSW
Indianapolis C,D 5 .0 350 (0.14) 12-21
200 rpm tointermittent
(80/20)
IN 1 .5,2 .5 (30 min/day)
MSW/RS
Berkeley E,F,H 2.4 gal 350 0 .062 30 Mechanical 7 .6 51 .3 14 days Diaz et al .1974
(20-80)
CA to Sealed StirrerMSW/RS
Berkeley E,F,H 0.068 7 .9 44 .3 22 daysCA
B,F,I,H 1 gal 35 0 (2 .- .4) 30 Mechanical (8 .2-5 .4) 55-60+ (35-77) 14 days Diaz et al .MSW/RS
Berkeley 1978(40-100)/(60-0) CA Material Sealed Stirrer
retainedfrom 0 .11"screensAfter pas- 423 gal 35• (0 .07) 30
(4x/day)
Recirculation (6.25-12) 60-63 64 24 days Scum(20-60)/(80-40)ing 0 .5"screensB,F,J,H,G 1 gal 370 (0.11) 15 Mechanical 3 .94 57 25 140 days
Layer
Mah, et alme (100%)
San Diego 1980
B,F,I,K,L 1 gal 37 0 (0 .12) 15Scaled Mixerlxl5 min . 7 .2 58 51 140 days
CAMSW b(100%)
BerkeleyCA
MSW b/KS
Berkeley B,F,I,K,L 1 gal 37 0 (0.08) 15 (8.1-9 .7) z (61-63) 140 days(90-60)/(10-40) CAMSW b/FLW/RS
Berkeley B,F,I,K,L 1 gal 370 (0 .35) 10 10 .2 2 61CA

upset was gas composition . Volatile acids concentration responded next,
while pH and alkalinity showed the slowest response to upset .
Future work should be directed at obtaining better mixing . Novel
techniques should be investigated to develop better mixing and scum blanket
control . The mixing requirements of the MSW digesters were very different
than the raw sludge digesters . For example, the raw sludge digester
performed flawlessly during the entire period of operation, without any
failures . The MSW digesters required occasional cleanings and frequent
bearing and seal replacement, due to mixing difficulties .
83

ReferencesCited
Achinger, W .C . (1970), "Study Report on a Pilot Plant Conical Incera-tor," Report SW-14ts, USDHEW, PHS, BSWM.
Ashare, E ., D .C . Augenstein, J .C . Young, R .J . Hossan, and G .L . Duret(1978), "Evaluation of Systems for Purification of Fuel Gas from Anaer-obic Digestion," Dynatech Report No . 1628, submitted to U .S . Dept . ofEnergy under contract EY-76-C-02-2991*000 .
Babitt, H .E ., B .J . Leland, and F .E . Whitely, Jr . (1936), "The BiologicalDigestion of Garbage with Sewage Sludge," University of Illinois Bulletin,Vol . 24, No . 24 .
Beningson, R.M ., et al . (1975), "Production of Eco-Fuel II from MunicipalSolid Waste," Conversion of Refuse to Energy, First International Confer-ence, Montreux, Switzerland, Nov . 3-5, 1975 .
Blayden, L .C . (1976), "Aluminum Recovery with Eddy Currents," paper pre-sented at Soc . Mining Engr .AIME Conf., Las Vegas, Nevada .
Brown and Caldwell Consulting Engineers (1978), "Microbial Production ofMethane from Refuse," report prepared for So . Calif . Edison Co ., Researchand Development Dept ., Rosemead, CA .
Brown and Caldwell Consulting Engineers (1979), "Energy Recovery fromWaste and Biomass Site Specific Economic Studies," prepared for So . Calif .Edison Co ., Research and Development Dept ., Rosemead, CA .
Brown, J .W., J .T . Pfeffer, and J .C . Liebman (1976), "Biological Conversionof Organic Refuse to Methane," Vol . I ., prepared for the Energy Researchand Development Administration and the National Science Foundation,Report No . ERDA/NSF/SE/G1-29191/FR/76/4, Univ . of Illinois, Urbana, IL .
Bryant, M .P . (1979), "Microbial Methane Production -- Theoretical Aspects,"J . of Animal Science, Vol . 48, No. 1, pp . 193-201 .
Chain, E .S .K ., F .B . Dewalle, and E . Hannerberg (1977), "Effect of MoistureRegime and Other Factors on Municipal Solid Waste Stabilization in Manage-ment of Lechate in Landfills," S . K. Banerji (ED .) U .S . EPA 600/9-77-026,Washington, D .C .
Daniels, L .E . (1970a), "A Report on the Dekalb County Incinerator Study,"Report SW-31ts, USDHEW, PHS, BSWM .
84

Daniels, L .E . (1970b), "A Report on the Harsfield Incinerator Study,"Report SW-30ts, USDHEW, PHS, BSWM .
Dewalle, F .B ., E .S .K . Chain, and E . Hannerberg (1978), "Gas Productionof Solid Waste in Landfill," J . oftheEnvironmental EngineeringDiv .,ASCE, Vol . 104, No . EE3, pp . 415-432 .
Diaz, L .F . and G .J . Trezek (1977), "Biogasification of a SelectedFraction of Municipal Solid Wastes," Compost Science, 18(2), pp . 8-13 .
Diaz, L .F ., F . Kurz, and G .T . Trezek (1974), "Methane gas productionas part of a refuse recycling system," Compost Science, 15(3), pp . 7-13.
Even, J .C,, et al . (1977), "Evaluation of the Ames Solid Waste RecoverySystem, Part I," U .S . EPA, EPA-600/2-77-205 .
FMC Corp. (1968), "Systems Analysis for Solid Waste Disposal by Incinera-tion," San Jose, CA .
Ghosh, S . and D .L . Klass (1976), "SNG from Refuse and Sewage Sludge bythe Biogas Process," IGT Symposium on Clean Fuels from Biomass, Sewage,Urban Refuse and Agricultural Wastes, Orlando, Florida, Jan . 27-30, 1976 .
Ghosh, S ., D .L . Klass, J . Conrad, M . Henry, K . Griswold, and F . Sedzielarz(1977), "A Comprehensive Gasification Process for Energy Recovery fromCellulosic Wastes," presented at the Symposium on Bioconversion of Cellu-losic Substances into Energy, Chemical and Protein, New Delhi, India .
Golueke, C .G . and P .H . McGauhey (1970), "Comprehensive Studies of SolidWaste Management," First and Second Annual Report-Research Grant No .EC-00260 USDHEW, PHS, BSWM, Proceedings of Mecar Symposium-Incinerationof Solid Wastes .
Golueke, C .J . (1971), "Comprehensive Studies of Solid Waste Management,Third Annual Report," Sanitary Engineering Research Laboratory, Richmond,CA.
Gossett, J .M ., J .B . Healy, Jr ., D .C . Stuckey, L .Y . Young, and P .L . McCarty(1976), "Heat Treatement of Refuse for Increasing Anaerobic Biodegradabil-ity," Semi-Annual Progress Report (7 .1/75-12/3175) submitted to NationalScience Foundation under contract No . NSF/RANN/AER74-17940-AOl/PR/75/4,Report No . CE-TR-205 .
Hahn, J .L . (1970a),"Study of the Delaware County No . 3 Incineratorin Broomall, Pennsylvania," Report TO 3 .1 .010/0, USDHEW, PHS, BSWM .
85

Hahn, J .L . (1970b), "A Study of the New Orleans East Incinerator,"Report TSR/01 .38/9, USDHEW, PHS, BSWM .
Ham, R.K. (1975), "The Role of Shredded Refuse in Landfilling," WasteAge, 6(12), p . 22 .
Hickman, H .L ., Jr . (1968), "The Physical and Chemical Characteristicsof Municipal Solid Wastes," U .S . Dept . of Health, Education, and Welfare .
Hickman, W .B . (1976), "Storage and Retrieval of Prepared Refuse,"Proceedinqs ASME, National Waste Process Conference, Boston, MA .
Ingram, W.T . and F .P. Francia (1968), "Quad City Solid Wastes Project-Interim Report," paper prepared for U .S . Dept . of Health, Education, andWelfare by Quad City Solid Wastes Committee Staff .
Jarvis, C .E ., J .T. Schwartzbaugh, C .W. Cartti (1978), "A BiogassificationMixing Study: Conversion of MSW to Methane," Symposium Papers Energy fromBiomass and Wastes, Aug . 14-18, 1978, Washington, D .C .
Kaiser, E .(1967), Proceedings of the 2nd Annual Meeting of the Institutefor Solid Wastes, APWA, Boston, MA, Oct . 1967, p . 37
Kaiser, E . (1968a), "Chemical Analysis of Refuse Components," Proceedingsof 1968 National Incinerator Conference, ASME, New York, NY .
Kaiser, E ., C .D . Zlit, and J .B . McCoffery (1968b), "Municipal IncineratorRefuse and Residues," Proceedings of 1968 National Incinerator Conference,ASME, New York, NY .
Kaiser, E .R . and A .A . Carotti (1971), "Municipal Incineration of Refusewith 2% and 4% Additions of Four Plastics," Report to the Society of thePlastics Industry .
Kispert, R .G ., L .C . Anderson, D .H . Walker, S .E . Sadek, and D .L . Wise (1974),"Fuel Gas Production from Solid Waste," Dynatech Report No . 1207, NTISNo . PB 238068 .
Klein, S .A . (1972), "Anaerobic Digestion of Solid Wastes," Compost Science,13(1), pp . 6-11 .
LA/OMA Project (1977),"Sludge Processing and Disposal ; A State-of-the-ArtReview,"Los Angeles County Sanitation District, Whittier, CA
Mah, R.A., D .M . Ward, L . Baresi, and T .L . Glass (1977), "Biogenisis ofMethane," Ann, Rev . Microbiology, 31 : pp . 309-341 .
86
Mah, R.A., D.Y . Wong, T. Ferguson (1980), "Anaerobic Digestion ofUrban Solid Wastes," Final Report to S . Calif. Edison Co. ; Schoolof Public Health, University of California, Los Angeles .
Metcalf & Eddy, Inc . (1979), Wastewater Engineering, Treatment,Disposal, Reuse, 2nd Ed ., McGraw-Hill Book Company, New York, NY .
McCarty, P .L ., L .Y . Young, J .G . Gossett, D .C . Stuckey, and J .B . Healy,Jr. (1977), "Heat Treatment for Increasing Methane Yields from OrganicMaterials," in Microbial Energy Conversion, H .G . Schleger and J .B. Barnes,eds ., Gottingen, Germany : Erich Goltze KG, pp . 179-199 .
McFarland, et al . (1972), "Comprehensive Studies of Solid Waste Manage-ment, Final Report," SERL Report No . 72-3, Sanitary Engineering Lab.,University of California, Berkeley, CA .
McInerney, M .J ., M .P . Bryant, and N . Pfenning (1979), "Anaerobic Bacteriumthat Degrades Fatty Acids in Syntrophic Association with Methanogens,"Arch . Microbiol ., 122, pp . 129-135 .
MITRE Corp . (1979), "Resource Recovery Research and Demonstration Plan,"Department of Energy Contract #ACO1-78CS20178 .DOE/CS/20178-01 .
Murray, D .L . and C .L . Liddel (1977), "The Dynamics, Operation and Evalua-tion of an Air Classifier," Waste Age .
Niessen, W .R . et al . (1970), "Systems Study of Air Pollution From Munici-pal Incineration," Report to NAPCA under Contract CPA 22-69-23 by ArthurD. Little, Inc ., Cambridge, MA .
Pfeffer, J .T. (1974), "Temperature Effects of Anaerobic Fermentation ofDomestic Refuse," Biotech . and Bioeng ., Vol . 15, pp . 771-787 .
Pfeffer, J .T . and J .C . Liebman (1974), "Biological Conversion of OrganicRefuse to Methane, Annual Report," Dept . of Civil Engineering, Univ . ofIllinois, Urbana, Report UILU-ENG-74-2019 NSF/RANN/SE/GI/39191/PR/75/2 .
Purdom, P .W . (1966), "Characteristics of Incinerator Residue," Proceed-inqs of the 1st Annual Meeting of the Institute for Solid Wastes, APWA,Chicago, Ill .
Savage, G ., L .F . Diaz, and G .T . Trezek (1974), "The Cal Recovery System -A Resource Recovery System for Dealing with the Problems of Solid WasteManagement," Compost Science, 16(5), pp . 18-21 .
87
Savage, G . and G .J . Trezek (1976), "Screening Shredded Municipal SolidWaste," CompostScience, Vol . 17, No . 1, pp . 7-11 .
Shiflett, G .R. and G.J . Trezek (1979), "Parameters Governing RefuseComminution," ResourceRecoveryandConservation, 4, pp . - 31-42 .
Sullivan, P .M ., M .H . Stanczyk and M .J . Spendlore (1972), Rep . Invest .RJ 7760 (Description of Food Material), Bureau of Mines, U .S . Dept .of the Interior, Washington, D .C .
Swartzbaugh, J .T ., C .E . Jarvis, R .B . Smith (1979), Gas Recovery fromMSW, Sewage Sludge Anaerobic Digesters," Solids and Hazardous ResearchDivision, Fifth Annual Research Symposium, MSW Resource Recovery, U .S .EPA, March 26-28, 1979, Orlando, Florida .
Switzger, A. et al . (1969), "Master Plan for Solid Waste Collection andDisposal," U .S . DHEW, BSWN, Washington, D .C .
Systems Technology Corp . (1977), Preliminary Findings : Use of d-RDFas a -Stoker Coal Substitute-Industrial Spreader Stoker ."
Torpey, W .N . (1954), "High-Rate Digestion of Conventional Primary andActivated Sludge," J . of the Water Pollution Control Federation, April1954, Vol . 24, No . 4, pp . 479-496 .
Torpey, W .N . (1944), "Loading to Failure of a Pilot High Rate Digester,"Sewage Works J ., Feb . 1955, Vol . 27, No . 2, pp . 121-142 .
Trezek, G .J . and G . Savage (1975), "Report on a Comprehensive RefuseCotmminution Study," Waste Age,, pp . 49-55 .
U.S . EPA (1975), "A Technical, Environmental, and Economic Evaluationof the Wet Processing System for the Recovery and Disposal of MunicipalSolid Waste," SW-109C .
U .S . EPA-OSWP (1977), Fourth Report to Congress : Resource Recovery andWaste Reduction, EPA Report SW-600, Washington, D .C .
U .S . EPA, Process Design Manual for Sludge Treatment and Disposal,"Municipal Environmental Research Laboratory," Center for EnvironmentalResearch Information Technology Transfer, EPA 6251, 1-79-011 .
U .S DHEW (1967), "Solid Waste Study and Planning Grant, Jefferson County,Kentucky," Washington, D .C .
88

U .S . DHEW (1968a), "The Solid Waste Disposal Study, Genesee County,Michigan," Washington, D .C .
U.S. DHEW (1968b), "The Solid Wastes Disposal Study, Genesee County,Brief History of Study," Washington, D.C.
U.S. DHEW (1968c), "Kalamazoo County Road Commission, Solid WastesStudy," Washington, D .C .
U.S . DHEW (1966), "Solid Wastes Study of a Residential Area," Cincinnati,Ohio .
U .S . PHS (1967), "Bailing Municipal Refuse," Grant No . 1-DO1-U1-00061-01,for San Diego, CA, Washington, D .C .
Vesilind, P.A. and A.E. River (1981), Unit Operations in Resource RecoveryEngineering, Prentice Hall, Inc ., New Jersey, 217 pp .
Waste and Water International (1981),"Engineering Technology Assessment :Anaerobic Digestion of Combined Waste,"EPA Contract No . 68-03-3016,Berkeley, CA.
Wilson, D .G . (1977), Handbook of Solid Waste Management, Van NostrandReinhold Company, New York, NY .
Wolfe, R.S . and I .J . Higgins (1979), "Microbial Biochemistry of Methane -A Study of Contrasts," Microbial Biochemistry, Vol . 21, pp . 267-299 .
Worrel, W.A. and P .A. Vesilind (1979), "Testing and Evaluation of AirClassifier Performance," Resource Recovery and Conservation, (4) ; pp. 247-259 .
Wright, I .J ., F .L . Clark, L . Larson, I . Straughan, and B . Mechalas (1978),"An Integrated Utility Approach to Anaerobic Digestion of Refuse forElectrical Power Production," IGT-Energy from Biomass and Wastes Symposium ;Aug . 14-18, 1978 ; Washington, D .C .
Zehnder, A.J . B . (1978), "Ecology of Methane Formation," Water PollutionMicrobiology, Vol . 2, R . Mitchell, ed ., John Wiley and Son, pp . 349-376 .
Zeikus, J .G. (1980), "Chemical and Food Production by Anaerobic Bacteria,"Ann . Rev, of Microbiology, Vol . 34, pp . 423-464 .
89