ana-maria loghin * , johannes otepka-schremmer and norbert
TRANSCRIPT
sensors
Article
Potential of Pléiades and WorldView-3 Tri-StereoDSMs to Represent Heights of Small Isolated Objects
Ana-Maria Loghin * , Johannes Otepka-Schremmer and Norbert Pfeifer
Department of Geodesy and Geoinformation, Technische Universität Wien, Wiedner Hauptstraße 8-10,1040 Vienna, Austria; [email protected] (J.O.-S.); [email protected] (N.P.)* Correspondence: [email protected]; Tel.: +43-(1)-58801-12259
Received: 30 March 2020; Accepted: 3 May 2020; Published: 9 May 2020�����������������
Abstract: High-resolution stereo and multi-view imagery are used for digital surface model (DSM)derivation over large areas for numerous applications in topography, cartography, geomorphology,and 3D surface modelling. Dense image matching is a key component in 3D reconstructionand mapping, although the 3D reconstruction process encounters difficulties for water surfaces,areas with no texture or with a repetitive pattern appearance in the images, and for very small objects.This study investigates the capabilities and limitations of space-borne very high resolution imagery,specifically Pléiades (0.70 m) and WorldView-3 (0.31 m) imagery, with respect to the automatic pointcloud reconstruction of small isolated objects. For this purpose, single buildings, vehicles, and treeswere analyzed. The main focus is to quantify their detectability in the photogrammetrically-derivedDSMs by estimating their heights as a function of object type and size. The estimated height wasinvestigated with respect to the following parameters: building length and width, vehicle length andwidth, and tree crown diameter. Manually measured object heights from the oriented images wereused as a reference. We demonstrate that the DSM-based estimated height of a single object stronglydepends on its size, and we quantify this effect. Starting from very small objects, which are not elevatedagainst their surroundings, and ending with large objects, we obtained a gradual increase of therelative heights. For small vehicles, buildings, and trees (lengths <7 pixels, crown diameters <4 pixels),the Pléiades-derived DSM showed less than 20% or none of the actual object’s height. For largevehicles, buildings, and trees (lengths >14 pixels, crown diameters >7 pixels), the estimated heightswere higher than 60% of the real values. In the case of the WorldView-3 derived DSM, the estimatedheight of small vehicles, buildings, and trees (lengths <16 pixels, crown diameters <8 pixels) was lessthan 50% of their actual height, whereas larger objects (lengths >33 pixels, crown diameters >16 pixels)were reconstructed at more than 90% in height.
Keywords: VHR tri-stereo satellite imagery; digital elevation model; isolated objects; denseimage matching
1. Introduction
For more than thirty years, civilian satellite sensors have been used for digital elevation model(DEM) extraction over large areas in a timely and cost-effective manner for a wide range of applicationsin engineering, land planning, and environmental management. Beginning with the year 1986,when SPOT—the first satellite providing stereo-images, with a panchromatic Ground SamplingDistance (GSD) of 10 m—was launched [1], the optical satellite industry has been experiencingcontinuous development. Today more and more space sensors are available that acquire not onlystereo but also tri-stereo satellite imagery. The generation of high and very high resolution commercialspace imaging systems for DEM generation started in September 1999, with the launch of IKONOS [2].Among the Very High Resolution (VHR) optical satellites providing along- and across-track stereo,
Sensors 2020, 20, 2695; doi:10.3390/s20092695 www.mdpi.com/journal/sensors
Sensors 2020, 20, 2695 2 of 20
the following systems can be mentioned: Ziyuan-3 (2.1 m), KOMPSAT-2 (1 m), Gaofen-2 (0.8 m),TripleSat (0.8 m), EROS B (0.7 m), KOMPSAT-3 (0.7 m), Pléiades 1A/1B (0.7 m), SuperView 1-4 (0.5 m),GeoEye-1 (0.46 m), WorldView-1/2 (0.46 m) and WorldView 3 (0.31 m).
The new generation of Earth observation satellites are characterized by an increased acquisitioncapacity and the possibility of collecting multiple images of the same area from different viewing anglesduring a single pass [3,4]. This multi-view aspect is essential for extracting 3D information. In recentyears, the potential of tri-stereo acquisition from high-resolution satellite images for surface modellinghas become an interesting research topic that has been addressed in various publications. The capacityof the Pléiades system in performing 3D mapping was analyzed by Bernard et al. [5], where 17 imagesacquired from different points of view were used. They showed that by means of “triple stereo”configurations reliable digital surface models can be generated in urban areas. From their best imagecombination, a root mean square error (RMSE) of 0.49 m was obtained at 295 ground control points(GCPs). The radiometric and geometric characteristics of Pléiades imagery with a focus on digitalsurface modelling are analyzed by Poli et al. [6]. The model derived from a “triple stereo” scene(nadir, forward and backward) showed median values close to zero and an RMSE in the range of 6–7 m,when compared with a reference light detection and ranging (LiDAR) DSM. An accurate 3D map withtri-stereo images can be obtained by optimizing the sensor models with GCPs, leading to accuracies inthe range of 0.5 m in planimetry and of 1 m in height as demonstrated in [7].
Much of the previous research using WorldView-3 satellite images focused on their highresolution multi-spectral information, with applications in topographic mapping, land planning,land use, land cover classification, feature extraction, change detection, and so on [8–11]. The 3Dpotential of WorldView-3 data is assessed by Hu et al. [12], where the reconstructed DEM shows heightdifferences of less than 0.5 m for 82.7% of 7256 ground LiDAR checkpoints located along road axes.A new algorithm for generating high quality digital surface models is proposed by Rupnik et al. [13],where a dense image matching method is applied for multi-view satellite images from Pléiadesand WorldView-3.
The capability of satellite images regarding a rapid evaluation of urban environments is addressedin Abduelmula et al. [14]. They compared 3D data extracted from tri-stereo and dual stereosatellite images combined with pixel-based matching and Wallis filter to improve the accuracyof 3D models, especially in urban areas. The result showed that 3D models achieved by Pleiadestri-stereo outperformed the result obtained from a GeoEye pair, in terms of both accuracy and detail.This could mean that tri-stereo images can be successfully used for urban change analyses. The potentialof VHR optical sensors for 3D city model generation has been addressed in [15–17], showing promisingresults for automatic building extraction when compared to a LiDAR elevation model, althoughhighlighting some difficulties in the case of small individual house reconstruction. A quantitative andqualitative evaluation of 3D building models from different data sources was presented in [18], wherea DSM at 1 m resolution derived from a GeoEye-1 stereo-pair, a DSM from an aerial block at 50 cmGSD, and a LiDAR-based DSM at 1 m resolution were used. Their results show that the percentage ofcorrectly reconstructed models is very similar for airborne and LiDAR data (59% and 67%, respectively),while for GeoEye data it is lower (only 41%). The real dimensions of the 17 buildings surveyed wereused as ground truth-reference for the 3D building model’s quality assessment, obtaining a meanvalue for the residual heights of 1.94 m for the photogrammetric DSM. In [19] the authors analyze andvalidate the potential of high-resolution DSMs produced from stereo and tri-stereo Pléiades-1B satelliteimagery acquired over the Athens Metropolitan Area. From their tests, the tri-stereo model shows thebest performance in height accuracy, with an RMSE of 1.17 m when compared with elevations measuredby a differential global positioning system.
The advantages of using tri-stereo instead of stereo image pairs are described by Piermattei et al. [20],where the nadir image increases the DSM completeness, reducing the occlusions usually caused bylarger convergence angles on the ground. Additionally, they investigate in detail the influence of theacquisition geometry (viewing and incidence angles) of VHR imagery on DSM accuracy.
Sensors 2020, 20, 2695 3 of 20
The cited literature concentrates on the accuracy assessments either on open areas or on (large)buildings within city areas, but not on smaller objects like cars.
The standard method of DSM generation from stereo-pairs or triples is dense image matching usingglobal or semi-global optimization. Because of the smoothness constraint of dense image matching [21],the heights of small individual objects may not be reconstructed. Hence, the corresponding 3Dpoints will not have higher elevations compared to their surroundings. Based on this hypothesis, weinvestigated the capability of dense image matching when evaluating the height of small individual,i.e., detached, objects. While previous studies addressed the general 3D capabilities of VHR sensors,our investigation concentrates on small, isolated object detectability by height estimation. To the bestof our knowledge, our study is the first to analyze and quantify the capability of the tri-stereo Pléiadesand WorldView-3 reconstructed DSMs for single object detection by height estimation, with focuson vehicles, buildings, and trees. The object’s height compared with its surrounding terrain (in thefollowing simply referred to as height) was investigated with respect to the following parameters:building length and width, vehicle length and width, and tree crown diameter. We investigate DSMsfrom different sensors with very small GSD, Pléiades and WorldView-3, but the focus is not a comparisonof the two satellite systems. Specifically, our research investigation’s purpose is to answer the followingquestions: (1) which geometric signature and minimum size must individual objects have to be detectedin the DSM-based on their reconstructed heights; and (2) what are the influences of different acquisitiontimes, geometries, and GSDs on dense image matching quality for single objects. In the following,we first describe the tri-stereo satellite imagery used together with the study site (Section 2), followedby image block orientation (in Section 3.1) using Rational Polynomial Coefficients (RPCs) and a setof GCPs. Once the orientation is completed, the 3D reconstruction follows. The 3D coordinates ofthe specific points corresponding to buildings, vehicles and trees are monoscopically measured in allthree images: forward, nadir, and backward. The elevations obtained were used for computing thereference individual object’s height, by subtracting the correspondent elevations from a LiDAR digitalterrain model (DTM) (in Section 3.2). Subsequently, the accuracy of image orientation and the procedureof dense image matching are detailed in Sections 4.1 and 4.2. After that, individual objects are groupedinto different classes depending on their corresponding sizes. Their automatically-reconstructedheights are then compared with reference values (in Sections 4.3 and 4.4). Finally, the major findings ofthe current work are summarized in Section 5.
2. Study Area and Data Analysis
The study area is located in Lower Austria, the north-eastern state of the country (48◦30′30′′ N;15◦08′34′′ E; WGS84). With elevations ranging from 537 to 846 m above sea level, the region containsdifferent land cover types such as: urban, suburban, rural, arable, grassland, and forested areas.Analysis was conducted based on tri-stereo satellite images acquired with both Pléiades-1B andWorldView-3 optical satellite sensors. Each triplet consists of images that were collected duringthe same pass from different sensor-viewing angles (along-track stereo): forward, close to nadir,and backward. The location of the study area acquired with the two sensors, with an overlappingsurface of 44.5 km2, is shown in Figure 1.
For the current analyses, the reference data contains 43 GCPs measured by means of real timekinematic (RTK) GPS with an accuracy of approximately 1 cm. A DTM generated from a LiDAR flightcampaign conducted in December 2015 is available, too. The raster DTM is in UTM 33 North mapprojection, datum WGS 84 with a grid spacing of 1 m. Its height accuracy was checked against the RTKGCPs yielding a σZ of 0.12 m. We used a digital orthophoto from 2017 at 0.20 m resolution for definingthe positions of check points (CP). The planimetric accuracy of the digital orthophoto was verified bycomputing the differences between the RTK point coordinates and their corresponding position on theorthophoto. The result showed that no shifts larger than one pixel were observed.
Sensors 2020, 20, 2695 4 of 20
Sensors 2020, 20, x 3 of 20
The standard method of DSM generation from stereo‐pairs or triples is dense image matching using
global or semi‐global optimization. Because of the smoothness constraint of dense image matching [21],
the heights of small individual objects may not be reconstructed. Hence, the corresponding 3D points will
not have higher elevations compared to their surroundings. Based on this hypothesis, we investigated the
capability of dense image matching when evaluating the height of small individual, i.e., detached, objects.
While previous studies addressed the general 3D capabilities of VHR sensors, our investigation
concentrates on small, isolated object detectability by height estimation. To the best of our knowledge, our
study is the first to analyze and quantify the capability of the tri‐stereo Pléiades and WorldView‐3
reconstructed DSMs for single object detection by height estimation, with focus on vehicles, buildings,
and trees. The object’s height compared with its surrounding terrain (in the following simply referred to
as height) was investigated with respect to the following parameters: building length and width, vehicle
length and width, and tree crown diameter. We investigate DSMs from different sensors with very small
GSD, Pléiades and WorldView‐3, but the focus is not a comparison of the two satellite systems.
Specifically, our research investigation’s purpose is to answer the following questions: (1) which
geometric signature and minimum size must individual objects have to be detected in the DSM‐based on
their reconstructed heights; and (2) what are the influences of different acquisition times, geometries, and
GSDs on dense image matching quality for single objects. In the following, we first describe the tri‐stereo
satellite imagery used together with the study site (Section 2), followed by image block orientation (in
Section 3.1) using Rational Polynomial Coefficients (RPCs) and a set of GCPs. Once the orientation is
completed, the 3D reconstruction follows. The 3D coordinates of the specific points corresponding to
buildings, vehicles and trees are monoscopically measured in all three images: forward, nadir, and
backward. The elevations obtained were used for computing the reference individual object’s height, by
subtracting the correspondent elevations from a LiDAR digital terrain model (DTM) (in Section 3.2).
Subsequently, the accuracy of image orientation and the procedure of dense image matching are detailed
in Sections 4.1 and 4.2. After that, individual objects are grouped into different classes depending on their
corresponding sizes. Their automatically‐reconstructed heights are then compared with reference values
(in Sections 4.3 and 4.4). Finally, the major findings of the current work are summarized in Section 5.
2. Study Area and Data Analysis
The study area is located in Lower Austria, the north‐eastern state of the country (48°30’30”N;
15°08’34”E; WGS84). With elevations ranging from 537 to 846 m above sea level, the region contains
different land cover types such as: urban, suburban, rural, arable, grassland, and forested areas.
Analysis was conducted based on tri‐stereo satellite images acquired with both Pléiades‐1B and
WorldView‐3 optical satellite sensors. Each triplet consists of images that were collected during the
same pass from different sensor‐viewing angles (along‐track stereo): forward, close to nadir, and
backward. The location of the study area acquired with the two sensors, with an overlapping surface
of 44.5 km2, is shown in Figure 1.
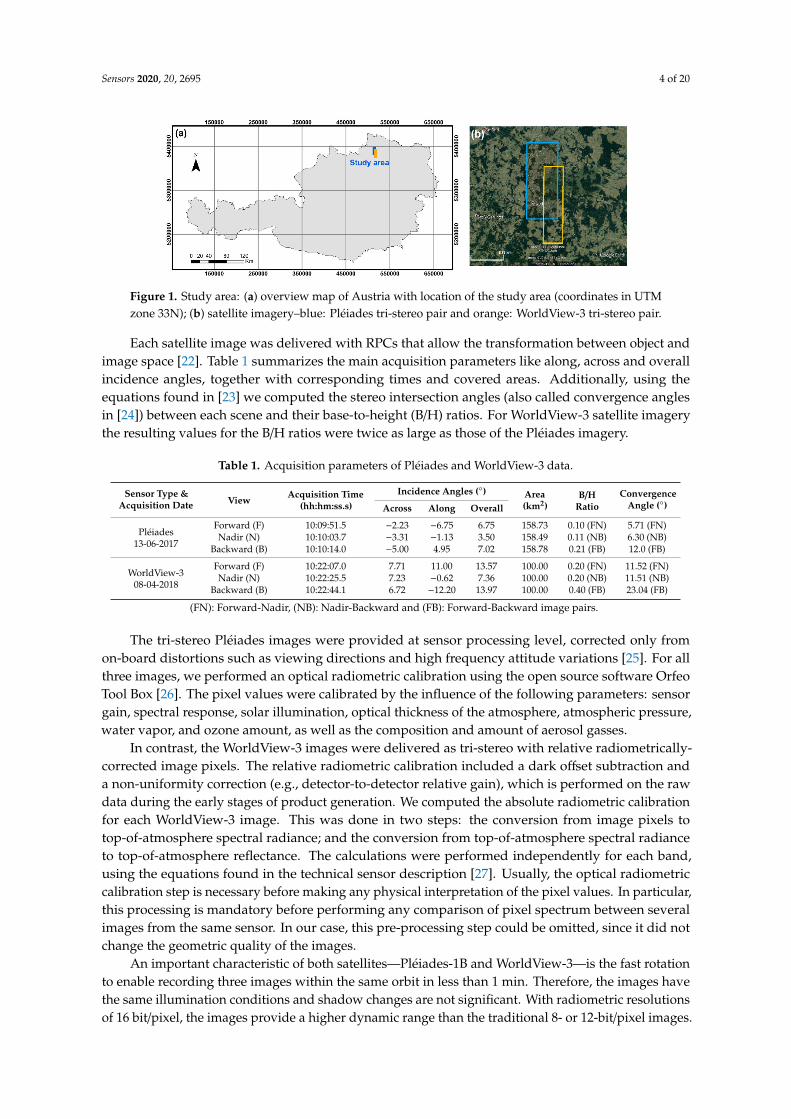
Figure 1. Study area: (a) overview map of Austria with location of the study area (coordinates in UTM
zone 33N); (b) satellite imagery–blue: Pléiades tri‐stereo pair and orange: WorldView‐3 tri‐stereo pair.
Figure 1. Study area: (a) overview map of Austria with location of the study area (coordinates in UTMzone 33N); (b) satellite imagery–blue: Pléiades tri-stereo pair and orange: WorldView-3 tri-stereo pair.
Each satellite image was delivered with RPCs that allow the transformation between object andimage space [22]. Table 1 summarizes the main acquisition parameters like along, across and overallincidence angles, together with corresponding times and covered areas. Additionally, using theequations found in [23] we computed the stereo intersection angles (also called convergence anglesin [24]) between each scene and their base-to-height (B/H) ratios. For WorldView-3 satellite imagerythe resulting values for the B/H ratios were twice as large as those of the Pléiades imagery.
Table 1. Acquisition parameters of Pléiades and WorldView-3 data.
Sensor Type &Acquisition Date View
Acquisition Time(hh:hm:ss.s)
Incidence Angles (◦) Area(km2)
B/HRatio
ConvergenceAngle (◦)Across Along Overall
Pléiades13-06-2017
Forward (F) 10:09:51.5 −2.23 −6.75 6.75 158.73 0.10 (FN) 5.71 (FN)Nadir (N) 10:10:03.7 −3.31 −1.13 3.50 158.49 0.11 (NB) 6.30 (NB)
Backward (B) 10:10:14.0 −5.00 4.95 7.02 158.78 0.21 (FB) 12.0 (FB)
WorldView-308-04-2018
Forward (F) 10:22:07.0 7.71 11.00 13.57 100.00 0.20 (FN) 11.52 (FN)Nadir (N) 10:22:25.5 7.23 −0.62 7.36 100.00 0.20 (NB) 11.51 (NB)
Backward (B) 10:22:44.1 6.72 −12.20 13.97 100.00 0.40 (FB) 23.04 (FB)
(FN): Forward-Nadir, (NB): Nadir-Backward and (FB): Forward-Backward image pairs.
The tri-stereo Pléiades images were provided at sensor processing level, corrected only fromon-board distortions such as viewing directions and high frequency attitude variations [25]. For allthree images, we performed an optical radiometric calibration using the open source software OrfeoTool Box [26]. The pixel values were calibrated by the influence of the following parameters: sensorgain, spectral response, solar illumination, optical thickness of the atmosphere, atmospheric pressure,water vapor, and ozone amount, as well as the composition and amount of aerosol gasses.
In contrast, the WorldView-3 images were delivered as tri-stereo with relative radiometrically-corrected image pixels. The relative radiometric calibration included a dark offset subtraction anda non-uniformity correction (e.g., detector-to-detector relative gain), which is performed on the rawdata during the early stages of product generation. We computed the absolute radiometric calibrationfor each WorldView-3 image. This was done in two steps: the conversion from image pixels totop-of-atmosphere spectral radiance; and the conversion from top-of-atmosphere spectral radianceto top-of-atmosphere reflectance. The calculations were performed independently for each band,using the equations found in the technical sensor description [27]. Usually, the optical radiometriccalibration step is necessary before making any physical interpretation of the pixel values. In particular,this processing is mandatory before performing any comparison of pixel spectrum between severalimages from the same sensor. In our case, this pre-processing step could be omitted, since it did notchange the geometric quality of the images.
An important characteristic of both satellites—Pléiades-1B and WorldView-3—is the fast rotationto enable recording three images within the same orbit in less than 1 min. Therefore, the images havethe same illumination conditions and shadow changes are not significant. With radiometric resolutionsof 16 bit/pixel, the images provide a higher dynamic range than the traditional 8- or 12-bit/pixel images.
Sensors 2020, 20, 2695 5 of 20
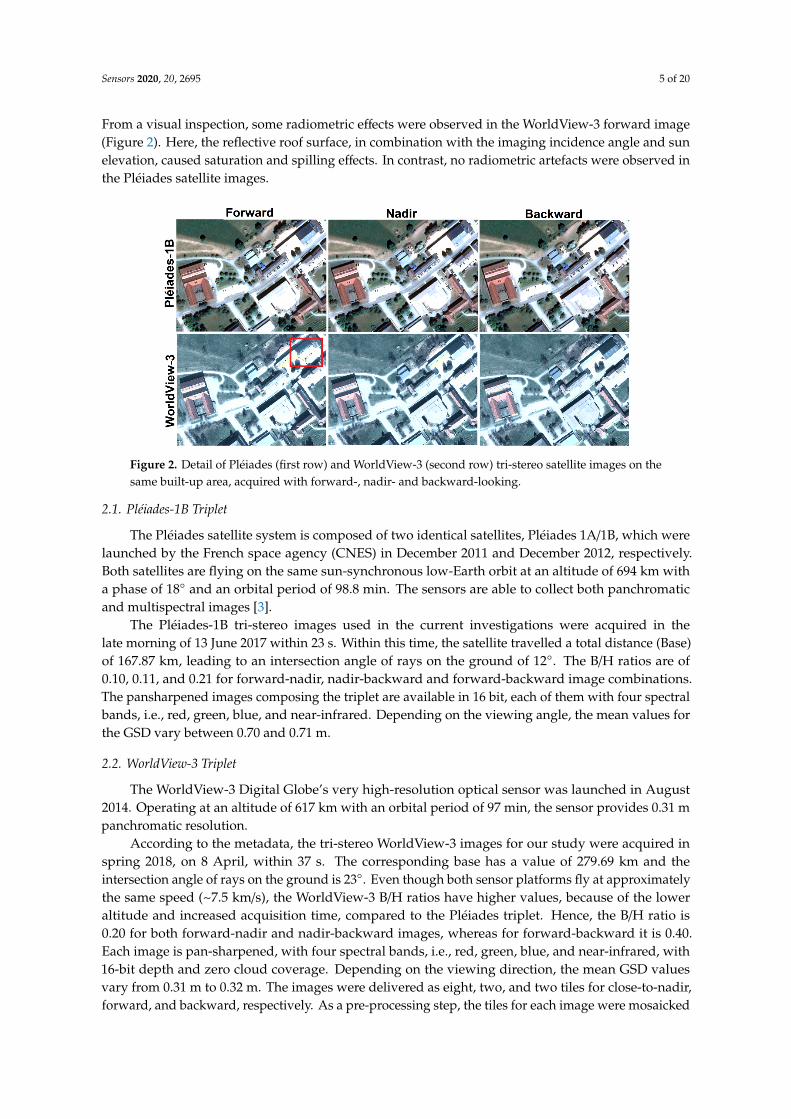
From a visual inspection, some radiometric effects were observed in the WorldView-3 forward image(Figure 2). Here, the reflective roof surface, in combination with the imaging incidence angle and sunelevation, caused saturation and spilling effects. In contrast, no radiometric artefacts were observed inthe Pléiades satellite images.
Sensors 2020, 20, x 5 of 20
radiometric resolutions of 16 bit/pixel, the images provide a higher dynamic range than the
traditional 8‐ or 12‐bit/pixel images. From a visual inspection, some radiometric effects were observed
in the WorldView‐3 forward image (Figure 2). Here, the reflective roof surface, in combination with
the imaging incidence angle and sun elevation, caused saturation and spilling effects. In contrast, no
radiometric artefacts were observed in the Pléiades satellite images.
Figure 2. Detail of Pléiades (first row) and WorldView‐3 (second row) tri‐stereo satellite images on
the same built‐up area, acquired with forward‐, nadir‐ and backward‐looking.
2.1. Pléiades‐1B Triplet
The Pléiades satellite system is composed of two identical satellites, Pléiades 1A/1B, which were
launched by the French space agency (CNES) in December 2011 and December 2012, respectively.
Both satellites are flying on the same sun‐synchronous low‐Earth orbit at an altitude of 694 km with
a phase of 18o and an orbital period of 98.8 min. The sensors are able to collect both panchromatic
and multispectral images [3].
The Pléiades‐1B tri‐stereo images used in the current investigations were acquired in the late
morning of 13 June 2017 within 23 s. Within this time, the satellite travelled a total distance (Base) of
167.87 km, leading to an intersection angle of rays on the ground of 12o. The B/H ratios are of 0.10,
0.11, and 0.21 for forward‐nadir, nadir‐backward and forward‐backward image combinations. The
pansharpened images composing the triplet are available in 16 bit, each of them with four spectral
bands, i.e., red, green, blue, and near‐infrared. Depending on the viewing angle, the mean values for
the GSD vary between 0.70 and 0.71 m.
2.2. WorldView‐3 Triplet
The WorldView‐3 Digital Globe’s very high‐resolution optical sensor was launched in August
2014. Operating at an altitude of 617 km with an orbital period of 97 min, the sensor provides 0.31 m
panchromatic resolution.
According to the metadata, the tri‐stereo WorldView‐3 images for our study were acquired in
spring 2018, on 8 April, within 37 s. The corresponding base has a value of 279.69 km and the
intersection angle of rays on the ground is 23o. Even though both sensor platforms fly at
approximately the same speed (~ 7.5 km/s), the WorldView‐3 B/H ratios have higher values, because
of the lower altitude and increased acquisition time, compared to the Pléiades triplet. Hence, the B/H
ratio is 0.20 for both forward‐nadir and nadir‐backward images, whereas for forward‐backward it is
0.40. Each image is pan‐sharpened, with four spectral bands, i.e., red, green, blue, and near‐infrared,
with 16‐bit depth and zero cloud coverage. Depending on the viewing direction, the mean GSD
values vary from 0.31 m to 0.32 m. The images were delivered as eight, two, and two tiles for close‐
to‐nadir, forward, and backward, respectively. As a pre‐processing step, the tiles for each image were
Figure 2. Detail of Pléiades (first row) and WorldView-3 (second row) tri-stereo satellite images on thesame built-up area, acquired with forward-, nadir- and backward-looking.
2.1. Pléiades-1B Triplet
The Pléiades satellite system is composed of two identical satellites, Pléiades 1A/1B, which werelaunched by the French space agency (CNES) in December 2011 and December 2012, respectively.Both satellites are flying on the same sun-synchronous low-Earth orbit at an altitude of 694 km witha phase of 18◦ and an orbital period of 98.8 min. The sensors are able to collect both panchromaticand multispectral images [3].
The Pléiades-1B tri-stereo images used in the current investigations were acquired in thelate morning of 13 June 2017 within 23 s. Within this time, the satellite travelled a total distance (Base)of 167.87 km, leading to an intersection angle of rays on the ground of 12◦. The B/H ratios are of0.10, 0.11, and 0.21 for forward-nadir, nadir-backward and forward-backward image combinations.The pansharpened images composing the triplet are available in 16 bit, each of them with four spectralbands, i.e., red, green, blue, and near-infrared. Depending on the viewing angle, the mean values forthe GSD vary between 0.70 and 0.71 m.
2.2. WorldView-3 Triplet
The WorldView-3 Digital Globe’s very high-resolution optical sensor was launched in August2014. Operating at an altitude of 617 km with an orbital period of 97 min, the sensor provides 0.31 mpanchromatic resolution.
According to the metadata, the tri-stereo WorldView-3 images for our study were acquired inspring 2018, on 8 April, within 37 s. The corresponding base has a value of 279.69 km and theintersection angle of rays on the ground is 23◦. Even though both sensor platforms fly at approximatelythe same speed (~7.5 km/s), the WorldView-3 B/H ratios have higher values, because of the loweraltitude and increased acquisition time, compared to the Pléiades triplet. Hence, the B/H ratio is0.20 for both forward-nadir and nadir-backward images, whereas for forward-backward it is 0.40.Each image is pan-sharpened, with four spectral bands, i.e., red, green, blue, and near-infrared, with16-bit depth and zero cloud coverage. Depending on the viewing direction, the mean GSD valuesvary from 0.31 m to 0.32 m. The images were delivered as eight, two, and two tiles for close-to-nadir,forward, and backward, respectively. As a pre-processing step, the tiles for each image were mosaicked
Sensors 2020, 20, 2695 6 of 20
accordingly. For both image triplets, Pléiades and WorldView-3, auxiliary data including the third-orderrational function model (RFM) coefficients are provided as separate files.
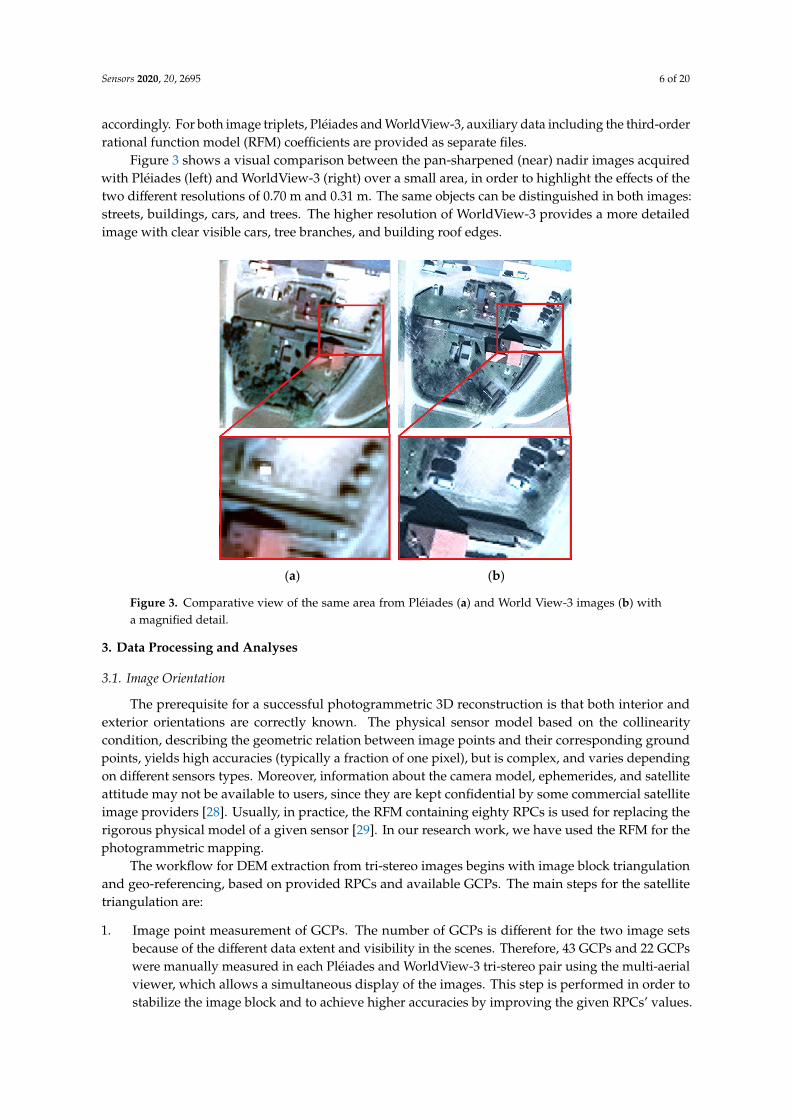
Figure 3 shows a visual comparison between the pan-sharpened (near) nadir images acquiredwith Pléiades (left) and WorldView-3 (right) over a small area, in order to highlight the effects of thetwo different resolutions of 0.70 m and 0.31 m. The same objects can be distinguished in both images:streets, buildings, cars, and trees. The higher resolution of WorldView-3 provides a more detailedimage with clear visible cars, tree branches, and building roof edges.
Sensors 2020, 20, x 6 of 20
mosaicked accordingly. For both image triplets, Pléiades and WorldView‐3, auxiliary data including
the third‐order rational function model (RFM) coefficients are provided as separate files.
Figure 3 shows a visual comparison between the pan‐sharpened (near) nadir images acquired
with Pléiades (left) and WorldView‐3 (right) over a small area, in order to highlight the effects of the
two different resolutions of 0.70 m and 0.31 m. The same objects can be distinguished in both images:
streets, buildings, cars, and trees. The higher resolution of WorldView‐3 provides a more detailed
image with clear visible cars, tree branches, and building roof edges.
(a) (b)
Figure 3. Comparative view of the same area from Pléiades (a) and World View‐3 images (b) with a
magnified detail.
3. Data Processing and Analyses
3.1. Image Orientation
The prerequisite for a successful photogrammetric 3D reconstruction is that both interior and
exterior orientations are correctly known. The physical sensor model based on the collinearity
condition, describing the geometric relation between image points and their corresponding ground
points, yields high accuracies (typically a fraction of one pixel), but is complex, and varies depending
on different sensors types. Moreover, information about the camera model, ephemerides, and
satellite attitude may not be available to users, since they are kept confidential by some commercial
satellite image providers [28]. Usually, in practice, the RFM containing eighty RPCs is used for
replacing the rigorous physical model of a given sensor [29]. In our research work, we have used the
RFM for the photogrammetric mapping.
The workflow for DEM extraction from tri‐stereo images begins with image block triangulation
and geo‐referencing, based on provided RPCs and available GCPs. The main steps for the satellite
triangulation are:
1. Image point measurement of GCPs. The number of GCPs is different for the two image sets
because of the different data extent and visibility in the scenes. Therefore, 43 GCPs and 22 GCPs
were manually measured in each Pléiades and WorldView‐3 tri‐stereo pair using the multi‐aerial
viewer, which allows a simultaneous display of the images. This step is performed in order to
stabilize the image block and to achieve higher accuracies by improving the given RPCs’ values.
2. Tie points (TPs) extraction and RPC refinement. The orientation of the satellite imagery includes
the automatic TPs extraction as well as an automatic and robust block adjustment. During the
adjustment, a maximum number of six parameters (affine transformation in image space) can be
Figure 3. Comparative view of the same area from Pléiades (a) and World View-3 images (b) witha magnified detail.
3. Data Processing and Analyses
3.1. Image Orientation
The prerequisite for a successful photogrammetric 3D reconstruction is that both interior andexterior orientations are correctly known. The physical sensor model based on the collinearitycondition, describing the geometric relation between image points and their corresponding groundpoints, yields high accuracies (typically a fraction of one pixel), but is complex, and varies dependingon different sensors types. Moreover, information about the camera model, ephemerides, and satelliteattitude may not be available to users, since they are kept confidential by some commercial satelliteimage providers [28]. Usually, in practice, the RFM containing eighty RPCs is used for replacing therigorous physical model of a given sensor [29]. In our research work, we have used the RFM for thephotogrammetric mapping.
The workflow for DEM extraction from tri-stereo images begins with image block triangulationand geo-referencing, based on provided RPCs and available GCPs. The main steps for the satellitetriangulation are:
1. Image point measurement of GCPs. The number of GCPs is different for the two image setsbecause of the different data extent and visibility in the scenes. Therefore, 43 GCPs and 22 GCPswere manually measured in each Pléiades and WorldView-3 tri-stereo pair using the multi-aerialviewer, which allows a simultaneous display of the images. This step is performed in order tostabilize the image block and to achieve higher accuracies by improving the given RPCs’ values.
Sensors 2020, 20, 2695 7 of 20
2. Tie points (TPs) extraction and RPC refinement. The orientation of the satellite imagery includesthe automatic TPs extraction as well as an automatic and robust block adjustment. During theadjustment, a maximum number of six parameters (affine transformation in image space) canbe computed: two offsets, two drift values, and two shear values (for each image). Dependingon their significance, only a subset of these corrections could be computed by the software: twoshifts (on X and Y) and a scale on Y. TPs were automatically extracted by applying FeatureBased Matching using the Förstner operator and refining them with Least Squares Matching [30].TPs with residuals (in image space) larger than one pixel are considered mistakes (gross errors)and rejected. The RPCs are refined through a subsequent adjustment procedure where thedifferences between image- and backprojected- (with the RFM) coordinates of the GCPs and TPsare minimized.
3. Geo-positioning accuracy analysis. To evaluate the accuracy of the georeferenced images, 50 CPswere used. They were manually acquired from the available orthophoto at 0.2 m GSD andtheir heights were extracted at the same locations from the LiDAR DTM (1 m resolution).For CP selection, stable details on the ground such as road marks (e.g., pedestrian crossinglines), road surface changes, corners of paved areas and corners of parking lots were selected.Considering the horizontal accuracy of the orthophoto (0.10 m) and the vertical accuracy of theDTM (0.12 m), these points are less accurate than the RTK point measurements.
For the current work, the entire photogrammetric workflow was implemented in the Inpho 8.0software from Trimble [31], designed to perform precise image block triangulation through bundle blockadjustment and 3D point cloud reconstruction using dense image matching techniques for push-broomcameras. The same processing line was followed for Pléiades and WorldView-3 tri-stereo images.
3.2. Manual Reference Measurements
After the image orientation was completed, the manual measurement of the 3D points was performed.For each object, the highest point was selected, such as points on a building’s ridge, on a car’s roof andtree crown centre (approximation of the tree top). For the 3D restitution, we manually measured thepoints monoscopically in all three oriented images (forward, nadir and backward), in a multi-aerialview mode. The mean-square error of the Z object coordinate is given by the following formula [32]:
σZ =√
2·mB·σB·ZB
, (1)
with σZ the object elevation accuracy, σB the accuracy of image measurement (1/3rd of a pixel), Z thealtitude of the satellite orbit, B the base and mB the satellite image-scale number given by the Z/c ratio,where c is the focal length of the optical system. Due to the large heights, we considered the specialcase of parallelism between object and image plane; hence a single scale number for the whole satelliteimage was used.
Taking into account these parameters, the estimated accuracy of the Z object coordinates is 1.36 mand 0.31 m for the Pléiades and WorldView-3 images, respectively. These results suggest a minimumobject height of 1 m as a reference height that guarantees a reasonable analysis. Since the smallestinvestigated cars have around 1.5 m height and buildings and single trees usually have more than 2 mheight, the estimated elevation accuracy does not significantly influence our investigations.
In a final step, the reference object heights are computed by using the measured Z-coordinates andthe elevations extracted from the LiDAR DTM (with 1 m resolution and σZ of 0.12 m) at each point’sposition. Assuming that the measured and extracted Z values have random and uncorrelated errors,according to the law of error propagation, the uncertainty associated with the manual measurements forreference object height computation is determined by the quadrature of input elevation uncertainties.
The geometric parameters, i.e., vehicle length/width, tree crown diameter and buildinglength/width, were directly measured on the rectified images in a geographic information system(GIS) environment.
Sensors 2020, 20, 2695 8 of 20
Three different classes of objects were separately investigated:
(a) Vehicles are classified into four groups depending on their length: (1) passenger and family cartype, smaller than 5 m; (2) vans having lengths between 5 and 7.5 m; (3) trucks with lengthsbetween 7.5 and 10 m; and (4) articulated lorries, trailers and multi-trailers usually having morethan 10 m. The lengths, widths and the corresponding elevations at car’s roofs of 50 vehiclesare investigated. The computed mean reference heights are 1.5, 2.5, 3.7, and 4 m for family cars,vans, trucks, and articulated lorries, respectively. Related to average object height, the associateduncertainty of the manual height measurement varies between 8% for lorries and 22% for familycars for WorldView-3 and between 34% and 68% for Pléiades.
(b) Trees are typically classified into two categories: coniferous and deciduous. Coniferous treesare cone-shaped trees, represented mainly by spruce in our case. The second category is thebroad-leaved trees with leaves that fall off on a seasonal basis, mostly represented by beech andoak. We needed to perform this classification due to the different acquisition times: one in June(leaf-on conditions) and the other one in April (leaf-off conditions). The diameter and elevationswere measured for 100 trees (50 trees for each category: deciduous and coniferous). Dependingon crown diameters, they were grouped into seven categories, beginning with trees with acrown smaller than 2.5 m, and ending at large trees with 10 m diameter. The computed meanreference heights for the seven coniferous tree classes are: 5.5, 7.8, 11.0, 14.6, 17.2, 23.4, and 28.7 m,with uncertainties between 1% and 6% from object height for WorldView-3 and between 5% and24% for Pléiades. The mean reference heights for the deciduous tree classes are: 3.1, 5.4, 8.0, 12.6,15.4, 16.2, and 18.5m, with uncertainties between 2% and 10% from object height for WorldView-3and between 7% and 44% for Pléiades.
(c) For buildings, two geometrical parameters are taken into account: length and width. Accordingto their size, built-up structures are grouped into several classes starting with very small (5 m inlength and width) to large (50 m length and 25 m width). Therefore, lengths, widths, and roof ridgeelevations were measured for 100 buildings in both Pléiades and WorldView-3 images. The meanreference height values varied from 2 m (small built-up structures) to 10–12 m (large industrialbuildings), with associated uncertainties from 2% to 16% from object height for WorldView-3 andbetween 11% and 68% for Pléiades.
While identical trees and buildings were investigated in both Pléiades and WorldView-3 images,this was not possible for vehicles, since they are moving objects. Therefore, (parked) vehicles wererandomly selected within the entire scene also using the non-overlapping parts.
3.3. Satellite Image Matching and 3D Reconstruction
Image matching algorithms were used to identify homologous objects or pixels within theoriented images. These algorithms can be divided into area-based (e.g., [33]), feature-based (e.g., [34]),and pixel-based matching (e.g., [35]). Alternatively, image-matching approaches are often classified intosparse and dense matching or into local and global matching methods. The automatic image matchingand DSM reconstruction processes were individually performed for each tri-stereo-scene (Pléiadesand WorldView-3) by using the specialized module of the Inpho software, called Match-T DSM.The DSM derivation was based on three matching strategies [30]: (a) least squares matching (LSM);(b) feature-based matching (FBM) [36]; and (c) cost-based matching (CBM). Like in most image matchingprocedures, where image pyramids were used to reduce computation time [37], in our case, the iterativeprocessing chain contains ten pyramid levels. On each pyramid level, three processes were performed:the matching of homologous image points, 3D intersection in object space and DEM modelling. For thefirst seven pyramids, FBM was used, and the last three image pyramid levels were processed with CBM.CBM is a pixel-by-pixel matching technique similar to the semi-global matching algorithm [35,38].The CBM strategy within the Match-T DSM module uses a search-path in a so-called 3D-cost-cubefor finding the corresponding pixels in images. The cost functions (e.g., correlation coefficient) are
Sensors 2020, 20, 2695 9 of 20
used to find the minimum cost path, and each direction represents an X–Y movement in the imageto match. Finding the pixel with the lowest cost generates a lowest-cost 3D model–surface model [30].For each image pixel, the 3D object point coordinates were calculated by applying forward intersections,finally resulting in dense photogrammetric point clouds for the entire study area.
In the last step, high resolution DSMs were generated by using the robust moving planesinterpolation method. For each grid node all points within a circular neighborhood are used to robustlyestimate a best fitting tilted plane (minimizing the vertical distances); points classified as outliers arenot considered in the plane fitting procedure. This step was performed with the scientific softwareOPALS (Orientation and Processing of Airborne Laser Scanning data) [39].
4. Results and Discussion
4.1. Block Triangulation
During the satellite triangulation of the tri-stereo scene, TPs were automatically extracted in eachPléiades image. They were homogenously distributed within the forward, nadir and backward images,with standard deviations of the adjusted coordinates for elevations ranging from 1.49 m (2.1 GSD) to3.49 m (5.0 GSD) (Table 2). The standard deviations of the TP elevation obtained for theWorldView-3scenes are clearly better relative to the GSD, with a maximum value of 0.74 m (2.5 GSD). The standarddeviation of the satellite image block-triangulation was 0.54 pixels for Pléiades images and 0.46 pixelsfor WorldView-3.
Table 2. Standard deviation of adjusted tie points (TPs) coordinates.
Sensor Type No. ofTPs/Image
Standard Deviation (m/pixels)
Latitude(Along Track)
Longitude(Across Track) Elevation
min max min max min max
Pléiades 561/552/582 0.16/0.23 0.33/0.47 0.14/0.20 0.27/0.38 1.49/2.12 3.49/4.98WorldView-3 556/585/554 0.09/0.30 0.19/0.63 0.08/0.26 0.20/0.66 0.38/1.26 0.74/2.46
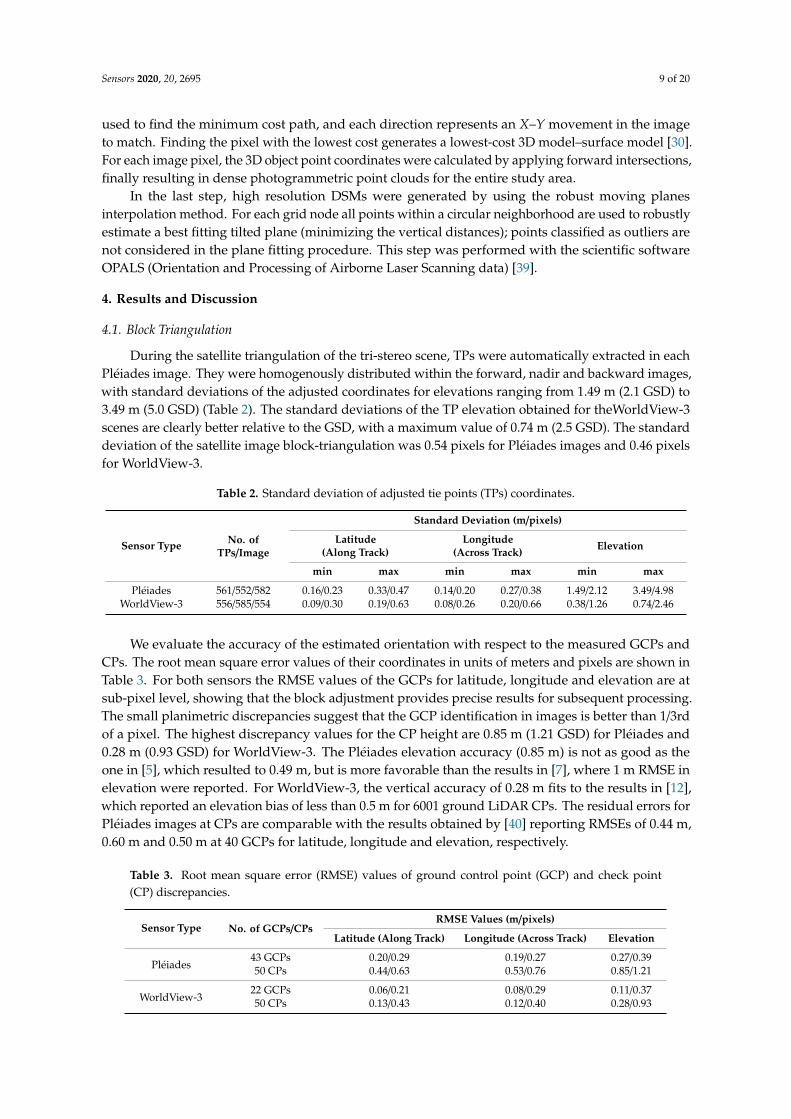
We evaluate the accuracy of the estimated orientation with respect to the measured GCPs andCPs. The root mean square error values of their coordinates in units of meters and pixels are shown inTable 3. For both sensors the RMSE values of the GCPs for latitude, longitude and elevation are atsub-pixel level, showing that the block adjustment provides precise results for subsequent processing.The small planimetric discrepancies suggest that the GCP identification in images is better than 1/3rdof a pixel. The highest discrepancy values for the CP height are 0.85 m (1.21 GSD) for Pléiades and0.28 m (0.93 GSD) for WorldView-3. The Pléiades elevation accuracy (0.85 m) is not as good as theone in [5], which resulted to 0.49 m, but is more favorable than the results in [7], where 1 m RMSE inelevation were reported. For WorldView-3, the vertical accuracy of 0.28 m fits to the results in [12],which reported an elevation bias of less than 0.5 m for 6001 ground LiDAR CPs. The residual errors forPléiades images at CPs are comparable with the results obtained by [40] reporting RMSEs of 0.44 m,0.60 m and 0.50 m at 40 GCPs for latitude, longitude and elevation, respectively.
Table 3. Root mean square error (RMSE) values of ground control point (GCP) and check point(CP) discrepancies.
Sensor Type No. of GCPs/CPsRMSE Values (m/pixels)
Latitude (Along Track) Longitude (Across Track) Elevation
Pléiades43 GCPs 0.20/0.29 0.19/0.27 0.27/0.3950 CPs 0.44/0.63 0.53/0.76 0.85/1.21
WorldView-322 GCPs 0.06/0.21 0.08/0.29 0.11/0.3750 CPs 0.13/0.43 0.12/0.40 0.28/0.93
Sensors 2020, 20, 2695 10 of 20
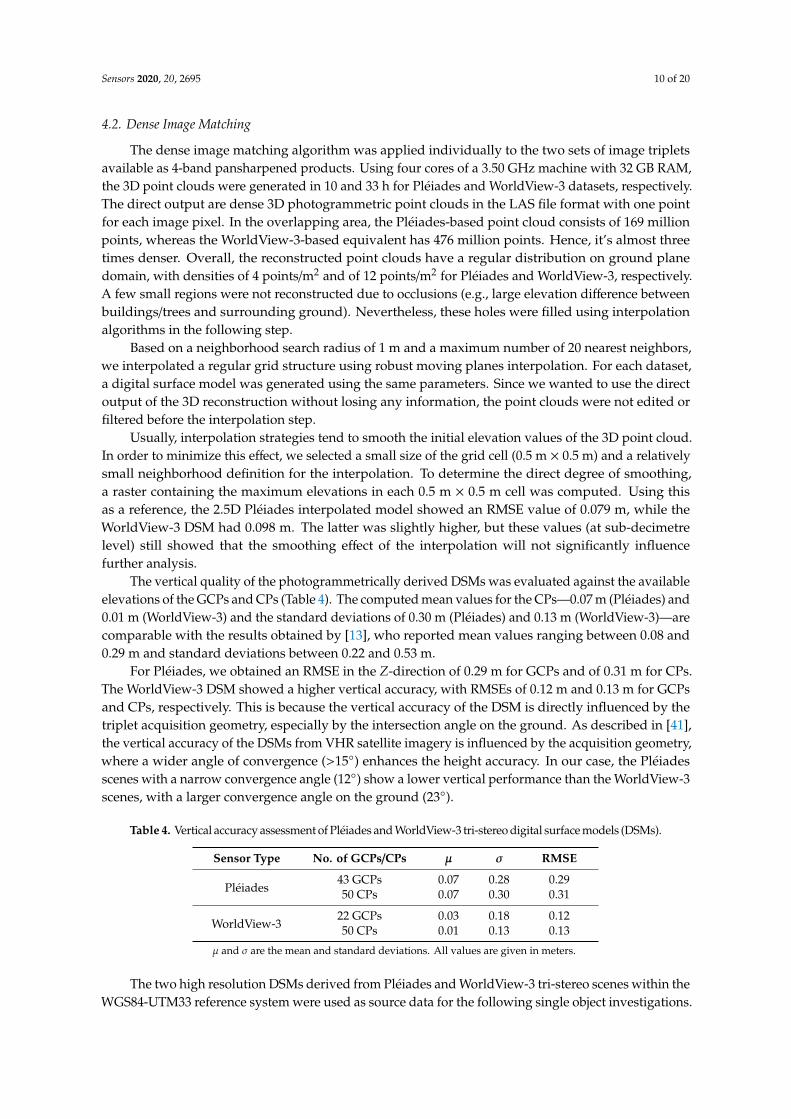
4.2. Dense Image Matching
The dense image matching algorithm was applied individually to the two sets of image tripletsavailable as 4-band pansharpened products. Using four cores of a 3.50 GHz machine with 32 GB RAM,the 3D point clouds were generated in 10 and 33 h for Pléiades and WorldView-3 datasets, respectively.The direct output are dense 3D photogrammetric point clouds in the LAS file format with one pointfor each image pixel. In the overlapping area, the Pléiades-based point cloud consists of 169 millionpoints, whereas the WorldView-3-based equivalent has 476 million points. Hence, it’s almost threetimes denser. Overall, the reconstructed point clouds have a regular distribution on ground planedomain, with densities of 4 points/m2 and of 12 points/m2 for Pléiades and WorldView-3, respectively.A few small regions were not reconstructed due to occlusions (e.g., large elevation difference betweenbuildings/trees and surrounding ground). Nevertheless, these holes were filled using interpolationalgorithms in the following step.
Based on a neighborhood search radius of 1 m and a maximum number of 20 nearest neighbors,we interpolated a regular grid structure using robust moving planes interpolation. For each dataset,a digital surface model was generated using the same parameters. Since we wanted to use the directoutput of the 3D reconstruction without losing any information, the point clouds were not edited orfiltered before the interpolation step.
Usually, interpolation strategies tend to smooth the initial elevation values of the 3D point cloud.In order to minimize this effect, we selected a small size of the grid cell (0.5 m × 0.5 m) and a relativelysmall neighborhood definition for the interpolation. To determine the direct degree of smoothing,a raster containing the maximum elevations in each 0.5 m × 0.5 m cell was computed. Using thisas a reference, the 2.5D Pléiades interpolated model showed an RMSE value of 0.079 m, while theWorldView-3 DSM had 0.098 m. The latter was slightly higher, but these values (at sub-decimetrelevel) still showed that the smoothing effect of the interpolation will not significantly influencefurther analysis.
The vertical quality of the photogrammetrically derived DSMs was evaluated against the availableelevations of the GCPs and CPs (Table 4). The computed mean values for the CPs—0.07 m (Pléiades) and0.01 m (WorldView-3) and the standard deviations of 0.30 m (Pléiades) and 0.13 m (WorldView-3)—arecomparable with the results obtained by [13], who reported mean values ranging between 0.08 and0.29 m and standard deviations between 0.22 and 0.53 m.
For Pléiades, we obtained an RMSE in the Z-direction of 0.29 m for GCPs and of 0.31 m for CPs.The WorldView-3 DSM showed a higher vertical accuracy, with RMSEs of 0.12 m and 0.13 m for GCPsand CPs, respectively. This is because the vertical accuracy of the DSM is directly influenced by thetriplet acquisition geometry, especially by the intersection angle on the ground. As described in [41],the vertical accuracy of the DSMs from VHR satellite imagery is influenced by the acquisition geometry,where a wider angle of convergence (>15◦) enhances the height accuracy. In our case, the Pléiadesscenes with a narrow convergence angle (12◦) show a lower vertical performance than the WorldView-3scenes, with a larger convergence angle on the ground (23◦).
Table 4. Vertical accuracy assessment of Pléiades and WorldView-3 tri-stereo digital surface models (DSMs).
Sensor Type No. of GCPs/CPs µ σ RMSE
Pléiades43 GCPs 0.07 0.28 0.2950 CPs 0.07 0.30 0.31
WorldView-322 GCPs 0.03 0.18 0.1250 CPs 0.01 0.13 0.13
µ and σ are the mean and standard deviations. All values are given in meters.
The two high resolution DSMs derived from Pléiades and WorldView-3 tri-stereo scenes within theWGS84-UTM33 reference system were used as source data for the following single object investigations.
Sensors 2020, 20, 2695 11 of 20
4.3. Object Height Differences
For a clear height estimation, in our work we considered only single objects, located in free,open and smooth areas, without any other entities in their close surroundings. Assuming that inthe free, open areas, the DSM coincide with DTM elevations, we inspected the vertical quality of thephotogrammetric derived surface models by computing the vertical offsets from the reference LiDARDTM (1 m resolution and σZ = 0.12 m). The results showed a good correspondence of the DSMs withthe reference DTM, featuring a RMSE of 0.32 m for Pléiades and of 0.20 m for WorldView-3. When itcomes to individual objects, we sometimes observed a constant offset, but it was always below 0.30 m.Therefore, it did not significantly impact our height investigations.
The reconstructed individual object height was extracted from the interpolated surface models.Heights of buildings, vehicles and trees were computed by subtracting the DTM elevations from theelevations of the highest object points (located on roof ridges, on car roofs, and on treetops) at the same2D location.
We consider the reference height (H) as being the real object height, which was computed bysubtracting the DTM elevation from the manual measurements (Section 3.2) at the same position.
H = ZM − ZDTM (m) (2)
h = ZDSM − ZDTM (m), (3)
with H the reference object height, h the estimated object height, ZM the manual elevation measurements,ZDTM the elevation of the ground surface and ZDSM the elevation of the reconstructed DSM.
In Equations (2) and (3) the ZDTM elevation values are identical, since for computing the referenceand the estimated heights, the same ground elevation at the same 2D position was considered. Based onthe defined equations, we obtained a reference height (H) and two estimated heights for each individualobject (from Pléiades and WorldView-3 DSMs). These values will be employed in further analysis.
4.4. Height Estimation of Single Objects
Within this investigation, we wanted to estimate the Pléiades and WorldView-3 DSMs heights atsingle objects as a function of object type and size. For this purpose, three object types were analyzed:non-moving vehicles, trees, and buildings. The main parameters taken into account were vehiclelength/width, tree crown diameter, and building length/width.
For each single object, the estimated heights were compared with the monoscopicreference measurements based on a ratio measure. The percentage value derived by the followingequation describes how much of the reference height was reconstructed:
p (%) = h/H × 100, (4)
with H the reference height, h the estimated height, and p the reconstruction percentage.
4.4.1. Vehicles
By a visual inspection of the reconstructed Pléiades-based 3D point cloud, it was observable thatpoints corresponding to small vehicles (vehicles with lengths smaller than 5 m) were not elevatedagainst their surroundings. Larger vehicles were reconstructed in height, but not entirely (Figure 4).

Sensors 2020, 20, 2695 12 of 20Sensors 2020, 20, x 12 of 20
Figure 4. Height estimation for a truck. (a) Pléiades satellite image detail with profile location (left)
and reconstructed DSM Z color‐coded (right); (b) WorldView‐3 satellite image detail with profile
location (left) and reconstructed DSM Z color‐coded (right); (c) Pléiades‐; and (d) WV3‐based vehicle
profiles of 0.5 m width each from the matched point cloud; the red horizontal line is the corresponding
measured reference height.
Specifically, Figure 4 represents a truck with a length of ~10 m and a real height of 3.5 m that is
visible in both Pléiades (a) and WorldView‐3 images (b). On the left‐hand side are the magnified
satellite image details of the vehicle and on the right‐hand side are the corresponding reconstructed
height color‐coded DSM. From the DSMs and the cross profiles (c), it is clearly visible that in contrast
to Pléiades, where there is only ~1m elevation change, the WV3‐based profile reconstructs the vehicle
height up to 2.9 m, which represents ~83% of the real height.
Using Equation (4), the height percentages of 50 measured vehicles were computed for both
cases: Pléiades and WorldView‐3 sensors. As mentioned in Section 3.2, vehicles were classified into
four different groups depending on their lengths, starting with small family cars, of approximately
5 m, followed by vans, trucks, and finally by large articulated lorries with more than 10 m length. For
each group, containing between 10 and 13 vehicles, the mean value of the reconstruction height
percentage and the standard deviation were determined. They are shown in Figure 5a for both
Pléiades (blue) and WorldView‐3 (yellow) data. By increasing length, the height percentage also
increases, reaching up to 60% (Pléiades) and 92% (WorldView‐3). In the case of the Pléiades imagery,
small vehicles (<7 pixels length in image) do not show any height information, while for family cars,
vans, and trucks the reconstruction height percentage is less than 30%. It exceeds 50% only for large
vehicles (lengths >10 m, 14 pixels in the image). On the other hand, in WorldView‐3 DSMs, vehicles
have a good height reconstruction (reaching over 90% for lengths >10 m, 33 pixels in image). An
exception are family cars (~16 pixels length), which have a percentage of less than 40%. The standard
deviations of the estimated heights are notably smaller than the overall trend and they become
smaller with increasing vehicle length.
A similar analysis was conducted by using vehicle width as the main parameter for vehicle
grouping (Figure 5b). Because small family cars and vans have similar widths (~2 m), they form a
single class, followed by trucks (2 to 2.5 m widths), and articulated lorries (2.5 to 3 m widths). Based
on the WorldView‐3 DSMs, vehicles with up to 2 m widths have ~41% of their real height
reconstructed. This value is higher when compared with the percentage of the first length‐class (37%)
because it contains both family cars and vans, leading to an increased mean height percentage and
standard deviation. The mean height percentages reach 59% (Pléiades) and 92% (WorldView‐3) for
the very large vehicles. The increased values of standard deviations suggest a higher variation of the
Figure 4. Height estimation for a truck. (a) Pléiades satellite image detail with profile location (left) andreconstructed DSM Z color-coded (right); (b) WorldView-3 satellite image detail with profile location(left) and reconstructed DSM Z color-coded (right); (c) Pléiades-; and (d) WV3-based vehicle profiles of0.5 m width each from the matched point cloud; the red horizontal line is the corresponding measuredreference height.
Specifically, Figure 4 represents a truck with a length of ~10 m and a real height of 3.5 m thatis visible in both Pléiades (a) and WorldView-3 images (b). On the left-hand side are the magnifiedsatellite image details of the vehicle and on the right-hand side are the corresponding reconstructedheight color-coded DSM. From the DSMs and the cross profiles (c), it is clearly visible that in contrastto Pléiades, where there is only ~1 m elevation change, the WV3-based profile reconstructs the vehicleheight up to 2.9 m, which represents ~83% of the real height.
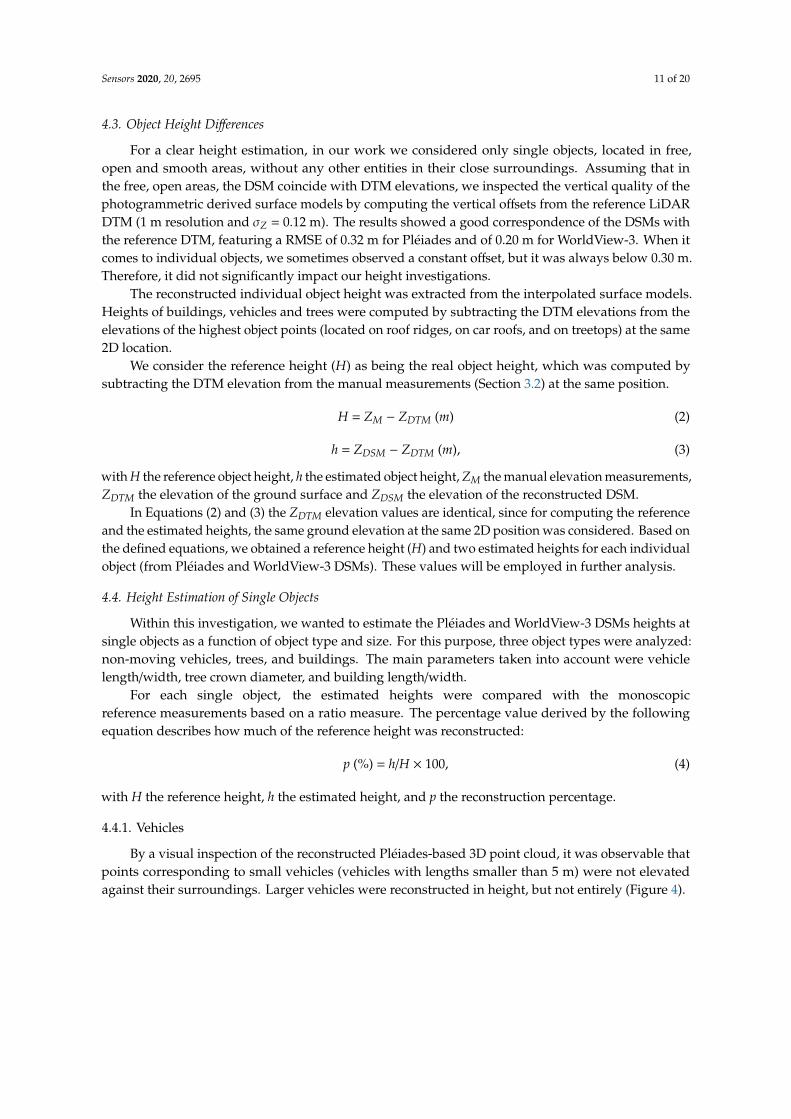
Using Equation (4), the height percentages of 50 measured vehicles were computed for both cases:Pléiades and WorldView-3 sensors. As mentioned in Section 3.2, vehicles were classified into fourdifferent groups depending on their lengths, starting with small family cars, of approximately 5 m,followed by vans, trucks, and finally by large articulated lorries with more than 10 m length. For eachgroup, containing between 10 and 13 vehicles, the mean value of the reconstruction height percentageand the standard deviation were determined. They are shown in Figure 5a for both Pléiades (blue) andWorldView-3 (yellow) data. By increasing length, the height percentage also increases, reaching up to60% (Pléiades) and 92% (WorldView-3). In the case of the Pléiades imagery, small vehicles (<7 pixelslength in image) do not show any height information, while for family cars, vans, and trucks thereconstruction height percentage is less than 30%. It exceeds 50% only for large vehicles (lengths >10 m,14 pixels in the image). On the other hand, in WorldView-3 DSMs, vehicles have a good heightreconstruction (reaching over 90% for lengths >10 m, 33 pixels in image). An exception are familycars (~16 pixels length), which have a percentage of less than 40%. The standard deviations of theestimated heights are notably smaller than the overall trend and they become smaller with increasingvehicle length.
A similar analysis was conducted by using vehicle width as the main parameter for vehiclegrouping (Figure 5b). Because small family cars and vans have similar widths (~2 m), they form asingle class, followed by trucks (2 to 2.5 m widths), and articulated lorries (2.5 to 3 m widths). Based onthe WorldView-3 DSMs, vehicles with up to 2 m widths have ~41% of their real height reconstructed.This value is higher when compared with the percentage of the first length-class (37%) because itcontains both family cars and vans, leading to an increased mean height percentage and standarddeviation. The mean height percentages reach 59% (Pléiades) and 92% (WorldView-3) for the very large
Sensors 2020, 20, 2695 13 of 20
vehicles. The increased values of standard deviations suggest a higher variation of the reconstructionheight percentages within the width-classes considered. Therefore, the length parameter is moresuitable for the description of the vehicle’s height estimation.
Sensors 2020, 20, x 13 of 20
reconstruction height percentages within the width‐classes considered. Therefore, the length
parameter is more suitable for the description of the vehicle’s height estimation.
Figure 5. Interval‐based percentage and standard deviation for height estimation of vehicles
depending on (a) lengths and (b) widths.
4.4.2. Trees
Trees were investigated in two separate classes: deciduous trees, located especially on roadsides,
parks and cities, and coniferous trees, found in forested areas and forest patches. Only single, isolated
trees, not close to buildings or any other objects, were taken into consideration. In this case, the visible
crown diameter was used as the geometric parameter. One hundred trees were investigated, and the
same formula for height percentage computation, Equation (4), was applied. Based on diameter, they
were grouped into seven different categories, each containing approximately 12 trees. The mean
reconstruction percentages gradually increase with crown diameter and the standard deviations
decrease (Figure 6). For WorldView‐3, the heights of coniferous trees with crown diameters <2.5 m (8
pixels in image space) are reconstructed less than 50%, whereas trees with crown diameters larger
than 5 m (16 pixels in image space) are over 95%. Generally, heights of coniferous trees are better
estimated from WorldView‐3 than from the Pléiades DSMs, where trees with diameters >7.5 m (11
pixels) barely reach 75% height reconstruction. For deciduous trees (Figure 6b) it can be observed
that the situation is reversed: they get better height information from Pléiades DSM, than from
WorldView‐3 DSM. This is mainly because of the different acquisition times, June for Pléiades and
April for WorldView‐3, indicating leaf‐on and leaf‐off conditions which clearly influence the
appearance and texture of the trees in the images. For the deciduous trees, only the stems and
branches are visible in the WorldView‐3 images, resulting in a poor dense image matching quality.
For trees with a crown diameter larger than 9 m, heights of just over 50% of the tree values are
reconstructed.
When analyzing the two tree types only from the Pléiades images (Figure 6), we could see that
there is a slightly better height reconstruction for the very small and large deciduous trees, compared
with the coniferous. The small deciduous trees in the first group (with crown diameters smaller than
2.5 m) have 26% of their real height reconstructed, whereas the small coniferous trees in the first
group have only 21%. The same is true for the last group, where large deciduous trees (with crown
diameters bigger than 8.75 m) have percentages close to 80%, whereas for coniferous they reach only
75%. On the other hand, for the coniferous trees of medium sizes (with crown diameters between 2.5
and 7.5 m) we obtained better height reconstruction percentages than for the deciduous.
Figure 5. Interval-based percentage and standard deviation for height estimation of vehicles dependingon (a) lengths and (b) widths.
4.4.2. Trees
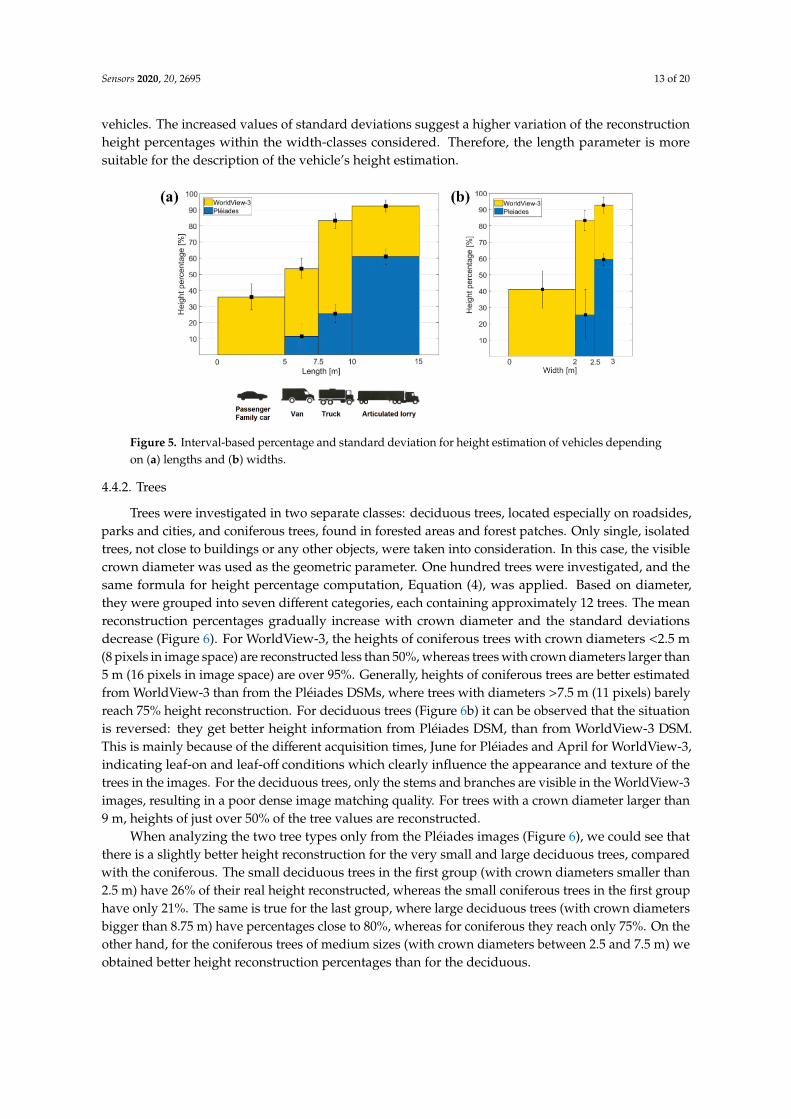
Trees were investigated in two separate classes: deciduous trees, located especially on roadsides,parks and cities, and coniferous trees, found in forested areas and forest patches. Only single, isolatedtrees, not close to buildings or any other objects, were taken into consideration. In this case, the visiblecrown diameter was used as the geometric parameter. One hundred trees were investigated, and thesame formula for height percentage computation, Equation (4), was applied. Based on diameter,they were grouped into seven different categories, each containing approximately 12 trees. The meanreconstruction percentages gradually increase with crown diameter and the standard deviationsdecrease (Figure 6). For WorldView-3, the heights of coniferous trees with crown diameters <2.5 m(8 pixels in image space) are reconstructed less than 50%, whereas trees with crown diameters larger than5 m (16 pixels in image space) are over 95%. Generally, heights of coniferous trees are better estimatedfrom WorldView-3 than from the Pléiades DSMs, where trees with diameters >7.5 m (11 pixels) barelyreach 75% height reconstruction. For deciduous trees (Figure 6b) it can be observed that the situationis reversed: they get better height information from Pléiades DSM, than from WorldView-3 DSM.This is mainly because of the different acquisition times, June for Pléiades and April for WorldView-3,indicating leaf-on and leaf-off conditions which clearly influence the appearance and texture of thetrees in the images. For the deciduous trees, only the stems and branches are visible in the WorldView-3images, resulting in a poor dense image matching quality. For trees with a crown diameter larger than9 m, heights of just over 50% of the tree values are reconstructed.
When analyzing the two tree types only from the Pléiades images (Figure 6), we could see thatthere is a slightly better height reconstruction for the very small and large deciduous trees, comparedwith the coniferous. The small deciduous trees in the first group (with crown diameters smaller than2.5 m) have 26% of their real height reconstructed, whereas the small coniferous trees in the first grouphave only 21%. The same is true for the last group, where large deciduous trees (with crown diametersbigger than 8.75 m) have percentages close to 80%, whereas for coniferous they reach only 75%. On theother hand, for the coniferous trees of medium sizes (with crown diameters between 2.5 and 7.5 m) weobtained better height reconstruction percentages than for the deciduous.
Sensors 2020, 20, 2695 14 of 20Sensors 2020, 20, x 14 of 20
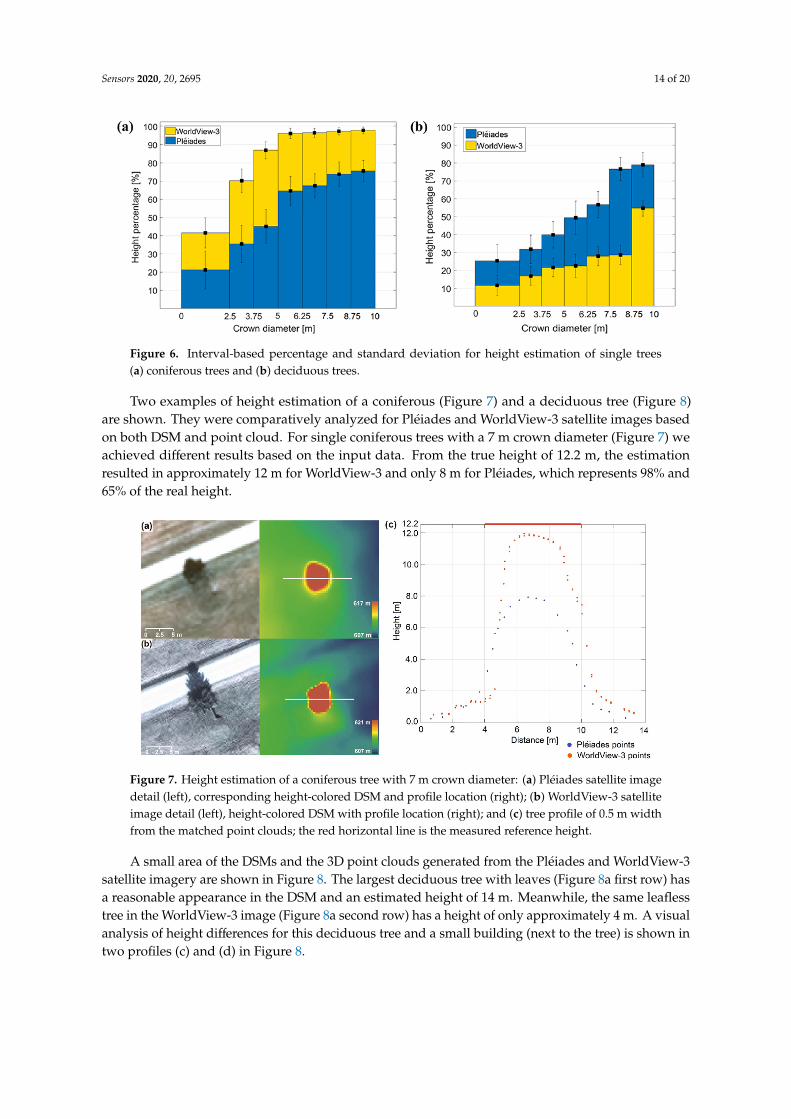
Figure 6. Interval‐based percentage and standard deviation for height estimation of single trees (a)
coniferous trees and (b) deciduous trees.
Two examples of height estimation of a coniferous (Figure 7) and a deciduous tree (Figure 8) are
shown. They were comparatively analyzed for Pléiades and WorldView‐3 satellite images based on
both DSM and point cloud. For single coniferous trees with a 7 m crown diameter (Figure 7) we
achieved different results based on the input data. From the true height of 12.2 m, the estimation
resulted in approximately 12 m for WorldView‐3 and only 8 m for Pléiades, which represents 98%
and 65% of the real height.
Figure 7. Height estimation of a coniferous tree with 7 m crown diameter: (a) Pléiades satellite image
detail (left), corresponding height‐colored DSM and profile location (right); (b) WorldView‐3 satellite
image detail (left), height‐colored DSM with profile location (right); and (c) tree profile of 0.5 m width
from the matched point clouds; the red horizontal line is the measured reference height.
A small area of the DSMs and the 3D point clouds generated from the Pléiades and WorldView‐
3 satellite imagery are shown in Figure 8. The largest deciduous tree with leaves (Figure 8a first row)
has a reasonable appearance in the DSM and an estimated height of 14 m. Meanwhile, the same
leafless tree in the WorldView‐3 image (Figure 8a second row) has a height of only approximately
4 m. A visual analysis of height differences for this deciduous tree and a small building (next to the
tree) is shown in two profiles (c) and (d) in Figure 8.
Figure 6. Interval-based percentage and standard deviation for height estimation of single trees(a) coniferous trees and (b) deciduous trees.
Two examples of height estimation of a coniferous (Figure 7) and a deciduous tree (Figure 8)are shown. They were comparatively analyzed for Pléiades and WorldView-3 satellite images basedon both DSM and point cloud. For single coniferous trees with a 7 m crown diameter (Figure 7) weachieved different results based on the input data. From the true height of 12.2 m, the estimationresulted in approximately 12 m for WorldView-3 and only 8 m for Pléiades, which represents 98% and65% of the real height.
Sensors 2020, 20, x 14 of 20
Figure 6. Interval‐based percentage and standard deviation for height estimation of single trees (a)
coniferous trees and (b) deciduous trees.
Two examples of height estimation of a coniferous (Figure 7) and a deciduous tree (Figure 8) are
shown. They were comparatively analyzed for Pléiades and WorldView‐3 satellite images based on
both DSM and point cloud. For single coniferous trees with a 7 m crown diameter (Figure 7) we
achieved different results based on the input data. From the true height of 12.2 m, the estimation
resulted in approximately 12 m for WorldView‐3 and only 8 m for Pléiades, which represents 98%
and 65% of the real height.
Figure 7. Height estimation of a coniferous tree with 7 m crown diameter: (a) Pléiades satellite image
detail (left), corresponding height‐colored DSM and profile location (right); (b) WorldView‐3 satellite
image detail (left), height‐colored DSM with profile location (right); and (c) tree profile of 0.5 m width
from the matched point clouds; the red horizontal line is the measured reference height.
A small area of the DSMs and the 3D point clouds generated from the Pléiades and WorldView‐
3 satellite imagery are shown in Figure 8. The largest deciduous tree with leaves (Figure 8a first row)
has a reasonable appearance in the DSM and an estimated height of 14 m. Meanwhile, the same
leafless tree in the WorldView‐3 image (Figure 8a second row) has a height of only approximately
4 m. A visual analysis of height differences for this deciduous tree and a small building (next to the
tree) is shown in two profiles (c) and (d) in Figure 8.
Figure 7. Height estimation of a coniferous tree with 7 m crown diameter: (a) Pléiades satellite imagedetail (left), corresponding height-colored DSM and profile location (right); (b) WorldView-3 satelliteimage detail (left), height-colored DSM with profile location (right); and (c) tree profile of 0.5 m widthfrom the matched point clouds; the red horizontal line is the measured reference height.
A small area of the DSMs and the 3D point clouds generated from the Pléiades and WorldView-3satellite imagery are shown in Figure 8. The largest deciduous tree with leaves (Figure 8a first row) hasa reasonable appearance in the DSM and an estimated height of 14 m. Meanwhile, the same leaflesstree in the WorldView-3 image (Figure 8a second row) has a height of only approximately 4 m. A visualanalysis of height differences for this deciduous tree and a small building (next to the tree) is shown intwo profiles (c) and (d) in Figure 8.
Sensors 2020, 20, 2695 15 of 20Sensors 2020, 20, x 15 of 20
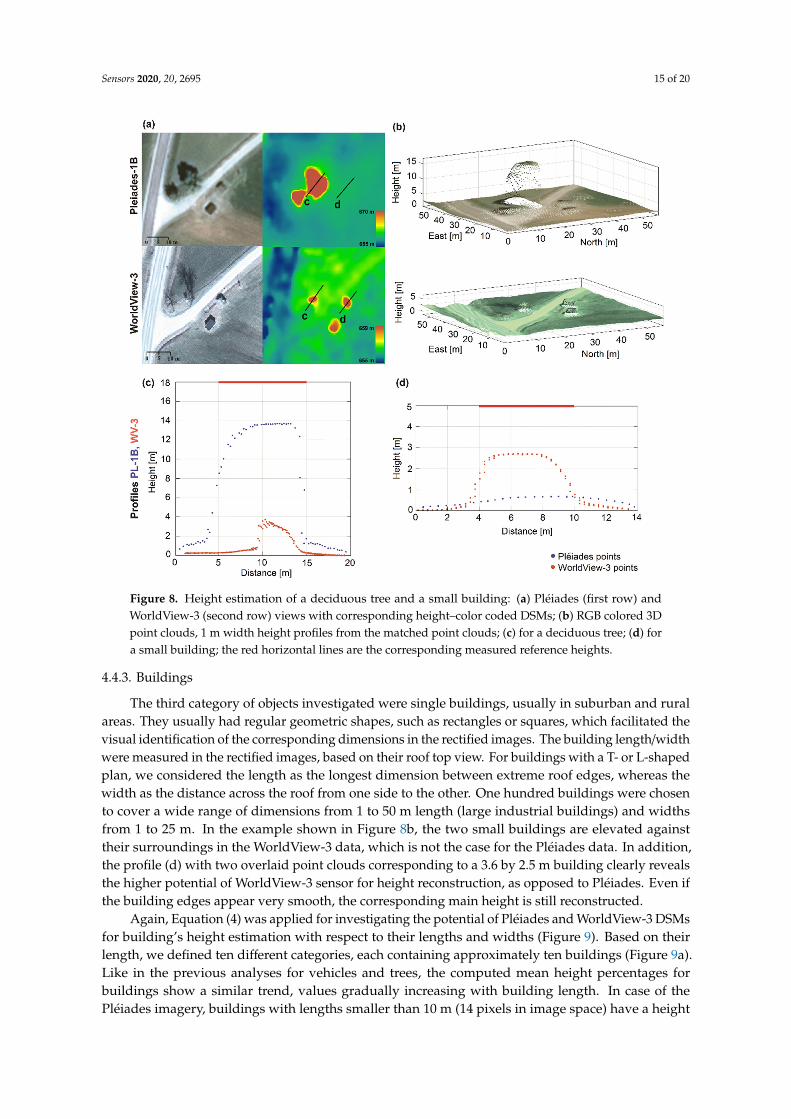
Figure 8. Height estimation of a deciduous tree and a small building: (a) Pléiades (first row) and
WorldView‐3 (second row) views with corresponding height–color coded DSMs; (b) RGB colored 3D
point clouds, 1 m width height profiles from the matched point clouds; (c) for a deciduous tree; (d)
for a small building; the red horizontal lines are the corresponding measured reference heights.
4.4.3. Buildings
The third category of objects investigated were single buildings, usually in suburban and rural
areas. They usually had regular geometric shapes, such as rectangles or squares, which facilitated the
visual identification of the corresponding dimensions in the rectified images. The building
length/width were measured in the rectified images, based on their roof top view. For buildings with
a T‐ or L‐shaped plan, we considered the length as the longest dimension between extreme roof
edges, whereas the width as the distance across the roof from one side to the other. One hundred
buildings were chosen to cover a wide range of dimensions from 1 to 50 m length (large industrial
buildings) and widths from 1 to 25 m. In the example shown in Figure 8b, the two small buildings
are elevated against their surroundings in the WorldView‐3 data, which is not the case for the
Pléiades data. In addition, the profile (d) with two overlaid point clouds corresponding to a 3.6 by
2.5 m building clearly reveals the higher potential of WorldView‐3 sensor for height reconstruction,
as opposed to Pléiades. Even if the building edges appear very smooth, the corresponding main
height is still reconstructed.
Again, Equation (4) was applied for investigating the potential of Pléiades and WorldView‐3
DSMs for building’s height estimation with respect to their lengths and widths (Figure 9). Based on
their length, we defined ten different categories, each containing approximately ten buildings
(Figure 9a). Like in the previous analyses for vehicles and trees, the computed mean height
percentages for buildings show a similar trend, values gradually increasing with building length. In
case of the Pléiades imagery, buildings with lengths smaller than 10 m (14 pixels in image space) have
Figure 8. Height estimation of a deciduous tree and a small building: (a) Pléiades (first row) andWorldView-3 (second row) views with corresponding height–color coded DSMs; (b) RGB colored 3Dpoint clouds, 1 m width height profiles from the matched point clouds; (c) for a deciduous tree; (d) fora small building; the red horizontal lines are the corresponding measured reference heights.
4.4.3. Buildings
The third category of objects investigated were single buildings, usually in suburban and ruralareas. They usually had regular geometric shapes, such as rectangles or squares, which facilitated thevisual identification of the corresponding dimensions in the rectified images. The building length/widthwere measured in the rectified images, based on their roof top view. For buildings with a T- or L-shapedplan, we considered the length as the longest dimension between extreme roof edges, whereas thewidth as the distance across the roof from one side to the other. One hundred buildings were chosento cover a wide range of dimensions from 1 to 50 m length (large industrial buildings) and widthsfrom 1 to 25 m. In the example shown in Figure 8b, the two small buildings are elevated againsttheir surroundings in the WorldView-3 data, which is not the case for the Pléiades data. In addition,the profile (d) with two overlaid point clouds corresponding to a 3.6 by 2.5 m building clearly revealsthe higher potential of WorldView-3 sensor for height reconstruction, as opposed to Pléiades. Even ifthe building edges appear very smooth, the corresponding main height is still reconstructed.
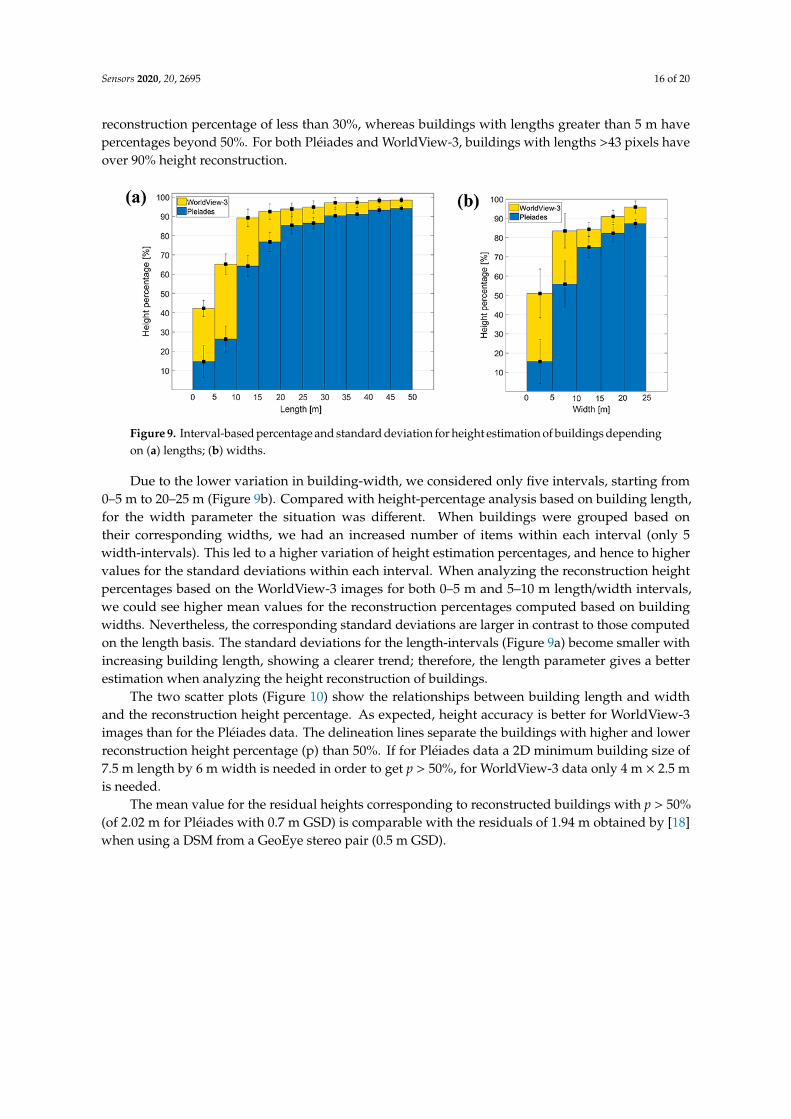
Again, Equation (4) was applied for investigating the potential of Pléiades and WorldView-3 DSMsfor building’s height estimation with respect to their lengths and widths (Figure 9). Based on theirlength, we defined ten different categories, each containing approximately ten buildings (Figure 9a).Like in the previous analyses for vehicles and trees, the computed mean height percentages forbuildings show a similar trend, values gradually increasing with building length. In case of thePléiades imagery, buildings with lengths smaller than 10 m (14 pixels in image space) have a height
Sensors 2020, 20, 2695 16 of 20
reconstruction percentage of less than 30%, whereas buildings with lengths greater than 5 m havepercentages beyond 50%. For both Pléiades and WorldView-3, buildings with lengths >43 pixels haveover 90% height reconstruction.
Sensors 2020, 20, x 16 of 20
a height reconstruction percentage of less than 30%, whereas buildings with lengths greater than 5 m
have percentages beyond 50%. For both Pléiades and WorldView‐3, buildings with lengths >43 pixels
have over 90% height reconstruction.
Figure 9. Interval‐based percentage and standard deviation for height estimation of buildings
depending on (a) lengths; (b) widths.
Due to the lower variation in building‐width, we considered only five intervals, starting from 0–5 m
to 20–25 m (Figure 9b). Compared with height‐percentage analysis based on building length, for the
width parameter the situation was different. When buildings were grouped based on their
corresponding widths, we had an increased number of items within each interval (only 5 width‐
intervals). This led to a higher variation of height estimation percentages, and hence to higher values
for the standard deviations within each interval. When analyzing the reconstruction height
percentages based on the WorldView‐3 images for both 0–5 m and 5–10 m length/width intervals, we
could see higher mean values for the reconstruction percentages computed based on building widths.
Nevertheless, the corresponding standard deviations are larger in contrast to those computed on the
length basis. The standard deviations for the length‐intervals (Figure 9a) become smaller with
increasing building length, showing a clearer trend; therefore, the length parameter gives a better
estimation when analyzing the height reconstruction of buildings.
The two scatter plots (Figure 10) show the relationships between building length and width and
the reconstruction height percentage. As expected, height accuracy is better for WorldView‐3 images
than for the Pléiades data. The delineation lines separate the buildings with higher and lower
reconstruction height percentage (p) than 50%. If for Pléiades data a 2D minimum building size of
7.5 m length by 6 m width is needed in order to get p > 50%, for WorldView‐3 data only 4 m × 2.5 m
is needed.
The mean value for the residual heights corresponding to reconstructed buildings with p > 50%
(of 2.02 m for Pléiades with 0.7 m GSD) is comparable with the residuals of 1.94 m obtained by [18]
when using a DSM from a GeoEye stereo pair (0.5 m GSD).
Figure 9. Interval-based percentage and standard deviation for height estimation of buildings dependingon (a) lengths; (b) widths.
Due to the lower variation in building-width, we considered only five intervals, starting from0–5 m to 20–25 m (Figure 9b). Compared with height-percentage analysis based on building length,for the width parameter the situation was different. When buildings were grouped based ontheir corresponding widths, we had an increased number of items within each interval (only 5width-intervals). This led to a higher variation of height estimation percentages, and hence to highervalues for the standard deviations within each interval. When analyzing the reconstruction heightpercentages based on the WorldView-3 images for both 0–5 m and 5–10 m length/width intervals,we could see higher mean values for the reconstruction percentages computed based on buildingwidths. Nevertheless, the corresponding standard deviations are larger in contrast to those computedon the length basis. The standard deviations for the length-intervals (Figure 9a) become smaller withincreasing building length, showing a clearer trend; therefore, the length parameter gives a betterestimation when analyzing the height reconstruction of buildings.
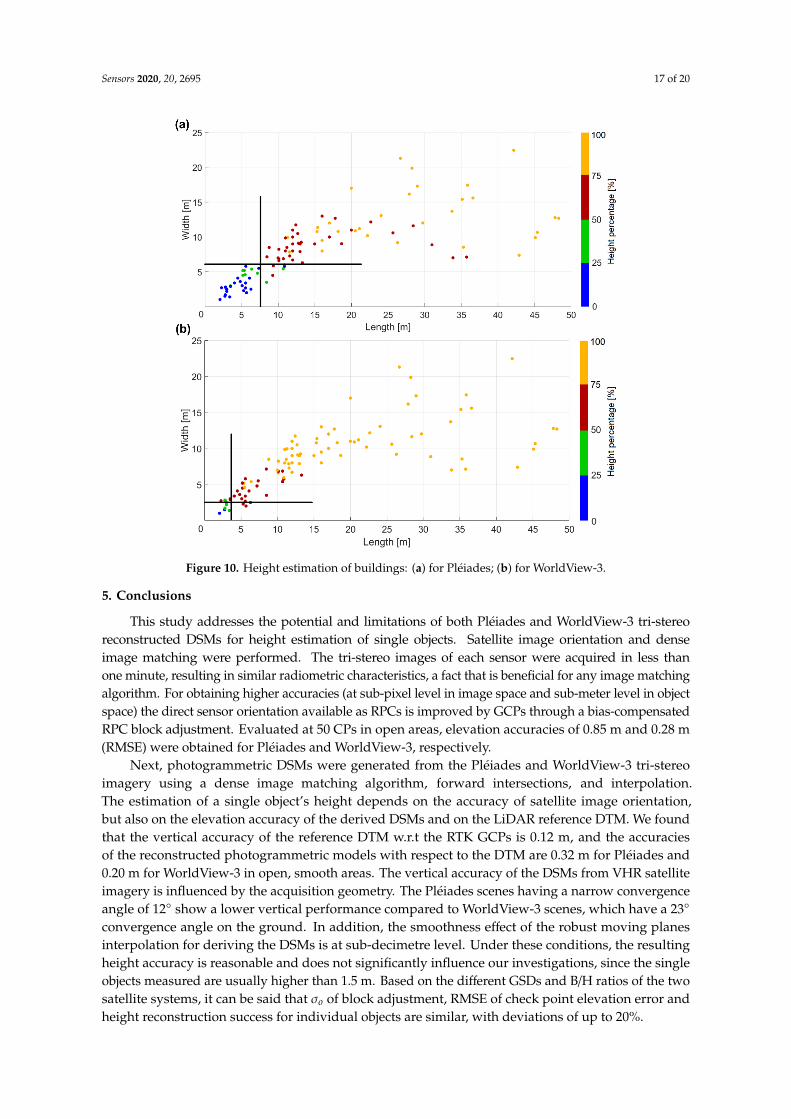
The two scatter plots (Figure 10) show the relationships between building length and widthand the reconstruction height percentage. As expected, height accuracy is better for WorldView-3images than for the Pléiades data. The delineation lines separate the buildings with higher and lowerreconstruction height percentage (p) than 50%. If for Pléiades data a 2D minimum building size of7.5 m length by 6 m width is needed in order to get p > 50%, for WorldView-3 data only 4 m × 2.5 mis needed.
The mean value for the residual heights corresponding to reconstructed buildings with p > 50%(of 2.02 m for Pléiades with 0.7 m GSD) is comparable with the residuals of 1.94 m obtained by [18]when using a DSM from a GeoEye stereo pair (0.5 m GSD).
Sensors 2020, 20, 2695 17 of 20Sensors 2020, 20, x 17 of 20
Figure 10. Height estimation of buildings: (a) for Pléiades; (b) for WorldView‐3.
5. Conclusions
This study addresses the potential and limitations of both Pléiades and WorldView‐3 tri‐stereo
reconstructed DSMs for height estimation of single objects. Satellite image orientation and dense
image matching were performed. The tri‐stereo images of each sensor were acquired in less than one
minute, resulting in similar radiometric characteristics, a fact that is beneficial for any image matching
algorithm. For obtaining higher accuracies (at sub‐pixel level in image space and sub‐meter level in
object space) the direct sensor orientation available as RPCs is improved by GCPs through a bias‐
compensated RPC block adjustment. Evaluated at 50 CPs in open areas, elevation accuracies of
0.85 m and 0.28 m (RMSE) were obtained for Pléiades and WorldView‐3, respectively.
Next, photogrammetric DSMs were generated from the Pléiades and WorldView‐3 tri‐stereo
imagery using a dense image matching algorithm, forward intersections, and interpolation. The
estimation of a single object’s height depends on the accuracy of satellite image orientation, but also
on the elevation accuracy of the derived DSMs and on the LiDAR reference DTM. We found that the
vertical accuracy of the reference DTM w.r.t the RTK GCPs is 0.12 m, and the accuracies of the
reconstructed photogrammetric models with respect to the DTM are 0.32 m for Pléiades and 0.20 m
for WorldView‐3 in open, smooth areas. The vertical accuracy of the DSMs from VHR satellite
imagery is influenced by the acquisition geometry. The Pléiades scenes having a narrow convergence
angle of 12o show a lower vertical performance compared to WorldView‐3 scenes, which have a 23o
convergence angle on the ground. In addition, the smoothness effect of the robust moving planes
interpolation for deriving the DSMs is at sub‐decimetre level. Under these conditions, the resulting
height accuracy is reasonable and does not significantly influence our investigations, since the single
objects measured are usually higher than 1.5 m. Based on the different GSDs and B/H ratios of the
two satellite systems, it can be said that σo of block adjustment, RMSE of check point elevation error
and height reconstruction success for individual objects are similar, with deviations of up to 20%.
Figure 10. Height estimation of buildings: (a) for Pléiades; (b) for WorldView-3.
5. Conclusions
This study addresses the potential and limitations of both Pléiades and WorldView-3 tri-stereoreconstructed DSMs for height estimation of single objects. Satellite image orientation and denseimage matching were performed. The tri-stereo images of each sensor were acquired in less thanone minute, resulting in similar radiometric characteristics, a fact that is beneficial for any image matchingalgorithm. For obtaining higher accuracies (at sub-pixel level in image space and sub-meter level in objectspace) the direct sensor orientation available as RPCs is improved by GCPs through a bias-compensatedRPC block adjustment. Evaluated at 50 CPs in open areas, elevation accuracies of 0.85 m and 0.28 m(RMSE) were obtained for Pléiades and WorldView-3, respectively.
Next, photogrammetric DSMs were generated from the Pléiades and WorldView-3 tri-stereoimagery using a dense image matching algorithm, forward intersections, and interpolation.The estimation of a single object’s height depends on the accuracy of satellite image orientation,but also on the elevation accuracy of the derived DSMs and on the LiDAR reference DTM. We foundthat the vertical accuracy of the reference DTM w.r.t the RTK GCPs is 0.12 m, and the accuraciesof the reconstructed photogrammetric models with respect to the DTM are 0.32 m for Pléiades and0.20 m for WorldView-3 in open, smooth areas. The vertical accuracy of the DSMs from VHR satelliteimagery is influenced by the acquisition geometry. The Pléiades scenes having a narrow convergenceangle of 12◦ show a lower vertical performance compared to WorldView-3 scenes, which have a 23◦
convergence angle on the ground. In addition, the smoothness effect of the robust moving planesinterpolation for deriving the DSMs is at sub-decimetre level. Under these conditions, the resultingheight accuracy is reasonable and does not significantly influence our investigations, since the singleobjects measured are usually higher than 1.5 m. Based on the different GSDs and B/H ratios of the twosatellite systems, it can be said that σo of block adjustment, RMSE of check point elevation error andheight reconstruction success for individual objects are similar, with deviations of up to 20%.
Sensors 2020, 20, 2695 18 of 20
In order to investigate the potential of Pléiades and WorldView-3 tri-stereo DSMs for single objectheight estimation, 50 vehicles, 100 trees, and 100 buildings were analyzed. Vehicle length/width,tree crown diameter and building length/width were identified as the main geometric parametersfor classifying single objects into different groups. The results clearly show a gradual increase of theestimated heights with object dimensions. Starting from very small objects (whose heights are notreconstructed) the values for the height reconstruction percentage reached almost 100% for very largesingle objects (e.g., buildings with lengths >35 m in the case of WorldView-3 DSM). Hence, individualobjects’ reconstructed heights strongly depend on object type, size, and the sensor being used. As anexample, if we consider the p = 50% threshold for an appropriate height reconstruction, then we obtainthe following minimum size values for the single objects: 10 m (Pléiades) and 5 m (WorldView-3) forvehicle lengths; 5 m (Pléiades) and 2.5 m (WorldView-3) for tree crown diameters and 7.5 m × 6 m(Pléiades) and 3.5 m × 2.5 m (WorldView-3) for building length/width. The ratio of these dimensionsfits well to the GSD ratio of 70 cm to 31 cm.
Generally, for all single objects except deciduous trees, the results achieved with WorldView-3 datawere better than those achieved by using the Pléiades data. Hence, the ability of WorldView-3-derivedDSM to perform height estimation of single objects is higher compared with Pléiades DSM. This is mainlybecause of the very high resolution (0.31 m) that leads (through photogrammetric processing) tovery dense 3D point clouds, describing the real ground surface and the objects on it more accurately.The acquisition times also play a significant role in the photogrammetric procedure. For stableobjects such as buildings, the different periods of acquisition do not affect the 3D reconstruction, butfor deciduous trees, the automatic reconstructed heights are highly underestimated in the leaf-off
season. Their leafless appearance in the images brings difficulties to the image matching processwhen finding correct correspondences for tree branches. From this observation, we can concludethat the image appearance and texture of trees (and other single objects) are also very important forthe 3D reconstruction and height estimation. For all objects investigated, the resulting histograms(Figures 5, 6 and 9) show interesting trends, opening new investigation options for refinement suchas adding the influence of object orientation, color, and texture in the feature reconstruction abilityof heights, but these are outside the scope of the present research. The poor performance on smallindividual objects is mainly caused by the continuity constraint of dense matching algorithms. A topicfor future research would be to investigate if a combination of different matching strategies can deliverbetter results on single object heights.
In our investigation, the current findings are valid for Pléiades and WorldView-3 DSMs derivedfrom the tri-stereo images with their specific acquisition geometry. Nevertheless, the acquisitiongeometry could be changed, but this is only to a very small extend under the control of the user.A higher B/H ratio and implicit convergence angle to the ground will increase the geometric intersectionquality, leading to a higher vertical accuracy of the photogrammetric DSM. This will have a positiveeffect on the single object height signature in the DSM.
From the analyses and investigations performed, the results suggest that the acquisition geometryclearly has an effect on accuracy, but the object height estimation based on automatically derivedDSMs primarily depends on object size. Objects of a few pixel in size are hardly mapped in the DSM,whereas, with some dependency on object type, objects of 12 pixels in size are typically mapped withapproximately 50% of their real height. To reach 90% of the real height, a minimum object size between15 and 30 pixel is necessary.
Author Contributions: Conceptualization, A.-M.L., J.O.-S. and N.P.; Formal analysis, A.L.; Investigation, A.-M.L.;Methodology, A.-M.L., J.O.-S. and N.P.; software, J.O.-S.; Project administration, J.O.-S.; Software, J.O.-S.;Supervision, N.P. and J.O.-S.; Validation, A.-M.L., J.O.-S. and N.P.; Visualization, A.-M.L.; Resources, J.O.-S. andN.P.; Data curation, A.-M.L., J.O.-S. and N.P.; Writing—original draft preparation, A.-M.L.; Writing—review andediting, J.O.-S. and N.P.; funding acquisition, N.P. All authors have read and agreed to the published version ofthe manuscript.
Sensors 2020, 20, 2695 19 of 20
Funding: The work was partly funded by the Austrian Research Promotion Agency (FFG), Vienna, Austriawithin the research project “3D Reconstruction and Classification from Very High Resolution Satellite Imagery(ReKlaSat 3D)” (grant agreement No. 859792). Open Access Funding by TU Wien.
Acknowledgments: The authors acknowledge Open Access Funding by TU Wien. We would like to thank theInstitut für Militärisches Geowesen (Maximilian Göttlich and Clemens Strauß) for support in satellite imageacquisition and the company Vermessung Schmid ZT GmbH (Karl Zeitlberger) for providing the RTK groundcontrol point coordinates used in this study.
Conflicts of Interest: The authors declare no conflict of interest.
References
1. Toutin, T.; Cheng, P. Comparison of automated Digital Elevation Model extraction results using along-trackaster and across-track Spot stereo images. Opt. Eng. 2002, 41, 2102–2106.
2. Sadeghian, S.; Zoej, M.J.V.; Delavar, M.R.; Abootalebi, A. Precision rectification of high resolution satelliteimagery without ephemeris data. Int. J. Appl. Earth Obs. Geoinf. 2001, 3, 366–371. [CrossRef]
3. Astrium. Pléiades Imagery—User Guide v 2.0; Astrium: Toulouse, France, 2012.4. DigitalGlobe. Digitalglobe Core Imagery Products Guide. Available online: http://www.digitalglobe.com/
downloads/DigitalGlobeCoreImageryProductsGuide.pdf (accessed on 15 November 2019).5. Bernard, M.; Decluseau, D.; Gabet, L.; Nonin, P. 3D capabilities of Pleiades satellite. Xxii ISPRS Congr. Tech.
Comm. Iii 2012, 39-B3, 553–557. [CrossRef]6. Poli, D.; Remondino, F.; Angiuli, E.; Agugiaro, G. Evaluation of Pleiades-1A triplet on Trento testfield. ISPRS
Hannover Workshop 2013, 40-1, 287–292. [CrossRef]7. Perko, R.; Raggam, H.; Gutjahr, K.; Schardt, M. Assessment of the mapping potential of Pléiades stereo and
triplet data. ISPRS Ann. Photogramm. Remote Sens. Spat. Inf. Sci. 2014, 2, 103. [CrossRef]8. Alabi, T.; Haertel, M.; Chiejile, S. Investigating the use of high resolution multi-spectral satellite imagery for
crop mapping in Nigeria crop and landuse classification using WorldView-3 high resolution multispectralimagery and Landsat8 data. In Proceedings of the 2nd International Conference on Geographical InformationSystems Theory, Applications and Management (GISTAM), Rome, Italy, 26–27 April 2016; pp. 109–120.
9. Asadzadeh, S.; de Souza, C.R. Investigating the capability of WorldView-3 superspectral data for directhydrocarbon detection. Remote Sens. Environ. 2016, 173, 162–173. [CrossRef]
10. Bostater, C.R.; Oney, T.S.; Rotkiske, T.; Aziz, S.; Morrisette, C.; Callahan, K.; Mcallister, D. Hyperspectralsignatures and WorldView-3 imagery of indian river Lagoon and Banana river estuarine water and bottomtypes. Remote Sens. Ocean Sea Ice Coast. Waters Large Water Reg. 2017, 2017, 10422.
11. Koenig, J.; Gueguen, L. A comparison of land use land cover classification using superspectral WorldView-3vs hyperspectral imagery. In Proceedings of the 2016 8th Workshop on Hyperspectral Image and SignalProcessing: Evolution in Remote Sensing (WHISPERS), Los Angeles, CA, USA, 21–24 August 2016.
12. Hu, F.; Gao, X.M.; Li, G.Y.; Li, M. DEM extraction from WorldView-3 stereo-images and accuracy evaluation.Xxiii ISPRS Congr. Comm. I 2016, 41, 327–332.
13. Rupnik, E.; Pierrot-Deseilligny, M.; Delorme, A. 3D reconstruction from multi-view VHR-satellite images inMicmac. ISPRS J. Photogramm. 2018, 139, 201–211. [CrossRef]
14. Abduelmula, A.; Bastos, M.L.M.; Gonçalves, J.A. High-accuracy satellite image analysis and rapid DSMextraction for urban environment evaluations (Tripoli-Libya). World Acad. Sci. Eng. Technol. Int. J. Comput.Electr. Autom. Control Inf. Eng. 2015, 9, 661–666.
15. Flamanc, D.; Maillet, G. Evaluation of 3D City Model Production from Pleiades hr Satellite Images and 2D GroundMaps; URBAN: Tempe, AZ, USA, 2005.
16. Poli, D.; Remondino, F.; Angiuli, E.; Agugiaro, G. Radiometric and geometric evaluation of GeoEye-1,WorldView-2 and Pléiades-1A stereo images for 3D information extraction. ISPRS J. Photogramm. 2015, 100,35–47. [CrossRef]
17. Sirmacek, B.; Taubenbock, H.; Reinartz, P.; Ehlers, M. Performance evaluation for 3-D city model generationof six different DSMs from air-and spaceborne sensors. IEEE J.-STARS 2012, 5, 59–70. [CrossRef]
18. Macay Moreia, J.; Nex, F.; Agugiaro, G.; Remondino, F.; Lim, N. From DSM to 3D building models:A quantitative evaluation. ISPRS-Int. Arch. Photogramm. Remote Sens. Spat. Inf. Sci. 2013, 1, 213–219.[CrossRef]
Sensors 2020, 20, 2695 20 of 20
19. Panagiotakis, E.; Chrysoulakis, N.; Charalampopoulou, V.; Poursanidis, D. Validation of Pleiades tri-stereoDSM in urban areas. ISPRS Int. J. Geo-Inf 2018, 7, 118. [CrossRef]
20. Piermattei, L.; Marty, M.; Karel, W.; Ressl, C.; Hollaus, M.; Ginzler, C.; Pfeifer, N. Impact of the acquisitiongeometry of Very High-Resolution Pléiades imagery on the accuracy of canopy height models over forestedalpine regions. Remote Sens.-Basel 2018, 10, 1542. [CrossRef]
21. Stentoumis, C.; Karkalou, E.; Karras, G. A review and evaluation of penalty functions for semi-global matching.In Proceedings of the 2015 IEEE International Conference on Intelligent Computer Communication andProcessing (ICCP), Cluj-Napoca, Romania, 3–5 September 2015; pp. 167–172.
22. Fraser, C.S.; Dial, G.; Grodecki, J. Sensor orientation via RPCs. ISPRS J. Photogramm. 2006, 60, 182–194.[CrossRef]
23. Perko, R.; Raggam, H.; Schardt, M.; Roth, P.M. Very high resolution mapping with the Pleiades satelliteconstellation. Am. J. Remote Sens. 2018, 6, 2019. [CrossRef]
24. Jacobsen, K.; Topan, H. DEM generation with short base length Pleiades triplet. Int. Arch. Photogramm.Remote Sens. Spat. Inf. Sci. ISPRS Arch. 2015, 40, 81–86. [CrossRef]
25. Panem, C.; Bignalet-Cazalet, F.; Baillarin, S. Pleiades-hr system products performance after in-orbitcommissioning phase. Int. Arch. Photogramm. Remote Sens. Spat. Inf. Sci. 2012, 39, B1. [CrossRef]
26. Orfeo Toolbox. Available online: https://www.orfeo-toolbox.org/ (accessed on 8 August 2019).27. Kuester, M. Radiometric Use of Worldview-3 Imagery—Technical Note; DigitalGlobe: Longmont, CO, USA, 2016.28. Tong, X.; Liu, S.; Weng, Q. Bias-corrected Rational Polynomial Coefficients for high accuracy geo-positioning
of Quickbird stereo imagery. ISPRS J. Photogramm. 2010, 65, 218–226. [CrossRef]29. Dial, G.; Grodecki, J. Block adjustment with rational polynomial camera models. In Proceedings of the
ASPRS 2002 Conference, Washington, DC, USA, 19–26 April 2002; pp. 22–26.30. Trimble. Match-T DSM Reference Manual; Trimble Inc.: Sunnyvale, CA, USA, 2016.31. Geospatial. Trimble Inpho Brochure. Available online: http://www.inpho.de (accessed on 31 August 2018).32. Kraus, K. Photogrammetrie: Photogrammetrie: Geometrische Informationen aus Photographien und
Laserscanneraufnahmen; Walter de Gruyter: Berlin, Germany; New York, NY, USA, 2004.33. Förstner, W. On the geometric precision of digital correlation. In Proceedings of the Symposium of the ISPRS
Commision III, Helsinki, France, 7–11 June 1982; pp. 176–189.34. Förstner, W.; Gülch, E. A fast operator for detection and precise location of distinct points, corners and
centres of circular features. In Proceedings of the ISPRS Intercommission Conference on Fast Processing ofPhotogrammetric Data, Interlaken, Switzerland, 2–4 June 1987; pp. 281–305.
35. Hirschmüller, H. Stereoprocessing by Semi Global Matching and mutual information. IEEE Trans. PatternAnal. Mach. Intell. 2008, 30, 328–341. [CrossRef] [PubMed]
36. Förstner, W. A feature based correspondence algorithm for image matching. Int. Arch. Photogramm. 1986, 26,150–166.
37. Heipke, C. A global approach for least-squares image matching and surface reconstruction in object space.Photogramm. Eng. Remote Sens. 1992, 58, 317.
38. Wenzel, K.; Rothermel, M.; Haala, N.; Fritsch, D. Sure–the ifp software for dense image matching.In Proceedings of the Photogrammetric Week, Stuttgart, Germany, 9–13 September 2013; pp. 59–70.
39. Pfeifer, N.; Mandlburger, G.; Otepka, J.; Karel, W. Opals–a framework for airborne laser scanning dataanalysis. Comput. Environ. Urban Syst. 2014, 45, 125–136. [CrossRef]
40. Stumpf, A.; Malet, J.P.; Allemand, P.; Ulrich, P. Surface reconstruction and landslide displacement measurementswith Pleiades satellite images. ISPRS J. Photogramm. 2014, 95, 1–12. [CrossRef]
41. Poli, D.; Caravaggi, I. 3D modeling of large urban areas with stereo VHR satellite imagery: Lessons learned.Nat. Hazards 2013, 68, 53–78. [CrossRef]
© 2020 by the authors. Licensee MDPI, Basel, Switzerland. This article is an open accessarticle distributed under the terms and conditions of the Creative Commons Attribution(CC BY) license (http://creativecommons.org/licenses/by/4.0/).