an updated ranking of the economic research institutions...
TRANSCRIPT
An Updated Ranking of the Economic Research Institutions in China (2000-2009)
Abstract:
This paper ranks the economic research institutions in China based on publications in the SSCI economics journals from 2000 through 2009 and finds that the gap in the research capacity of economic research institutions between the mainland and Hong Kong is very large, even though the difference in overall quality is not so significant. This paper can reflect successes and failures of the reform of the economics education in China over the past decade and give important implications for the ongoing reforms as well.
.
Key Words: Rankings, China, Economic Institutions, 2000-2009
JEL: A20
Please Refer to:
Yu X. and Zhifeng Gao: “An Updated Ranking of the Economic Research Institutions
in China (2000-2009)", Forthcoming in China Economic Review.

1
An Updated Ranking of the Economic Research Institutions in China (2000-2009)
1. Introduction
Publications in economics journals can be regarded as the main output of
economic research. Recently, many researches ranked economic research institutions
by their publications in English-language economics journals. Representative studies
include Kalaitzidakis, Mamuneas, and Stengos (hereafter as “KMS”) (2003) and
Coupé (2003). These two papers ranked the major international economics journals,
economic research institutions and economists by different methods after reviewing
the current existing rankings. Regardless of the different methods or the dissimilar
results (Coupé 2003), a common finding was that there were still certain gaps in the
capability of publishing English-language economics papers between the economic
research institutions in mainland China and Hong Kong, as well as the world. None of
the research institutions in mainland China has been favored by the above-mentioned
international rankings (KMS, 2003; Coupé, 2003). However, some universities in
Hong Kong rank high with respect to their research activities. In KMS’ (2003) World
Top 200, The Hong Kong University of Science and Technology is ranked No. 37,
The Chinese University of Hong Kong No.84, and The University of Hong Kong
No.166. In Coupé’s (2003) World Top 100, The Hong Kong University of Science
and Technology and The Chinese University of Hong Kong are ranked No.76 and
No.85 respectively. There are also some rankings of US economic research
institutions, including Dusansky and Clayton (1998), Rupp and McKinney (2002),
Tschirhart (1989) and Hirsch, Austin, Brooks, and Moore (1984) (henceforth referred
to as HABM).
Even in the East Asian rankings, the publications of mainland China were
relatively weak. None of the institutions in mainland China is among the Top 10

2
according to a ranking of economics departments in East Asia by Jin and Yau (1999).
It has also been noted that the existing rankings are characterized by discrimination
with respect to language, region and institution (Coupé, 2003), with non-English-
language countries being disadvantaged in these rankings.
EconLit and SSCI (Social Science Citation Index, SSCI) are the two databases
used most frequently in the present rankings. EconLit is a searchable electronic
bibliographic database provided by the American Economic Association and currently
contains more than 1400 economics journals after a recent rapid expansion. SSCI is
an index provided by Thomson Reuters and includes world leading journals in social
sciences including economics. The rankings of KMS (2003) and Coupé (2003) used
EconLit. In particular, the rankings of KMS (2003) are based on the pages and
adjusted pages (including the Notes but excluding reviews and proceedings) published
in the Top 30 economics journals from 1995 through 1999. Coupé’s rankings (2003)
employ 4 approaches: 1) the page-counts in Top 10 journals by the method of KMS; 2)
the page-counts in 71 journals; 3) the impact factor ranking, using article counts and
including 233 journals and 4) the HABM ranking (1984), using page counts and
including 24 journals, which is comparable to a ranking for the period from 1978 until
1982.
Some current researches including Kodrzycki and Yu (2006), Ritzberger
(2008), and Engemann and Wall (2009) use the database of the SSCI because the
impact factors, published each year for journals included in the SSCI, are essential for
journal rankings due to the fact that they can be regarded to be good measures for
journal quality. For instance, a most recent study by Ritzberger (2008) considers 261
journals for the years 2003-2005, which are all from the SSCI.
This article also uses economics journals in the SSCI database to rank the
economic research institutions in China. In the past a few years, the SSCI database
3
has experienced a rapid expansion and currently includes 2141 journals out of which
215 are economics journals while the rest includes anthropology, business, history,
sociology, and other subjects in social sciences. The reasons for choosing the SSCI
database are 1) the SSCI is more popular and more available in mainland China, so
that it is easier for this research to be updated in the future. This is further supported
by the facts that the database provides more detailed information about the
publications and is well maintained by Thomson Reuters; 2) the SSCI currently
includes 215 economics journals including the Top 50 economics journals.
Consequently, the ranking results of the SSCI and EconLit should be identical when
ranking only the publications in the top journals; 3) EconLit is a database particularly
focusing on economics journals, while the SSCI includes other social sciences, such
as business, sociology, psychology, and political science, so that we can study the
impacts of economics papers on other closely-related fields. In particular, the impact
factors used in this study reflect the citations from other closely-related subjects.
Furthermore, the methods of ranking in economics discussed in this article can also be
transferred to other subjects in the SSCI.
The above-mentioned rankings of institutions are out of date because they
only reflect the status before 2000. With the reform and opening-up, China has
experienced rapid economic growth over the past three decades. Along with the
transition from a planned economy to a market economy, China has also been
reforming its system of economics education, switching quickly from the traditional
Marxian political economics to modern western economics. After that, Chinese
economists started to increasingly publish their research in international journals and
to communicate with their international peers. Figure 1 shows the development of the
quantity of economics papers published by Chinese economists, which have been
indexed by the SSCI from1980 until December of 2009. It should be noted however

4
that we only considered research papers and excluded notes, proceedings, book
reviews and editorial documents.
The statistics indicate that the number of publications before 1997 is very low,
and that after 1997 the number is substantially increasing. Based on the statistics, the
number of total publications in China during the period from 1980 through 2009 is
2179. However, the total number before 1997 is only 206, which is perhaps less than
the one-year output of a leading university in the US, whereas after 1997 the number
of publications in China increased explosively. In the year 2008 alone, the total
number of publications reached 339, which is significantly more than has been
published during the whole period from 1980 through 1997. The reasons for the
explosive increase might be (1) the return of Hong Kong to China, which now
contributes significantly to China’s number of publications; (2) the expansion of the
economics journals in the SSCI; and (3) undeniably the increase in the research ability
of Chinese economists. Figure 1 also shows the trend of publications in Hong Kong.
The number of publications there is also increasing after 1997, but not as significantly
as with respect to the whole of China, which indicates that the research ability of the
mainland is substantially increasing after 1997.
Given the recent dramatic changes in economics education and research in
China, we need an updated study on the ranking of economic research institutions in
China to reflect these changes. Although there are some recent rankings of Chinese
economics research institutions as well as of other subjects, such as the rankings by
Shuping Wu1, they do not conduct systematic research or rankings to specifically
analyze the quantity and quality of publications by Chinese institutions. Laffont (1999)
argues that a generally acknowledged method of ranking is desired as economics is
now an international science. Because a main product of economic research should be 1 Please see http://learning.sohu.com/20090428/n263674445.shtml.

5
publications of high-level academic papers contributing to the knowledge of the
human society, we can say that a proper evaluation of the publications in high-level
economics journals is an important aspect of the correct evaluation of economic
researches.
Although Yu (2008) ranks Chinese research institutions by their English-
language publications during the period 1998-2007, he does not reflect the changes in
the publications during the past decade. Given the fact that many universities in China
are implementing radical reforms of their economics education systems, an updated
research is needed to measure the effects of those actions. Following Yu (2008), the
main objective of this paper is to provide a systematical and updated analysis of the
publications in English-language economics journals by the research institutions in
China (including mainland China, Hong Kong and Macao, but without Taiwan).
However, we also realize that this study cannot reflect the overall research abilities of
a research institution because the publications in other languages, such as Chinese
language, are not counted.
In the current literature there are a lot of rankings of economists, economic
institutions and economics journals with different approaches. However, this study
will focus on the rankings of the research institutions. The ranking of journals is
neither the interest of this paper, nor necessary because there are plenty of papers
ranking the economics journals (KMS 2003; Coupé, 2003; Kodrzycki and Yu 2006;
Ritzberger 2008; and Engemann and Wall 2009). Furthermore, it is difficult to rank
Chinese economists based on their English-language publications because of the
difficulty of precisely defining a Chinese economist, which can be done either based
on affiliation or on nationality. The economists who can publish high-quality papers
in English-language journals are highly mobile and they often change their affiliations
from one institution to another and also from one country to another. Moreover, some

6
well-known economists were born in China but have given up the Chinese nationality
and obtained other nationalities. Furthermore, it is also not necessary to rank Chinese
economists. A good economist should compete with his peers from all over the world
as economics is an international science. There are already a lot of rankings of
economists in the world. For instance, Coupé (2003) provides a good ranking of
economists and an excellent review of the existing rankings as well.
Following Yu (2008), the rest of the paper will be devoted to developing an
approach to systematically rank the Chinese economic research institutions by their
publications in English-language economics journals, using the database of the SSCI
(2000-2009). Since some universities, such as Xiamen University and Shanghai
University of Finance and Economics, took radical measures to reform their
economics education around the year 2004, we split the ten years into the two periods
2000-2004 and 2005- 2009 and rank them separately in order to have a comparative
study of the two periods, which also allows to assess the impacts of the reforms.
2. Data and methodology
The rankings in this study are based on the publications in SSCI economics
journals from January 2000 through October 2009. We only include the research
papers and exclude the notes, proceedings, book reviews and editorial documents.
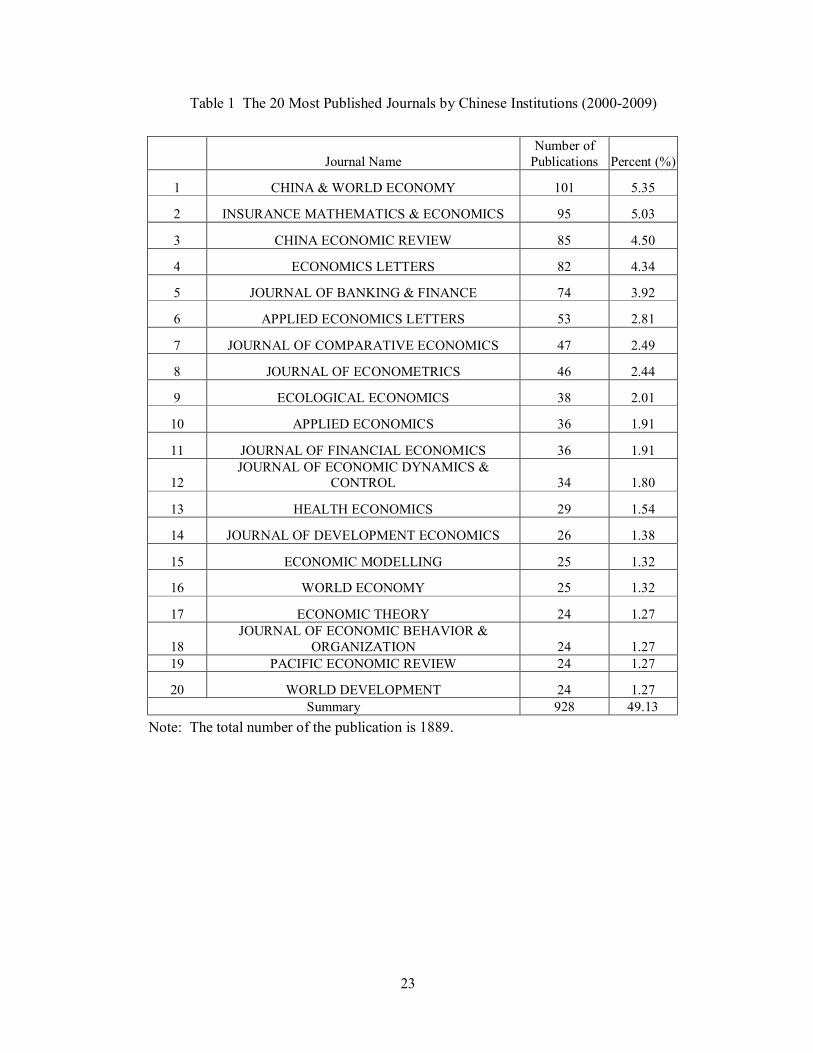
Totally there are 1889 publications2 distributed across 191 out of 215 economics
journal in the SSCI.
Table 1 lists the 20 most published journals, which almost account for half
(49.13%) of the total publications. The 4 most published journals are China & World
Economy (5.35%), Insurance Mathematics & Economics (5.03%), China Economic
2 There are 1920 economics papers from China (as a region) in the SSCI.. We exclude 31 papers, which are not really from China, so that we have 1889 papers.
7
Review (4.50%), and Economics Letters (4.34%). The C4 index (Concentration of the
4 most published journals) is 19.22%. There are only 22 papers (1.2%) published in
the well-known Top 4 economics journals: 9 in AER, 9 in Econometrica, 4 in JPE and
zero in QJE.
As aforementioned, we will split the 1889 publications from 2000 through
2009 into two periods: 2000-2004 and 2005-2009. The statistic shows that 619 papers
have been published in the period 2000-2004 (about 1/3 of total publications) by a
total of 82 Chinese institutions. The remaining 2/3 of all publications have been
published during the period 2005-2009 by 169 Chinese institutions3 . In order to
reduce errors, this paper only ranks institutions with more than 2 publications.
In addition, the quality of economics publications is very important. Some
famous economists obtained their reputations from just one or two classical
publications. Usually, high quality papers appear in high quality journals, because the
reputation of journals and the peer-review process can ensure a certain quality of
papers and thereby maintain the quality of the journals. In practice, the impact factor,
the ratio of the number of citations of a given journal to the number of articles
published in this journal for a fixed period, for instance two years in SSCI, is used for
measuring the quality of a journal. This indicator depends on field size, citation
intensity and turnover rate (Jemec, 2001). It may however favor certain fields and also
cannot distinguish the citations of an important journal from those of a less important
journal.
So far, many approaches have been developed for correcting the above-
mentioned biases, including the H-index method (Hirsch, 2004), the BT-method
(Brandley and Terry, 1952), the LP-method (Liebowitz and Palmer, 1984), the
3 We considered the fact that some institutions have different English names, such as the Peking University, which is also called Beijing University. In these cases, we subsumed the different versions under a common name.
8
tournament method (Koczy and Strobel, 2007), and the invariant method (Palacio-
Huerta and Volij, 2004).
Coupé (2003), KMS (2003) and Kodrzycki and Yu (2006) ranked the journals by the
LP-method, while Ritzberger (2008) ranked the journals by the invariant method.
Ritzberger (2008) also provides a good review of the different methods and results.
Although the ranking methods might be different, the ranking results are very similar,
which is true in particular for top journals. Therefore, we follow Ritzberger (2008)
and rank the institutions by the number of publications in the Top 50 economics
journals.
We include 8 indexes from different aspects to reflect the research ability of
the Chinese economic research institutions.
1). Indexed Publications (P)
This is a statistic directly obtained from the SSCI database. Any publication
shows an affiliation with an institution. This institution will be counted only once. In
particular, if an institution is indexed more than once in one paper, the institution is
still only accounted once. The Number of Indexed Papers ( P ) of an institution j can
be expressed as
1
n
j iji
P C=
= ∑ , ( 1 )
where ijC is an index. If a paper i has an affiliation to institution j at least once,
1ijC = , otherwise 0ijC = .
2). Real Publications (RP)
The number of indexed papers ( P ) cannot truly reflect the number of
publications by an institution. For instance, if there are many institutions contributing

9
to one paper, each institution will be counted once towards P . This is unfair towards
an institution, which publishes a paper independently by itself. We therefore have to
develop another index, the index of real papers (RP) in order to adjust for the number
of institutions in a paper.
If a paper i has ia authors and a certain author im is affiliated to mik
institutions, each institution the author is affiliated to actually contributes only 1
i mia k
of the paper. Consequently, the contribution of institution j to the paper is
1
1ia
imjm i mi
Ba k=
∑ , where imjB is also an index and 1imjB = means that author im of paper
i is affiliated to institution j , otherwise 0imjB = . Then the real publications (RP) of
the institution j are
1 1
1i
ii i
an
j im ji m i m i
RP Ba k= =
= ∑ ∑ . ( 2 )
However, the relationship between authors and institutions in the database
of the SSCI is not clear in the case of the years before 2007, and we only have the
information of the institutions, so that we cannot use Equation (2) to precisely adjust
the institutions. In this case, we assume that each institution has contributed equally
to a paper published before 2007. Since the relationship between authors and
institutions is clear for the years 2008 and 2009, we can use the equation (2) to adjust
institutions for the publications.
3). Impact-Factor adjusted papers (ARP)
The quality of a publication is very important. However, the above two
indexes P and RP do not consider the quality of the publications. For instance, a
paper published in the American Economic Review may have a much greater

10
contribution in terms of academic standard than a paper published in China and
World Economy. Therefore, we should use the Impact Factors to adjust for the quality
of publications. This leads to a third index, the Impact-Factor adjusted papers (ARP):
1 1
1i
ii i
an
j i im ji m i m i
ARP F Ba k= =
= ∑ ∑ , (3)
where iF is the impact factor of the journal in which paper i is published. Although
the SSCI provides the impact factors of journals, which are defined as the ratios of the
number of citations to the number of articles published in the past 2 years, it cannot
reflect the long-term impact and reputation of a journal (KMS 2003). Consequently,
KMS (2003) provided a journal ranking, which takes into account reputation, history
and self-citation in order to adjust the ranking. However, KMS’ rankings only reflect
the journals for the period 1994-1998.
Recently, Ritzberger (2008) presented an updated ranking of economics
journals (2003-2005) using the invariant method drawing on a broader sample of
journals, particularly including the closely related social sciences journals. The
ranking results are very similar to those of KMS (2003) for top journals and
somewhat different for the remaining journals. In this paper, we will use the impact
factors of Ritzberger to adjust for the quality of publications to reflect the recent
changes in journal rankings.
Both Ritzberger’s (2008) and KMS’ (2003) rankings set the value of a
journal between 0.00 and 100. If we use the original values from Ritzberger (2008) to
directly adjust for quality, it will make the differences of quality among journals too
large. Coupé (2003) sets the values of impact factors between 0 and 1, which, on the
contrary, makes the differences too small.

11
In this study, we change the lowest value in Ritzberger (2008) from 0.00 to
0.01 and then project the impact factors to the range between 1 to 5 using the
following equation:
1/ 4 4[(100* ) 1]* 19i iF RF= − + , ( 4 )
where iRF represents the values of the impact factors in Ritzberger (2008).
Ritzberger (2008) does not include all current economics journals due to the
recent quick expansion of journals in the SSCI. The impact factors of some journals,
such as China and World Economy, are stated in the 2008 ISI citation report. For
those journals we can estimate the iRF based on the ratio of their impact factors
relative to the impact factor of the China Economic Review in 2008 because the China
Economic Review is considered a major journal in Chinese economics research. Then, 2008
2008i
i CERCER
FRF RFF
= , (5)
where 2008iF and 2008
CERF are the impact factors of journal i and the China
Economic Review respectively in the 2008 ISI report. CERRF in turn is the impact
factor of the China Economic Review in Ritzberger (2008).
If the journals are newly selected into the SSCI, such as the Annals of
Finance and Economics, we set 1iRF = .
4). Real pages of publications (RPG)
The above ranking indexes do not consider the length of papers. For
instance, Chinese institutions published 82 papers in Economics Letters, which
amounts to about 4.34% of the total publications, but the papers published in
Economics Letters are usually no longer than 6 pages. Short papers usually have less
content, so that we have to adjust for the content of the publications. Some current
12
rankings are based on the number of pages, such as Coupé (2003). Similarly, we
consider the real pages of publications (RPG) index:
1 1
1i
ii i
an
j i im ji m i m i
RPG G Ba k= =
= ∑∑ , ( 6 )
where iG is the number of pages in publication i .
5). Impact-factor-adjusted pages (ARPG)
Considering the quality of papers is different. In this case, we can use
Ritzberger’s impact factors to adjust for the number of pages of publications. Then we
have an index representing the impact-factor-adjusted pages (ARPG ):
1 1
1i
ii i
an
j i i im ji m i m i
ARPG G F Ba k= =
= ∑∑ . (7)
The impact-factor-adjusted pages (ARPG) index should be seen as an
overall indicator, which reflects the counts, quality and content of papers. However,
as aforementioned, the number of SSCI journals has recently experienced a rapid
expansion. In order to have a robust check, we dropped the publications in China &
World Economy and Annals of Finance & Economics 4 , which are China-based
journals and have only recently been accepted for the SSCI, which allows for a
comparison. The index is then called ARPG-R in the final rankings.
After having the above five ranking indexes, we can use some basic
calculations to obtain 3 more indexes, which sometimes are particularly important
when ranking Chinese research institutions in the field of economics. Many Chinese
institutions or researchers opt for the tactic of publishing “short and low-quality”
papers to increase the counts in the short-run. Some institutions even buy authorships
from other institutions. The following 3 indexes can somehow reflect these behaviors. 4 The robust check is suggested by an associate editor, and we thank the associate editor for it.
13
6). Average pages of publications (AVPG)
We can obtain the average pages of publications of an institution by dividing
the real pages of publications (RPG) by the number of real publications (RP).
/j j jAVPG RPG RP= (8)
This index can reflect the average content of one publication of an institution. If an
institution tries to publish a lot of short papers to increase its counts, this index will be
low.
7). The quality of papers (Q)
Dividing the impact-factor-adjusted publications (ARP) by the real number
of publications (RP), we can get the average impact factor (Q) of the publications by
an institution, which can also be interpreted as the quality of publications by an
institution.
/j j jQ ARP RP= (9)
Many institutions in China decide for the tactic of publishing papers in low-
quality journals. However, the quality of publications is sometimes more important
than the quantity in terms of academic standard. Many well-known scholars
established their academic fames by only one or two classic high-quality papers.
Therefore, this index might be extremely important for ranking the research
institutions in present-day China.
8). Independent ability (IA)
We also can get an indicator of independent ability (IA) regarding an
institution by dividing the real publications (RP) by the indexed publications (P),
14
which reflects the ability of an institution to independently complete an English-
language publication.
/j j jIA RP P= (10)
The lower the indicator, the more cooperation an institution needs to
complete such a publication. Its inverse is exactly the number of affiliations an
institution needs to complete an entire paper independently.
Many universities in mainland China also resort to the tactic of “Borrowing
chicken to lay eggs” to increase their number of publications in the short-run. They
try to hire some short-term visiting scholars from other universities, to buy co-
authorships from good economists, or to encourage their own scholars to coauthor
with high-level scholars from abroad in order to increase the counts of publications. In
those cases, the index of independent ability will be low.
It is worth to point out that the 8 indexes are not independent of each other,
and they can reflect different sides of the research ability of an institution. It is also
very difficult to incorporate them into one index or assign weights to them to get one
index. However, the index of Impact-factor-adjusted pages (ARPG) is a
comprehensive one, which reflects both the quantity and the quality.
3. Rankings and Discussions
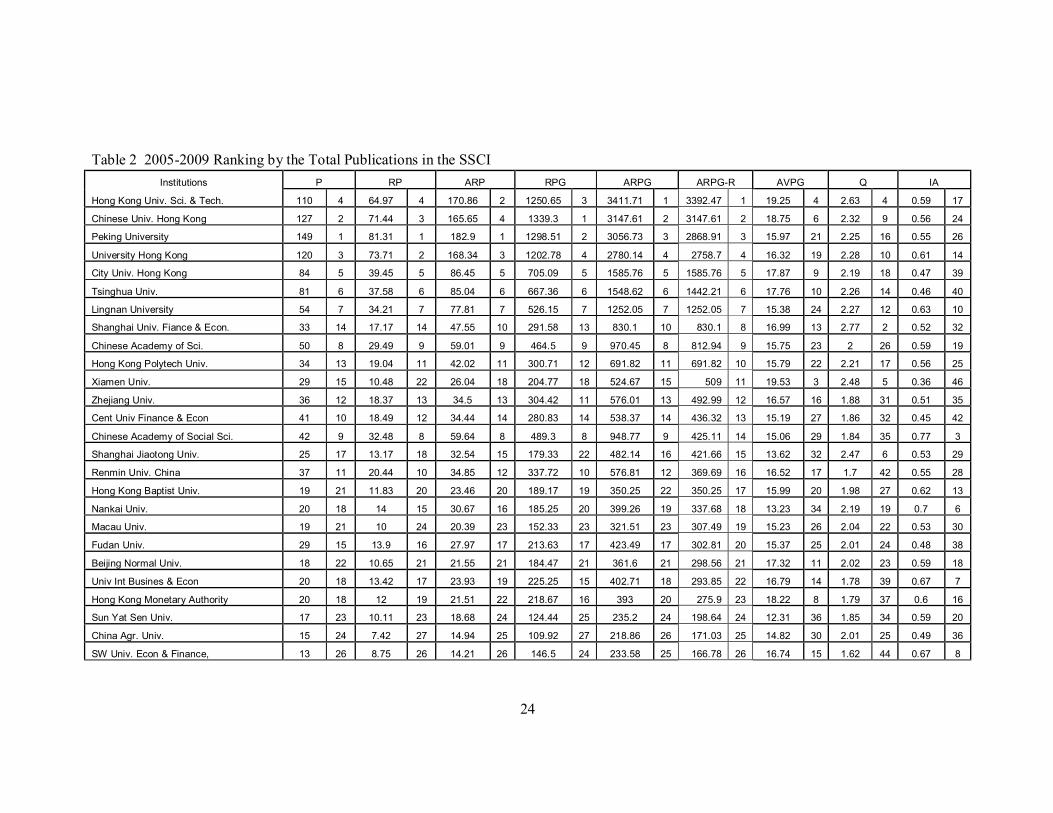
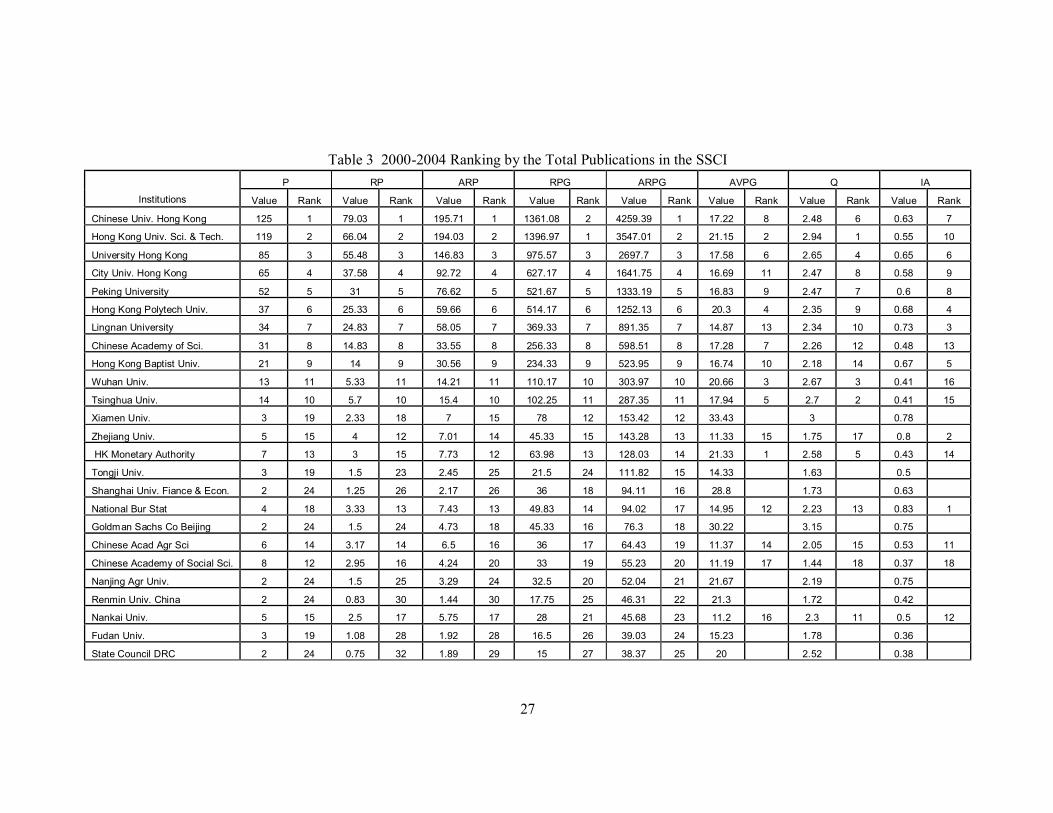
Table 2 and Table 3 present the rankings of the Chinese Institutions with more
than 2 publications in the SSCI for the period 2005-2009 and for the period 2000-
2004, respectively. There are 75 institutions in the 2005-2009 ranking, while the
number is only 33 with respect to the period 2000-2004.
We find the Top 5 institutions in terms of quantity to be identical in both
periods: Hong Kong University of Science and Technology, Chinese University of

15
Hong Kong, Peking University, University of Hong Kong, and City University of
Hong Kong. However, the order is slightly different. The Top 2 institutions in both
periods are the Hong Kong University of Science and Technology and the Chinese
University of Hong Kong, which is consistent with the current rankings by KMS
(2003) and Coupé (2003) as well as with the most recent rankings by Yu (2008). This
indicates that the research capacity of the institutions in mainland China is weaker
than that of Hong Kong. This may be caused by the language bias, a difference in
cultural tradition, and gaps in the education system.
However, comparing the two periods, we find that the publications in
mainland China are increasing substantially and that mainland China is thus catching
up. During the period 2000-2004, there are only three institutions (Peking University
(5), Chinese Academy of Science (8) and Wuhan University (10)) from mainland
China ranked in the Top 10, while during the period 2005-2009 there are five
institutions in the Top 10 (Peking University (3), Tsinghua University (6), Chinese
Academy of Sciences (8), Chinese Academy of Social Sciences (9) and Shanghai
University of Finance and Economics (10)). In particular, the gap between Peking
University and the two leading universities (Hong Kong University of Science and
Technology and Chinese University of Hong Kong) is very small in the period 2005-
2009. The indexed papers (P) index even ranks Peking University as the No. 1,
although the impact-factor-adjusted pages (ARPG) of the publications of Peking
University during the period 2000-2004 only amounted to less than 1/3 of those of the
Chinese University of Hong Kong..
There is a big gap between No. 4 (University of Hong Kong) and No. 5 (City
University of Hong Kong) in the 2005-2009 ranking. The Top 4 institutions in turn
are very close to each other in terms of research capability. Except for Peking
University, the gaps between the mainland institutions and top Hong Kong institutions

16
are still very large. For instance, the No. 10 (Shanghai University of Finance and
Economics) reaches less than ¼ of the publications of the Hong Kong University of
Science and Technology.
If we drop the publications in the two China-based journals: China & World
Economy and Annals of Finance and Economics, we find that there are some changes
in the ranking order, in particular for the Chinese Academy of Social Sciences and
Renmin University of China, which fell from No. 9 to No. 14 and from No. 12 to No.
16 respectively. This is not surprising as China & World Economy is published by the
Chinese Academy of Social Sciences.
As we pointed out earlier, the quality of publications is very important in
terms of the academic standard. The Top 5 institutions during the period 2005-2009
in terms of quality are Cheung Kong Grad School of Business, Shanghai University of
Finance and Economics, Guizhou University, Hong Kong University of Science and
Technology, and Xiamen University; while the Top 5 during the period 2000-2004
are Hong Kong University of Science and Technology, Tsinghua University, Wuhan
University, University of Hong Kong, and Hong Kong Monetary Authority. This
indicates that the overall quality of the publications by mainland China is not lower
than Hong Kong. It should be pointed out that some institutions perform very well in
quantity rankings but not so good in quality rankings, which indicates that these
institutions published a large amount of papers in low-quality journals. For instance,
the China Academy of Social Sciences ranks No. 9 in terms of quantity but only No.
35 in terms of quality. Another extreme example is Renmin University of China,
which ranks No. 12 and No. 42 in terms of quantity and quality respectively.
The strategy of some institutions in China of “borrowing chicken to lay eggs”
to increase the quantity of publications in a short-run will certainly increase their
publication counts through more co-authorships. However, as a result, their index of

17
independent ability (IA) will be very low. Some top institutions from mainland China,
which perform badly in this index, are Tsinghua University (40), Shanghai University
of Finance and Economics (40), Zhejiang University (35), Central University of
Finance and Economics (42), and Xiamen University (46). These institutions are
taking radical measures to reform their economics education systems. In the short-run,
they do increase their publications at least in terms of quantity (Counts of
publications). However, they still have a long way to go to increase their independent
ability of research.
Tables 4 and 5 contain the rankings of the Chinese Institutions with more than
two publications in Top 50 economics journals in Ritzberger (2008) for the period
2005-2009 and for the period 2000-2004, respectively. There are 25 institutions
ranked for the period 2005-2009 and only 13 for the period 2000-2004. The No. 1 in
the ranking is Hong Kong University of Science and Technology in both periods. In
total, there are five institutions from Hong Kong in the Top 10 during the period
2005-2009, same result with the ranking of all SSCI publications. The other five
institutions are from mainland China and include Peking University (3), Tsinghua
University (7), Shanghai University of Finance and Economics (8), Xiamen
University (9) and Shanghai Jiaotong University (10). Now we find a huge gap
between the mainland and Hong Kong in terms of publications in top journals. For
instance, Peking University only published 54% of the amount of Hong Kong
University of Science and Technology during the period 2005-2009 in Top 50
economics journals. Shanghai Jiaotong University even published only about 9% of
Hong Kong University of Science and Technology. However, the quality in mainland
institutions in general is not significantly lower than in Hong Kong institutions.
Rather, the quality is somehow higher in the mainland. The Top 5 institutions in terms
of quality are Shanghai Jiaotong University, Shanghai University of Finance and

18
Economics, City University of Hong Kong, Tsinghua University, and Hong Kong
University of Science and Technology.
If we look at the ranking of Independent Ability (IA) for the Top 50
economics journals, similar with the rankings considering all SSCI publication, we
also find a huge gap between the mainland and Hong Kong. The IA ranks of the five
mainland institutions in the Top 10 of the quantity rankings are No. 8 (Peking
University), No. 14 (Tsinghua University), No.10 (Shanghai University of Finance
and Economics), No. 13 (Xiamen University), and No.9 (Shanghai Jiaotong
University), which are significantly lower than those of their counterparts in Hong
Kong.
4. Conclusion
Using the SSCI economics journals (2000-2009), this paper ranks the
economic research institutions in China by their publications and finds the Top 5
institutions in terms of quantity to be the Hong Kong University of Science and
Technology, the Chinese University of Hong Kong, Peking University, the University
of Hong Kong, and the City University of Hong Kong. This is true both in the period
2000-2004 and in the period 2005-2009. The fact that four of these institutions are
from Hong Kong indicates that the gap of the research ability between the mainland
and Hong Kong is still very large. This gap is even much more pronounced in the
ranking of Top 50 economics journals.
Some universities in mainland China are dramatically reforming their
economics education systems, which is also reflected by the rankings. Compared with
the period 2000-2004, some mainland universities such as Peking University,
Tsinghua University, the Shanghai University of Finance and Economics, and Xiamen
University have quickly improved their publications. In addition, the overall quality
19
difference between the mainland institutions and Hong Kong institutions is not so
significant.
In order to quickly improve their publications, some institutions opt for the
strategy of publishing short and low-quality papers or for the strategy of “borrowing
chicken to lay eggs”, which involves hiring short-term visiting scholars from other
universities, buying some co-authorships from good economists, or encouraging their
own scholars to coauthor with high-level scholars from abroad in order to increase the
counts of the publications. These strategies water a lot in the publications. The
rankings have revealed that the independent ability of the mainland institutions is still
very low compared with that of their counterparts in Hong Kong.
It should be mentioned that the rankings in this paper only consider English-
language economics publications, not including the publications in Chinese language.
Therefore, this research only reflects one dimension of the research abilities of
Chinese economic research institutions. The ranking methods provided by this paper
can be extended to the ranking of economics publications in Chinese language, which
may be a promising research topic for the future.

20
References: Coupé T. (2003) “Revealed Performances: Worldwide Rankings of Economists and Economics Departments, 1990-2000,” Journal of the European Economic Association, vol. 1(6):1309-1345. Bradley, R. A. and M. E. Terry (1952), “Rank Analysis of Incomplete Block Designs:
I. The Method of Paired Comparisons”, Biometrika 39, 324–345.
Dusansky, R. and V. Clayton J. (1998) “Rankings of U.S. Economics Departments” Journal of Economic Perspectives, vol. 12(1):157-170. Engemann K. M. and Wall H. J. (2009) “ Journal Ranking for the Ambitious
Economist, ” Federal Reserve Bank of St. Louis Review, May/June 2009, 91(3), pp. 127-39.
Hirsch, B., Austin, R., Brooks, J. and Moore, J. (1984), “Economics Departmental Rankings: Comments”, American Economic Review, vol.74, nr. 4, p. 822-826. Hirsch, J. E. (2004), “An Index to Quantify an Individual’s Scientific Research
Output”, Proceedings of the National Academy of Sciences,102, 16569–16572. Jemec, G. B. (2001), "Impact Factor to Assess Academic Output", The Lancet 358,
1373. Jin, J. and Yau, L. (1999), “Research Productivity of the Economics Profession in
East Asia.” Economic Inquiry, vol. 37(4): 706-710.
Kalaitzidakis P., T. P. Mamuneas and T. Stengos (2003) “Rankings of Academic Journals and Institutions in Economics” Journal of the European Economic Association, Vol. 1(6):1346-1366. Koczy, L. A. and M. Strobel (2007), ‘The Ranking of Economics Journals by a
Tournament Method’, mimeo. Kodrzycki, Y. K. and P. Yu (2006), ‘New Approaches to Ranking Economic
Journals’, Contributions to Economic Analysis and Policy 5, Art. 24. Laffont, J. (1999), “Economics Research in Europe,” European Economic Review,

21
vol. 43,1149. Liebowitz, S. J. and J. C. Palmer (1984), “Assessing the Relative Impacts of
Economics Journals”, Journal of Economic Literature vol.22, 77–88. Palacio-Huerta, I. and O. Volij (2004), “The Measurement of Intellectual Influence”,
Econometrica vol.72, 963–977. Ritzberger K. (2008) “A Ranking of Journals in Economics and Related Fields.”
German Economic Review 9(4): 402–430. Rupp N. G and C. N. McKinney Jr (2002) “The Publication Patterns of the Elite
Economics Departments: 1995-2000,” Eastern Economic Journal, Vol.28(4):523-537.
Tschirhart J. (1989) “Ranking Economics Departments in Areas of Expertise.” The
Journal of Economic Education, Vol. 20(2):199-222. Yu Xiaohua (2008) “Rankings of Economic Research Institutions in China.” (in
Chinese), China Economic Quarterly, Vol. 7(4):1477-1490.

22
Figure 1 Publications of Economics Papers in China (1980-2009)
0
50
100
150
200
250
300
350
400
1981
1983
1985
1987
1989
1991
1993
1995
1997
1999
2001
2003
2005
2007
2009
year
ChinaHong Kong
23
Table 1 The 20 Most Published Journals by Chinese Institutions (2000-2009)
Journal Name Number of
Publications Percent (%)
1 CHINA & WORLD ECONOMY 101 5.35
2 INSURANCE MATHEMATICS & ECONOMICS 95 5.03
3 CHINA ECONOMIC REVIEW 85 4.50
4 ECONOMICS LETTERS 82 4.34
5 JOURNAL OF BANKING & FINANCE 74 3.92
6 APPLIED ECONOMICS LETTERS 53 2.81
7 JOURNAL OF COMPARATIVE ECONOMICS 47 2.49
8 JOURNAL OF ECONOMETRICS 46 2.44
9 ECOLOGICAL ECONOMICS 38 2.01
10 APPLIED ECONOMICS 36 1.91
11 JOURNAL OF FINANCIAL ECONOMICS 36 1.91
12 JOURNAL OF ECONOMIC DYNAMICS &
CONTROL 34 1.80
13 HEALTH ECONOMICS 29 1.54
14 JOURNAL OF DEVELOPMENT ECONOMICS 26 1.38
15 ECONOMIC MODELLING 25 1.32
16 WORLD ECONOMY 25 1.32
17 ECONOMIC THEORY 24 1.27
18 JOURNAL OF ECONOMIC BEHAVIOR &
ORGANIZATION 24 1.27 19 PACIFIC ECONOMIC REVIEW 24 1.27
20 WORLD DEVELOPMENT 24 1.27 Summary 928 49.13
Note: The total number of the publication is 1889.
24
Table 2 2005-2009 Ranking by the Total Publications in the SSCI Institutions P RP ARP RPG ARPG ARPG-R AVPG Q IA
Hong Kong Univ. Sci. & Tech. 110 4 64.97 4 170.86 2 1250.65 3 3411.71 1 3392.47 1 19.25 4 2.63 4 0.59 17
Chinese Univ. Hong Kong 127 2 71.44 3 165.65 4 1339.3 1 3147.61 2 3147.61 2 18.75 6 2.32 9 0.56 24
Peking University 149 1 81.31 1 182.9 1 1298.51 2 3056.73 3 2868.91 3 15.97 21 2.25 16 0.55 26
University Hong Kong 120 3 73.71 2 168.34 3 1202.78 4 2780.14 4 2758.7 4 16.32 19 2.28 10 0.61 14
City Univ. Hong Kong 84 5 39.45 5 86.45 5 705.09 5 1585.76 5 1585.76 5 17.87 9 2.19 18 0.47 39
Tsinghua Univ. 81 6 37.58 6 85.04 6 667.36 6 1548.62 6 1442.21 6 17.76 10 2.26 14 0.46 40
Lingnan University 54 7 34.21 7 77.81 7 526.15 7 1252.05 7 1252.05 7 15.38 24 2.27 12 0.63 10
Shanghai Univ. Fiance & Econ. 33 14 17.17 14 47.55 10 291.58 13 830.1 10 830.1 8 16.99 13 2.77 2 0.52 32
Chinese Academy of Sci. 50 8 29.49 9 59.01 9 464.5 9 970.45 8 812.94 9 15.75 23 2 26 0.59 19
Hong Kong Polytech Univ. 34 13 19.04 11 42.02 11 300.71 12 691.82 11 691.82 10 15.79 22 2.21 17 0.56 25
Xiamen Univ. 29 15 10.48 22 26.04 18 204.77 18 524.67 15 509 11 19.53 3 2.48 5 0.36 46
Zhejiang Univ. 36 12 18.37 13 34.5 13 304.42 11 576.01 13 492.99 12 16.57 16 1.88 31 0.51 35
Cent Univ Finance & Econ 41 10 18.49 12 34.44 14 280.83 14 538.37 14 436.32 13 15.19 27 1.86 32 0.45 42
Chinese Academy of Social Sci. 42 9 32.48 8 59.64 8 489.3 8 948.77 9 425.11 14 15.06 29 1.84 35 0.77 3
Shanghai Jiaotong Univ. 25 17 13.17 18 32.54 15 179.33 22 482.14 16 421.66 15 13.62 32 2.47 6 0.53 29
Renmin Univ. China 37 11 20.44 10 34.85 12 337.72 10 576.81 12 369.69 16 16.52 17 1.7 42 0.55 28
Hong Kong Baptist Univ. 19 21 11.83 20 23.46 20 189.17 19 350.25 22 350.25 17 15.99 20 1.98 27 0.62 13
Nankai Univ. 20 18 14 15 30.67 16 185.25 20 399.26 19 337.68 18 13.23 34 2.19 19 0.7 6
Macau Univ. 19 21 10 24 20.39 23 152.33 23 321.51 23 307.49 19 15.23 26 2.04 22 0.53 30
Fudan Univ. 29 15 13.9 16 27.97 17 213.63 17 423.49 17 302.81 20 15.37 25 2.01 24 0.48 38
Beijing Normal Univ. 18 22 10.65 21 21.55 21 184.47 21 361.6 21 298.56 21 17.32 11 2.02 23 0.59 18
Univ Int Busines & Econ 20 18 13.42 17 23.93 19 225.25 15 402.71 18 293.85 22 16.79 14 1.78 39 0.67 7
Hong Kong Monetary Authority 20 18 12 19 21.51 22 218.67 16 393 20 275.9 23 18.22 8 1.79 37 0.6 16
Sun Yat Sen Univ. 17 23 10.11 23 18.68 24 124.44 25 235.2 24 198.64 24 12.31 36 1.85 34 0.59 20
China Agr. Univ. 15 24 7.42 27 14.94 25 109.92 27 218.86 26 171.03 25 14.82 30 2.01 25 0.49 36
SW Univ. Econ & Finance, 13 26 8.75 26 14.21 26 146.5 24 233.58 25 166.78 26 16.74 15 1.62 44 0.67 8

25
Hunan Univ. 13 26 9.58 25 11.48 28 109.42 28 134.03 28 134.03 27 11.42 37 1.2 49 0.74 4
Cheung Kong Grad Sch Business, 4 39 1.5 49 4.4 42 43.75 36 130.71 29 130.71 28 29.17 1 2.93 1 0.38 45
Xi An Jiao Tong Univ. 10 28 5.83 30 11.38 29 61.83 30 119.5 30 119.5 29 10.6 40 1.95 29 0.58 22
World Bank, Beijing Office 4 39 2.5 41 4.74 40 58 34 112.49 31 100.94 30 23.2 2 1.89 30 0.63 11
Jinan Univ. Guangzhou 8 31 4.39 33 7.8 36 59.01 32 109.08 32 100.28 31 13.43 33 1.78 40 0.55 27
Nanjing Univ. 9 29 7.13 28 11.58 27 60.13 31 100.19 35 100.19 32 8.43 46 1.62 45 0.79 2
E China Normal Univ. 9 29 4.33 34 9.86 32 41 37 90.73 36 90.73 33 9.46 42 2.28 11 0.48 37
National Bur Stat 3 49 2.5 40 6.15 38 36.5 40 87.98 37 87.98 34 14.6 2.46 0.83
Wuhan Univ. 15 24 6.97 29 10.22 31 119.75 26 169.8 27 87.47 35 17.18 12 1.47 46 0.46 41
Beijing Univ Aeronaut & Astronaut 4 39 2.08 47 4.38 43 39.67 39 79.87 38 79.87 36 19.04 5 2.1 21 0.52 34
Univ. Sci & Tech, China 7 33 4.48 32 10.65 30 31.87 42 77.29 39 77.29 37 7.11 47 2.38 8 0.64 9
N China Elct Power Univ. 4 39 4 35 8.52 34 35 41 75.78 40 75.78 38 8.75 44 2.13 20 1 1
China Europe Int Business Sch. 5 35 3.17 37 5.53 39 58.33 33 103.04 34 73.35 39 18.42 7 1.75 41 0.63 12
Suzhou Univ. 7 33 3.67 36 8.3 35 31 43 70.25 41 70.25 40 8.45 45 2.26 15 0.52 33
Shandong Univ. 8 31 4.89 31 8.77 33 61.93 29 108.47 33 57.34 41 12.66 35 1.79 38 0.61 15
Northwestern Univ. Xi An 5 35 2.67 39 3.91 46 40.5 38 53.78 42 53.78 42 15.19 28 1.47 47 0.53 31
China Acad Ag Sci 3 49 1.17 61 2.42 58 22.17 49 48.5 45 48.5 43 19 2.07 0.39
Tongji Univ. 3 49 1.5 50 3.22 51 21.25 50 46.2 46 46.2 44 14.17 2.15 0.5
Huazhong Univ. ST 4 39 2.33 44 4.59 41 23.33 48 43.64 47 43.64 45 10 41 1.97 28 0.58 21
Chongqing Univ. 3 49 2.5 43 4.24 45 26 45 39.83 48 39.83 46 10.4 1.7 0.83
Harbin Inst Tech. 3 49 1.25 59 3.05 52 16.5 56 39.5 49 39.5 47 13.2 2.44 0.42
Guizhou Univ. 4 39 1.28 58 3.51 49 14.44 58 38.65 50 38.65 48 11.3 38 2.74 3 0.32 47
Lanzhou Univ. 4 39 2.33 45 3.38 50 25.17 46 36.78 51 36.78 49 10.79 39 1.45 48 0.58 23
E China Univ. Sci& Tech 3 49 0.8 69 1.64 64 18.2 55 36.03 52 36.03 50 22.75 2.04 0.27
Hebei Univ. Tech 3 49 1.33 55 2.42 57 20.17 51 32.09 54 32.09 51 15.13 1.81 0.44
Southeast Univ. 2 58 1 62 2.08 59 15 57 31.39 55 31.39 52 15 2.08 0.5
S China Normal Univ. 4 39 2.83 38 6.84 37 12.67 61 29.66 56 29.66 53 4.47 49 2.41 7 0.71 5
Hong Kong Shue Yan Univ. 3 49 2.5 42 4.28 44 20 52 27.13 58 27.13 54 8 1.71 0.83

26
Henan Agr Univ. 4 39 0.88 65 1.62 65 14.38 59 26.77 59 26.77 55 16.43 18 1.85 33 0.22 49
State Informat Ctr, 2 58 1.25 60 1.38 70 24.5 47 25.82 60 25.82 56 19.6 1.11 0.63
Northwestern Polytech Univ. 2 58 0.83 67 1.51 66 13.67 60 25.82 61 25.82 57 16.4 1.81 0.42
Cent S Uni Tech 2 58 1.33 54 2.8 53 11.67 65 24.95 62 24.95 58 8.75 2.1 0.67
Nanjing Agr Univ. 5 35 2.17 46 3.63 48 29.83 44 49.93 43 24.37 59 13.77 31 1.68 43 0.43 43
Zhongnan Univ. Econ& Law 2 58 0.63 72 1.42 69 10.5 68 23.72 63 23.72 60 16.8 2.27 0.31
Sichuan Univ. 4 39 1.69 48 3.85 47 10.53 67 23.46 64 23.46 61 6.21 48 2.27 13 0.42 44
Inner Mongolia Univ. 2 58 0.67 71 1.18 72 12.33 63 22.01 66 22.01 62 18.5 1.77 0.33
Qingdao Univ. 2 58 0.83 66 2.02 61 8.17 73 21.92 68 21.92 63 9.8 2.42 0.42
Univ Elect Sci & Technol China, Chengdu 2 58 0.92 64 1.79 63 11 66 21.54 69 21.54 64 12 1.96 0.46
Shanghai Acad Agr Sci 2 58 1.5 52 2.6 55 12 64 20.84 70 20.84 65 8 1.74 0.75
Northwestern Normal Univ. 2 58 0.83 68 1.47 68 9.17 71 16.82 72 16.82 66 11 1.76 0.42
Bank china 2 58 1.5 51 2.63 54 19.5 53 34.87 53 16.73 67 13 1.76 0.75
S China Univ. Tech 2 58 0.67 70 1.32 71 8.33 72 16.11 73 16.11 68 12.5 1.97 0.33
Beijing Forestry Univ. 3 49 0.92 63 2.06 60 10 69 21.96 67 15.36 69 10.91 2.24 0.31
Guizhou Normal Univ. 2 58 0.46 74 1.17 73 4.67 75 11.69 74 11.69 70 10.18 2.55 0.23
State Environmen Protect Adm China 2 58 0.45 75 0.73 75 7.05 74 11.43 75 11.43 71 15.67 1.62 0.23
Jiangxi Univ. Finance & Econ. 5 35 1.38 53 2.51 56 12.54 62 22.91 65 11.36 72 9.12 43 1.82 36 0.28 48
Zhejiang Gongshang Univ 2 58 0.53 73 0.93 74 10 70 17.82 71 9.02 73 18.75 1.75 0.27
BBVA, Hong Kong, 2 58 1.33 56 1.98 62 19.33 54 27.77 57 6.33 74 14.5 1.49 0.67
Fuzhou Univ. 2 58 1.33 57 1.48 67 47.33 35 48.81 44 4.81 75 35.5 1.11 0.67
Note: (1) We only rank institutions with 2 or more publications;
(2) We only calculate the AVPG, the Quality, and the IA for institutions with 4 or more publications;
(3) The publications of the CCAP (Center for Chinese Agricultural Policy), Chinese Academy of Sciences, can be ranked in No. 18 in 2005-2009 by the ARPG index.
27
Table 3 2000-2004 Ranking by the Total Publications in the SSCI P RP ARP RPG ARPG AVPG Q IA
Institutions Value Rank Value Rank Value Rank Value Rank Value Rank Value Rank Value Rank Value Rank
Chinese Univ. Hong Kong 125 1 79.03 1 195.71 1 1361.08 2 4259.39 1 17.22 8 2.48 6 0.63 7
Hong Kong Univ. Sci. & Tech. 119 2 66.04 2 194.03 2 1396.97 1 3547.01 2 21.15 2 2.94 1 0.55 10
University Hong Kong 85 3 55.48 3 146.83 3 975.57 3 2697.7 3 17.58 6 2.65 4 0.65 6
City Univ. Hong Kong 65 4 37.58 4 92.72 4 627.17 4 1641.75 4 16.69 11 2.47 8 0.58 9
Peking University 52 5 31 5 76.62 5 521.67 5 1333.19 5 16.83 9 2.47 7 0.6 8
Hong Kong Polytech Univ. 37 6 25.33 6 59.66 6 514.17 6 1252.13 6 20.3 4 2.35 9 0.68 4
Lingnan University 34 7 24.83 7 58.05 7 369.33 7 891.35 7 14.87 13 2.34 10 0.73 3
Chinese Academy of Sci. 31 8 14.83 8 33.55 8 256.33 8 598.51 8 17.28 7 2.26 12 0.48 13
Hong Kong Baptist Univ. 21 9 14 9 30.56 9 234.33 9 523.95 9 16.74 10 2.18 14 0.67 5
Wuhan Univ. 13 11 5.33 11 14.21 11 110.17 10 303.97 10 20.66 3 2.67 3 0.41 16
Tsinghua Univ. 14 10 5.7 10 15.4 10 102.25 11 287.35 11 17.94 5 2.7 2 0.41 15
Xiamen Univ. 3 19 2.33 18 7 15 78 12 153.42 12 33.43 3 0.78
Zhejiang Univ. 5 15 4 12 7.01 14 45.33 15 143.28 13 11.33 15 1.75 17 0.8 2
HK Monetary Authority 7 13 3 15 7.73 12 63.98 13 128.03 14 21.33 1 2.58 5 0.43 14
Tongji Univ. 3 19 1.5 23 2.45 25 21.5 24 111.82 15 14.33 1.63 0.5
Shanghai Univ. Fiance & Econ. 2 24 1.25 26 2.17 26 36 18 94.11 16 28.8 1.73 0.63
National Bur Stat 4 18 3.33 13 7.43 13 49.83 14 94.02 17 14.95 12 2.23 13 0.83 1
Goldman Sachs Co Beijing 2 24 1.5 24 4.73 18 45.33 16 76.3 18 30.22 3.15 0.75
Chinese Acad Agr Sci 6 14 3.17 14 6.5 16 36 17 64.43 19 11.37 14 2.05 15 0.53 11
Chinese Academy of Social Sci. 8 12 2.95 16 4.24 20 33 19 55.23 20 11.19 17 1.44 18 0.37 18
Nanjing Agr Univ. 2 24 1.5 25 3.29 24 32.5 20 52.04 21 21.67 2.19 0.75
Renmin Univ. China 2 24 0.83 30 1.44 30 17.75 25 46.31 22 21.3 1.72 0.42
Nankai Univ. 5 15 2.5 17 5.75 17 28 21 45.68 23 11.2 16 2.3 11 0.5 12
Fudan Univ. 3 19 1.08 28 1.92 28 16.5 26 39.03 24 15.23 1.78 0.36
State Council DRC 2 24 0.75 32 1.89 29 15 27 38.37 25 20 2.52 0.38

28
Chongqing Univ. 5 15 2 19 3.57 22 14 28 38.13 26 7 18 1.79 16 0.4 17
Nanjing Univ. 3 19 2 20 3.89 21 27.5 22 35.46 27 13.75 1.95 0.67
Suzhou Univ. 3 19 2 21 4.6 19 24 23 28.74 28 12 2.3 0.67
SW Univ Econ & Finance, 2 24 1.25 27 2.12 27 13.75 29 21.23 29 11 1.69 0.63
Open Univ. Hong Kong 2 24 2 22 3.29 23 13.25 30 19.06 30 6.63 1.64 1
Sun Yat Sen Univ. 2 24 1 29 1.42 31 11 31 17.75 31 11 1.42 0.5
E china Normal Univ. 2 24 0.83 31 1.38 32 11 32 16.62 32 13.2 1.65 0.42
Sichuan Univ. 2 24 0.33 33 0.66 33 5 33 9.84 33 15 1.97 0.17
Note: (1) We only rank institutions with 2 or more publications;
(2) We only calculate the AVPG, the Quality, and the IA for institutions with 4 or more publications;
(3) The publications of CCAP (Center for Chinese Agricultural Policy), Chinese Academy of Sciences, can be ranked in No. 10 in 2000-2004 by the ARPG index.

29
Table 4 2005-2009 Ranking by the Publications in Top 50 Economics Journals P RP ARP RPG ARPG AVPG Q IA Institutions
Value Rank Value Rank Value Rank Value Rank Value Rank Value Rank Value Rank Value Rank
Hong Kong Univ. Of Sci. & Tech. 58 1 32.91 1 112.42 1 713.18 1 2445.61 1 21.67 6 3.42 5 0.57 6
Chinese Univ. Hong Kong 47 2 24.66 2 80.14 2 494.99 2 1614.86 2 20.07 11 3.25 10 0.52 7 Peking University 37 3 17.36 4 68.53 3 438.24 3 1322.93 3 19.96 12 3.36 7 0.47 8
University Hong Kong 33 4 21.95 3 58.29 4 395.88 4 1367.32 4 22.81 2 3.12 12 0.67 1
Lingnan University 17 7 10.75 5 31.70 6 200.69 5 732.21 5 22.01 4 3.12 13 0.63 2 City Univ. Hong Kong 19 6 7.61 7 33.55 5 198.83 6 577.98 6 18.50 15 3.55 3 0.40 12
Tsinghua Univ. 28 5 9.12 6 27.01 7 157.84 7 622.43 7 20.75 9 3.48 4 0.33 14
Shanghai Univ Finance & Econ. 16 8 7.42 8 26.35 8 154.00 8 550.21 8 20.76 8 3.55 2 0.46 10
Xiamen Univ. 14 9 5.32 9 17.36 9 116.02 9 385.73 9 21.82 5 3.27 9 0.38 13 Shanghai Jiaotong Univ. 8 11 3.67 11 15.28 10 88.00 10 220.39 10 19.26 14 3.83 1 0.46 9
Chinese Academy of Sci. 6 13 3.58 13 12.04 12 76.05 11 275.27 11 22.11 3 3.30 8 0.61 4
Chinese Academy of Social Sci. 6 13 3.65 12 14.03 11 70.67 12 274.99 12 17.60 16 3.13 11 0.60 5 Central Univ. Fiance & Econ. 9 10 2.69 14 11.20 13 69.00 13 251.14 13 19.27 13 3.39 6 0.30 15
Hong Kong Polytech Univ. 8 11 5.00 10 9.12 14 59.58 14 231.21 14 20.84 7 3.06 14 0.62 3
Macau Univ. 4 15 1.83 15 5.30 15 35.83 15 101.38 15 20.29 10 3.02 15 0.29 16
Fudan Univ. 3 17 1.25 17 3.42 20 29.25 16 71.84 16 23.67 3.25 0.28
China Agri. Univ. 2 21 1.17 19 3.69 17 27.50 17 102.27 17 19.55 2.95 0.75
Beijing Normal Univ 3 17 0.90 21 4.43 16 26.50 18 85.10 18 29.25 3.42 0.33 Zhejiang Univ. 4 15 1.17 18 2.70 22 25.75 19 81.91 19 30.90 1 2.89 16 0.46 11
Nankai Univ. 2 21 1.50 16 3.52 19 23.67 20 69.49 20 17.67 3.15 0.22 Cheung Kong Grad Sch of Business 3 17 1.00 20 2.90 21 21.30 21 75.89 21 22.00 2.95 0.42
Renmin Univ. China 3 17 0.83 22 3.65 18 13.17 23 36.43 22 19.33 3.23 0.30
Guizhou Univ. 2 21 0.61 23 1.40 25 11.67 25 17.69 23 19.00 3.12 0.58 Wuhan Univ. 2 21 0.44 25 1.54 24 5.50 35 17.71 24 13.00 3.08 0.25
Hong Kong Baptist Univ. 2 21 0.50 24 1.95 23 5.44 37 16.92 25 11.00 3.19 0.31
Note: (1) We only rank institutions with 2 or more publications; (2) We only calculate the AVPG, the Quality, and the IA for institutions with 4 or more publications
(3) The publications of Chinese Academy of Sciences include the publications of CCAP (Center for Chinese Agricultural Policy), Chinese Academy of Sciences.

30
Table 5 2000-2004 Ranking by the Publications in Top 50 Economics Journals P RP ARP RPG ARPG AVPG Q IA Institutions
Value Rank Value Rank Value Rank Value Rank Value Rank Value Rank Value Rank Value Rank
Hong Kong Univ. Sci. & Tech. 81 1 43.01 1 143.06 1 992.24 1 3349.69 1 23.07 3 3.33 3 0.53 5
Chinese Univ. Hong Kong 47 2 28.92 2 93.80 2 621.75 2 2019.04 2 21.50 5 3.33 3 0.48 6 University Hong Kong 41 3 24.92 3 81.34 3 508.67 3 1680.02 3 20.41 6 3.16 8 0.34 9
City Univ. Hong Kong 25 4 12.67 4 43.65 4 248.42 4 870.69 4 19.61 9 3.19 7 0.54 4
Peking University 21 5 10.08 5 31.56 5 201.25 5 636.91 5 19.96 7 3.48 1 0.62 2 Hong Kong Polytech Univ. 6 9 4.33 7 14.44 7 104.83 7 373.19 6 15.93 10 2.87 10 0.27 10
Lingnan University 10 6 6.83 6 21.02 6 108.83 6 344.81 7 24.19 1 3.26 5 0.68 1
Wuhan University 7 7 3.00 8 9.48 8 59.17 8 185.68 8 19.72 8 3.19 6 0.43 7
Chinese Academy of Sci. 4 10 2.17 9 7.35 9 47.17 10 181.84 9 21.77 4 3.08 9 0.42 8 Tsinghua u 6 8 2.03 10 7.07 10 48.75 9 157.49 10 23.98 2 3.45 2 0.61 3
HK Baptist 3 11 2.00 11 6.37 11 44.00 11 146.16 11 22.00 3.13 0.67
CCAP, Chinese Academy of Sci. 2 13 0.83 12 2.66 12 16.83 12 52.37 12 20.20 3.39 0.51 Chinese Academy of Social Sci. 2 12 0.53 13 1.53 13 13.07 13 37.55 13 24.50 3.24 0.72
Note: (1) We only rank institutions with 2 or more publications; (2) We only calculate the AVPG, the Quality, and the IA for institutions with 4 or more publications;
(3) The publications of Chinese Academy of Sciences include the publications of CCAP (Center for Chinese Agricultural Policy), Chinese Academy of Sciences.