an update to ifrs 9 ecl benchmark: the focus on
TRANSCRIPT
March 2021
An Update to IFRS 9 ECL Benchmark: The Focus on Disclosures with COVID-19 Shock and Additional Stress Testing

March 2021
IFRS 9 ECL Benchmarking after the Peak of COVID-19 and Multi-Period ECL Forecasting
Yashan Wang, Senior Director Quantitative Research and Modeling

IFRS 9 Benchmarking and ECL Forecasting, March 2021 3
1. IFRS 9 ECL benchmarking for Q4-2020 and Q1-2021 reporting2. ECL forecasting under the EBA 2021 scenarios
Agenda
Joint work with May Jeng, Lily Kong, and Warren Xu

IFRS 9 Benchmarking and ECL Forecasting, March 2021 4
Modeling FrameworkMacroeconomic Scenario Forecasts
Scenario Probability Weights
GCorrTM Macro 2019 to Calculate Scenario-Conditioned PD & LGD
Moody’s Analytics Through-the-Cycle (TTC) to Point-in-Time (PIT) PD Converter
Default and Recovery Risk Measures
» Forecasts of GDP growth, unemployment rate, equity price index, oil price, etc.
» Moody’s Analytics scenarios including baseline, upside (S1), and downside (S3); regulatory scenarios such as CCAR and EBA
» Moody’s preset (Baseline-40%, S1-30%, S3-30% in this study) or user input
» Produce PIT PD term structures; the underlying PIT PDs are from the Moody’s Analytics CreditEdgeTM EDF™ (Expected Default Frequency) model
» Through-the-Cycle PD, or external or internal rating» LGD (assumed=40%)
Expected Credit Loss
Exposure at Default
Discount Factor XX =
IFRS 9 Benchmarking and ECL Forecasting, March 2021 5
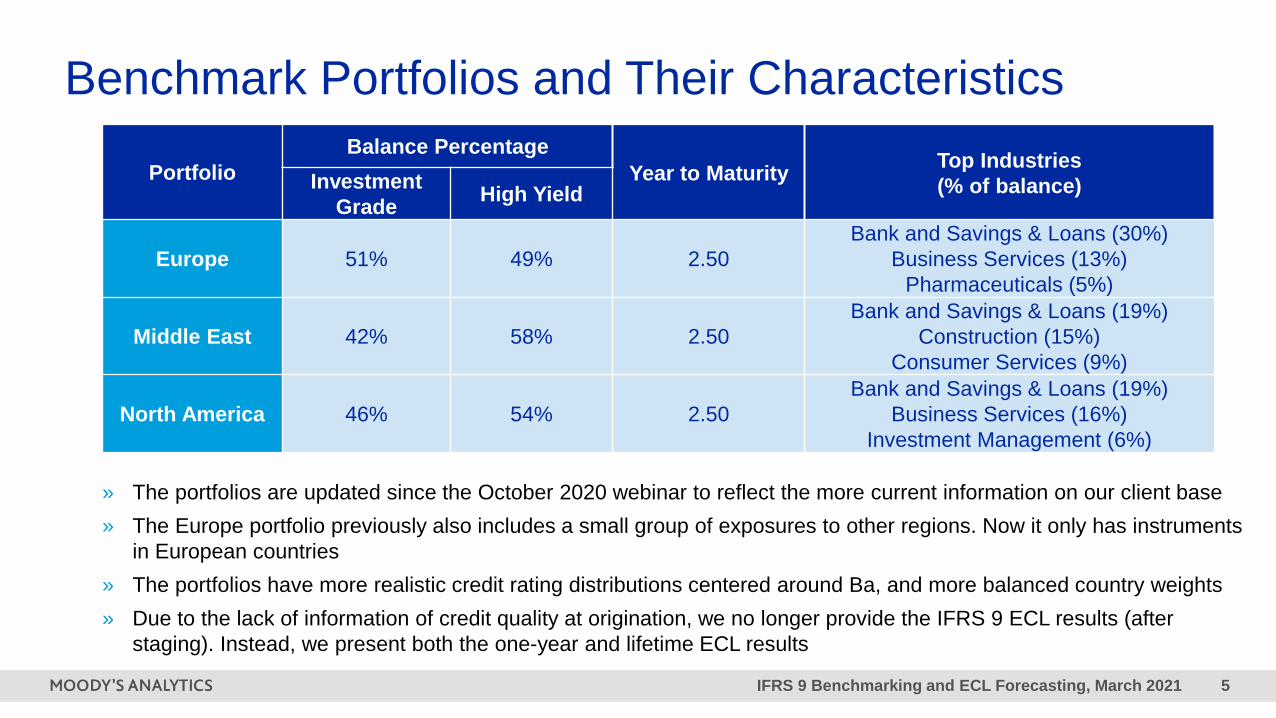
Benchmark Portfolios and Their Characteristics
» The portfolios are updated since the October 2020 webinar to reflect the more current information on our client base» The Europe portfolio previously also includes a small group of exposures to other regions. Now it only has instruments
in European countries» The portfolios have more realistic credit rating distributions centered around Ba, and more balanced country weights» Due to the lack of information of credit quality at origination, we no longer provide the IFRS 9 ECL results (after
staging). Instead, we present both the one-year and lifetime ECL results
PortfolioBalance Percentage
Year to Maturity Top Industries(% of balance)Investment
Grade High Yield
Europe 51% 49% 2.50Bank and Savings & Loans (30%)
Business Services (13%)Pharmaceuticals (5%)
Middle East 42% 58% 2.50Bank and Savings & Loans (19%)
Construction (15%)Consumer Services (9%)
North America 46% 54% 2.50Bank and Savings & Loans (19%)
Business Services (16%)Investment Management (6%)

IFRS 9 Benchmarking and ECL Forecasting, March 2021 6
Benchmarking Methodology» To assess how the ECL evolves since the peak of COVID-19, we conduct a sequence of analysis runs. The analysis runs
are divided into two groups in the table below to separate the effect of1. Reporting date change and scenario forecast update2. PIT PD update
» Within each group, the new information/setting is shown in red font and boldface from the previous run» We will first focus on the February scenario patterns and treatment in the Q1-2021 runs, then show the PIT PD impact
Group Analysis Run Reporting Date
First Quarter of Forecast
Moody’s rating to PIT PD Converter
Moody’s Analytics Scenarios
PIT PD Update
Q4 Unconditional Run –September PIT PD
31 December2020 Q1-2021 Credit Market Information up to
September 2020 Unconditional
Q1 Unconditional Run –December PIT PD
31 March 2021 Q2-2021 Credit Market Information up to
December 2020 Unconditional
No scenario modification is used in this study. For USA, VIX is excluded in the MEV set.
Group Analysis Run Reporting Date
First Quarter of Forecast
Moody’s rating to PIT PD Converter
Moody’s Analytics Scenarios
Reporting Date and Scenario
Update
Q4 Run – Nov Scenarios & September PIT PD
31 December2020 Q1-2021 Credit Market Information up to
September 2020Forecasts made in
Nov 2020
Q1 Run – Feb Scenarios & September PIT PD
31 March2021 Q2-2021 Credit Market Information up to
September 2020Forecasts made
in Feb 2021

IFRS 9 Benchmarking and ECL Forecasting, March 2021 7
Scenario and Reporting Date Update
Portfolio Analysis RunLifetime ECL Rate One-Year ECL Rate
Baseline S1 S3 Baseline S1 S3
Europe Q4 Run – Nov Scenarios 0.43% 0.32% 1.04% 0.33% 0.24% 0.90%Q1 Run – Feb Scenarios 0.42% 0.33% 0.96% 0.30% 0.23% 0.78%
Middle East Q4 Run – Nov Scenarios 1.13% 0.97% 2.17% 0.84% 0.71% 1.67%Q1 Run – Feb Scenarios 1.36% 1.15% 2.37% 0.98% 0.81% 1.77%
North America
Q4 Run – Nov Scenarios 0.92% 0.52% 2.31% 0.67% 0.39% 1.98%Q1 Run – Feb Scenarios 1.00% 0.61% 2.73% 0.70% 0.40% 2.26%
» For Europe, the February scenarios produce ECL results very similar to the November scenarios, although there are variations among countries within Europe
» For Middle East and North America, the February scenarios are more pessimistic than the November scenarios
» To illustrate the scenario and reporting date update effect, we compare Q4-2020 and Q1-2021 runs with November and February scenario forecasts respectively, while keeping the same PIT PDs reflecting credit information up to September 2020
Portfolio Analysis RunLifetime ECL Rate One-Year ECL Rate
Baseline S1 S3 Baseline S1 S3
Europe Q4 Run – Nov Scenarios 0.43% 0.32% 1.04% 0.33% 0.24% 0.90%Q1 Run – Feb Scenarios 0.42% 0.33% 0.96% 0.30% 0.23% 0.78%

IFRS 9 Benchmarking and ECL Forecasting, March 2021 8
Europe Highlight – Germany
» Comparing the February baseline scenario with the November baseline forecast, the Germany equity index shows recovery instead of stress in the first quarter, the Germany GDP shows a slightly more optimistic trajectory, and the Eurozone unemployment rate shows less initial stress. The combined effect from the MEVs drives ECL slightly lower in Q1-2021 reporting than Q4-2020 reporting
» Under the S3 scenarios, the Germany equity index shows less strong recovery in the longer term in the February forecast; the other two MEVs show some differences in the near term in the February forecast from the November one, but very similar long-term trajectories. The ECL rate in Q1-2021 is slightly lower than that in Q4-2020
7000
9000
11000
13000
15000
Mar
2020
Jun2
020
Sep2
020
Dec2
020
Mar
2021
Jun2
021
Sep2
021
Dec2
021
Mar
2022
Jun2
022
Sep2
022
Dec2
022
Germany Equity
2600
2800
3000
3200
3400
Mar
2020
Jun2
020
Sep2
020
Dec2
020
Mar
2021
Jun2
021
Sep2
021
Dec2
021
Mar
2022
Jun2
022
Sep2
022
Dec2
022
Germany GDP
Nov Baseline Nov S3 Feb Baseline Feb S3
6
8
10
12
14
Mar
2020
Jun2
020
Sep2
020
Dec2
020
Mar
2021
Jun2
021
Sep2
021
Dec2
021
Mar
2022
Jun2
022
Sep2
022
Dec2
022
Eurozone Unemployment Rate
IFRS 9 Benchmarking and ECL Forecasting, March 2021 9
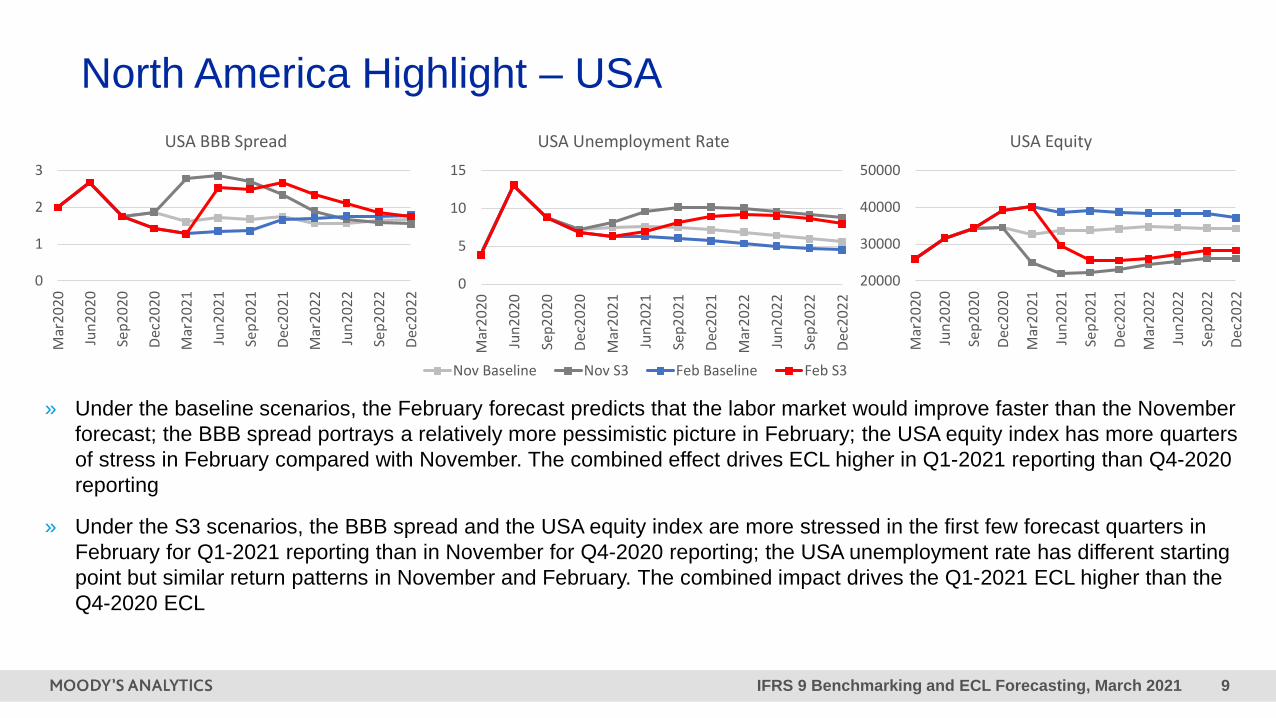
North America Highlight – USA
» Under the baseline scenarios, the February forecast predicts that the labor market would improve faster than the November forecast; the BBB spread portrays a relatively more pessimistic picture in February; the USA equity index has more quarters of stress in February compared with November. The combined effect drives ECL higher in Q1-2021 reporting than Q4-2020 reporting
» Under the S3 scenarios, the BBB spread and the USA equity index are more stressed in the first few forecast quarters in February for Q1-2021 reporting than in November for Q4-2020 reporting; the USA unemployment rate has different starting point but similar return patterns in November and February. The combined impact drives the Q1-2021 ECL higher than the Q4-2020 ECL
0
1
2
3
Mar
2020
Jun2
020
Sep2
020
Dec2
020
Mar
2021
Jun2
021
Sep2
021
Dec2
021
Mar
2022
Jun2
022
Sep2
022
Dec2
022
USA BBB Spread
0
5
10
15
Mar
2020
Jun2
020
Sep2
020
Dec2
020
Mar
2021
Jun2
021
Sep2
021
Dec2
021
Mar
2022
Jun2
022
Sep2
022
Dec2
022
USA Unemployment Rate
Nov Baseline Nov S3 Feb Baseline Feb S3
20000
30000
40000
50000
Mar
2020
Jun2
020
Sep2
020
Dec2
020
Mar
2021
Jun2
021
Sep2
021
Dec2
021
Mar
2022
Jun2
022
Sep2
022
Dec2
022
USA Equity

IFRS 9 Benchmarking and ECL Forecasting, March 2021 10
PIT PD Update» To isolate the PIT PD impact, we compare the ECLs from the “Q4 Unconditional Run – September PIT PD” with that from
those “Q1 Unconditional Run – December PIT PD,” without scenario conditioning
Portfolio Analysis Run LifetimeECL Rate
One-Year ECL Rate
Europe Q4 Unconditional Run – September PIT PD 0.71% 0.42%Q1 Unconditional Run – December PIT PD 0.45% 0.24%
Middle East Q4 Unconditional Run – September PIT PD 1.59% 1.10%Q1 Unconditional Run – December PIT PD 1.12% 0.72%
North AmericaQ4 Unconditional Run – September PIT PD 1.09% 0.72%
Q1 Unconditional Run – December PIT PD 0.69% 0.41%
» With the updated PIT PDs, the expected credit losses decrease by around 40% for Europe, 30% for the Middle East, and 40% for North America
Portfolio Analysis Run LifetimeECL Rate
One-Year ECL Rate
Europe Q4 Unconditional Run – September PIT PD 0.71% 0.42%Q1 Unconditional Run – December PIT PD 0.45% 0.24%

IFRS 9 Benchmarking and ECL Forecasting, March 2021 11
Understanding the Current Credit Environment» The decreases in PIT PDs are driven by the very strong performance of global equities in the last quarter of 2020. Moody’s
Analytics EDF™ model and PIT PD converter produce credit risk measures with equity value and equity volatility as main inputs. COVID-19 has caused stresses to the global economy, but not as severe as the Great Financial Crisis. The recovery since the peak of the pandemic is also much faster than the financial crisis period
» In Default Trends – Global: February 2021 Default Report by Moody’s Investors Service (MIS), the realized trailing 12-month default rate for global speculative grade reached 6.6% at the end of 2020. However, the baseline trailing 12-month default rate is projected to fall below 4% by the end of 2021. The chart below shows the historical data and the forecasts
» Institutions may have different views on how volatile the PIT PDs of their portfolios should be, relative to the PIT PD converter output, especially for exposures to small to medium enterprises. See details on volatility dampening on Slide 13

IFRS 9 Benchmarking and ECL Forecasting, March 2021 12
PIT PD Update Impact on Industry Sectors» The tables below show the relative changes in one-year and lifetime ECL from “Q4 Unconditional Run – September PIT
PD” to “Q1 Unconditional Run – December PIT PD” by industry sectors
» Several industries that were hit hard at the peak of the pandemic show faster improvements and larger decreases in PIT PDs
Industries with Larger PD Decreases
Relative Change
Lifetime ECL
Relative Change
One-Year ECLHotel & Restaurants -53% -60%
Broadcast Media -49% -56%Air Transportation -49% -57%Apparel & Shoes -46% -53%
Entertainment & Leisure -44% -45%Lessors -44% -51%
Oil, Gas & Coal Exploration/Production -44% -50%Oil Refining -43% -50%
Industries with Smaller PD Decreases
Relative Change
Lifetime ECL
Relative Change
One-Year ECLUtilities, Not Elsewhere Classified -23% -31%
Utilities, Electric -25% -31%Bank and Savings & Loans -25% -29%
Mining -26% -34%Real Estate Investment Trusts -26% -30%
Finance, Not Elsewhere Classified -28% -29%Real Estate -30% -30%
Trucking -30% -38%

IFRS 9 Benchmarking and ECL Forecasting, March 2021 13
What to Expect in ECL Results in Q1-2021?» We calculate the overall Q1-2021 ECL by combining the PIT PD and scenario updates. The table below shows the
scenario weighted ECL results, using 40% weight on baseline, 30% on S1, and 30% on S3
– The scenario weighted ECL results of the Europe and North America portfolios are significantly lower in Q1-2021 than in Q4-2020. It is mainly due to the PIT PD decreases from Q4-2020 to Q1-2021
– For the Middle East portfolio, the ECL also shows a decrease, but of a smaller magnitude. The reason is that the PIT PD decrease in the Middle East portfolio is smaller than the other two regions, and the changes in the macroeconomic forecasts for the Middle East are more pronounced, partially offsetting the impact from PIT PDs
– The comparisons above are based on the benchmark portfolios used and specific assumptions on the analysis settings. Institutions may not observe the similar level of ECL changes in Q1-2021 as shown above
Portfolio Q4-2020Lifetime
Q4-20201-Year
Q1-2021Lifetime
Q1-20211-Year
Europe 0.58% 0.47% 0.33% 0.24%Middle East 1.39% 1.05% 1.07% 0.75%
North America 1.22% 0.98% 0.84% 0.63%

IFRS 9 Benchmarking and ECL Forecasting, March 2021 14
Controlling the PIT PD Volatility» Some institutions may believe that the credit risks of their exposures are reflected through the public equity market
only to a certain degree or are less sensitive to the movements of systematic credit risk (for example, due to smaller firm sizes). Volatility dampening is a feature available in MA impairment products that allows users to control how much the current credit market information contributes to the PIT PD converter output
» The table below shows the Q4-2020 and Q1-2021 ECL results on the benchmark portfolios after volatility dampening is applied. The dampening parameter is at 0.65 in both analyses – the preset value for SMEs. Without volatility dampening, this parameter is effectively set at 1
» For all three portfolios, the relative decreases in ECL from Q4-2020 to Q1-2021 are smaller compared with the decreases without volatility dampening shown on the previous slide
» Users have full control on the value of dampening parameter and can find guidance based on the average firm size and region in Increasing The Granularity of PIT PD Volatility in The ImpairmentCalc™ PIT Converter
Portfolio Q4-2020Lifetime ECL
Q4-2020One-Year ECL
Q1-2021Lifetime ECL
Q1-2021One-Year ECL
Europe 0.67% 0.55% 0.49% 0.38%Middle East 1.35% 1.01% 1.21% 0.85%
North America 1.24% 1.01% 1.07% 0.83%
IFRS 9 Benchmarking and ECL Forecasting, March 2021 15
ECL Forecasting under Macroeconomic Scenarios» In addition to calculating IFRS 9 ECL for financial reporting, institutions are often interested in
knowing what the ECL will be at a sequence of future reporting dates along a macroeconomic scenario
» We utilize Moody’s Analytics CapitalRiskAnalyzer™ to perform ECL forecasting exercises on the same benchmark portfolios with the recently released EBA 2021 scenarios
» As in the EBA stress testing framework, we make the following assumptions » Static portfolios: portfolio characteristics as of a future reporting date are the same as those at
time 0» Perfect foresight: throughout the analysis, the macroeconomic scenario is assumed to be
realized as specified» We focus on the ECL forecasts for the Europe and North America portfolios

IFRS 9 Benchmarking and ECL Forecasting, March 2021 16
EBA 2021 Scenarios – MEVs for Germany
» Under the EBA baseline scenario, the Germany equity index stays a constant level; the Germany GDP has a continuous recovery; the Eurozone unemployment rate has a small stress in the first few quarters then recovers in the long term
» Under the EBA stress testing scenario, the Germany equity index has a significant stress in 2021 then recovers; the Germany GDP has a stress in the following years until the end of 2023; the Eurozone unemployment rate has a continuous increase and start to decrease in mid 2024
6
8
10
12
14
Mar
2020
Sep2
020
Mar
2021
Sep2
021
Mar
2022
Sep2
022
Mar
2023
Sep2
023
Mar
2024
Sep2
024
Mar
2025
Sep2
025
Eurozone Unemployment Rate
400060008000
100001200014000
Mar
2020
Sep2
020
Mar
2021
Sep2
021
Mar
2022
Sep2
022
Mar
2023
Sep2
023
Mar
2024
Sep2
024
Mar
2025
Sep2
025
Germany Equity
260028003000320034003600
Mar
2020
Sep2
020
Mar
2021
Sep2
021
Mar
2022
Sep2
022
Mar
2023
Sep2
023
Mar
2024
Sep2
024
Mar
2025
Sep2
025
Germany GDP
EBA 2021 Baseline EBA 2021 Stress Testing

IFRS 9 Benchmarking and ECL Forecasting, March 2021 17
EBA 2021 Scenarios – USA MEVs
» Under the baseline scenario, the BBB spread has a virtually constant level; the USA unemployment rate continuously decreases in the following years; the USA equity index stays constant
» Under the stress testing scenario, the BBB spread increases significantly in 2021 and recovers to the previous level in 2022; the USA unemployment rate stays at a high level until 2023; the USA equity index falls by more than half in 2021 and recovers slowly afterwards
0
5
10
15
Mar
2020
Sep2
020
Mar
2021
Sep2
021
Mar
2022
Sep2
022
Mar
2023
Sep2
023
Mar
2024
Sep2
024
Mar
2025
Sep2
025
USA Unemployment Rate
EBA 2021 Baseline EBA 2021 Stress Testing
10000
20000
30000
40000
50000
Mar
2020
Sep2
020
Mar
2021
Sep2
021
Mar
2022
Sep2
022
Mar
2023
Sep2
023
Mar
2024
Sep2
024
Mar
2025
Sep2
025
USA Equity
012345
Mar
2020
Sep2
020
Mar
2021
Sep2
021
Mar
2022
Sep2
022
Mar
2023
Sep2
023
Mar
2024
Sep2
024
Mar
2025
Sep2
025
USA BBB Spread

IFRS 9 Benchmarking and ECL Forecasting, March 2021 18
ECL Forecasts in Q1-2021 and Onwards
» Under the EBA baseline scenario, both Europe and North America portfolios have gradually increasing one-year and lifetime ECLs, mainly due to the upward sloping shape of the PIT PD term structures and to a lesser degree the unemployment rates flattening
» Under the EBA stress testing scenario, Europe and North America portfolios have significantly higher one-year and lifetime ECL levels than the baseline counterparts, standing at each quarter of 2021. This is due to the significant stress in the MEVs in 2021, especially in the equity market. In 2022, the stress testing ECLs return to similar levels as the baseline forecasts, due to similar quarter-over-quarter changes between the two sets of scenarios
0.0%
0.2%
0.4%
0.6%
0.8%
Mar2021 Sep2021 Mar2022 Sep2022
Europe
0.0%0.2%0.4%0.6%0.8%1.0%1.2%
Mar2021 Sep2021 Mar2022 Sep2022
North America

IFRS 9 Benchmarking and ECL Forecasting, March 2021 19
Q&A session

East Africa Webinar 20
© 2021 Moody’s Corporation, Moody’s Investors Service, Inc., Moody’s Analytics, Inc. and/or their licensors and affiliates (collectively, “MOODY’S”). All rights reserved.
CREDIT RATINGS ISSUED BY MOODY'S INVESTORS SERVICE, INC. AND/OR ITS CREDIT RATINGS AFFILIATES ARE MOODY’S CURRENT OPINIONS OF THE RELATIVE FUTURE CREDIT RISK OF ENTITIES, CREDIT COMMITMENTS, OR DEBT OR DEBT-LIKE SECURITIES, AND MATERIALS, PRODUCTS, SERVICES AND INFORMATION PUBLISHED BY MOODY’S (COLLECTIVELY, “PUBLICATIONS”) MAY INCLUDE SUCH CURRENT OPINIONS. MOODY’S INVESTORS SERVICE DEFINES CREDIT RISK AS THE RISK THAT AN ENTITY MAY NOT MEET ITS CONTRACTUAL FINANCIAL OBLIGATIONS AS THEY COME DUE AND ANY ESTIMATED FINANCIAL LOSS IN THE EVENT OF DEFAULT OR IMPAIRMENT. SEE MOODY’S RATING SYMBOLS AND DEFINITIONS PUBLICATION FOR INFORMATION ON THE TYPES OF CONTRACTUAL FINANCIAL OBLIGATIONS ADDRESSED BY MOODY’S INVESTORS SERVICE CREDIT RATINGS. CREDIT RATINGS DO NOT ADDRESS ANY OTHER RISK, INCLUDING BUT NOT LIMITED TO: LIQUIDITY RISK, MARKET VALUE RISK, OR PRICE VOLATILITY. CREDIT RATINGS, NON-CREDIT ASSESSMENTS (“ASSESSMENTS”), AND OTHER OPINIONS INCLUDED IN MOODY’S PUBLICATIONS ARE NOT STATEMENTS OF CURRENT OR HISTORICAL FACT. MOODY’S PUBLICATIONS MAY ALSO INCLUDE QUANTITATIVE MODEL-BASED ESTIMATES OF CREDIT RISK AND RELATED OPINIONS OR COMMENTARY PUBLISHED BY MOODY’S ANALYTICS, INC. AND/OR ITS AFFILIATES. MOODY’S CREDIT RATINGS, ASSESSMENTS, OTHER OPINIONS AND PUBLICATIONS DO NOT CONSTITUTE OR PROVIDE INVESTMENT OR FINANCIAL ADVICE, AND MOODY’S CREDIT RATINGS, ASSESSMENTS, OTHER OPINIONS AND PUBLICATIONS ARE NOT AND DO NOT PROVIDE RECOMMENDATIONS TO PURCHASE, SELL, OR HOLD PARTICULAR SECURITIES. MOODY’S CREDIT RATINGS, ASSESSMENTS, OTHER OPINIONS AND PUBLICATIONS DO NOT COMMENT ON THE SUITABILITY OF AN INVESTMENT FOR ANY PARTICULAR INVESTOR. MOODY’S ISSUES ITS CREDIT RATINGS, ASSESSMENTS AND OTHER OPINIONS AND PUBLISHES ITS PUBLICATIONS WITH THE EXPECTATION AND UNDERSTANDING THAT EACH INVESTOR WILL, WITH DUE CARE, MAKE ITS OWN STUDY AND EVALUATION OF EACH SECURITY THAT IS UNDER CONSIDERATION FOR PURCHASE, HOLDING, OR SALE.
MOODY’S CREDIT RATINGS, ASSESSMENTS, OTHER OPINIONS, AND PUBLICATIONS ARE NOT INTENDED FOR USE BY RETAIL INVESTORS AND IT WOULD BE RECKLESS AND INAPPROPRIATE FOR RETAIL INVESTORS TO USE MOODY’S CREDIT RATINGS, ASSESSMENTS, OTHER OPINIONS OR PUBLICATIONS WHEN MAKING AN INVESTMENT DECISION. IF IN DOUBT YOU SHOULD CONTACT YOUR FINANCIAL OR OTHER PROFESSIONAL ADVISER.
ALL INFORMATION CONTAINED HEREIN IS PROTECTED BY LAW, INCLUDING BUT NOT LIMITED TO, COPYRIGHT LAW, AND NONE OF SUCH INFORMATION MAY BE COPIED OR OTHERWISE REPRODUCED, REPACKAGED, FURTHER TRANSMITTED, TRANSFERRED, DISSEMINATED, REDISTRIBUTED OR RESOLD, OR STORED FOR SUBSEQUENT USE FOR ANY SUCH PURPOSE, IN WHOLE OR IN PART, IN ANY FORM OR MANNER OR BY ANY MEANS WHATSOEVER, BY ANY PERSON WITHOUT MOODY’S PRIOR WRITTEN CONSENT.
MOODY’S CREDIT RATINGS, ASSESSMENTS, OTHER OPINIONS AND PUBLICATIONS ARE NOT INTENDED FOR USE BY ANY PERSON AS A BENCHMARK AS THAT TERM IS DEFINED FOR REGULATORY PURPOSES AND MUST NOT BE USED IN ANY WAY THAT COULD RESULT IN THEM BEING CONSIDERED A BENCHMARK.
All information contained herein is obtained by MOODY’S from sources believed by it to be accurate and reliable. Because of the possibility of human or mechanical error as well as other factors, however, all information contained herein is provided “AS IS” without warranty of any kind. MOODY'S adopts all necessary measures so that the information it uses in assigning a credit rating is of sufficient quality and from sources MOODY'S considers to be reliable including, when appropriate, independent third-party sources. However, MOODY’S is not an auditor and cannot in every instance independently verify or validate information received in the rating process or in preparing its Publications.
To the extent permitted by law, MOODY’S and its directors, officers, employees, agents, representatives, licensors and suppliers disclaim liability to any person or entity for any indirect, special, consequential, or incidental losses or damages whatsoever arising from or in connection with the information contained herein or the use of or inability to use any such information, even if MOODY’S or any of its directors, officers, employees, agents, representatives, licensors or suppliers is advised in advance of the possibility of such losses or damages, including but not limited to: (a) any loss of present or prospective profits or (b) any loss or damage arising where the relevant financial instrument is not the subject of a particular credit rating assigned by MOODY’S.
To the extent permitted by law, MOODY’S and its directors, officers, employees, agents, representatives, licensors and suppliers disclaim liability for any direct or compensatory losses or damages caused to any person or entity, including but not limited to by any negligence (but excluding fraud, willful misconduct or any other type of liability that, for the avoidance of doubt, by law cannot be excluded) on the part of, or any contingency within or beyond the control of, MOODY’S or any of its directors, officers, employees, agents, representatives, licensors or suppliers, arising from or in connection with the information contained herein or the use of or inability to use any such information.
NO WARRANTY, EXPRESS OR IMPLIED, AS TO THE ACCURACY, TIMELINESS, COMPLETENESS, MERCHANTABILITY OR FITNESS FOR ANY PARTICULAR PURPOSE OF ANY CREDIT RATING, ASSESSMENT, OTHER OPINION OR INFORMATION IS GIVEN OR MADE BY MOODY’S IN ANY FORM OR MANNER WHATSOEVER.
Moody’s Investors Service, Inc., a wholly-owned credit rating agency subsidiary of Moody’s Corporation (“MCO”), hereby discloses that most issuers of debt securities (including corporate and municipal bonds, debentures, notes and commercial paper) and preferred stock rated by Moody’s Investors Service, Inc. have, prior to assignment of any credit rating, agreed to pay to Moody’s Investors Service, Inc. for credit ratings opinions and services rendered by it fees ranging from $1,000 to approximately $2,700,000. MCO and Moody’s investors Service also maintain policies and procedures to address the independence of Moody’s Investors Service credit ratings and credit rating processes. Information regarding certain affiliations that may exist between directors of MCO and rated entities, and between entities who hold credit ratings from Moody’s Investors Service and have also publicly reported to the SEC an ownership interest in MCO of more than 5%, is posted annually at www.moodys.com under the heading “Investor Relations — Corporate Governance — Director and Shareholder Affiliation Policy.”
Additional terms for Australia only: Any publication into Australia of this document is pursuant to the Australian Financial Services License of MOODY’S affiliate, Moody’s Investors Service Pty Limited ABN 61 003 399 657AFSL 336969 and/or Moody’s Analytics Australia Pty Ltd ABN 94 105 136 972 AFSL 383569 (as applicable). This document is intended to be provided only to “wholesale clients” within the meaning of section 761G of the Corporations Act 2001. By continuing to access this document from within Australia, you represent to MOODY’S that you are, or are accessing the document as a representative of, a “wholesale client” and that neither you nor the entity you represent will directly or indirectly disseminate this document or its contents to “retail clients” within the meaning of section 761G of the Corporations Act 2001. MOODY’S credit rating is an opinion as to the creditworthiness of a debt obligation of the issuer, not on the equity securities of the issuer or any form of security that is available to retail investors.
Additional terms for Japan only: Moody's Japan K.K. (“MJKK”) is a wholly-owned credit rating agency subsidiary of Moody's Group Japan G.K., which is wholly-owned by Moody’s Overseas Holdings Inc., a wholly-owned subsidiary of MCO. Moody’s SF Japan K.K. (“MSFJ”) is a wholly-owned credit rating agency subsidiary of MJKK. MSFJ is not a Nationally Recognized Statistical Rating Organization (“NRSRO”). Therefore, credit ratings assigned by MSFJ are Non-NRSRO Credit Ratings. Non-NRSRO Credit Ratings are assigned by an entity that is not a NRSRO and, consequently, the rated obligation will not qualify for certain types of treatment under U.S. laws. MJKK and MSFJ are credit rating agencies registered with the Japan Financial Services Agency and their registration numbers are FSA Commissioner (Ratings) No. 2 and 3 respectively.
MJKK or MSFJ (as applicable) hereby disclose that most issuers of debt securities (including corporate and municipal bonds, debentures, notes and commercial paper) and preferred stock rated by MJKK or MSFJ (as applicable) have, prior to assignment of any credit rating, agreed to pay to MJKK or MSFJ (as applicable) for credit ratings opinions and services rendered by it fees ranging from JPY125,000 to approximately JPY250,000,000.
MJKK and MSFJ also maintain policies and procedures to address Japanese regulatory requirements.