an update on physician compensation methodologies in
TRANSCRIPT

© 2021 AAMC. May not be reproduced without permission.
Presentation title goes here
Subtitle of Presentation
An Update on Physician
Compensation Methodologies
in Academic Medical Centers
Ivy Baer, AAMC
Jason Tackett, SullivanCotter
Bob Madden, SullivanCotter
Darrell Griffith, MCV Physicians | VCU Health
Lucas Wright, MCV Physicians | VCU Health
February 8, 2021

© 2020 AAMC. May not be reproduced without permission.© 2021 AAMC. May not be reproduced without permission.
Agenda
1
Physician Compensation Methodologies in
Academic Medical Centers: A National
Perspective
• Recap: COVID-19 and other factors
impacting 2021 compensation planning
• Summary of results from the
AAMC/SullivanCotter 2020 Physician
Compensation Methodologies in
Academic Medical Centers Survey
To Be Released to AAMC Members Next Week
Designing a Physician Compensation
Strategy for the Future of Health Care:
Lessons Learned
• Organizational overview
• Overview of current
compensation models
• Challenges and responses
• Clinical work effort methodology
Part One
AAMC/SullivanCotter
Part Two
VCU Health

© 2020 AAMC. May not be reproduced without permission.© 2021 AAMC. May not be reproduced without permission.2
Part One

© 2020 AAMC. May not be reproduced without permission.© 2021 AAMC. May not be reproduced without permission.
Previous Webinar: COVID-19 Impact November 12, 2020: Impact of COVID-19 on Physician Compensation
3
The global pandemic continues to drive fundamental change and uncertainty with
respect to health care organization budgets, reimbursement, processes and operations
Pandemic-driven change and organizational response may have
long-term impact and requires aligned leadership
• Decreases in volume/revenue
• Increases in expense
Financial Sustainability
• Flexibility to adapt to
traditional and non-traditional
access to care
• Increased focus on
care coordination
Population Health
• Constraints on in-person
patient consults due to
COVID-19 protocol
• Requires expanded
in-office hours
Patient Access
• Development/expansion of
non-traditional patient access
• Long-term uncertainty in virtual
care reimbursement
Virtual
Medicine
• Physician/APP redeployment
• Expanding APP scope
Clinical Workforce
Optimization

© 2020 AAMC. May not be reproduced without permission.© 2021 AAMC. May not be reproduced without permission.
Other Factors Impacting Compensation 2021 Compensation Planning
4
2021 CMS Final Physician Fee Schedule Changes
• Impact on physician productivity (wRVUs) and reimbursement
Expansion of Virtual Health and Emerging Providers
• Temporary vs. permanent reimbursement
• Demand and commercialization
• Competition
• Walmart, Walgreens
Final Updates to Federal Physician Self-Referral Law
(“Stark”) and Anti-Kickback Statute Regulations
• Uncertainty and potential policy changes
• Provides increased flexibility

© 2020 AAMC. May not be reproduced without permission.© 2021 AAMC. May not be reproduced without permission.
Physician Faculty CompensationConsiderations
5
Organizational Culture
and Workforce
Preferences
Recruitment and
Retention
Alignment with
Organizational
Priorities and the
Academic Mission
Financial
Sustainability and
Work Effort
Allocation
Flexibility to Adapt
to Reimbursement
Changes
Short- and Long-Term
Impact of COVID-19
Physician
Faculty
Compensation

© 2020 AAMC. May not be reproduced without permission.© 2021 AAMC. May not be reproduced without permission.
AAMC/SullivanCotter Research
6
Recent 2018/2020 Studies: Identify work effort allocation approaches and contemporary
pay practices used by AMCs to compensate faculty and community-based physicians
Funds Flow Academic Sources*
Oversight of Physician Compensation
Funds Flow/
AffordabilityClinical Sources*
Benchmarking
Surveys and
Methodology
Work Effort
AllocationClinical, Research
and Teaching FTE
Methodology
Compensation
Plan
Methodology
Tra
nsp
are
ncy,
Co
mm
un
ica
tion
an
d
Rep
ortin
g
Individual Physician Faculty Compensation Levels
* Areas not covered by the study
Over the last six years, the AAMC and SullivanCotter
have collaborated on research topics important to academic medical centers (AMCs)

© 2020 AAMC. May not be reproduced without permission.© 2021 AAMC. May not be reproduced without permission.
Characteristics of Survey ParticipantsOverall Responses | Organizational Structure
7
Overall
Responses
24
The 2020 survey results reflect the following characteristics:
Source: 2020 AAMC/SullivanCotter Faculty and Community-Based Physician Compensation Methodologies in Academic Medical Centers
Academic
Integration
Fully
Integrated
Clinical
Integration
Independent
Structures
Independent
FPP Structure
42%
25%
17%
4%
12%
of AMCs indicated
community-based
physicians are
included in their
workforce
71%
Responses were collected from December 2019 to June 2020 and reflect pre-pandemic results

© 2020 AAMC. May not be reproduced without permission.© 2021 AAMC. May not be reproduced without permission.
Characteristics of Survey Participants, cont.Physician and APP Staffing | Percentage Change from 2018
8
Physician and APP Full-Time Equivalent (FTE)1
n = 21
Growth in the advanced practice providers (APP) workforce is
vastly outpacing physician growth
1 Provider staffing from the 2018 report indicated median figures as follows: 775 physician FTEs, 188 APPs and a 3:1 MD/APP ratio2 Percentage change reflects the same participants from the 2018 survey; ratios reflect calculated ratios, not percentage change; n = 18
FTEPhysicians
Faculty and Communityn = 22
APPsn = 18
MD/APP Ration = 18
Median 1,003 353 3:1
Percentage
Change from 20182 3.4% 25.1% 3:1
Source: 2020 AAMC/SullivanCotter Faculty and Community-Based Physician Compensation Methodologies in Academic Medical Centers
Average 1,111 355 6:1
Percentage
Change from 20182 2.0% 21.2% 4:1

© 2020 AAMC. May not be reproduced without permission.© 2021 AAMC. May not be reproduced without permission.
Participants project significant growth in physician staffing levels as reported in the following growth goals over the next year1
9
1 Of the nineteen that responded, 6 or more selected primary care specialties; cardiology and neurology were
selected by 4 and 3 respondents, respectively. Cardiothoracic surgery mentioned in both categories above
Projected %
Growth2
Total Community-Based3
2020 (n=15) 2018 (n=9) 2020 (n=8) 2018 (n=7)
Median 3.0% 4.3% 16.2% 7.7%
Average 11.1% 3.3% 22.2% 12.4%
1 Data normalized as organizations reported a range of time periods2 Reflects information collected prior to COVID-193 Growth percentage based on participants with community-based physicians (68%) and could be influenced by potential acquisition targets
in the community being served
Physician Projected Staffing LevelsRecruitment/Retention Challenges
Source: 2020 AAMC/SullivanCotter Faculty and Community-Based Physician Compensation Methodologies in Academic Medical Centers
Specialties Experiencing
Most Growth1
Family Medicine
Internal Medicine
Pediatrics
Specialties Experiencing
Retention Challenges1
Cardiology
Neurology

© 2020 AAMC. May not be reproduced without permission.© 2021 AAMC. May not be reproduced without permission.
Physician Compensation Oversight
10
Due to significant growth and other environmental factors, AMCs continue to seek better
alignment between their compensation programs and organizational strategy
Blended
75%
• Higher levels of autonomy promote departmental
decision-making resulting in:
− Barriers to care coordination and collaboration for
traditional and non-traditional patient care
− Retention and/or recruitment risk (e.g., low pay,
high productivity) due to differences in pay structure
between specialty groups (e.g., percentage of
base/variable compensation)
− High levels of administrative burden; strong budget
process required to support financial sustainability
− More potential for regulatory risk and gender inequity
− Faculty may perceive and prefer higher levels
of autonomy
• Higher levels of institutional decision-making results in:
‒ Risk lower levels of physician engagement due to
less local control and input on key decisions
‒ More consistent and strategic reward structure,
including decision-making related to mission support
‒ Greater ability to respond to reimbursement
changes; typically, a more flexible compensation
program that aligns faculty expectations with the
future of health care
‒ Fewer compensation approaches may not recognize
the differences between practice settings and
physician phenotypes
Departmental | 17%High Variation | Many Decision-Makers
Institutional | 8%Low Variation | Few Decision-Makers
Source: 2020 AAMC/SullivanCotter Faculty and Community-Based Physician Compensation Methodologies in Academic Medical Centers

© 2020 AAMC. May not be reproduced without permission.© 2021 AAMC. May not be reproduced without permission.11
BlendedDepartmentalHigh Variation | Many Decision-Makers
InstitutionalLow Variation | Few Decision-Makers
A B
Select the option that best describes your academic medical center’s oversight of physician compensation
Polling QuestionPhysician Compensation Oversight
C D E

© 2020 AAMC. May not be reproduced without permission.© 2021 AAMC. May not be reproduced without permission.
Definitions
12
Work effort allocation is managed by department chairs in 95% of organizations (n=22)
27% of organizations indicate the allocation is also reviewed by an Oversight Committee
Number of Weekly Sessions for 1.0 FTE
10%
10%
50%
30%
Less than 8 8 9 10
n = 10
Source: 2020 AAMC/SullivanCotter Faculty and Community-Based Physician Compensation Methodologies in Academic Medical Centers
Session (excluding hospital-based)
91%define a session as a
half day or four hours
n = 11

© 2020 AAMC. May not be reproduced without permission.© 2021 AAMC. May not be reproduced without permission.
Hospital-Based Specialties Work Effort Definitions
13
Specialty Group
Hours Per Shift Annual Shifts Annual Hours
Average Median Average Median Average Median
Median
% ∆ from
2018
Critical Caren = 11
11.0 12.0 169 168 1,822 1,800 n/a
Emergency
Medicinen = 12
9.5 10.0 177 168 1,658 1,584 3.1%
Anesthesiologyn = 13
10.3 10.0 194 188 1,956 1,888 (6.8%)
Hospitalistn = 14
10.8 10.5 188 182 1,972 2,028 (6.1%)
Radiologyn = 14
9.1 8.5 200 184 1,801 1,835 9.2%
70% of organizations indicated that hours per shift vary by hospital-based specialty and
82% indicated that shifts per FTE per year also vary by specialty
Source: 2020 AAMC/SullivanCotter Faculty and Community-Based Physician Compensation Methodologies in Academic Medical Centers

© 2020 AAMC. May not be reproduced without permission.© 2021 AAMC. May not be reproduced without permission.
Sources and UsesWork Effort Allocation and Rewarding Effort
14
Typical AMC Funding Sources and Uses
Academic
Grants
Contracts
Endowments
15%
Clinical
Patient care
reimbursement
(payment for
clinical services)
85%
Funding Sources Uses (Physician Faculty Compensation)Direct Funding
Indirect Funding
…downward
pressure to
reduce effort
that is not
directly funded
Downward
pressure on
both funding
sources
creates…
Downward pressure on funding sources combined with a high level of indirectly funded effort
dilutes the value that can be placed on individual clinical performance
Result: 10% of participants are considering either reducing or eliminating standard for academic time
Work Effort
AllocationClinical,
Research and
Teaching FTE
Methodology
Institutionally
Funded
Teaching
Clinical
Research
100% Indirectly FundedCross-Subsidized

© 2020 AAMC. May not be reproduced without permission.© 2021 AAMC. May not be reproduced without permission.
Which approach best describes your organization’s clinical FTE methodology?
15
Polling QuestionClinical FTE Approaches
A. 1.0 FTE minus teaching, research and
administrative time
B. Number of clinical sessions per week
C. 1.0 FTE minus funded effort
D. 1.0 FTE minus blend of funded
academic work effort/time
E. Other

© 2020 AAMC. May not be reproduced without permission.© 2021 AAMC. May not be reproduced without permission.
How many total weekly hours define a 1.0 cFTE at your organization?
16
Polling QuestionStandard Half-Day Clinical Sessions per Week in an Ambulatory Setting
A. 35 - 40
B. 40 - 45
C. 45 - 50
D. 50 - 55
E. >55
F. We don’t have a standard definition

© 2020 AAMC. May not be reproduced without permission.© 2021 AAMC. May not be reproduced without permission.
Clinical FTE Approaches
17
41%
1.0 FTE
minus
teaching,
research and
administrative
time
1.0 FTE
minus
funded effort
1.0 FTE
minus blend
of funded
academic
work
effort/time
Number of
clinical
sessions per
week
Other
A standard
definition is
not defined
23% 18% 4%14% n = 22
The predominant methodology (41%) for determining cFTE is time-based.
Relatively consistent from 2018; majority continue to use either time-based or
funded approach (64% compared to 68% in 2018).
73% of participants have an organizational standard definition
of total hours for a 1.0 cFTE across departments
Source: 2020 AAMC/SullivanCotter Faculty and Community-Based Physician Compensation Methodologies in Academic Medical Centers

© 2020 AAMC. May not be reproduced without permission.© 2021 AAMC. May not be reproduced without permission.
Clinical FTE and BenchmarkingFactors Impacting Compensation and Productivity Alignment
18
Funding Example: Grant Funding
10 ppt
5 ppt
0 ppt
15 ppt
cFTE reductions based on “unfunded” effort(s) can create gaps between
compensation and productivity targets relative to market benchmarks
Alignment of cFTE and Funding
Co
mp
en
sati
on
an
d P
rod
ucti
vit
y
Mark
et
Perc
en
tile
Gap
wRVU Target
of P65 to Fund
P50 Comp.
wRVU Target
of P50 to Fund
P50 Comp.
Low High
Key Considerations:
• Survey sources (academic vs. non-
academic)
• Level of scheduled patient volume
vs. coverage requirement
• Extent to which cFTE influences
compensation
• Hospital funding for leadership roles

© 2020 AAMC. May not be reproduced without permission.© 2021 AAMC. May not be reproduced without permission.
Benchmarking Approaches
19
SurveysFaculty
n = 49
Community-Based n = 30
Comp. Prod. Comp. Prod.
AAMC 86% -- 17% --
MGMA – Academic 69% 51% 27% 20%
MGMA – Private/Medical Group 57% 47% 93% 80%
SullivanCotter Surveys* 41% 27% 63% 53%
Vizient – CPSC 4% 43% -- 13%
AMGA 20% 12% 33% 27%
Other 20% 20% 10% 13%
* Reflects physician, medical group and Large Clinic surveys
Organizations continue to report a variety of survey sources used to benchmark
compensation and productivity for faculty and community-based physiciansNote: Results based on combined 2018 and 2020 responses
A growing trend is to set compensation targets that lag productivity expectations by as
much as 10 percentile points (e.g., P50 compensation tied to P60 productivity)
Source: 2020 AAMC/SullivanCotter Faculty and Community-Based Physician Compensation Methodologies in Academic Medical Centers

© 2020 AAMC. May not be reproduced without permission.© 2021 AAMC. May not be reproduced without permission.
Compensation Strategy: Evolution
20
AMCs continue to move away from a pure productivity and/or net collections approach
Guaranteed Total
Compensation
At-Risk Total
Compensation
Percent Change
46%
10%
0%0%
10%
20%
30%
40%
50%
60%
70%
Pure Salary ModifiedSalary
Base Salary +Multiple
Incentives
Base Salary +Productivity
IndividualwRVUs
Adjusted NetRevenue/NetCollections
No
Change
+5%
No
Change
+10% (7%)
(8%)
1%
11%
32%
56%
n = 20
Source: 2020 AAMC/SullivanCotter Faculty and Community-Based Physician Compensation Methodologies in Academic Medical Centers

© 2020 AAMC. May not be reproduced without permission.© 2021 AAMC. May not be reproduced without permission.
Key Factors: Base Salary and VariablePrevalence
21
Base Compensation | Prevalence (%)
Factor %
Faculty Rank 95%
Length of Service 59%
Funded Research 55%
Work Relative Value Units (wRVUs) 45%
Medical Student Teaching 45%
Chair Discretion 41%
Variable Compensation | Prevalence (%)
Factor %
wRVUs 86%
Patient Satisfaction 64%
Citizenship 59%
Patient Care Outcomes 59%
Chair Discretion 59%
Funded Research 55%
Patient Access 50%
Professionalism 45%
n = 22
The top factors influencing compensation remain largely unchanged from 2017
5% of total cash compensation
is the median weighting placed on
value-based metrics across all
specialty groups (n=21)
3 is the median number of
value-based metrics used in
each specialty grouping (n=14)
Source: 2020 AAMC/SullivanCotter Faculty and Community-Based Physician Compensation Methodologies in Academic Medical Centers
n = 22

© 2020 AAMC. May not be reproduced without permission.© 2021 AAMC. May not be reproduced without permission.
Primary Care and Population Health
22
91% of organizations are
planning on increasing the
number of primary care
providers in the next year (n = 22)
76% 50%Physicians
(n=21)APPs(n=18)
21% 5%Physicians
(n=19)
APPs(n=19)
85% of organizations use
APPs as Primary Care providers
(n = 20)
APP Panel ApproachPrevalence
(n=17)
APP Panel 24%
APP/Physician Panel 17%
Both Approaches 53%
No APP Panel 6%
Care optimization through panel size and team-based care (Physicians and APPs)
can help to shape an organization’s population health strategy
Currently Using Panel Size in Primary Care
Considering Using Panel Size in Primary Care

© 2020 AAMC. May not be reproduced without permission.© 2021 AAMC. May not be reproduced without permission.
Key Takeaways
23
• Increased financial pressure
• Acceleration of virtual care strategies
• Expansion of APP scope and optimization of
the workforce
COVID-19 Impact
• Recent growth of APPs outpacing
physician growth
• Accelerated growth projections in the community
• Primary care is a core growth area
Growth Strategy
• Consistent and clear definition of cFTE continues
to be an issue
• Time-based and funded approaches continue to
be most prevalent
Work Effort
• Panel size increasingly used in primary care
• Reimbursement changes via advanced payment
models are challenging typical fee for service
compensation approaches in primary care
Population Health
• Continued movement away from pure productivity
models towards salary plus incentive approaches
• More fixed compensation will require strong
performance management
Compensation Strategy
• Growing number of organizations creating an
intentional gap between compensation targets
and productivity expectations (up to 10
percentile points)
Benchmarking Approaches

© 2020 AAMC. May not be reproduced without permission.© 2021 AAMC. May not be reproduced without permission.24
Part Two

25

Agenda
26
Overview of VCU Health and MCV Physicians (MCVP)
Overview of MCVP Faculty Compensation Plan
Compensation Plan Challenges and Responses
Clinical Work Effort Methodology and Challenges

VCU Health – a snapshot
27
• Commonwealth of Virginia’s largest and
fully-integrated academic medical center
• Integrated leadership/governance of
SoM, FPP and health system
• Four schools and one college of health
sciences
• Commonwealth’s largest Level 1 trauma
center verified for adult, pediatric and
burn
• One of only two NCI-designated cancer
centers in Virginia
• The region’s only full-service children’s
hospital

28
By the Numbers (FY19)

29
Faculty practice planEmploys near 2,000 clinicians and team members
• 804 physician FTEs (615 cFTEs)– 21% growth in last three years
• 360 APP FTEs– 48% growth in last three years
• 706 staff FTEs
• $462M in total operating revenue (FY20)
At MCV Physicians, our mission is to set the standard for quality in patient
care and to support the physician members and the mission of the VCU
School of Medicine.

Overview of MCV
Physicians Faculty
Compensation Plan
30

Physician Compensation Oversight
31
✓
Departmental High Variation | Many Decision-Makers Blended
InstitutionalLow Variation | Few Decision-Makers
MCVP• Oversight of physician compensation highly centralized
• Recent efforts to move towards center
Strengths Weaknesses
Able to make decisions quickly when necessary
(e.g., response to COVID-19)
Decisions not made at the lowest appropriate
levels of organization
• Substantial senior leadership time spent
evaluating individual physician situations
Better ability to ensure equity among different
departments and specialties
Departmental leadership not accountable for good
stewardship of financial resources
Consistent rules across departments Departments lack ability to quickly respond to
individual circumstances
Departments lack expertise to adequately explain
compensation models to faculty

Benchmarking Approach
32
Survey Compensation Productivity
AAMC X
AAAP X X
AARAD X X
AMGA (Academic) X X
AMGA (Community) X X
CPSC X
Gallagher IHS X X
MGMA (Academic) X X
MGMA (Community) X X
• MCVP uses blend of many community and academic benchmarks
• Recently developed compensation models have specifically targeted
AAMC benchmarks or blend of AAMC and SullivanCotter

Polling Question
33
Does your organization use CPSC (AAMC/Vizient) wRVUs or CMS
wRVUs for purposes of physician compensation?
❑ CPSC (AAMC/Vizient)
❑ CMS

• Base salary
• Productivity incentive plus other non-productivity incentives such as academic, quality, etc.
Base Salary
+ Multiple
Incentives
• Base salary
• Majority of incentive driven by productivity.
• Incentives adjusted periodically
Base Salary
+ Productivity
Incentives
34
Pure
Salary
• Salary set by internal/ external data approach
• Generally, minimum accountability for “effort”
• Annual market adjustments
Modified
Salary/Work
Effort
• Base salary set by experience and/or performance
• Defined minimum work standards to “earn” salary
• Shift-based for hospital-based specialties
• May include incentives
Draw Based on
wRVUs and/or
Performance
• Salary draw based upon personally performed wRVUs, multiplied by rate per wRVU or other performance criteria
Adjusted Net
Revenue / Net
Collections
• Total credited personal collections, less actual/ allocated expenses
• Resulting variance equals “earned” compensation
Guaranteed Total
Compensation
At-Risk Total
Compensation!
1 2 3 4 5 6
Compensation Strategy: Continuum
Most MCVP ModelsNew MCVP Models

Factors Contributing to Current Compensation Plan
• wRVUs were down
• Surgeries were down
• Outpatient visits weren’t meeting budget targets
• Inpatient visits were down
• Payer mix was declining
Physician productivity was declining
Physician morale was lagging
• Limited incentive opportunities for most
Salaries were below AAMC benchmarks in many specialties
35

Key Goals for Current Compensation Plan
Properly align funding with effort allocation
Bring compensation up to market levels
Incentivize and appropriately reward clinical productivity
Fund ARTS (administrative, research, teaching, and strategic) roles consistently across all departments
Fund all faculty for – and expect them to contribute to – institutional citizenship
Payer blind compensation
36

Basic Compensation Plan Components
Clinical Salary Floor(Base salary determined by prior
year productivity)
Administrative Compensation(Clinical and Academic Administration)
Research (Equal to Funding)
Teaching
Total Cash Compensation
Strategic
Clinical Incentive
37

Basic Construct of Plan
• Contract salary set based on prior year’s clinical productivity and current year’s anticipated ARTS roles.
• Annual contract salary cannot be decreased more than 15% from prior year’s salary for first 12 months in plan
• Once set, contract salary guaranteed not to decrease during the year.
• Incentives based on current year productivity over clinical salary floor
• Incentives paid out quarterly with withholds in early quarters- 1Q – 50% withhold
- 2Q – 30% withhold
- 3Q – 10% withhold
- 4Q – Remaining annual incentive paid in full
38

Establishing a Clinical Salary Floor
Productivity-Based
Departments/Specialties1
• Anesthesiology (pain management only)
• Dermatology
• Family Medicine
• Internal Medicine (excluding hospitalists)
• Neurology
• Neurosurgery
• Ophthalmology
• Orthopedic Surgery
• Otolaryngology
• Pediatrics (excluding hospitalists and
intensivists)
• Physical Medicine & Rehabilitation
• Psychiatry
• Radiation Oncology
• Surgery (excluding pediatric surgery)
Shift-Based
Departments/Specialties2
• Anesthesiology (excluding pain
management)
• Emergency Medicine
• Pathology
• Radiology
Hybrid Departments/Specialties3
• Obstetrics and Gynecology (excluding
reproductive endocrinology)
1Based on wRVUs and collections from elective cash procedures (where applicable)2Based on clinical hours (Anesthesiology/EM) or clinical days (Pathology/Radiology)3Based on wRVUs, L&D sessions, and health department sessions
39

Compensation Plan Challenges
40
Compensation plan is confusing and difficult to explain
• Plan administration relies on few key individuals
• Providers and administrators don’t understand plan, leading to mistrust
Benchmark approach is difficult to understand and costly
• Not being able to point to one published survey leads to perception that benchmarks are not transparent
• Use of community/academic blend leads to high compensation levels compared to AAMC benchmarks
wRVU-based plan makes it difficult to incentivize patient access
• Inpatient work and procedures more lucrative than ambulatory practice
• Focus on wRVUs leads to competition for certain practice domains
Plan leads to retention issues after guarantee period
• Providers who succeed in model receive salary increases while many exceptions are requested for providers who do not succeed in model
Plan does not encourage team-based care or APP-physician collaboration
Plan does not support academic mission or recognize academic work/rank
• Citizenship/Teaching funding allocated to every provider regardless of contributions
Highly variable salary from year to year leads to provider dissatisfaction

Compensation Plan Challenges
41
One-size-fits-all model does not recognize all extraordinary performance
• Extraordinary performance only measured in terms of wRVUs
Centralized structure does not empower department chairs or drive accountability
• Organization lacks a funds flow structure that encourages tradeoff decisions and financial sustainability
Many challenges in ARTS methodology
• Funded research additive to salary, leading to extremely high salaries for well-funded researchers; compounding effect
• Endowed funds additive to salary rather than being used purely as funding source
• Plan encourages creation of medical director roles to fill compensation gaps
• Plan allows for providers to be funded at greater than 1.0 FTE
Lack of quality or patient satisfaction incentives encourages only volume of work
Plan design threatens financial sustainability
• Compensation and productivity percentiles misaligned
• Plan results in wide range of compensation percentiles
Use of benchmark payout rates creates issues
• Benchmark payout rates include compensation not attributed to wRVUs (e.g., call pay, APP supervision stipends, administrative compensation)
• Providers may earn incentives for lower clinical productivity than that used to set salary

Recent Compensation Plan Changes
•Detailed later in presentationIntroduced organizational definition of
CFTE
•All providers previously received same funding amounts regardless of contributions
Piloted ability for department chairs to define metrics to determine eligibility
for Citizenship/Teaching funding
•All providers must be meet 100% of CFTE-adjusted median wRVU benchmarks to be eligible for clinical incentives
Introduced Minimum wRVU Threshold for Incentive Eligibility
•Decision made in response to misalignment between compensation and productivity percentilesDelayed annual benchmark updates
•First step towards moving to “calculated” rate (clinical salary benchmark divided by wRVU benchmark) to eliminate phenomenon of providers earning clinical incentives for doing less than the prior year
Payout rates held steady for multiple years
•Modest differential for associate professors and professors added in response to most common criticism of plan
•Years of experience recognized for non-dually employed providersRecognition of academic rank
•Incentive pay per new patient visit targeted in areas with access challenges that can be partially attributed to compensation modelNew patient access incentive pilot
42

Compensation Plan Changes Under Consideration
43
• Payout rates would decrease after providers exceed median and 65th
percentile productivity
• Intended to decrease incentives to “churn” patients as well as to underreport CFTEs
Tiered Payout Structure
• Clinical salaries would be no more than CFTE-adjusted benchmark
• Intended to better align reported CFTEs with actual clinical effort
Capping Clinical Salary Floor at Reported-CFTE
• Intended to more appropriately fund medical directors for effort as a percentage of clinical salary floor benchmark as opposed to a historical, generic benchmark
Enhanced Medical Director Funding
• Intended to smooth out cash flow for providers who earn large clinical incentives and reduce pressure to inflate base salaries
Introduction of Monthly Draw vs. Quarterly
Incentives

Compensation Plan Redesign Efforts
44
• Compensation plan redesign efforts, in collaboration with
SullivanCotter, began in 2018
• Goal was to pursue transformational changes to compensation plan
design rather than incremental tweaks to existing plan design
• Primary care and transplant program were first areas of focus
• Completion of redesign and implementation delayed several months by COVID-19
pandemic but new models went live January 1, 2021
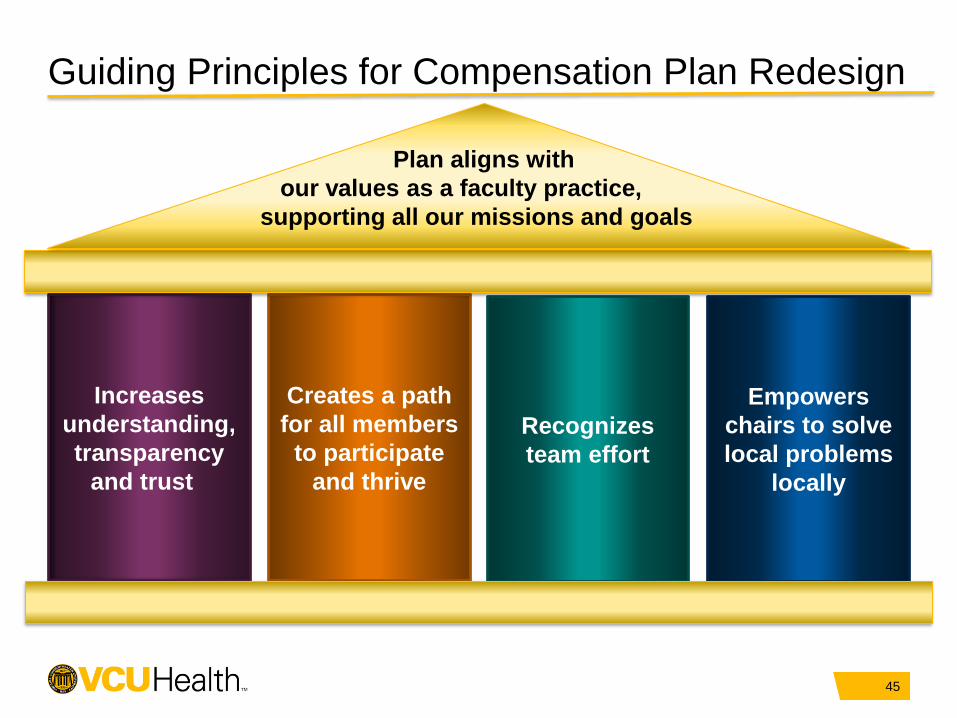
Guiding Principles for Compensation Plan Redesign
45
Increases
understanding,
transparency
and trust
Creates a path
for all members
to participate
and thrive
Recognizes
team effort
Empowers
chairs to solve
local problems
locally
Plan aligns with
our values as a faculty practice,
supporting all our missions and goals

New Compensation Models – January 2021
46
Primary Care Compensation Model
• Reduces salary variability from year to year, moving from model where every incremental wRVUimpacts salary to a model with a larger guaranteed salary tied to minimum work standards
• Maintains ability to rewards high performers through clinical performance salary based on mix of wRVUs and panel size
• Introduces incentive pay based on quality/patient experience metrics
• More departmental control than current model
Transplant Compensation Model(s)
• Separate models for transplant surgery and transplant medicine (ie., transplant hepatology and transplant nephrology)
• Reduces emphasis on wRVUs to encourage faculty to focus on other activities vital to the success of the transplant program (e.g., clinic visits rather than endoscopies)
• Introduces incentive pay based on group quality/program enhancement metrics
• Introduces procurement incentives to reward surgeons outside of wRVUs
• More departmental control than current model

CFTE Approach and
Challenges
47

MCV Physicians CFTE Model
MCVP shifted from departmentally-reported CFTEs to centrally-tracked CFTEs using standard approach defined by practice plan leadership
• Shift led to more physicians being reported as 1.0 CFTE
Implementation of CFTE-adjusted wRVU standards in physician compensation plan increased significance of CFTE definition
Reported CFTE has significant impact in new plan models (e.g., primary care)
• Potential compensation and targets for clinical performance salary/incentives adjusted by reported CFTE
• Minimum work standards tied to reported CFTE
48

MCV Physicians CFTE Model
• Roles must be supported with funding
• CFTE reduction (“Buy down”) should be based on expected time-based effort for role (ie., not based on calculated percentage of compensation)
• Denominator equals 55 hrs/week x 46 weeks/yr (2,530 hours)
• Example: Committee Member = 100 hrs / 2,530 hrs = 0.04 FTE
• Time spent on citizenship and standard teaching duties is included as part of CFTE
• Administrative time related to clinical services (e.g., documentation) is counted in wRVUs and is therefore included as part of CFTE
CFTE model begins at 100%
clinical and factors in approved and
funded reductions (“buy downs”) for
distinct administrative or
teaching roles and funded research
49

Polling Question
50
How does your organization handle committee membership (e.g.,
Promotion & Tenure Committee, Admissions Committee, etc.)?
❑ Stipend w. no CFTE impact
❑ Reduce CFTE w. no stipend
❑ Reduce CFTE and stipend
❑ None – part of baseline expectations

Challenges with CFTE Model – Role Stacking
• Some physicians with administrative roles and research effort adding
up to more than 1.0 FTE before seeing a single patient
• Example below:
• Oftentimes roles may have overlapping responsibilities (e.g. division
chief and medical director of service)
Role Effort
GME Fellowship Program Director 15%
GME Core Residency Associate Program
Director
20%
Department Vice Chair 10%
Hospital Medical Director 10%
Funded Research 54%
Total 109%
51

Challenges with CFTE Model – Underreported CFTEs
• “Buy down” model can result in understated CFTEs
• Clinical responsibilities of physician described in last slide:
• 10 weeks inpatient service, 4 clinics per week
• Equates to 0.65 CFTE1
• Clinical expectations usually not known at corporate level in as much
detail as example above, but many examples of low reported CFTEs
(e.g., 0.1) and high imputed CFTEs (e.g., 0.7) exist in the organization
1.09 ARTS FTE
0.65 CFTE
1.74 Total FTE
1Assumes standard of 8 clinics per week for 1.0 CFTE
52

Challenges with CFTE Model – Accountability for
Administrative Roles
Many examples exist where departments assign new administrative responsibilities to providers but claim that new responsibilities will not impact clinical expectations
Compensation plan leads to high compensation levels for providers with multiple administrative roles and high clinical productivity
• Providers often use protected administrative time to deliver clinical services
• Lack of comprehensive time reporting and/or performance metrics related to administrative roles could put organization at risk
53

Challenges with CFTE Model – Other
Challenges accounting for clinical call contracts
• Physicians receive funding for providing call coverage for external hospitals but this may or may not impact their internal clinical schedule
• Some departments assign effort to these contracts, thus reducing reported CFTE, while others do not
Challenges adjusting expectations for physicians with VA Medical Center appointments (VA 1/8s)
• MCVP developed standard adjustment to a physician’s CFTE to correlate with each VA 1/8 for purposes of benchmarking productivity, but this standard adjustment may not match actual practice
• VAMC has very strict definition of each VA 1/8 based on 40-hour work week but a specific VA appointment does not always translate to the same effort at VCU/MCVP
• For example, 2/8 VA always equates to 10 hours per week for the VA. That physician’s effort at VCU/MCVP may translate to 3 or 4 days per week, depending on the physician and how the 10 hours are scheduled at the VA.
54

Minimum Expectations for CFTE
55
Ambulatory Executive Council endorsed minimum clinical expectations of 8-9 half-day clinic sessions per week for 1.0 ambulatory CFTE
• Implementation of this standard varies across different departments and divisions
• Especially large variances in departmental approaches to adjusting ambulatory expectations in relation to inpatient time
Focus tends to center on specified number of clinics per week rather than annual patient contact hours
• MCVP typically considers 46 weeks of effort per year to account for holiday/vacation/CME time
• Standing clinics, especially on Fridays, may be canceled more frequently than 6 times per year without being rescheduled elsewhere
• Providers may have less than 8 clinic sessions per week because their CFTE is less than 1.0, but then additional clinics are canceled related to the administrative responsibilities that have already been accounted for in the reduced sessions per week
In addition to challenges with reporting accurate CFTEs, opportunities
exist to standardize expectations tied to specific CFTEs

Polling Question
56
Are clinical expectations set and approved by individual clinical
departments or at the corporate level?
❑ Individual clinical departments
❑ Corporate level

Minimum Expectations for CFTE
57
Reported CFTE 1.00
Service Intensity 10 or more patients per day
Days per Week of Coverage 6
x Weeks 10
= Total Inpatient Ward Days 60
x Intensity Multiplier 1
= Inpatient Ward CFTE1,2 0.26
Days per Week of Coverage 0
x Weeks 0
= Total Inpatient Consult Days 0
x Intensity Multiplier 0.5
= Inpatient Consults CFTE3 0.00
Required Ambulatory Clinic/Procedural Sessions 306
Ambulatory CFTE4 0.74
Inpatient Ward CFTE 0.26
+ Inpatient Consults CFTE 0.00
+ Ambulatory CFTE 0.74
= Total CFTE 1.00
Inpatient + Ambulatory CFTE Calculator
Inpatient Ward Coverage
Inpatient Consults Coverage
This section only to be used when inpatient consults is a separate service from inpatient wards
Required Ambulatory Clinic/Procedural Sessions
Total CFTE
Efforts underway
to better
standardize and
track clinical
expectations
based on
providers’
reported CFTEs

© 2020 AAMC. May not be reproduced without permission.© 2021 AAMC. May not be reproduced without permission.
Discussion
58

© 2020 AAMC. May not be reproduced without permission.