an uneven road: u.s. labor markets since 2000
TRANSCRIPT

8/3/2019 An Uneven Road: U.S. Labor Markets Since 2000
http://slidepdf.com/reader/full/an-uneven-road-us-labor-markets-since-2000 1/21
us2010discover america in a new centuryThis report has been peer-
reviewed by the Advisory Board
of the US2010 Project. Views
expressed here are those of
the authors.
US2010 Project
John R. Logan, Director
Brian Stults, Associate Director
Advisory Board
Margo Anderson
Suzanne Bianchi
Barry Bluestone
Sheldon DanzigerClaude Fischer
Daniel Lichter
Kenneth Prewitt
Sponsors
Russell Sage Foundation
American Communities Project
of Brown University
An Uneven Road and Then a Cliff
US Labor Markets
since 2000Harry J. Holzer and Marek Hlavac*
Georgetown Public Policy Institute, Georgetown University
Report Abstract
April 2011
The Great Recession of the past few years follows a complete
economic cycle (2000-07) during which employment outcomes
improved just barely for most Americans, while actually dete-
riorating for some. Hourly wages rose modestly but employ-
ment rates fell from their peaks in 2000, leading to overall
earnings stagnation. Highly educated workers, those with the
very highest earnings levels and women gained relatively more
than others; less educated, male and/or younger workers fell
behind, especially in the Midwest. During the Great Recession
unemployment rates have risen most for younger, less-
educated, and minority workers, especially men. Unemploy-
ment durations are very lengthy while labor market recovery is
likely to be gradual. Policy responses should help unemployed
workers during the short term, while raising worker skills and
job quality in the longer term, and providing additional sup-
ports for those who will be forced to take low-wage jobs.
Material in this report, including charts and tables, may be reproduced with acknowledgment of the source. Citation: Harry J.
Holzer and Marek Hlavac. 2011. “An Uneven Road and Then a Cli : US Labor Markets since 2000” Census Brief prepared for Projec
US2010. http://www.s4.brown.edu/us2010.
8/3/2019 An Uneven Road: U.S. Labor Markets Since 2000
http://slidepdf.com/reader/full/an-uneven-road-us-labor-markets-since-2000 2/21
Introduction
The Great Recession that began at the end of 2007 is the worst economic downturn since the 1930s,and has led to very high and lengthy periods of unemployment for many workers. But, even after werecover from this recession, we face the possibility of returning to a labor market whose secular trendsare not very positive for most workers. Indeed, the groups hurt the most during the recession – especially less-educated men – also fared quite poorly in the period preceding this downturn. Thus, both shorter- and longer-term labor-market developments are sources of concern.
By analyzing data from the Current Population Surveys (CPS) for the years 2000-2010, covering boththe last full economic cycle and the more recent severe downturn, our major findings are as follows:
• Despite fairly high growth in productivity, the rates of employment and earnings growth weobserved overall were quite modest during the economic cycle that occurred between 2000 and2007, especially relative to the boom years of the late 1990s (when employment rates rose totheir highest levels in more than 30 years, while earnings improved across the entire labor force).1
• Inflation-adjusted hourly wages rose modestly and employment rates declined for most groups between 2000 and 2007. The largest gains in wages generally were observed among womenand/or more-educated workers and the smallest gains (in wages) and largest losses (inemployment) generally were observed among men and/or less-educated workers. Annualearnings also rose for women, especially the more-educated among them, while modestearnings losses for men were widespread. The large gaps in earnings and employment of the1980s and 1990s between those with and without college credentials mostly widened in the pastdecade.
• In this same period, hourly and annual earnings increased most for those in the top decile of earners and often in the top one percent; this was true overall and even within educationgroups. Annual earnings of less-educated men declined at all points in their earningsdistribution, while those of women, and especially those women already at the top of theearnings distribution, rose. Earnings also increased more for older workers relative to younger ones, and declined more for those residing in the Midwest and West.
• The severe recession that lasted officially from December 2007 through June 2009 generatedvery high unemployment rates and also lengthy durations of unemployment, especially for less-educated men, younger workers, minorities, and those in the Midwest and West. Thus, many of
the workers hurt most by the Great Recession also lagged behind during the preceding economic cycle.
Our analysis begins by comparing the cycles 1989-2000 and 2000-2007, during which labor-marketdevelopments differed quite markedly. Then, we focus more specifically on the latter period. Weanalyze trends in wages and annual earnings (adjusted for inflation) as well as employment rates in thelatter years, looking especially at who benefitted from growth during these years and who did not.
1 See Krueger and Solow (2002) and Stiglitz (2003) for reviews of economic performance during the 1990s.
8/3/2019 An Uneven Road: U.S. Labor Markets Since 2000
http://slidepdf.com/reader/full/an-uneven-road-us-labor-markets-since-2000 3/21
2
Then we consider the more recent effects of the Great Recession in more detail. Finally, we concludewith some thoughts about the nature of the long-term trends to which we will return after we (slowly)recover from the Great Recession, and about labor-market policies that would be helpful both in theshorter term and beyond.
A Tale of Two Economic Cycles Table 1 presents data on a range of labor market outcomes from the years 1989-2000 and 2000-2007,the last two completed economic cycles measured from one peak to the next.
2Because the former
period is longer than the latter, all outcomes are measured in average annual terms. Also, the former period is divided into two subperiods of roughly equal length (ending and starting respectively in1995), as the outcomes observed in each differ considerably from one another.
The data show that productivity growth (defined as the increase in output, or inflation-adjusted grossdomestic product per hour of work) was relatively high during each cycle, averaging 2.1 percent between 1989 and 2000 and 2.7 percent between 2000 and 2007. But annual employment growthlagged significantly in the latter period (0.8 percent) compared to the former (1.8 percent). Growth inreal compensation, which includes both earnings and the value of employer-provided fringe benefitssuch as contributions to health insurance and pensions, was comparable across the two periods overall,as was growth in hourly and weekly real earnings.
Yet when we consider the two subperiods that constitute the 1990s, a somewhat different pictureemerges. Labor-market outcomes during the period 1989-1995 were considerably weaker than those of 1995-2000. In the latter, high productivity growth (of 2.4 percent per year) translated into highemployment growth (at 2.4 percent per year) as well as high rates of growth in real compensation (2.0 percent), hourly (1.7 percent) and weekly wages (1.6 percent). But after 2000, only the high rates of productivity growth were maintained (and strengthened a bit), while all other labor-market outcomes
weakened. For example, compensation increased by just 1.5 percent and weekly earnings by 0.7 percent.
What might account for the differences across the two cycles? Gaps between productivity andcompensation growth in either period at least partly reflect measurement issues. The prices for capitalgoods (especially computers) and other inputs that are used to adjust for inflation when measuring productivity have risen more slowly than the consumer prices that are used in compensation andearnings, causing compensation to rise more slowly than productivity over time in both periods. Moreimportant, the more-rapidly rising costs of health care we observed after 2000 have also limited theextent to which compensation growth results in earnings and hourly wage growth in that time.3
2 While the National Bureau of Economic Research (NBER) has formally declared that the Great Recession began in
December 2007, it did not affect labor markets until 2008. Thus we treat 2007 here as a peak year. In contrast, the recessionof 1990-91 began midyear and affected labor-market outcomes that year, so we treat 1989 as the peak year of the previous
cycle.3According to the Kaiser Family Foundation (2010), health care premiums increased by 114 percent in nominal terms
between 2000 and 2010, with employer contributions more than doubling in this time period. This is a far higher rate of
growth than was observed during the 1990s.

8/3/2019 An Uneven Road: U.S. Labor Markets Since 2000
http://slidepdf.com/reader/full/an-uneven-road-us-labor-markets-since-2000 4/21
3
T a b l e 1
A n n u a l G
r o w t h R a t e o f S e l e c t e d I n d i c a
t o r s
1 9 8 9 - 2 0 0 0 a n d 2 0 0 0 - 2 0 0 7
A v e r a g e A n n u a l G r o w t h R a t e
T i m e P e r i o d
P r o d u
c t i v i t y
R e a l H o u r l y C o m p e n s a t i o n
E m p l o y m e n t
R e a l H o u r l y W a g e s
R e
a l W e e k l y E a r n i n g s
1 9 8 9 - 2 0 0 0
2 . 1
%
1 . 5
%
1 . 8
%
0 . 9
%
0 . 8
%
1 9 8 9 - 1 9 9 5
1 . 6
%
0 . 8
%
1 . 4
%
0 . 0
%
- 0 . 1
%
1 9 9 5 - 2 0 0 0
2 . 4
%
2 . 0
%
2 . 4
%
1 . 7
%
1 . 6
%
2 0 0 0 - 2 0 0 7
2 . 7
%
1 . 5
%
0 . 8
%
0 . 9
%
0 . 7
%
N o t e s : P r o d u c t i v i t y ( i . e . , o u
t p u t p e r h o u r ) a n d c o m p e n s a t i o n g r o w t h g u r e s r e l a t e t o n o n - f a r m b
u s i n e s s e s , a n d a r e d e r i v e d f r o m t
h e M a j o r S e c t o r P r o d u c t i v i t y d a t a o f t h e B u r e a u o f L a b o r S t a t i s t i c s .
E m p l o y m e n t g u r e
s i n c l u d e t o t a l n o n - f a r m e
m p l o y m e n t , a n d a r e d e r i v e d f r o m t
h e C u r r e n t E m p l o y m e n t S t a t i s t i c s s u r v e y .
E a r n i n g s g u r e s r e l a t e t o p r o d u c t i o n a n d n o n - s u p
e r v i s o r y o n p r i v a t e
n o n - f a r m p
a y r o l l s , a n d a r e d e r i v e d f r o m t
h e C u r r e n t E m p l o y m e n t S t a t i s t i c s s u r v e y .
H o u r l y a n d w e e k l y e a r n i n g s , a s w e l l a s
a f t e r - t a x c o r p o r a t e p r o t s , a r e d e a t e d u s i n g t h e c
h a i n - w e i g h t e d
P e r s o n a l C o n s u m p t i o n E x p e n d i t u r e s ( P C E ) v e r s i o n o f t h e G D P d e a t o r , c o n s t r u c t e d b y t h e B u r e a u o f E c o n o m i c A n a l y s i s .
S o u r c e : B u r e a u o f L a b o r S t a
t i s t i c s , B u r e a u o f E c o n o m i c A n a l y s i s .
8/3/2019 An Uneven Road: U.S. Labor Markets Since 2000
http://slidepdf.com/reader/full/an-uneven-road-us-labor-markets-since-2000 5/21
4
But the differences between the two periods likely reflect differences in underlying economic andinstitutional forces as well.4 When both employment and compensation grow more slowly in one time period than another, most economists will infer that the demand for labor among employers is likelygrowing more slowly in that period, relative to its supply. During the late 1990s, strong demand amongconsumers for goods and services apparently generated strong demand for workers by employers; productivity growth helped keep down costs and prices.
However, during the 2000s, employers seemed able to meet the growing demand for goods andservices with relatively less growth in the numbers of workers they employed, perhaps usingtechnological change and globalization (in the form of imports of goods or offshoring of service production) more successfully to limit employment.
5And, as their demand for labor became more
limited, their need to compensate workers more highly in order to attract and retain them diminished aswell. As a result, the share of profits in gross domestic product rose as well in this period; and, due tosome peculiarities in the structure of financial-market bonuses and executive compensation, theamount of compensation that went to very small numbers of financial managers and corporateexecutives rose quite dramatically.6
Overall, the boom period 1995-2000 appears to have been an outlier, in terms of labor marketoutcomes, relative to other years both earlier and later.7 Thus, we focus more heavily on the period2000-2007 below, which we believe more likely reflects secular trends in the U.S. labor market.
The Distribution of Employment and Earnings Growth, 2000-2007 Modest increases in the demand for labor in the aggregate likely limited overall employment andearnings growth during 2000-2007. Still, aggregate average growth rates can mask wide differences inemployment and earnings growth across different groups of workers.
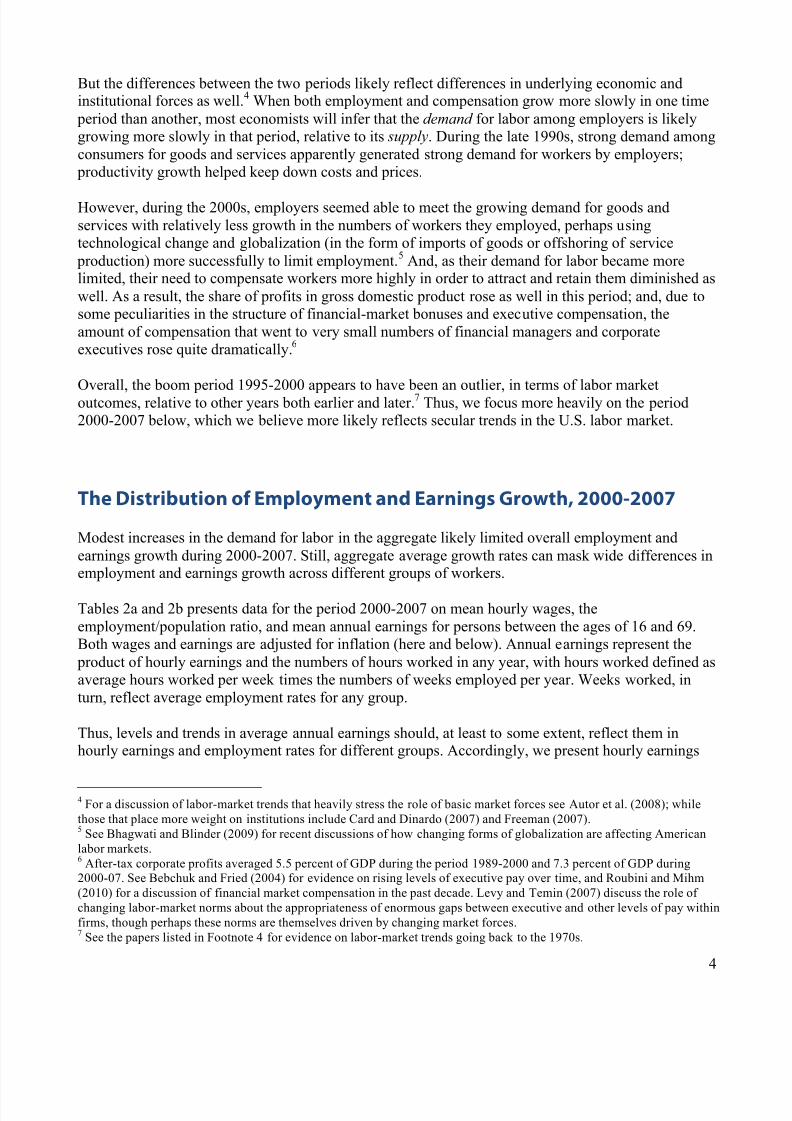
Tables 2a and 2b presents data for the period 2000-2007 on mean hourly wages, theemployment/population ratio, and mean annual earnings for persons between the ages of 16 and 69.Both wages and earnings are adjusted for inflation (here and below). Annual earnings represent the product of hourly earnings and the numbers of hours worked in any year, with hours worked defined asaverage hours worked per week times the numbers of weeks employed per year. Weeks worked, inturn, reflect average employment rates for any group.
Thus, levels and trends in average annual earnings should, at least to some extent, reflect them inhourly earnings and employment rates for different groups. Accordingly, we present hourly earnings
4 For a discussion of labor-market trends that heavily stress the role of basic market forces see Autor et al. (2008); while
those that place more weight on institutions include Card and Dinardo (2007) and Freeman (2007).5 See Bhagwati and Blinder (2009) for recent discussions of how changing forms of globalization are affecting American
labor markets.6 After-tax corporate profits averaged 5.5 percent of GDP during the period 1989-2000 and 7.3 percent of GDP during2000-07. See Bebchuk and Fried (2004) for evidence on rising levels of executive pay over time, and Roubini and Mihm
(2010) for a discussion of financial market compensation in the past decade. Levy and Temin (2007) discuss the role of
changing labor-market norms about the appropriateness of enormous gaps between executive and other levels of pay within
firms, though perhaps these norms are themselves driven by changing market forces.7 See the papers listed in Footnote 4 for evidence on labor-market trends going back to the 1970s.
8/3/2019 An Uneven Road: U.S. Labor Markets Since 2000
http://slidepdf.com/reader/full/an-uneven-road-us-labor-markets-since-2000 6/21
5
T a b l e 2 a
M e
a n E m p l o y m e n t O u t c o m e s
B y G e n d e r a n d E d u c a t i o n
2 0 0 0 - 2 0 0 7
H o u r
l y W a g e s
E m p l o y m e n t / P o p u l a t i o n R a t i o
C a t e
g o r y
2 0 0 0
2 0 0 7
C h a n g e
2 0 0
0
2 0 0 7
C h a n g e
( 2 0 1 0 d o l l a r s )
A l l
$
2 0 . 2
3
$
2 1 . 6
3
6 . 9
%
0 . 7 1
0 . 6
9
- 0 . 0
2
B y G e n d e r :
M e n
$
2 2 . 8
1
$
2 4 . 0
1
5 . 3
%
0 . 7 7
0 . 7
5
- 0 . 0
2
W o m e n
1 7 . 4
5
1 9 . 0
8
9 . 3
0 . 6 5
0 . 6
4
- 0 . 0
1
B y E d u c a t i o n :
H i g h S c h o o l D r o p o u t s
$
1 2 . 1
0
$
1 2 . 7
3
5 . 1
%
0 . 4 9
0 . 4
8
- 0 . 0
1
H i g h S c
h o o l G r a d u a t e s
1 6 . 2
6
1 6 . 7
7
3 . 2
0 . 6 8
0 . 6
6
- 0 . 0
2
S o m e C o l l e g e ,
N o D e g r e e
1 8 . 3
1
1 8 . 5
4
1 . 3
0 . 7 5
0 . 7
2
- 0 . 0
3
A s s o c i a t e ' s D e g r e e
2 0 . 0
6
2 0 . 8
3
3 . 9
0 . 8 0
0 . 7
7
- 0 . 0
3
B a c h e l o r ' s D e g r e e
2 7 . 1
1
2 8 . 3
3
4 . 5
0 . 8 1
0 . 7
9
- 0 . 0
2
A d
v a n c e d D e g r e e
3 3 . 4
2
3 5 . 8
2
7 . 2
0 . 8 3
0 . 8
1
- 0 . 0
2
M e n
b y E d u c a t i o n :
H i g h S c h o o l D r o p o u t s
$
1 3 . 5
4
$
1 4 . 0
1
3 . 4
%
0 . 5 8
0 . 5
7
- 0 . 0
1
H i g h S c
h o o l G r a d u a t e s
1 8 . 5
6
1 8 . 7
7
1 . 2
0 . 7 6
0 . 7
3
- 0 . 0
3
S o m e C o l l e g e ,
N o D e g r e e
2 0 . 8
4
2 0 . 8
9
0 . 2
0 . 8 1
0 . 7
7
- 0 . 0
4
A s s o c i a t e ' s D e g r e e
2 2 . 8
4
2 3 . 2
0
1 . 6
0 . 8 4
0 . 8
1
- 0 . 0
3
B a c h e l o r ' s D e g r e e
3 0 . 6
0
3 1 . 9
9
4 . 5
0 . 8 7
0 . 8
5
- 0 . 0
2
A d
v a n c e d D e g r e e
3 7 . 1
5
4 0 . 6
5
9 . 4
0 . 8 6
0 . 8
5
- 0 . 0
1
W o m e n
b y E d u c a t i o n :
H i g h S c h o o l D r o p o u t s
$
1 0 . 0
5
$
1 0 . 6
6
6 . 1
%
0 . 4 0
0 . 3
9
- 0 . 0
1
H i g h S c
h o o l G r a d u a t e s
1 3 . 7
8
1 4 . 4
3
4 . 7
0 . 6 2
0 . 6
0
- 0 . 0
3
S o m e C o l l e g e ,
N o D e g r e e
1 5 . 7
5
1 6 . 2
4
3 . 1
0 . 7 0
0 . 6
7
- 0 . 0
3
A s s o c i a t e ' s D e g r e e
1 7 . 7
6
1 8 . 8
6
6 . 2
0 . 7 6
0 . 7
4
- 0 . 0
2
B a c h e l o r ' s D e g r e e
2 3 . 4
5
2 4 . 7
2
5 . 4
0 . 7 5
0 . 7
4
- 0 . 0
1
A d
v a n c e d D e g r e e
2 8 . 9
9
3 0 . 7
9
6 . 2
0 . 7 9
0 . 7
7
- 0 . 0
2
N o t e s : T h e s a m p l e i s r e s t r i c t e d t o a g e s 1 6 - 6 9 .
I t e x c l u d e s a g r i c u l t u r e a n d t h e m i l i t a r y . I t
a l s o e x c l u d e s f u l l - t i m e s t u d e n t s a n d s e l f - e m p l o y e d
i n d i v i d u a l s . I n
d i v i d u a l s w i t h w i t h h o u r l y w a g e s b e l o w $ 2 a n d a b o v e $ 5 , 0
0 0 a r e n
o t i n c l u d e d .
S o u r c e : C u r r e n t P o p u l a t i o n S u r v e y ,
O u t g o i n g R o t a t i o n G r o u p s .

8/3/2019 An Uneven Road: U.S. Labor Markets Since 2000
http://slidepdf.com/reader/full/an-uneven-road-us-labor-markets-since-2000 7/21
6
and employment rates in Table 2a and annual earnings in 2b. For each measure, we present levels in2000, 2007, and rates of change over the entire period. Separate results appear for males and females,
and also for groups within each gender defined by their levels of educational attainment: high-schooldropouts, high-school graduates, and those with associate’s, bachelor’s and graduate degrees.
Table 2b
Mean Employment OutcomesBy Gender and Education
2000-2007
Annual Earnings
Category 2000 2007 Change
(2010 dollars)
All $ 44,183 $ 45,357 2.7 %
By Gender:
Men $ 54,516 $ 53,404 -2.0 %
Women 33,331 36,767 10.3
By Education:
High School Dropouts $ 23,134 $ 23,322 0.8 %
High School Graduates 32,881 32,869 0.0
Some College, No Degree 39,157 38,346 -2.1Associate's Degree 42,862 42,445 -1.0
Bachelor's Degree 61,364 60,302 -1.7
Advanced Degree 84,181 83,709 -0.6
Men by Education:
High School Dropouts $ 27,802 $ 26,681 -4.0 %
High School Graduates 39,979 38,234 -4.4
Some College, No Degree 48,493 45,716 -5.7
Associate's Degree 53,741 50,380 -6.3
Bachelor's Degree 77,450 74,118 -4.3
Advanced Degree 104,785 103,270 -1.4
Women by Education:High School Dropouts $ 16,792 $ 17,563 4.6 %
High School Graduates 25,271 26,494 4.8
Some College, No Degree 30,025 31,156 3.8
Associate's Degree 33,552 35,978 7.2
Bachelor's Degree 45,223 47,069 4.1
Advanced Degree 60,633 64,325 6.1
Notes: The sample is restricted to ages 16-69. It excludes agriculture
and the military. It also excludes full-time students and
self-employed individuals. Individuals with annual earnings below
$1,000 and above $10 million are not included.
Source: Current Population Survey,
Annual Social and Economic Supplement.
Notes: This sample is restricted to ages 16-69. It excludes agriculture and the military. It also excludes full-time studentsand self-employed individuals. Individuals with annual earnings below $1,000 and above $10 million are not included.
Source: Current Population Survey, Annual Social and Economic Supplement.

8/3/2019 An Uneven Road: U.S. Labor Markets Since 2000
http://slidepdf.com/reader/full/an-uneven-road-us-labor-markets-since-2000 8/21
7
Table 2a shows that mean hourly earnings rose for most groups between 2000 and 2007, whileemployment rates generally declined slightly. Hourly wage gains were generally modest, 6.9 percentover the whole period, averaging just 1 percent per year overall, though they were larger for womenthan for men, 9.3 percent versus 5.3 percent over the whole period.8 Within each gender, the smallesthourly earnings gains in percent terms appear at the middle of the education distribution, among thosewith more than a high-school diploma but less than a bachelor’s degree.
At least superficially, these earnings changes are consistent with the notion of growing labor market polarization and declining earnings in the middle of the distribution, relative to that at the top or bottom, as David Autor (2010) and others have argued. On the other hand, the absolute magnitudes of the gains in hourly earnings among high-school dropouts and high-school graduates are very small(based on increases of 5.1 percent on a very low earnings level versus 3.2 percent on a somewhathigher one), while those for college graduates and above are substantially larger (based on changes of 4.5 percent and 7.2 percent on much higher earnings levels). Thus, the gaps in hourly earnings acrosseducation groups that grew so wide in the 1980s and 1990s mostly tended to further widen in the 2000-2007 economic cycle.
And employment rates, while declining from their peaks in 2000 among most groups, tended to declinemore among those with less than a bachelor’s degree and especially among men, thus reinforcing thegeneral pattern of changes observed for these groups in hourly wages. Declining employment reflected both lower labor-force participation for most groups and lower employment (or higher unemployment)for those in the labor market. The fact that changes in hourly wages and employment rates are positively correlated across groups also suggests that shifts in employer demand, away from less-educated workers and especially men and towards more educated workers and/or women in the servicesectors, are likely driving the observed changes in relative employment outcomes.
Accordingly, in Table 2b we see that annual earnings on average grew by 10.3 percent for all women,with larger gains observed among those with more educational attainment, while real earnings declined by 2.0 percent for all men. Again, the large gaps in earnings that already existed across theseeducational groups in 2000 – reflecting growing earnings inequality during the previous two decades – either remained or widened a bit more over the period 2000-2007.9
By 2007, all high-school graduates were earning just 55 percent of what college graduates wereearning ($32,869 versus $60,302), while those with bachelor’s degrees were earning only 72 percent of what those with advanced degrees earned ($60,302 versus $83,709). These gaps are quite high by anyhistorical standard. At the same time, the earnings of women were now 69 percent relative to those of men ($36,767 versus $53,404); the gender gap has been declining, but has not disappeared, over thelast several decades.10
8 The increases in hourly wages are statistically significant, as are the declines in employment rates. Details regarding the
standard errors on our estimates are available from the authors.9 See Goldin and Katz (2008) for a recent discussion of how and why the gaps in earnings between more- and less-educated
Americans have widened during the past three decades.10 The progress of women relative to men in the workforce in relative earnings seems to reflect higher levels of education
and experience among women relative to what they earned in the past; indeed, women now go to college and earn
bachelor’s degrees at significantly higher rates than men. At the same time, their relative earnings might still be impeded by
labor-market discrimination as well as by the loss of work experience for mothers associated with childbearing and
childrearing.

8/3/2019 An Uneven Road: U.S. Labor Markets Since 2000
http://slidepdf.com/reader/full/an-uneven-road-us-labor-markets-since-2000 9/21

8/3/2019 An Uneven Road: U.S. Labor Markets Since 2000
http://slidepdf.com/reader/full/an-uneven-road-us-labor-markets-since-2000 10/21
9
Workers holding associate degrees continue to enjoy substantial earnings gains relative to high-schoolgraduates and dropouts, as do college graduates to an even greater degree. Thus the economic returnsto postsecondary degrees at both the associate’s and especially the bachelor’s degree levels remainstrong, and there are important opportunities for advancement of less-skilled workers in both themiddle as well as the top of the labor market.11
But, even within gender and education groups, the observed changes in average (mean) earnings mask a wide distribution of larger and smaller changes. So, in Table 3, we consider the levels of hourly andannual earnings in 2000 and 2007 (in parts a and b of the table respectively), as well as percentchanges, between these years, for workers at different points in the earnings distribution: at the 10
th,
50th, 90th and 99th percentiles of earnings. These numbers are presented for all workers and also for less- and more-educated workers, represented by those with a high school diploma or less versus thosewith a bachelor’s degree or greater.
Table 3 shows that median hourly and annual earnings (at the 50th percentile) of workers overallincreased only very modestly, by 4.51 percent and 3.2 percent respectively, during the 2000-2007
period. But hourly earnings grew much more substantially for those at the 90
th
percentile of earnings,8.73 percent for all workers, and especially at the 99 th percentile among women, about 19 percent. Thevery large gaps across the whole earnings distribution that already existed in 2000 thus widened further during this economic cycle. Among more-educated workers and especially more-educated women, theearnings increases at the top of the distribution were very pronounced. Thus, the corporate executivesand financial market managers who were heavily concentrated among that top one percent did much better than all other workers.
In Table 4 we present similar measures of annual earnings levels and changes, but this time for demographic groups defined by age, race and geographic region. We find that some groupsconsistently outperformed others in terms of earnings growth during this period. On average, older workers improved their earnings while younger workers did worst; Hispanics did better than blacksand whites; and residents of other regions outperformed those in the Midwest.
Younger workers were most affected by labor-market shifts, especially in the industrial heartland of the Midwestern region. A dramatic nationwide decline occurred in manufacturing employment during2000-2007, when about one-fifth of all such jobs disappeared. This decline no doubt contributed to therelatively weaker labor-market performance of less-educated men and especially those residing in theMidwest. In contrast, the two coasts boomed during this period, though all of these areas sufferedconsiderably during the Great Recession that followed.12
11 The notion that the middle of the job market has been disappearing has been advanced by Autor (2010) and challenged by Holzer (2010), among others.12 According to the Bureau of Labor Statistics (2011), the nation’s manufacturing employment dropped from 17.3 million in
2000 to 13.9 million in 2007. The latter continued to fall to nearly 11 million in 2010, thus further weakening the Midwest
region during the Great Recession. But the bursting of the housing price bubble was more severe in several coastal areas,
thus contributing to severe recessionary effects there as well.

8/3/2019 An Uneven Road: U.S. Labor Markets Since 2000
http://slidepdf.com/reader/full/an-uneven-road-us-labor-markets-since-2000 11/21
10
T a b l e 4
H o u r l y W a g e s a n d A n n u a l E a r n i n g s
B y D e m o g r a p h i c
G r o u p , E d u c a t i o n a n d C e n s u s R e g i o n
2 0 0 0 - 2 0 0 7
M e d i a
n H o u r l y W a g e s
M e d i a n A n n u a l E a r n i n g s
C a t e g o r y
2 0 0 0
2 0 0 7
C h a n g e
2 0 0 0
2 0 0 7
C h a n g e
- - - - - - - - - - - - - - - - - - - - - - - - - - - - ( 2 0 1 0 D o l l a r s ) - - - - - - - - - - - - - - - - - - - - - - - - - - - -
- - - - - - - - - - - - - - - - - - - - - - - - - - - - ( 2 0 1 0 D o l l a r s ) - - - - - -
- - - - - - - - - - - - - - - - - - - - - -
A l l
$
1 6 . 4 0
$
1 7 . 1 4
4 . 5 1 %
$
3 3 , 4 2 0
$
3 4 , 4 8 5
3 . 2 %
B y A g e G r o u p :
1 6 - 3 4
$
1 3 . 7 2
$
1 3 . 9 2
1 . 4 7 %
$
2 6 , 6 1 2
$
2 6 , 3 1 7
- 1 . 1 %
3 5 - 5 4
1 8 . 6 5
1 9 . 5 9
5 . 0 1
3 9 , 3 9 1
4 0 , 0 0 1
1 . 6
5 5 - 6 9
1 7 . 0 1
1 8 . 8 5
1 0 . 8 0
3 3 , 4 2 0
3 6 , 8 4 3
1 0 . 2
B y R a c e :
W h i t e
$
1 7 . 7 0
$
1 8 . 6 7
5 . 4 3 %
$
3 7 , 1 3 3
$
3 7 , 8 9 6
2 . 1 %
B l a c k
1 3 . 7 7
1 4 . 3 9
4 . 4 8
2 8 , 4 6 9
2 9 , 4 7 5
3 . 5
H i s p a n i c
1 2 . 3 1
1 3 . 0 5
6 . 0 1
2 3 , 5 1 8
2 5 , 2 6 4
7 . 4
B y C e n s u s R e g i o n :
N o r t h e a s t
$
1 7 . 7 0
$
1 8 . 5 7
4 . 9 1 %
$
3 7 , 1 3 3
$
3 6 , 8 4 3
- 0 . 8 %
M i d w e s t
1 6 . 8 0
1 6 . 9 0
0 . 6 1
3 4 , 6 5 7
3 3 , 6 8 5
- 2 . 8
S o u t h
1 5 . 1 8
1 5 . 9 6
5 . 1 9
3 0 , 9 4 4
3 1 , 7 9 1
2 . 7
W e s t
1 7 . 2 4
1 8 . 1 8
5 . 4 7
3 3 , 4 2 0
3 5 , 7 9 1
7 . 1
N o t e s : T h e s a m p l e i s r e s t r i c t e d t o a g e
s 1 6 - 6 9 . I t e x c l u d e s a g r i c u l t u r e a n d t h e m i l i t a r y . I t a l s o e x c l u d e s f u l l - t i m e s t u d e n t s
a n d s e l f - e m p l o y e d i n d i v i d u a l s .
S o u r c e : C u r r e n t P o p u l a t i o n S u r v e y , O u
t g o i n g R o t a t i o n G r o u p s a n d A n n u a l S o c i a l a n d E c o n o m i c S u p p l e m e n t .
8/3/2019 An Uneven Road: U.S. Labor Markets Since 2000
http://slidepdf.com/reader/full/an-uneven-road-us-labor-markets-since-2000 12/21
11
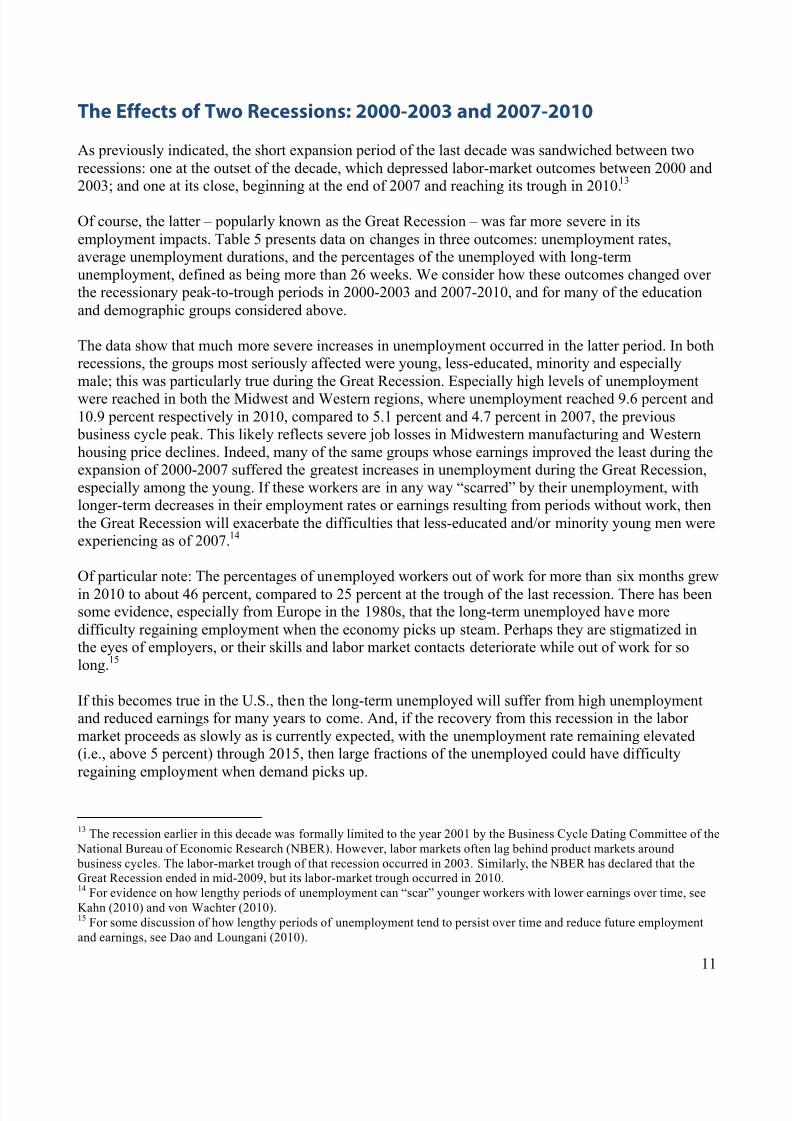
The Effects of Two Recessions: 2000-2003 and 2007-2010 As previously indicated, the short expansion period of the last decade was sandwiched between tworecessions: one at the outset of the decade, which depressed labor-market outcomes between 2000 and2003; and one at its close, beginning at the end of 2007 and reaching its trough in 2010.13
Of course, the latter – popularly known as the Great Recession – was far more severe in itsemployment impacts. Table 5 presents data on changes in three outcomes: unemployment rates,average unemployment durations, and the percentages of the unemployed with long-termunemployment, defined as being more than 26 weeks. We consider how these outcomes changed over the recessionary peak-to-trough periods in 2000-2003 and 2007-2010, and for many of the educationand demographic groups considered above.
The data show that much more severe increases in unemployment occurred in the latter period. In bothrecessions, the groups most seriously affected were young, less-educated, minority and especiallymale; this was particularly true during the Great Recession. Especially high levels of unemploymentwere reached in both the Midwest and Western regions, where unemployment reached 9.6 percent and10.9 percent respectively in 2010, compared to 5.1 percent and 4.7 percent in 2007, the previous business cycle peak. This likely reflects severe job losses in Midwestern manufacturing and Westernhousing price declines. Indeed, many of the same groups whose earnings improved the least during theexpansion of 2000-2007 suffered the greatest increases in unemployment during the Great Recession,especially among the young. If these workers are in any way “scarred” by their unemployment, withlonger-term decreases in their employment rates or earnings resulting from periods without work, thenthe Great Recession will exacerbate the difficulties that less-educated and/or minority young men wereexperiencing as of 2007.14
Of particular note: The percentages of unemployed workers out of work for more than six months grew
in 2010 to about 46 percent, compared to 25 percent at the trough of the last recession. There has beensome evidence, especially from Europe in the 1980s, that the long-term unemployed have moredifficulty regaining employment when the economy picks up steam. Perhaps they are stigmatized inthe eyes of employers, or their skills and labor market contacts deteriorate while out of work for solong.15
If this becomes true in the U.S., then the long-term unemployed will suffer from high unemploymentand reduced earnings for many years to come. And, if the recovery from this recession in the labor market proceeds as slowly as is currently expected, with the unemployment rate remaining elevated(i.e., above 5 percent) through 2015, then large fractions of the unemployed could have difficultyregaining employment when demand picks up.
13 The recession earlier in this decade was formally limited to the year 2001 by the Business Cycle Dating Committee of the
National Bureau of Economic Research (NBER). However, labor markets often lag behind product markets around
business cycles. The labor-market trough of that recession occurred in 2003. Similarly, the NBER has declared that theGreat Recession ended in mid-2009, but its labor-market trough occurred in 2010.14 For evidence on how lengthy periods of unemployment can “scar” younger workers with lower earnings over time, see
Kahn (2010) and von Wachter (2010).15 For some discussion of how lengthy periods of unemployment tend to persist over time and reduce future employment
and earnings, see Dao and Loungani (2010).

8/3/2019 An Uneven Road: U.S. Labor Markets Since 2000
http://slidepdf.com/reader/full/an-uneven-road-us-labor-markets-since-2000 13/21

8/3/2019 An Uneven Road: U.S. Labor Markets Since 2000
http://slidepdf.com/reader/full/an-uneven-road-us-labor-markets-since-2000 14/21
13
! # $ % & ' !
' #
! " # $ " % & ( ) *
+ , - . # " / 0
1 2 3 4 % 2 5 6 % " 7 8 5 4 9 7
" % & 2 % : ; 4 < = 2 $ 2 % $ 9 > 2 & " ?
@ A B B /
C A B / B
(
) * + , - . / + * ) 0 1 2 0 *
3 2 4 2 ) 4 / 1 2 0 *
5 . 6 7 4 * 8
9 6 7 * 2 6 .
: ; 2
< . 7
5 0 2 = >
= 4 >
8/3/2019 An Uneven Road: U.S. Labor Markets Since 2000
http://slidepdf.com/reader/full/an-uneven-road-us-labor-markets-since-2000 15/21
14
This could also result if the structure of the economy and the labor market undergoes more rapid permanent change during this downturn than usual, with jobs growing in new firms and demandingnew skill sets relative to those which workers possess. If some of the observed declines inmanufacturing employment are permanent, such shifts in the structure of employment and skillsdemanded during the recovery become more likely. Or the new jobs might be located in different
regions of the country than where the unemployed live, and their geographic mobility could beimpeded by the declines in housing prices that they have experienced.
Either way, some “structural” unemployment would result, making it harder for employers to fillvacant jobs once they begin to grow in number. A bit of evidence on this appears in Figure 1, wherewe present both unemployment and job vacancy rates from January 2001 through October 2010.Though unemployment and job vacancy rates tend to move in opposite directions, there is someevidence of rising job vacancy rates in late 2009 and much of 2010, even while unemployment remainsvery high. This suggests the possibility of some structural impediments to filling vacant jobs, thoughmore data are needed to prove this.16
Conclusion and Implications for Policy
The data above show that the labor market for much of the previous decade was uneven in the bestyears and cataclysmic in the worst. During 2000-2007, overall employment and earnings growth werequite modest; the median worker gained little ground, while less-educated men, as well as youngand/or Midwest workers, lost relative ground. Then, in the years during and after the Great Recession,unemployment rose dramatically – and especially among the same groups who had not fared wellearlier in the decade.
Most economists expect a slow recovery from the current downturn, which is often the case after a
financial “bubble” bursts. Unemployment remained more than 9 percent for all of 2010 and will likelyremain high for the next several years, declining only modestly each year.17 For example, in January2011, the Congressional Budget Office forecast that the unemployment rate would remain above 5 percent for most of 2015.
Previous research shows that certain groups of workers – especially the young who enter the labor market during such inauspicious times and permanent job losers who suffer long-term unemployment – are likely to be “scarred” by their experiences and to suffer from lower earnings for many years, evenafter the labor market recovers.
And, when such recovery occurs, to what kind of labor market will we return? Are we more likely to
revert to the economy of the latter part of the 1990s, with its widely shared employment and earningsgrowth, or the 2000s, when the growth in demand for many kinds of labor was more limited, and whenemployment and earnings growth were limited and uneven as well?
16 See Elsby et al. (2010) for a discussion of recent trends in unemployment and job vacancy rates, and what they imply for
structural unemployment.17 See Reinhart and Rogoff (2009) for a discussion of how recessions brought on by financial market turmoil generates
persistent unemployment over time. Forecasts of unemployment rates over the next decade have been generated by the
Congressional Budget Office (2010).

8/3/2019 An Uneven Road: U.S. Labor Markets Since 2000
http://slidepdf.com/reader/full/an-uneven-road-us-labor-markets-since-2000 16/21
15
We have no way to forecast future trends; but unfortunately, the late 1990s now look more like theanomalous period, while the period 2000-2007 more likely reflects the secular trends to which we willreturn. For instance, we have no reason to believe that the forces generating limited labor demand inthe last decade – including technological changes and growing globalization – will have very differenteffects in the coming decade.18 Productivity growth will hopefully remain strong, though that is notcertain; and, even if it does, much of it may not show up in many workers’ paychecks. Other drains on
earnings growth, such as rising health care costs, show little sign of abatement, while the future trendsin executive and financial manager compensation (which shifted so much compensation to the top 10 percent and especially the top 1 percent of workers) remain quite unclear.
With such an uncertain forecast for both the near-term and longer-term, how should labor-market policy respond? At a minimum, extensions of unemployment insurance payments (as well as foodstamps and Medicaid) need to remain in effect while the aggregate unemployment rate remains sohigh. Fears that such extensions will discourage job search and reemployment might make sense in aneconomy with tight labor markets and significant job availability, but not in a market with so muchslack.19 Reemployment services that better help match these workers to existing jobs and provide themwith necessary assistance with job search or skills training should be considered as well.
Over the longer term, and even in a generally weak labor market, there remains a strong case for improving the educational outcomes of workers. These outcomes should include certificates anddegrees at two-year schools (i.e., community and technical colleges) as well as those at four-year colleges and universities. Though earnings growth in the 2000s was modest even for college graduates,the enormous and sometimes growing gaps in earnings between more- and less-educated workerssuggest great scope for improving earnings and for dampening inequality if more of them could havesuch credentials. And this means not only improving the access of many Americans to the full range of colleges, but also raising rates of completion of degrees and certificates there.20
Of course, what happens in the labor markets depends not only on the quality of workers and their skills, but also on the quality of jobs created by employers. On a more positive note, and contrary tomany popular accounts, the U.S. labor market continues to create many millions of high-quality jobs(Holzer et al. 2011); but, in contrast to jobs in previous generations, these jobs increasingly requireworkers who have good basic skills and educational credentials.21 From a policy point of view, it istherefore important that the skills obtained by workers match the areas of the labor market wheredemand is strongest, and that we give them the credentials sought by employers in well-paying jobs.Potential workers need more career guidance from workforce development systems on where labor-market demand is strong, and employers need to be engaged in the process of generating workers’
18 See Freeman (2007a) and Blinder (2007) for pessimistic accounts of how global forces will affect workers in the comingdecade.19 Recent evidence suggesting that unemployment insurance only modestly affects job search and unemployment rates can
be found in Card et al. (2007).20 See Goldin and Katz op. cit. for a discussion of how rising rates of college completion might help dampen inequality, and
Haskins et al. (2009) for a discussion of how college completion rates can be improved, especially among lower-to middle-income Americans.21 In this study, the quality of a job is distinguished from the quality of workers by whether or not the firm pays a wage
premium greater than what the worker usually obtains in others jobs in the labor market. With longitudinal earnings data
over many years for both workers and firms, the authors were able to estimate “worker effects” and “firm effects” where
the latter reflect job quality.

8/3/2019 An Uneven Road: U.S. Labor Markets Since 2000
http://slidepdf.com/reader/full/an-uneven-road-us-labor-markets-since-2000 17/21
16
skills to fill their available jobs, through “sectoral” training programs, apprenticeships, and other kindsof incumbent worker training.22
Also, we need to encourage the creation of more good-paying jobs by employers, as well as the skillsof workers to fill them. Historically, we have used legal and institutional methods like higher minimumwages and collective bargaining to do so. While we continue to believe these institutions play
important roles in the labor market, we also believe that their ability to raise private sector wages isconsiderably lower than in earlier eras.23
Thus, efforts to induce employers to create more good-paying jobs might have to rely more on “carrots,” such as subsidies and technical assistance related to broader economic development efforts, and less on “sticks” than in the past.24
And, for those workers whose education and skills remain limited and who face only the prospects of employment at low wages, other forms of income supplementation may need to be considered. For instance, the Earned Income Tax Credit (EITC) from the federal government currently enhances theearnings of low-income parents with two or more children by as much as 40 percent; but childlessadults and non-custodial parents paying child support benefit little from the current system. Expandingfederal EITC eligibility, and enhancing payments to these currently underserved groups, are ways in
which earnings can be supplemented and inequality reduced even in a labor market generating flatearnings growth and enormous gaps between the highest- and lowest-paid workers.25
22 See Furchtgott-Roth et al. (2010) for a discussion of how improvements in the attainment of degrees and certificates,
especially at community colleges, can improve economic mobility for disadvantaged Americans, and also on the need to
make sure that such certifications are linked to trends in labor-market demand. See Maguire et al. (2010) for recentevidence on sectoral training programs and Kemple (2008) for evidence on the success of Career Academies. Lerman
(2007) also discusses the potential of career education to improve labor-market outcomes for disadvantaged youth.23 The fractions of private-sector workers covered either by federal minimum wages or collective bargaining are both very
low: for the latter, less than 7 percent of workers are now covered, while the fraction covered by the former depends on the
statutory minimum relative to the median market wage at any time but is always less than 10 and often less than 5 percent.
In addition, when labor and product markets become more competitive, as they no doubt have in recent decades, the ability
of these institutions to raise wages without creating job losses diminishes as well, unless the higher wages are offset byhigher worker productivity.24 See Holzer et al. (2011) for a review of such efforts, including tax credits for incumbent worker training, technical
assistance for firms trying to improve worker promotion possibilities, and the like.25 See Edelman et al. (2009) for a discussion of how the Earned Income Tax Credit might be expanded to improve coverage
of low-income childless adults and especially non-custodial fathers paying child support.

8/3/2019 An Uneven Road: U.S. Labor Markets Since 2000
http://slidepdf.com/reader/full/an-uneven-road-us-labor-markets-since-2000 18/21
17
References
Autor, D. (2010.) The Polarization of the Job Opportunities in the U.S. Labor Market.Washington, DC: Center for American Progress.
Bebchuk, L. & Fried, J. (2004.) Pay Without Performance: The unfulfilled promise of executive compensation. Cambridge, MA: Harvard University Press.
Bhagwati, J. & Blinder, A. (2009.) Offshoring of American Jobs: What Responses fromU.S. Economic Policy? Cambridge, MA: MIT Press.
Bureau of Labor Statistics. (2011.) Table B.1: Employees on Nonfarm Payrolls byIndustry Sector, 1961 to Present. ftp://ftp.bls.gov/pub/suppl/empsit.ceseeb1.txt
Card, D., Chetty, R. & Weber, A. (2007.) “The Spike at Benefit Exhaustion: Leaving theUnemployment System or Starting a New Job?” Discussion Paper, IZA.
Center for Economic and Policy Research. (2010.) Extract of Current Population SurveyOutgoing Rotation Group, Version 1.5. Available at: www.ceprdata.org
Congressional Budget Office. (2010.) The Budget and Economic Outlook: An Update.Washington, DC: U.S. Government Printing Office.
Dao, M. & Loungani, P. (2010.) “The Tragedy of Unemployment.” Washington, DC:International Monetary Fund.
Edelman, P., Greenberg, M. & Holzer, H. (2009.) Expanding the EITC to Help More
Low-Wage Workers. Georgetown Center on Poverty, Inequality and PublicPolicy, Georgetown University.
Elsby, M., Hobijn, B. & Sahin, A. (2010.) The Labor Market Consequences of the GreatRecession. National Bureau of Economic Research Working Paper.
Furchtgott-Roth, D., Jacobson, L. & Moker, C. (2009.) “Strengthening CommunityCollege’s Influence on Economic Mobility.” Washington, DC: Pew TrustsEconomic Mobility Project.
Goldin, C. & Katz, L. (2009.) The Race Between Education and Technology. Cambridge,
MA: Harvard University Press.
Haskins, R., Holzer, H. & Lerman, R. (2009.) “Promoting Economic Mobility byIncreasing Postsecondary Education.” Washington, DC: Pew Trusts EconomicMobility Project.
Holzer, H. (2010.) Is the Middle of the Job Market Really Disappearing? Washington,DC: Center for American Progress.
8/3/2019 An Uneven Road: U.S. Labor Markets Since 2000
http://slidepdf.com/reader/full/an-uneven-road-us-labor-markets-since-2000 19/21
18
Holzer, H., Lane, J., Rosenblum, D. & Andersson, F. (2011.) Where Are All the GoodJobs Going? What National and Local Job Quality and Dynamics Mean for U.S.Workers. New York, NY: Russell Sage Foundation.
Kahn, L. (2010.) The Long-Term Labor Market Consequences of Graduating fromCollege in a Bad Economy. Labour Economics. 17(2), 303-16.
Kaiser Family Foundation and Health Research and Education Trust. (2010.) Employer Health Benefits: 2010 Summary of Findings. Washington, DC.http://ehbs.kff.org/pdf/2010/8085.pdf
Kemple, J., with Willner, C. (2009.) Career Academies: Long-Term Impacts on Labor Market Outcomes, Educational Attainment, and Transitions to Adulthood. New York, NY:MDRC.
Krueger, A. & Solow. R (Eds.) 2002. The Roaring Nineties. New York, NY: RussellSage Foundation.
Larrimore, J., Burkhauser, R.V., Feng, S. & Zayatz, L. (2009.) Consistent Cell Means for Top-coded Incomes in the Public Use March CPS (1976-2007). Journal of Economic and Social Measurement, Vol. 33, 89-128.
Lerman, R. Career-Focused Training for Youth. (2007.) In H. Holzer & D. Nightingale(Eds.). Reshaping the American Workforce for a Changing Economy. Washington, DC: UrbanInstitute Press.
Maguire, S., Freely, J., Clymer, C., Conway, M. & Schwartz, D. (2010.) Tuning In toLocal Labor Markets: Findings From the Sectoral Employment Impact Study.Philadelphia, PA: PPV.
Mishel, L.& Shierholz, H.. (2011.) State of Working America. Washington, DC:Economic Policy Institute.
Reinhart, C. & Rogoff, K. (2009.) This Time is Different: Eight Centuries of FinancialFolly. Princeton, NJ: Princeton University Press.
Roubini, N. & Mimh, S.. (2010.) Crisis Economics. New York, NY: The Penguin Press.
Ruggles, S., Alexander, J. T., Genadek, K., Goeken, R., Schroeder, M. B. & Sobek, M.(2010.) Integrated Public Use Microdata Series: Version 5.0 [Machine-readabledatabase]. Minneapolis, MN: Minnesota Population Center.
Schmitt, J. (2003.) Creating a Consistent Hourly Wage Series from the CurrentPopulation Survey's Outgoing Rotation Group, 1979-2002. Center for Economicand Policy Research: Washington, D.C.
Stiglitz, J. (2003.) The Roaring Nineties. New York, NY: Norton.
Unicon Research Corporation. "Current Population Survey, Annual Social and Economic

8/3/2019 An Uneven Road: U.S. Labor Markets Since 2000
http://slidepdf.com/reader/full/an-uneven-road-us-labor-markets-since-2000 20/21
19
Study (March Supplement)," CPS Utilities. Available from: www.unicon.com
Unicon Research Corporation. "Current Population Survey, Historic Earner Study(Outgoing Rotation Groups), 1979-2009," CPS Utilities. Available from www.unicon.com
Von Wachter, T. (2010.) Testimony before Joint Economic Committee of Congress. May
25, 2010.
8/3/2019 An Uneven Road: U.S. Labor Markets Since 2000
http://slidepdf.com/reader/full/an-uneven-road-us-labor-markets-since-2000 21/21
Data Appendix We analyzed data from the Current Population Survey (CPS), a monthly surveyof about 50,000 households conducted by the Census Bureau and the Bureau of Labor Statistics, to calculate all labor market statistics. We used CPS data sets provided by
the Unicon Research Corporation and by the Center for Economic and Policy Research inWashington, D.C.
Annual earnings figures were obtained from the Annual Social and EconomicSupplement (the “March supplement”) of the CPS. Hourly wages, employment- population ratios, as well as unemployment rates and durations come from the OutgoingRotation Groups (ORGs) of the CPS’s monthly Earner Study. We relied on a crosswalk from the Integrated Public Use Microdata Series (IPUMS-USA), published by theUniversity of Minnesota, to classify occupations consistently across the years in our study.
To express annual earnings and hourly wages in real 2009 dollars, we deflatednominal wage and earning figures using the chain-weighted Personal ConsumptionExpenditures (PCE) version of the Gross Domestic Product (GDP) Deflator, constructed by the Bureau of Economic Analysis.
Our sample is limited to individuals between the ages of 16 and 69, and excludesfull-time students, self-employed workers, and individuals employed in the agriculture, military andfarming industries.
To reduce the influence of extreme outliers, calculations of mean annual earnings andhourly wages are restricted to individuals who earn, in 2009 dollars, between $2 and
$5,000 per hour, and between $1,000 and $10 million per year.
To preserve the confidentiality of survey respondents, the U.S. Census Bureautop-codes high incomes and earnings: Values that exceed specified levels are reportedat specified top-coded levels. To adjust annual earnings for top-coding, we used a cellmean series, created by Larrimore et al. (2008), that provides the mean of all incomevalues above the top-code for individuals in the public use Annual Social and EconomicSupplement of the CPS. For hourly wages, we applied a log-normal imputation to adjusttop-coded values from the Outgoing Rotation Groups of the monthly CPS Earner Study,as proposed by Schmitt (2003).