an overview. youth experiences matter! school staff are faced with a multitude of student issues ...
TRANSCRIPT

THE NEW JERSEY SOCIAL
NORMS PROJECTAn Overview

BACKGROUND Youth Experiences Matter!
School staff are faced with a multitude of student issues
Students who are struggling with other problems have difficulty succeeding in the classroom
Key Examples of Student Problems: Alcohol, tobacco and other drug (ATOD) use
ATOD use negatively affects student performance and health outcomes
Bullying and Victimization Students who fear for their safety risk decreased
performance and long-term mental health issues Students who bully disrupt the learning process and
negatively affect the school culture and climate

HOW CAN SCHOOL STAFF HELP? Social Norms Campaigns!
Promote positive student behavior by reinforcing pro-social actions
Help students realize that most of their peers are not participating in high-risk behaviors
Evidence-Based Practices Environmental design, school-based prevention
efforts have some of the most positive effects on student behavior (Gottfredson, Wilson, and Najaka 2001)
Four years of New Jersey Social Norms Project evaluation show positive results 29 High Schools 36 Middle Schools

PURPOSE OF THE NEW JERSEY SOCIAL NORMS PROJECT
New Jersey Middle Schools All regions – north, south, and central All settings – rural, urban, and suburban
Reduce bullying and victimization behavior
Correct student and community misperceptions of peers’ behavior Most students are engaging in positive
behavior!

PURPOSE OF THE NEW JERSEY SOCIAL NORMS PROJECT, CONT.
New Jersey High Schools All regions – north, south, and central All settings – rural, urban, and suburban
Reduce alcohol, tobacco, and other drug (ATOD) use
Correct student and community misperceptions of peers’ ATOD use Everyone isn’t drinking! Everyone isn’t
drugging! Everyone isn’t smoking!

COMPONENTS Annual Survey
Quantified the perceptions and behavior in each school Personalized the information for students in each
school Highlight Positive Behaviors
Statistics were chosen that best addressed the issues in each school
Marketing Campaign Created messages based on the survey statistics to
promote the priority positive behavior in each school Used a variety of strategies to promote the messages
Community Resources Promoted positive behavior beyond the school property Coordinated with businesses to create incentives for
students

SCHOOL PLANNING COMMITTEE Composed of members of the school community who
directed each school’s campaign Members included
School staff (e.g., school counselors, student assistance coordinators, administrators, teachers, Child Study Team members, supervisors of curriculum and instruction)
Parents Community members (e.g., Municipal Alliance Committee
members, local business owners) Students
Duties included Planning and administering surveys Planning campaign activities Developing social norms Message Communicating with school staff, parents and local
community members

PARENTAL INVOLVEMENT Sent a letter describing the project Used the beginning of school-year activities, such as
“Back to School Night,” to promote the project Obtained parental consent for surveying
(Two weeks prior to the survey is a good window of time)
Shared the results of the surveys Informed parents of how great their kids were doing Used school mailings, emails, and special events to
communicate the information to parents Kept them informed on an ongoing basis
Encouraged parents to discuss results at home with their children
Used school-based methods of information delivery (e.g., Web sites, newsletters) to continue to promote the project

COMMUNITY MEMBER INVOLVEMENT
Promoted activities through local news sources Websites Newspapers Other print media Radio
Hung school messages on posters in local businesses
Encouraged collaboration Coordinated with local businesses to promote their
services on campaign materials in return for support Provided free gift certificates for schools to use as
incentives Special discounts for students who knew the school’s
messages

SCHOOL AND STUDENT INVOLVEMENT
Hung posters around school Chose high traffic locations Changed posters occasionally for variety
More strategies = better outcomes (creativity) Used a variety of methods for delivering messages
Posters Games Assemblies Announcements Newsletters Screensavers
Included faculty in discussions Used faculty meetings as a vehicle for disseminating
classroom strategies and promoting messages Continued discussions informally
Encouraged the school staff to promote the messages whenever the opportunity arose

MIDDLE SCHOOL EVALUATION A variety of constructs measured change
Behavioral measures Victimization
Physical, property, and emotional Bullying
Perceptual measures Amount of peer victimization Amount of peer bullying
Other measures Avoidance Tactics Telling Adults
Analytic Technique Independent samples z-tests for proportions with
separate variances
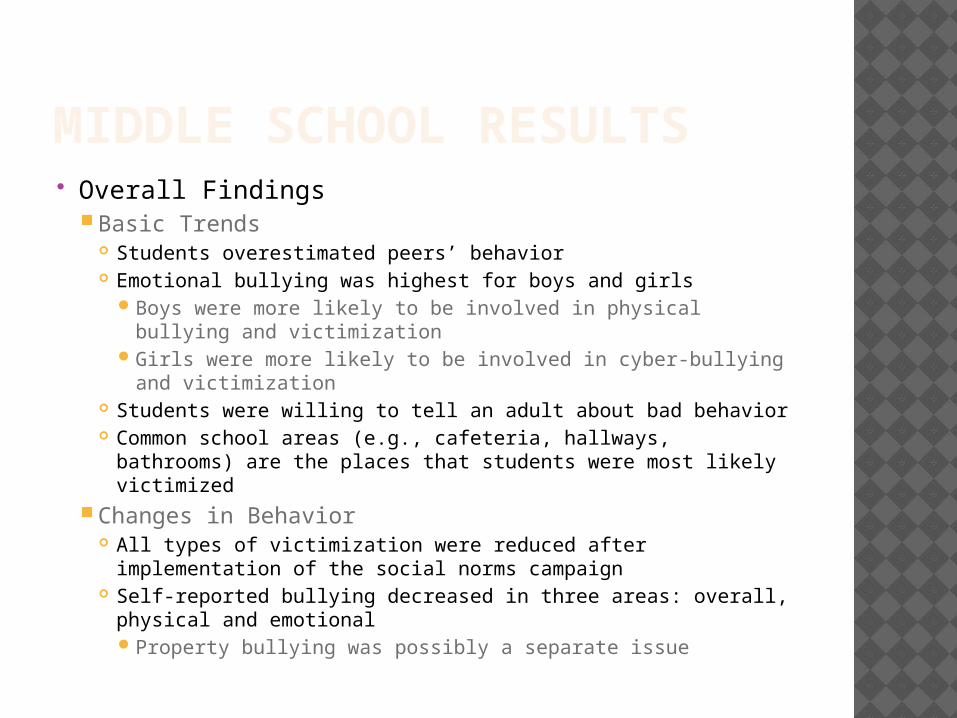
MIDDLE SCHOOL RESULTS Overall Findings
Basic Trends Students overestimated peers’ behavior Emotional bullying was highest for boys and girls
Boys were more likely to be involved in physical bullying and victimization
Girls were more likely to be involved in cyber-bullying and victimization
Students were willing to tell an adult about bad behavior Common school areas (e.g., cafeteria, hallways, bathrooms)
are the places that students were most likely victimized Changes in Behavior
All types of victimization were reduced after implementation of the social norms campaign
Self-reported bullying decreased in three areas: overall, physical and emotional Property bullying was possibly a separate issue

MIDDLE SCHOOL RESULTS Actual Victimization
Time 1 Time 2
N = 1060 N = 961
% %
Ever Been Bullied** 66.0 54.3
Report Any Victimization* 80.8 76.4
Physical Victimization*** 45.3 36.4
Property Victimization*** 30.6 43.0
Emotional Victimization*** 75.2 67.0
±p<.10; *p<.05; **p<.01; **p<.001Note: P-values represent levels of statistical significance; lower p-values indicate higher levels of significance. Statistically significant data is italicized on results slides.
Measurement changes between Time 1 and Time 2 may account for the increases in reported physical bullying.

MIDDLE SCHOOL RESULTS Perceptions of Victimization
Time 1 Time 2
N=1060 N=961
% %
Report Any Victimization** 93.9 88.8
Physical Victimization*** 79.6 57.1
Property Victimization* 63.3 56.0
Emotional Victimization** 92.5 83.8
±p<.10; *p<.05; **p<.01; ***p<.001

MIDDLE SCHOOL RESULTS Actual Bullying
Time 1 Time 2
N=1060 N=961
% %
Report Any Bullying* 61.0 55.2
Physical Bullying** 32.2 44.8
Property Bullying 11.1 10.2
Emotional Bullying** 54.0 34.0
±p<.10; *p<.05; **p<.01; **p<.001
Measurement changes between Time 1 and Time 2 may account for the increases in reported physical bullying.

MIDDLE SCHOOL RESULTS Perceptions of Peer Bullying
Time 1 Time 2
N=1060 N=961
% %
Report Any Bullying** 90.6 82.8
Physical Bullying* 76.9 71.6
Property Bullying 37.3 38.3
Emotional Bullying*** 88.6 69.9
±p<.10; *p<.05; **p<.01; ***p<.001

MIDDLE SCHOOL RESULTS Avoidance Tactics
Time 1 Time 2
N=1060 N=961
Hallway 9.9 12.6
Bathroom 5.5 13.6
Cafeteria 1.4 13.9
Other School Places 16.9 16.1
Avoid Any Space 11.9 10.1
Skip Class or School 30.1 35.7
±p<.10; *p<.05; **p<.01; ***p<.001

MIDDLE SCHOOL RESULTS Telling an Adult
Tell if being bullied…
Time 1 Time 2
N=1060 N=961
% %
Principal** 64.4 72.9
Teacher/Counselor 81.0 82.9
Police*** 24.5 43.8
Parent± 71.9 75.4
Friend** 53.0 69.5
Any Adult* 92.5 89.1
Tell if see weapon…
Time 1 Time 2
N=1060 N=961
% %
Principal 86.7 86.5
Teacher/Counselor** 76.7 85.3
Police** 71.6 80.2
Parent** 66.6 80.1
Friend*** 41.7 68.7
Any Adult** 96.5 92.9
±p<.10; *p<.05; **p<.01; ***p<.001

HIGH SCHOOL EVALUATION A variety of constructs were used to
measure change Behavioral measures
ATOD use Perceptual measures
Amount of peer ATOD use Other measures
Negative consequences of ATOD use Resistance skills Telling adults
Analytic Technique Independent samples z-tests for proportions
with separate variances

HIGH SCHOOL RESULTS Overall Trends
Differences in survey between Time 1 and Time 2 Suggests that increases in the targeted behaviors had to
be examined cautiously Harm Reduction
Negative consequences of alcohol use significantly decreased between time periods
Resistance Skills Students reported being more likely to resist using alcohol
and tobacco when offered, after the campaign Changes in Behavior
Alcohol use and perceptions of use decreased Telling an Adult
Students showed some resistance Most likely because students did not understand the
benefit of adult notification and intervention

HIGH SCHOOL RESULTS ATOD Use – last 30 days
Time 1 Time 2
N=2254 N=1732
Last 30 Days… % %
Tobacco* 11.7 14.2
Alcohol** 44.6 35.8
Marijuana** 9.0 16.6
Other Illicit Drugs** 5.7 14.1
±p<.10; *p<.05; **p<.01; ***p<.001
Measurement changes between Time 1 and Time 2 may be driving the increase in reporting of illicit drugs.

HIGH SCHOOL RESULTS Perceptions of Peers’ ATOD Use
Time 1 Time 2
Students in
grade…
People your
age…
N=2254 N=1732
How many do NOT
use…% %
Tobacco* 6.3 4.7
Alcohol** 3.6 5.6
Marijuana** 12.1 8.2
Other Illicit Drugs 22.5 20.7
±p<.10; *p<.05; **p<.01; ***p<.001
Measurement changes between Time 1 and Time 2 may explain differences in reporting of peer perceptions.

HIGH SCHOOL RESULTS Negative Consequences

HIGH SCHOOL RESULTS Resistance Skills
Time 1 Time 2
N=2254 N=1732
Saying no to… Time 1 Time 2
Cigarettes** 74.6 83.4
Alcohol** 63.4 71.3
±p<.10; *p<.05; **p<.01; ***p<.001

HIGH SCHOOL RESULTS Telling an Adult
Time 1 Time 2
N=225
4
N=173
2
Tell an adult about drugs… % %
Principal** 39.2 25.4
Teacher or Counselor** 52.4 38.0
Police Officer** 34.2 27.9
Parent or Adult Family Member** 35.2 50.9
Friend*** 40.8 83.0
Any Adult** 62.3 57.0±p<.10; *p<.05; **p<.01; ***p<.001

CONCLUSIONS Support for change
Both bullying behavior and ATOD use changed for the better using the social norms campaign
Perceptions and behavior both changed in desired direction
Students paid attentionSocial norms campaigns helped change
student beliefs and encouraged continued positive behavior
Variety was the key!The more ways the messages were
presented, the more likely the students listened

OTHER THOUGHTS Social events matter
Students can be sensitized to issues when they are regularly portrayed in the media, which can affect survey data High schools – marijuana Middle-schools – cyber-bullying
Marketing campaign may increase awareness Previous social norms campaigns focus only
on ONE behavior – the campaigns under the New Jersey project focused on several kinds of behaviors It is possible that students will initially perceive
an increase in a behavior BECAUSE it is being brought to their attention, not because it actually has increased
Decrease in actual behaviors, however, suggests students began to internalize the messages