an overview of validity - medic.usm.my intermediate 2015/an_overview...an overview of validity dr...
TRANSCRIPT
An overview of validityDr Wan Nor Arifin
Unit of Biostatistics and Research Methodology,Universiti Sains Malaysia.
[email protected] / wnarifin.pancakeapps.com
Wan Nor Arifin, 2015. An overview of validity by Wan Nor Arifin is licensed under the Creative Commons Attribution-ShareAlike 4.0 International License. To view a copy of this license, visit http://creativecommons.org/licenses/by-sa/4.0/.

9/12/2015 Intermediate Statistics 2015 2 / 26
Outlines
1.Measurement validity & reliability
2.Classical validity
3.The validity
4.Factor analysis
5.Reliability
9/12/2015 Intermediate Statistics 2015 3 / 26
1. Measurement validity & Reliability
• Measurement → Process of observing & recording.• Measurement validity → Accuracy.• Measurement reliability → Precision, consistency,
repeatability.
9/12/2015 Intermediate Statistics 2015 4 / 26
2. Classical validity
• 3Cs:
1.Content
2.Criterion
3.Construct

9/12/2015 Intermediate Statistics 2015 5 / 26
3. The validity
• Unitary concept.• Degree of evidence → Purpose & Intended use of a
tool.• Evidence from 5 sources:
1.Content.2.Internal structure.3.Relations to other variables4.Response process.5.Consequences.

9/12/2015 Intermediate Statistics 2015 6 / 26
The validity
• Construct – Concept to be measured by a tool.• Contruct = Concept = Domain = Idea• Internal structure evidence – How relationship between items & components
reflect construct.– Analyses:
1.Factor analysis
2.Reliability
9/12/2015 Intermediate Statistics 2015 7 / 26
4. Factor Analysis
• Factoring• Factor analysis
9/12/2015 Intermediate Statistics 2015 8 / 26
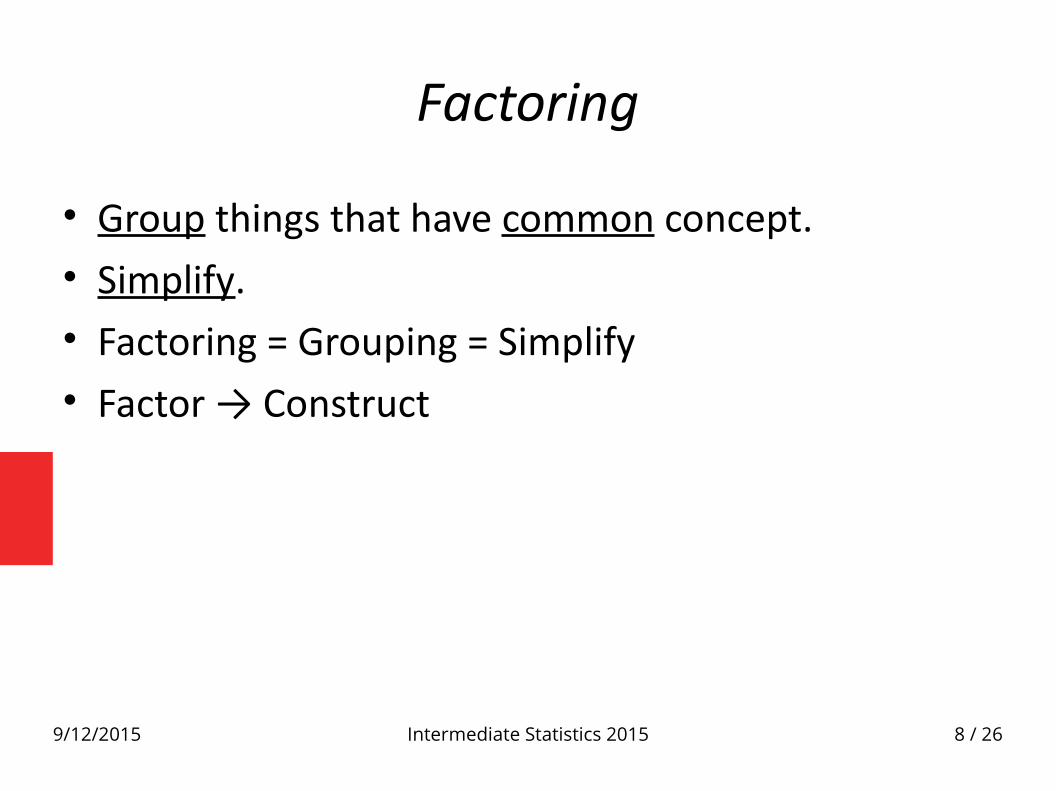
Factoring
• Group things that have common concept.• Simplify.• Factoring = Grouping = Simplify• Factor → Construct

9/12/2015 Intermediate Statistics 2015 9 / 26
Intuitive factoring
Orange, motorcycle, bus, durian, banana, car
Anything in common?
9/12/2015 Intermediate Statistics 2015 10 / 26
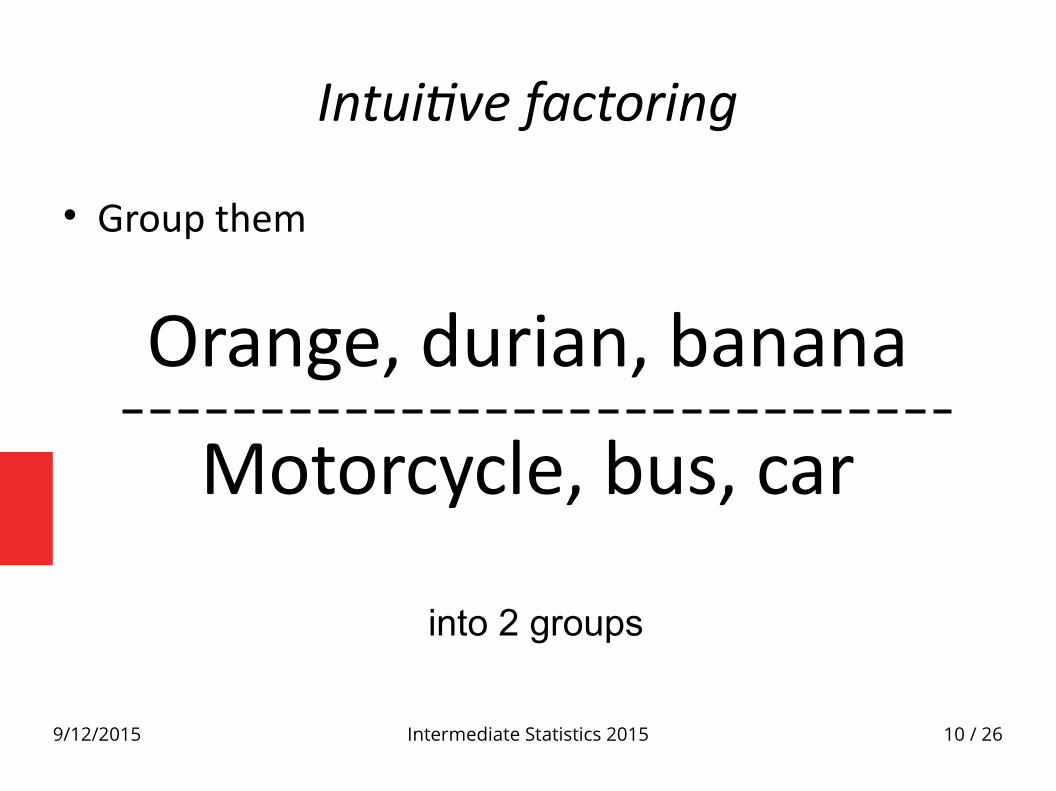
Intuitive factoring
• Group them
Orange, durian, banana
Motorcycle, bus, car
into 2 groups
9/12/2015 Intermediate Statistics 2015 11 / 26
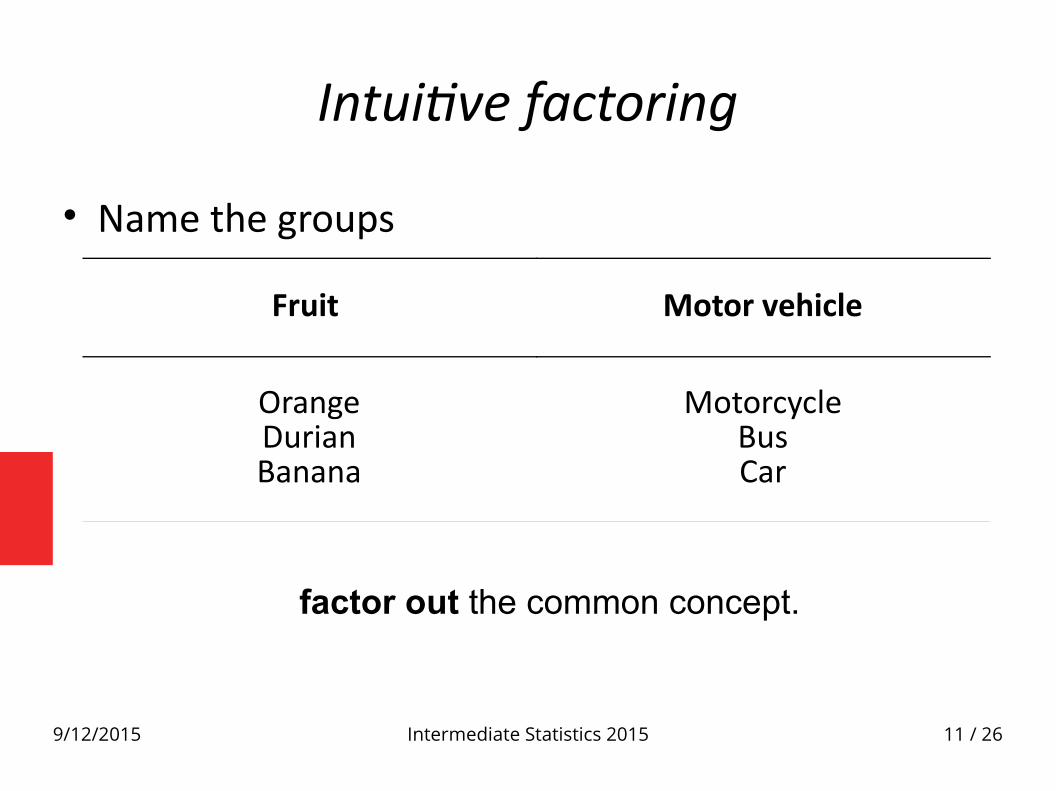
Intuitive factoring
• Name the groups
Fruit Motor vehicle
OrangeDurianBanana
MotorcycleBusCar
factor out the common concept.
9/12/2015 Intermediate Statistics 2015 12 / 26
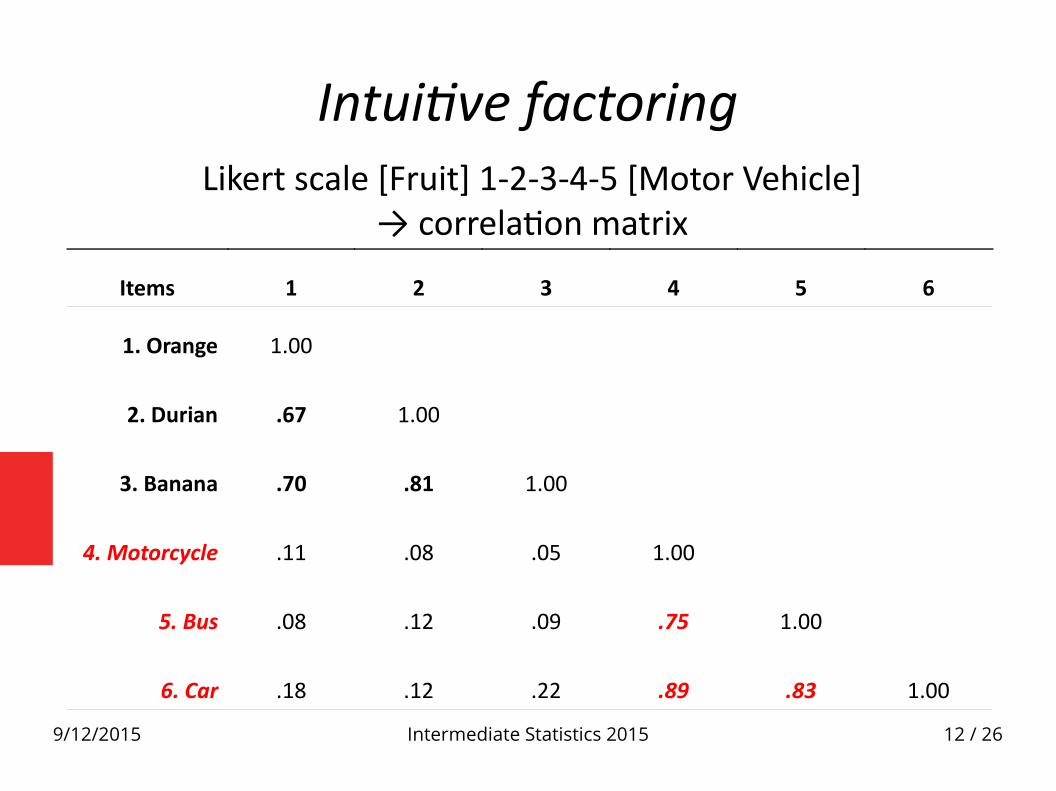
Intuitive factoringLikert scale [Fruit] 1-2-3-4-5 [Motor Vehicle]
→ correlation matrix
Items 1 2 3 4 5 6
1. Orange 1.00
2. Durian .67 1.00
3. Banana .70 .81 1.00
4. Motorcycle .11 .08 .05 1.00
5. Bus .08 .12 .09 .75 1.00
6. Car .18 .12 .22 .89 .83 1.00
9/12/2015 Intermediate Statistics 2015 13 / 26
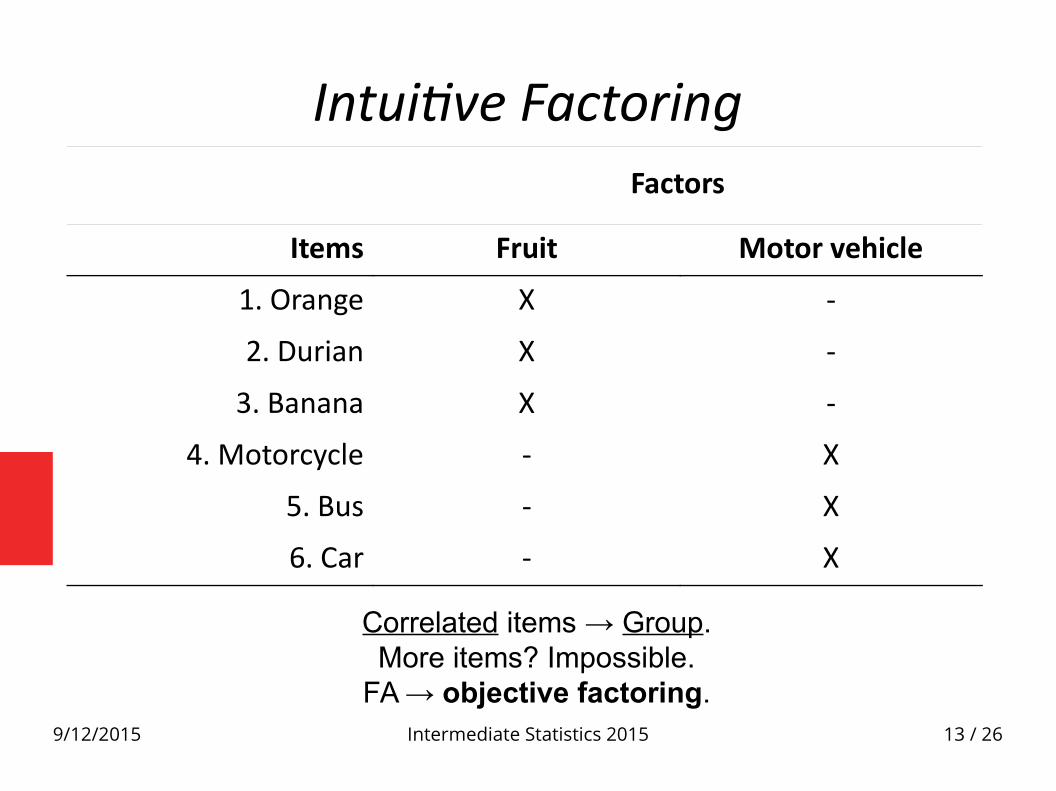
Intuitive FactoringFactors
Items Fruit Motor vehicle
1. Orange X -
2. Durian X -
3. Banana X -
4. Motorcycle - X
5. Bus - X
6. Car - X
Correlated items → Group.More items? Impossible.
FA → objective factoring.

9/12/2015 Intermediate Statistics 2015 14 / 26
FA
• Multivariate analysis – >1 outcomes/DVs/Items.• Numerical items, e.g. Likert scale, VAS scores,
laboratory results etc.• Cluster correlated items → Factor.• Factors extracted from items → Latent (unobserved)
IVs.• RQs:– Number of factors?– Strength of Item-Factor correlation (factor loading)?
• Recall – MLR: 1 DV many IVs (observed).

9/12/2015 Intermediate Statistics 2015 15 / 26
Classification
1.Exploratory FA/EFA2. Confirmatory FA/CFA

9/12/2015 Intermediate Statistics 2015 16 / 26
EFA• Exploratory analysis.• Objectives: Explore & factor items, generate theory.• Models:
–Full component model.–Common factor model.

9/12/2015 Intermediate Statistics 2015 17 / 26
EFA• Full component model
– Extraction method: Principal component analysis (PCA)– Data reduction → For other analysis.– All variances → Components.– Error NOT counted.– NOT real FA!
9/12/2015 Intermediate Statistics 2015 18 / 26
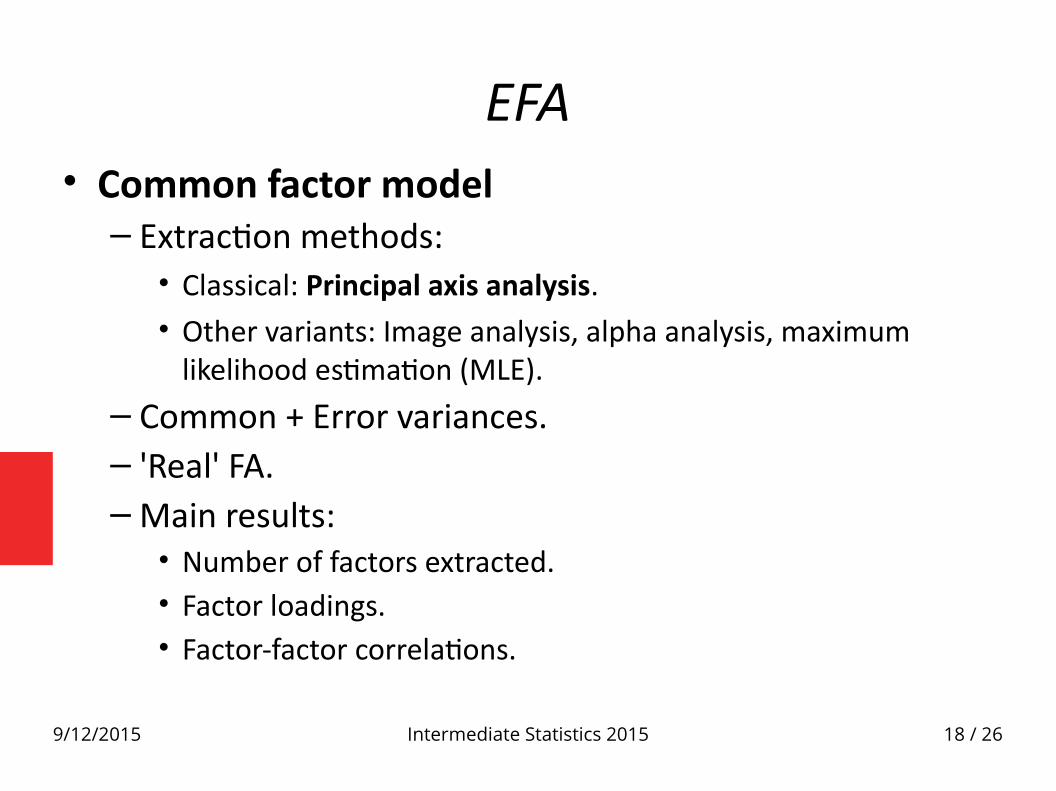
EFA• Common factor model
– Extraction methods: • Classical: Principal axis analysis.• Other variants: Image analysis, alpha analysis, maximum
likelihood estimation (MLE).
– Common + Error variances.– 'Real' FA.– Main results:• Number of factors extracted.• Factor loadings.• Factor-factor correlations.

9/12/2015 Intermediate Statistics 2015 19 / 26
EFA• To further simplify EFA results → Factor Rotation:
–Types:• Orthogonal method – uncorrelated factors.–Varimax, Quartimax, Equamax
• Oblique method – correlated factors.–Promax, Direct Oblimin
• Clear factors & factor loadings.

9/12/2015 Intermediate Statistics 2015 20 / 26
CFA• Confirmatory analysis.• Common factor model.• Structural Equation Modeling (SEM) analysis →
measurement model part.• MLE.• Model fit.
9/12/2015 Intermediate Statistics 2015 21 / 26
CFA
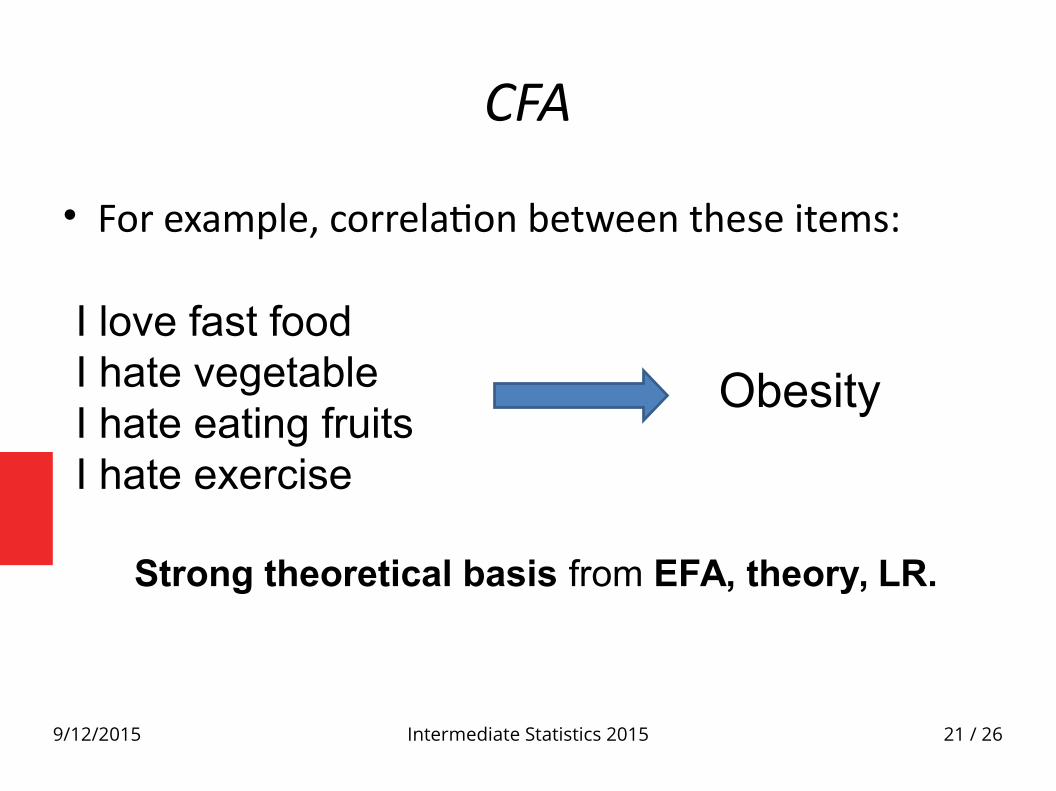
• For example, correlation between these items:
I love fast foodI hate vegetableI hate eating fruitsI hate exercise
Obesity
Strong theoretical basis from EFA, theory, LR.
9/12/2015 Intermediate Statistics 2015 22 / 26
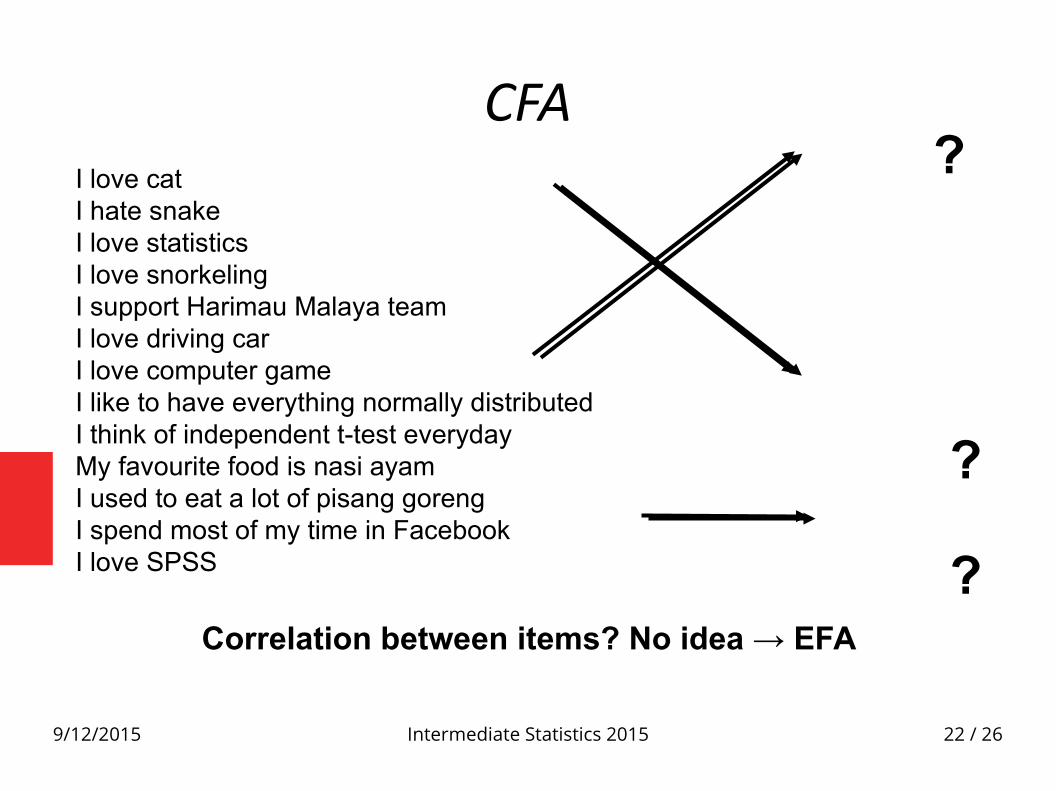
CFAI love catI hate snakeI love statisticsI love snorkelingI support Harimau Malaya teamI love driving carI love computer gameI like to have everything normally distributedI think of independent t-test everydayMy favourite food is nasi ayamI used to eat a lot of pisang gorengI spend most of my time in FacebookI love SPSS
?
?
?Correlation between items? No idea → EFA
9/12/2015 Intermediate Statistics 2015 23 / 26
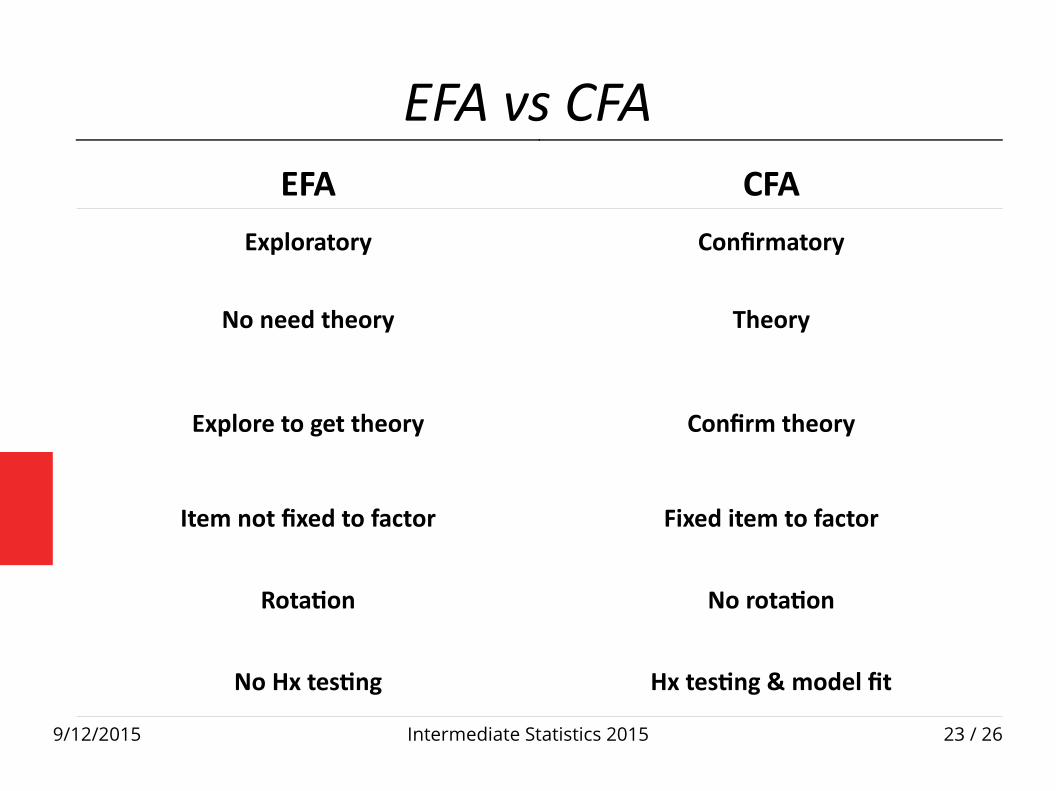
EFA vs CFAEFA CFA
Exploratory Confirmatory
No need theory Theory
Explore to get theory Confirm theory
Item not fixed to factor Fixed item to factor
Rotation No rotation
No Hx testing Hx testing & model fit

9/12/2015 Intermediate Statistics 2015 24 / 26
5. Reliability• Part of validity evidence.• Types:
1.Test-retest reliability2.Parallel-forms reliability3.Interrater reliability4.Internal consistency reliability

9/12/2015 Intermediate Statistics 2015 25 / 26
Internal consistency reliability• Consistent responses in a construct.• Homogenous → ↑Reliability.• Heterogenous → ↓ reliability.• Advantage: Measure 1x only.• Common: Cronbach's alpha coefficient.• Not reliable 0 → 1 Perfectly reliable.• Aim > 0.7.
9/12/2015 Intermediate Statistics 2015 26 / 26
Performing EFA & reliability analysis