an outlook into a applications of footprint methodologies footpring... · an outlook into a...
TRANSCRIPT

An outlook into a applications of
footprint methodologies
Manfred LenzenManfred Lenzen
ISA, The University of Sydney
Australia


Supply-chain analysis

Two examples in detail
Overview & outlook

Example 1:
Threatened species


Origins and Destinationsof Australia’s species threats
both “driven” overseas and “suffered” at home

Origins and Destinationsof global species threats
both “driven” overseas and “suffered” at home

High Impact Production Chains

High Impact Production Chains

Spider monkey
(Ateles geoffroyi)
Mexico and
central America
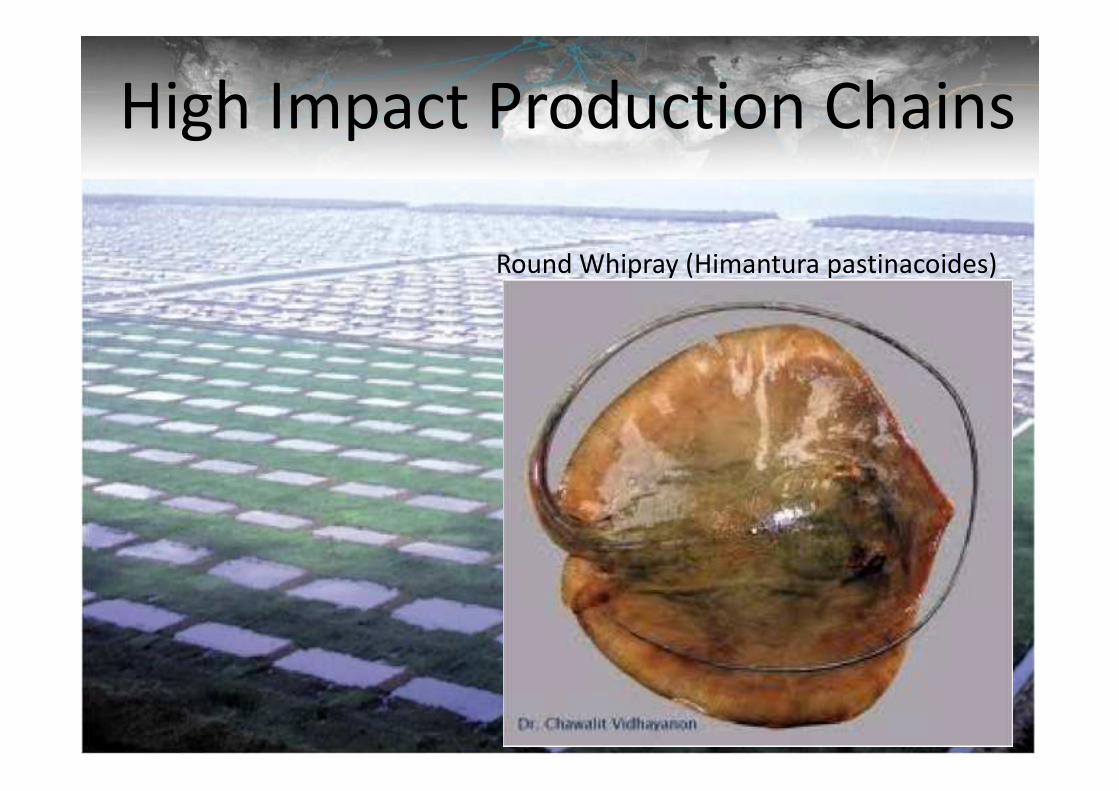
High Impact Production Chains
Round Whipray (Himantura pastinacoides)
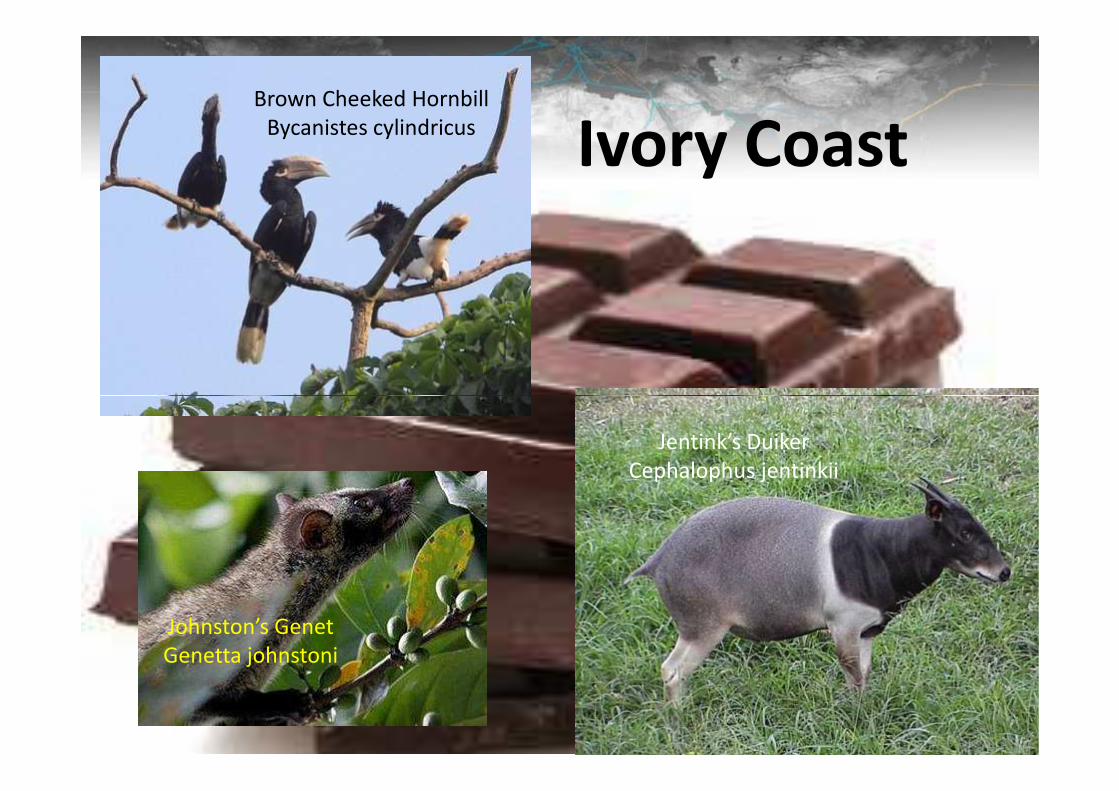
Brown Cheeked Hornbill
Bycanistes cylindricus
Ivory Coast
Johnston’s Genet
Genetta johnstoni
Jentink’s Duiker
Cephalophus jentinkii

Consumers: What To Do ?
• Know your labels and try to shop better
• Recognise greenwash
• Change procurement practices at work
• Be country-aware and check origins
• Investigate production chains

Example 2: Carbon footprint of the UK

Supply-chain analysis

Trend analysis


Uncertainty analysis

What other applications are
possible ?possible ?
1. More indicators.

Carbon, land, water
Nitrogen, air pollutants,
phosphorus, NPP, water scarcityphosphorus, NPP, water scarcity
Value added
Employment, inequality, slavery,
war casualties, occupational health

Trade in value added

Employment
– global flows of labour
Source: Alsamawi

Employment
– the master-servant story
Source: Alsamawi

Inequality
Source: Alsamawi

Conflict
Source: Moran & McBain


2. High geographical resolution.

The Sydney Environmental Atlas

Sydney: Transport energy
32

Sydney: Embodied energy
33
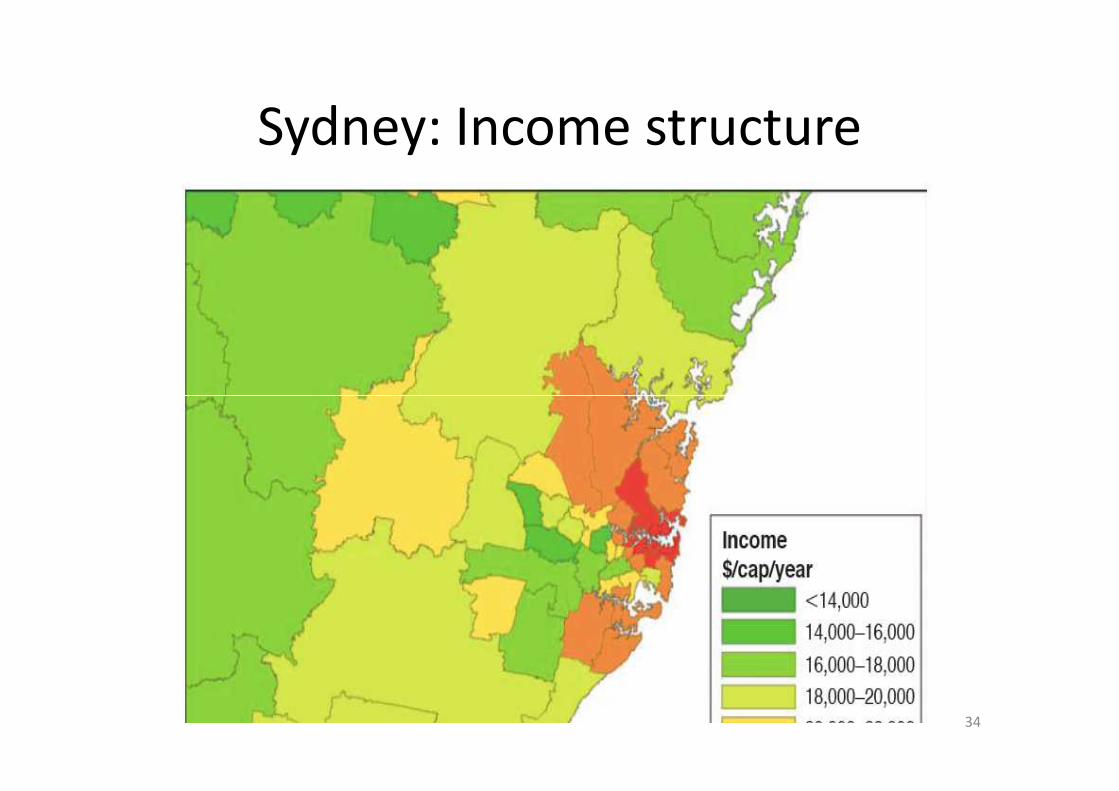
Sydney: Income structure
34

Energy requirement vs Income
35

The Sydney energy catchment
36

What might the future hold ?

3. Collaborative = efficient
Footprinting in virtual laboratories

39

40

41


LCA EE-IOA CGE
43
LCA EE-IOA CGE����
Footprints
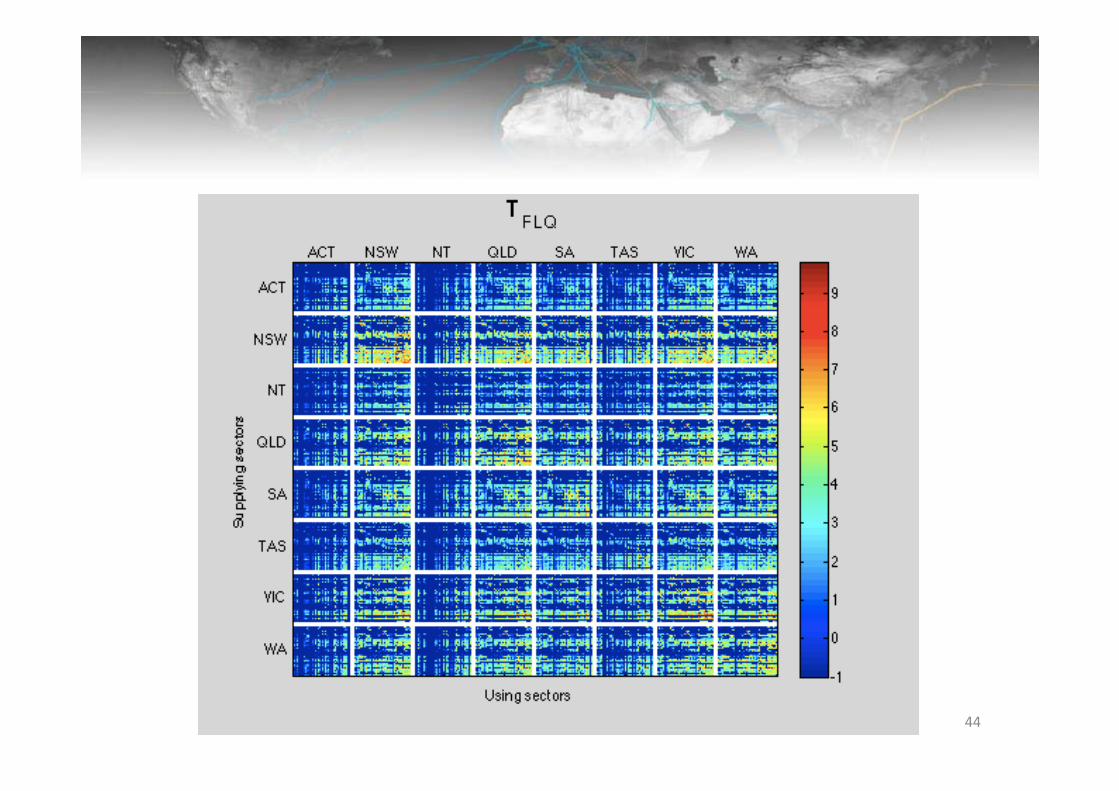
44

64gbRAM cloud, 500gbRAM crunch
455tb storage
46

47

48
4. Aligned standards: 4. Aligned standards:
GHG Protocol & PAS 2050


“Often, the majority of total corporate emissions come from scope 3 sources,
which means many companies have been missing out
on significant opportunities for improvement.”

GRI on boundary setting and validation :
… “The Validation step requires all identified material Aspects to be assessed against
the Reporting Principle of ‘Completeness’ ”…
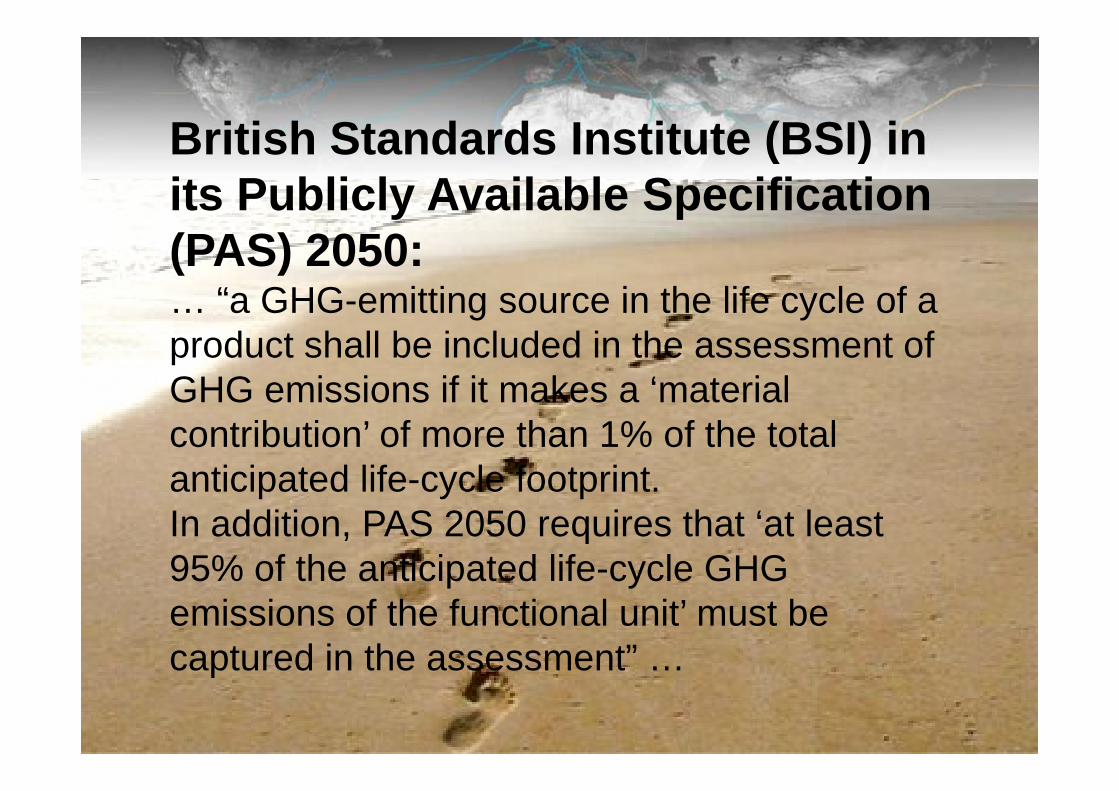
British Standards Institute (BSI) inits Publicly Available Specification (PAS) 2050:… “a GHG-emitting source in the life cycle of a product shall be included in the assessment of GHG emissions if it makes a ‘material GHG emissions if it makes a ‘material contribution’ of more than 1% of the total anticipated life-cycle footprint. In addition, PAS 2050 requires that ‘at least 95% of the anticipated life-cycle GHG emissions of the functional unit’ must be captured in the assessment” …

FUNCTIONAL CompanyFUNCTIONAL UNIT
?
Company
•••
•••
•••
•••
•••
•••
•••
•••
•••
•••
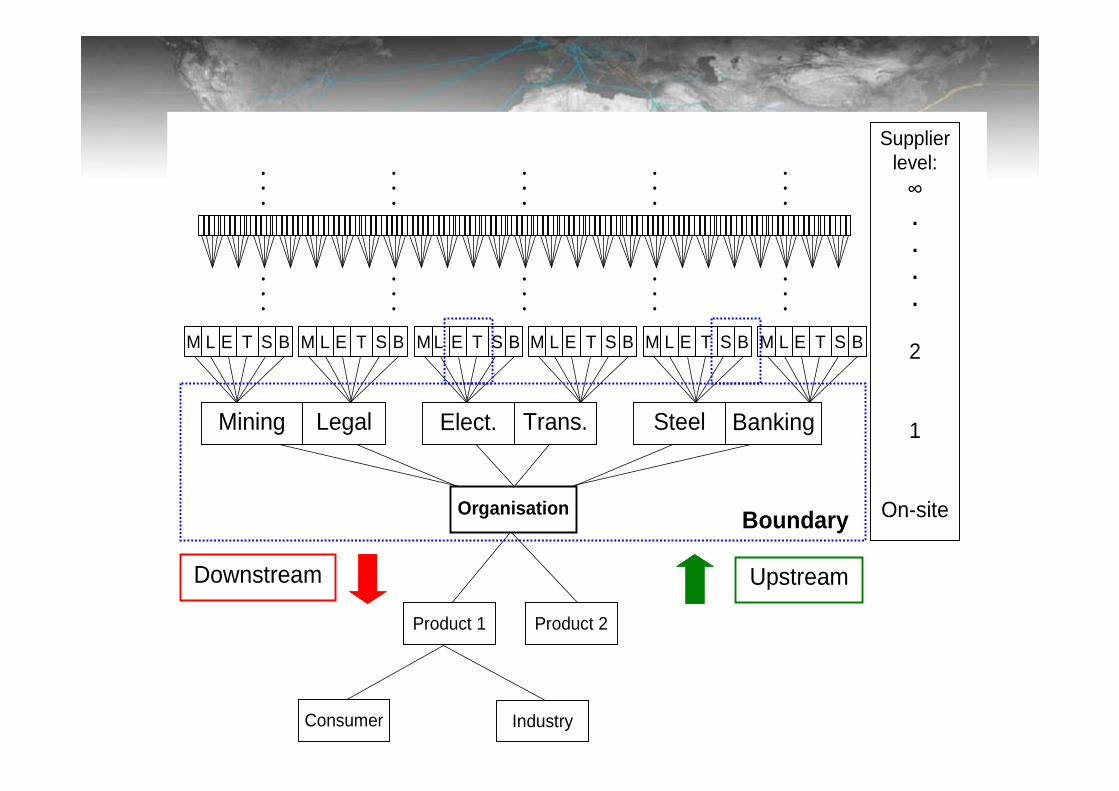
M L E T S B M L E T S B M L E T S B M L E T S B M L E T S B M L E T S B
Supplier level:∞
.
.
.
.
2
Organisation
Mining Legal SteelTrans. BankingElect. 1
On-siteBoundary
UpstreamDownstream
Product 2Product 1
Consumer Industry

Trucost & Defra
“… there is still a lack of quantification in most reporting … the majority of reports lack depth, reporting … the majority of reports lack depth, rigour or quantification ... There is no single, quantifiable measure that companies can use as a Key Performance Indicator for the effect of their upstream supply chain on the environment.

University of Sydney – Carnegie -Mellon study

University of Sydney – Carnegie -Mellon study
What are the risks
associated withassociated with
mis -specification ?

No meaningful industry benchmarking
Water service provider
A
Pumping
Catchment
Water service provider
B
Pumping
Catchment
C
D

Loopholes via demerging and outsourcing
AGHG
emissionsA 1
Dairy farming
Transport
Dairy processing
98%
<0.1%
2%
Dairy farming
Transport
Dairy processingA 2

No inventive for improving supplier performance
Alum. / HDPE
X
Bio-plastic
Y
Dairy processing
B
Alum. / HDPE
Packaging
Bio-plastic
Packaging
Dairy processing
B

Investors and lenders can’t see hidden risks
Carbon footprint Carbon footprint
Construction Pty
C
On-site carbon
from materials
Water supplier Pty
D
On-site carbon
from materials

Carbon offsetting –are organisations really neutral?
Flights. Waste.
Flights, waste, officeequipment, catering,
XYZ Finance
C
On-site emissions
Flights. Waste.
ABC Insurance
D
On-site emissions
equipment, catering,outsourcing, new building

There is a reputational risk
“Tesco‘s recent attempt to present itself as a force for environmental good appears to be backfiring, as evidence emerges that Britain’s backfiring, as evidence emerges that Britain’s biggest retailer has severely underestimated its true contribution to climate change ... the true impact Tesco has on the environment could be as much as 12 times higher than the level the supermarket admits to.”
The Observer, 9 September 2007
5. Corporate accounting support.

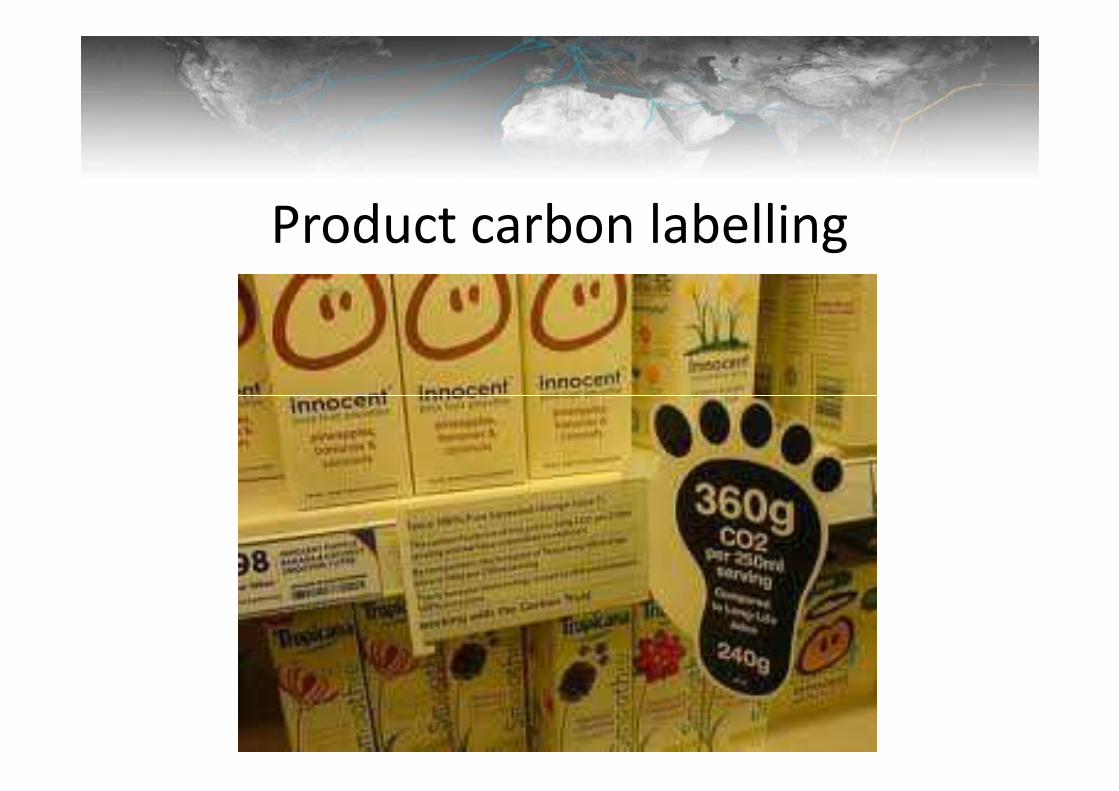
Product carbon labelling

6. Stronger global governance
institutions.institutions.


Li Gao, Director of the Department of Climate Change in
China's National Development and Reform Commission

''We produce products and these products are
consumed by other countries, especially the
developed countries. This share of emissions should
be taken by the consumers but not the producers''

Thank you !
www.isa.org.usyd.edu.au
www.worldmrio.com