an optimized prediction framework to assess the functional
TRANSCRIPT
The Pharmacogenomics Journalhttps://doi.org/10.1038/s41397-018-0044-2
ARTICLE
An optimized prediction framework to assess the functional impactof pharmacogenetic variants
Yitian Zhou1● Souren Mkrtchian1
● Masaki Kumondai2 ● Masahiro Hiratsuka2 ● Volker M. Lauschke 1
Received: 30 October 2017 / Revised: 27 June 2018 / Accepted: 10 August 2018© The Author(s) 2018. This article is published with open access
AbstractPrediction of phenotypic consequences of mutations constitutes an important aspect of precision medicine. Currentcomputational tools mostly rely on evolutionary conservation and have been calibrated on variants associated with disease,which poses conceptual problems for assessment of variants in poorly conserved pharmacogenes. Here, we evaluated theperformance of 18 current functionality prediction methods leveraging experimental high-quality activity data from 337variants in genes involved in drug metabolism and transport and found that these models only achieved probabilities of 0.1–50.6% to make informed conclusions. We therefore developed a functionality prediction framework optimized forpharmacogenetic assessments that significantly outperformed current algorithms. Our model achieved 93% for bothsensitivity and specificity for both loss-of-function and functionally neutral variants, and we confirmed its superiorperformance using cross validation analyses. This novel model holds promise to improve the translation of personal geneticinformation into biological conclusions and pharmacogenetic recommendations, thereby facilitating the implementation ofNext-Generation Sequencing data into clinical diagnostics.
Introduction
In the last decades, rapid progress in sequencing technolo-gies has allowed the deciphering of genomic information onan unprecedented scale. While the initial sequencing of thehuman genome in the frame of the Human Genome Projectcost 2.7 billion USD and took 14 years to complete, costsand times declined to around 1200 USD and 1.5 days for awhole-genome sequence with 30× coverage in 2015 [1] andtechnology to enable the 100 USD genome has already beenannounced [2]. As outcomes of these technologicaladvancements, the vast extent of genomic information has
propelled medicine by providing information about diseasesusceptibility, e.g. in cancer [3, 4], type 2 diabetes mellitus[5] or schizophrenia [6], by identifying genes that underliemonogenic disorders [7, 8] and by facilitating the discoveryof novel therapeutic targets, particularly in oncology [9].
However, despite these successes of human genomics ona population scale, the translation of personal genomic datainto clinically actionable information remains difficult. Eachindividual harbors on average 23,000–25,000 genetic var-iants in exons, including 10,000–12,000 variants resultingin amino acid exchanges and around 100 variants resultingin stop-gain mutations, frameshifts or differential splicesites, the vast majority of which are rare with minor allelefrequencies (MAF) < 1% [10]. Genes with importance fordrug absorption, distribution, metabolism and excretion(ADME) are highly variable [11–13] and such geneticvariability has been estimated to account for around 20–30% of the inter-individual differences in drug response[14]. However, while on average around 100 genetic var-iants are detected across ADME genes in each individual,the overwhelming majority has not been experimentallycharacterized, which poses a significant challenge forthe clinical interpretation of genetic variability andimpairs the translation of genomic data into actionableadvice [15, 16].
* Volker M. [email protected]
1 Department of Physiology and Pharmacology, Section ofPharmacogenetics, Karolinska Institutet, SE-171 77Stockholm, Sweden
2 Laboratory of Pharmacotherapy of Life-Style Related Diseases,Graduate School of Pharmaceutical Sciences, Tohoku University,Sendai, Japan
Electronic supplementary material The online version of this article(https://doi.org/10.1038/s41397-018-0044-2) contains supplementarymaterial, which is available to authorized users.
1234
5678
90();,:
1234567890();,:

As systematic experimental analyses in relevantexpression systems are hitherto not feasible for these vastnumbers of variants, computational methods have beenproposed for predicting the functional relevance of identi-fied genetic mutations. In recent years, dozens of algo-rithms have been presented that aim to distinguishdeleterious from neutral variants. These algorithms use avariety of features, such as secondary structure, functionalsites, protein stability or sequence conservation, and aremostly based on machine learning techniques, such assupport vector machines, artificial neural networks or naïveBayes classifiers [17–19]. Importantly, computationalmethods are generally trained on sets of variants with highevolutionary constraints implicated in disease. However, asmany ADME genes are generally only poorly conserved,we hypothesize that specialized pharmacogenetic predic-tion models are needed that have been calibrated onappropriate ADME data sets.
In this study, we used experimental activity data from337 variants distributed across 43 ADME genes to eval-uate current functionality prediction methods and foundthat standard algorithms are only relatively poor pre-dictors of the functional impact of ADME gene mutations.We thus developed a novel computational functionalityprediction model optimized for pharmacogenetic assess-ments, which substantially outperformed standard algo-rithms, correctly flagging 93% of experimental loss-of-function (LOF) variants as deleterious and 93% of var-iants without functional impact as neutral. Thus, theADME-optimized prediction framework significantlyimproves in silico functionality assessment of pharmaco-genetic variants, thereby facilitating the translation ofuncharacterized variants into pharmacogenetic recom-mendations and providing a further step towards theleveraging of Next-Generation Sequencing data for thepersonalization of pharmacological treatment.
Methods
In vitro functionality data
We obtained experimental functionality data for 337 singlevariant alleles from the 43 ADME gene (see SupplementaryTable 1 for references). The common variants rs3758581(CYP2C19 I331V), rs16947 (CYP2D6 R296C) andrs1135840 (CYP2D6 S486T) were considered as neutral.An overview of all analyzed variants, the substrates andexpression systems used for characterization and the insilico predictions by all tested algorithms is provided inSupplementary Table 2. Wherever necessary, variant coor-dinates were translated to a uniform reference genomeversion. Mutations for which no score could be retrieved by
any prediction method were excluded. Variants were con-sidered to have a deleterious impact if they reduced theirintrinsic clearance more than 2-fold compared to the wild-type allele (for most genes the *1, in the case of NAT1 the*4 allele).
Statistical definitions
True positives (TP) and false negatives (FN) are variantsthat have a functional impact in vitro and are predicted insilico to be deleterious or neutral, respectively. Conversely,true negatives (TN) and false positives (FP) are defined asmutations that do not affect the functionality of the genein vitro and are predicted in silico to be neutral or deleter-ious, respectively. The true positive rate or sensitivity is
defined asP
TPPTPþ
PFN, specificity is
PTNP
TNþP
FPand the
false positive rate is defined asP
FPPTNþ
PFP. Furthermore,
the positive and negative predictive values are calculated asP
TPPTPþ
PFP
andP
TNPTNþ
PFN, respectively and the total
predictive accuracy isP
TPþP
TNPTPþ
PTN
PFPþ
PFN.
Computational functionality predictions
We compared the functionality assessments of 18 current insilico functionality prediction algorithms, conservationscores and ensemble scores computed using ANNOVAR:[20] SIFT [21], PolyPhen-2 [22], Likelihood ratio tests [23],MutationAssessor [24], FATHMM [25], FATHMM-MKL[26], PROVEAN [27], VEST3 [28], CADD [29], DANN[30], MetaSVM [31], MetaLR [31], GERP++ [32], SiPhy[33], PhyloP [34] (using both vertebrate and mammalianalignments) and PhastCons [35] (using both vertebrate andmammalian alignments).
Development of ADME optimized algorithm
The 337 alleles were randomly partitioned into five subsetsfor 5-fold cross validations while assuring equal proportionsof deleterious and neutral variants (Fig. 1). Thresholds forthe individual algorithms were optimized on the basis of theYouden index or informedness function, which can beinterpreted as the probability of an informed classification.The Youden index, defined as I= sensitivity+ specificity –1, was calculated for each potential threshold (increments0.01–0.05) between the highest and lowest possible scoresfor each respective method. All variants i were classified asdeleterious or neutral by each of the k threshold-optimizedalgorithms. If the computational prediction for vari alignswith the corresponding experimental result, then score sk,i
Y. Zhou et al.

= 1 otherwise sk,i= 0. Subsequently, out of all possibleconstellations the algorithm combination was selected forthe ADME-optimized model for which
Pi
Pl sl;i ¼ max
with l ≤ k. Importantly, the result with this model wasvalidated for each fold using the independent validation set.Overall, optimal results for the pharmacogenetic predictionmodel were derived by integrating assessments of LRT,MutationAssessor, PROVEAN, VEST3 and CADD. Theoverall prediction score of the ADME -optimized model isdefined as follows: each of the algorithms predicts whethera variant is deleterious or neutral based on its ADME-optimized threshold value (1= deleterious and 0= func-tionally neutral). The final score is derived by averaging theassessments of the individual algorithms (1 or 0). Thus, ascore of 1 indicates that all algorithms predicted the variantto be deleterious, a score of 0 that all algorithms predictedthe variant to be neutral and a score of e.g. 0.5 that half ofthe algorithms predicted the variant to be deleterious andhalf to be neutral. Receiver operating characteristics (ROC)analyses were performed using Prism 6 (GraphPad SoftwareInc.).
Results
Conventional computational algorithms have a lowpredictive accuracy when applied topharmacogenetic variants
We first evaluated the performance of current computationalfunctionality assessment algorithms on pharmacogeneticvariants across 43 ADME genes with low evolutionaryconstraints (Supplementary Table 3). To this end, wederived predictions for 337 pharmacogenetic singlenucleotide variants (SNVs) with available high-qualityexperimental data. These variants cause alterations in theamino acid sequence of their corresponding gene product,which can either cause direct modulation of protein activity,result in changes in protein levels, for instance due tomisfolding followed by degradation or entail dysregulationof protein transport. We evaluated eight commonly usedfunctionality prediction algorithms, SIFT, PolyPhen-2,LRT, MutationAssessor, FATHMM, FATHMM-MKL,PROVEAN and VEST3 (Fig. 2a). When using the areaunder the ROC curve (AUCROC) as measure for modelquality, VEST3, MutationAssessor and PolyPhen-2 exhib-ited the best performance with AUCROC values of 0.8, 0.78and 0.77, respectively, whereas FATHMM performed worst(AUCROC= 0.51; Table 1).
Next, we tested the performance of four models, GERP++, SiPhy, PhyloP and PhastCons using different phyloge-netic models (using 7 vertebrates or 20 mammals), resultingin a total of six sores that use evolutionary conservationbased on sequence alignments as a measure for functionalimportance (Fig. 2b). Overall, the predictive power ofevolutionary conservation scores (AUCROC= 0.58–0.67)was substantially lower than that of functionality predictionalgorithms which base their assessment also on additionalfeatures, such as homology alignments or structure-basedfeatures (AUCROC= 0.51–0.8; Table 1). These findingssuggest that evolutionary conservation alone seems to be apoor indicator of functional impact in poorly conserved loci,such as ADME genes.
We furthermore analyzed the ensemble scores CADD,DANN, MetaSVM and MetaLR that integrate assessmentsfrom multiple orthologous methods (Fig. 2c). CADD andDANN performed substantially better than MetaSVM andMetaLR on our data set with the former showing the bestpredictive performance of all models analyzed (AUCROC=0.81; Table 1). Importantly, the predictive power of mostalgorithms on our ADME variant cohort was substantiallylower compared to data sets based on pathogenicity-associated variants (Table 1), emphasizing the short-comings of model parameterization based on genome-wideanalyses for pharmacogenetic functionality predictions.
337 variants in 44 pharmacogenes
5-fold Cross-validation
Training set(269 variants)
Parameter optimizationbased on Youden index
for each of the 18 algorithms
Model validation
Select optimalalgorithm combination
Average optimizedparametersacross folds
Predictive performance ofADME-optimized model
Validation set(68 variants)
4 su
bset
s
Randomly partition into 5 subsets
1 subset
ADME-optimized model
Predictive performanceof current
computational models
Comparative analysis
Integrate algorithmsthat were optimal
in each fold
Fig. 1 Schematic depiction of the workflow for the development of theADME optimized prediction model
An optimized prediction framework to assess the functional impact of pharmacogenetic variants

Optimization of pharmacogenetic functionalitypredictions
To improve the predictive power of pharmacogeneticfunctionality predictions, we structured the problem intotwo tasks: first, we optimized the classification thresholds ofthe individual algorithms and, in a second step, we selectedthe optimal combination of model components.
We decided to optimize parameterization of the algo-rithms based on the concept of overall informedness,defined as the probability that a prediction is informed (i.e.not by chance) using the Youden index as statistical targetmetric (see Supplementary Figure 1 for graphical depictionand further explanation). The Youden index J developed asa measure to rate diagnostic tests [36], is defined on thebasis of a ROC curve as J ¼ maxx sens xð Þ þ spec xð Þ � 1f g
PhyloP(vertebrate)
Neutra
l
Deleter
ious -3
-2
-1
0
1
2
Scor
e
PhyloP(mammalian)
Neutra
l
Deleter
ious -3
-2
-1
0
1
2
Scor
e
PhastCons(vertebrate)
Neutra
l
Deleter
ious 0.0
0.2
0.4
0.6
0.8
1.0
Scor
e
PhastCons(mammalian)
Neutra
l
Deleter
ious 0.0
0.2
0.4
0.6
0.8
1.0
Scor
e
SIFT
Neutra
l
Deleter
ious 0.0
0.2
0.4
0.6
0.8
1.0
Scor
ePolyphen-2
Neutra
l
Deleter
ious 0.0
0.2
0.4
0.6
0.8
1.0
Scor
e
LRT
Neutra
l
Deleter
ious 0.0
0.2
0.4
0.6
0.8
1.0
Scor
e
MutationAssessor
Neutra
l
Deleter
ious -4
-2
0
2
4
6
Scor
e
FATHMM
Neutra
l
Deleter
ious -5
0
5
10
Scor
e
FATHMM-MKL
Neutra
l
Deleter
ious 0.0
0.2
0.4
0.6
0.8
1.0
Scor
e
PROVEAN
Neutra
l
Deleter
ious -15
-10
-5
0
5
Scor
e
VEST3
Neutra
l
Deleter
ious 0.0
0.2
0.4
0.6
0.8
1.0
Scor
e
CADD
Neutra
l
Deleter
ious -20
0
20
40
60
Scor
eDANN
Neutra
l
Deleter
ious 0.00.20.40.60.8
0.90
0.95
1.00
Scor
e
MetaSVM
Neutra
l
Deleter
ious -1.5
-1.0
-0.5
0.0
0.5
1.0
1.5
Scor
e
MetaLR
Neutra
l
Deleter
ious 0.0
0.2
0.4
0.6
0.8
1.0
Scor
e
GERP++
Neutra
l
Deleter
ious -15
-10
-5
0
5
10
Scor
e
SiPhy
Neutra
l
Deleter
ious 0
5
10
15
20
25
Scor
e
Functionality prediction algorithmsa
Ensemble scoresc
Evolutionary conservation scoresb
Fig. 2 Overview of the performance of different functionality predic-tion methods. Variants (n= 337) were separated into phenotypicallyneutral variants (lighter shaded circles) and those that have a relevantimpact on substrate metabolism (intrinsic clearance reduced >2-fold;darker shaded squares). a–c Functionality was predicted using eightcommon prediction algorithms (a), 6 evolutionary conservation scores
(b) and 4 ensemble scores (c). Conventional thresholds of therespective algorithms are depicted as dashed lines and intervals offunctionality scores deemed functional are shaded in light gray. Theaverage scores of variants in the neutral and deleterious groups areindicated
Y. Zhou et al.
across all potential threshold scores x. The point x for whichthe sum of sensitivity and specificity is maximal indicatesthe optimal threshold value that maximizes the capacity ofthe test to differentiate between deleterious and neutralvariants when sensitivity and specificity are weightedequally, thus avoiding impacts of the unequal distribution ofneutral and functionally deleterious variants in our data set[37]. We defined the optimal threshold value for eachalgorithm or score based on the global maximum of theinformedness graph (Fig. 3a). Interestingly, shapes of theinformedness functions differed substantially betweenalgorithms. While some algorithms, such as PolyPhen-2 andFATHMM-MKL showed largely stable informednessvalues across a wide range of threshold scores, others, suchas SIFT or PROVEAN, exhibited sharp peaks, indicatingdrastic differences in the robustness of the method to var-iation in threshold scores.
To evaluate the sensitivity of this approach to variabilityin training set variants we performed 5-fold cross valida-tions in which we partitioned the variants into five equallysized subsets. Of these five subsets, four are used for model
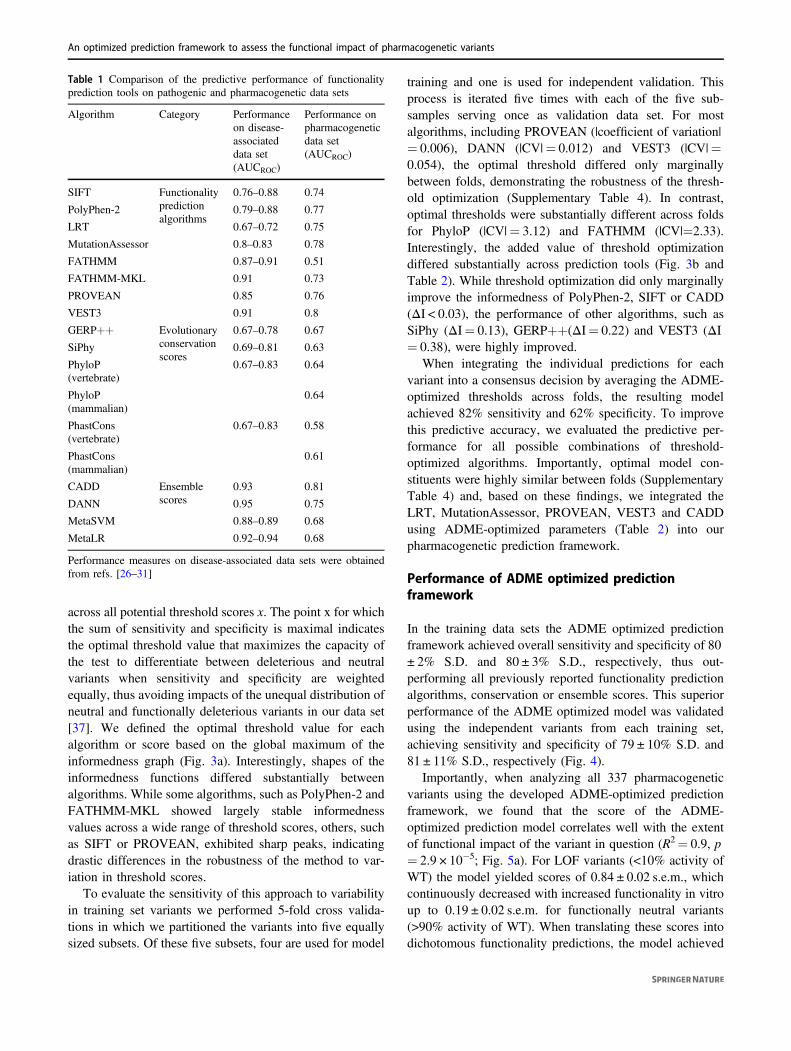
training and one is used for independent validation. Thisprocess is iterated five times with each of the five sub-samples serving once as validation data set. For mostalgorithms, including PROVEAN (|coefficient of variation|= 0.006), DANN (|CV|= 0.012) and VEST3 (|CV|=0.054), the optimal threshold differed only marginallybetween folds, demonstrating the robustness of the thresh-old optimization (Supplementary Table 4). In contrast,optimal thresholds were substantially different across foldsfor PhyloP (|CV|= 3.12) and FATHMM (|CV|=2.33).Interestingly, the added value of threshold optimizationdiffered substantially across prediction tools (Fig. 3b andTable 2). While threshold optimization did only marginallyimprove the informedness of PolyPhen-2, SIFT or CADD(ΔI < 0.03), the performance of other algorithms, such asSiPhy (ΔI= 0.13), GERP++(ΔI= 0.22) and VEST3 (ΔI= 0.38), were highly improved.
When integrating the individual predictions for eachvariant into a consensus decision by averaging the ADME-optimized thresholds across folds, the resulting modelachieved 82% sensitivity and 62% specificity. To improvethis predictive accuracy, we evaluated the predictive per-formance for all possible combinations of threshold-optimized algorithms. Importantly, optimal model con-stituents were highly similar between folds (SupplementaryTable 4) and, based on these findings, we integrated theLRT, MutationAssessor, PROVEAN, VEST3 and CADDusing ADME-optimized parameters (Table 2) into ourpharmacogenetic prediction framework.
Performance of ADME optimized predictionframework
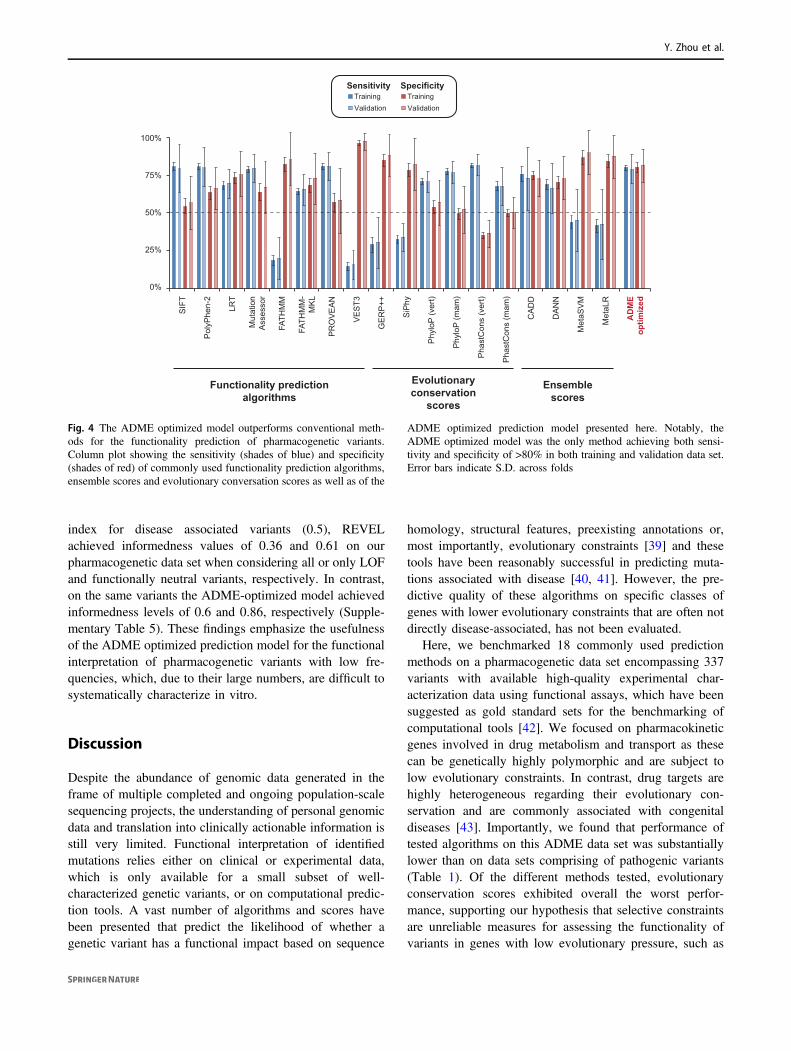
In the training data sets the ADME optimized predictionframework achieved overall sensitivity and specificity of 80± 2% S.D. and 80 ± 3% S.D., respectively, thus out-performing all previously reported functionality predictionalgorithms, conservation or ensemble scores. This superiorperformance of the ADME optimized model was validatedusing the independent variants from each training set,achieving sensitivity and specificity of 79 ± 10% S.D. and81 ± 11% S.D., respectively (Fig. 4).
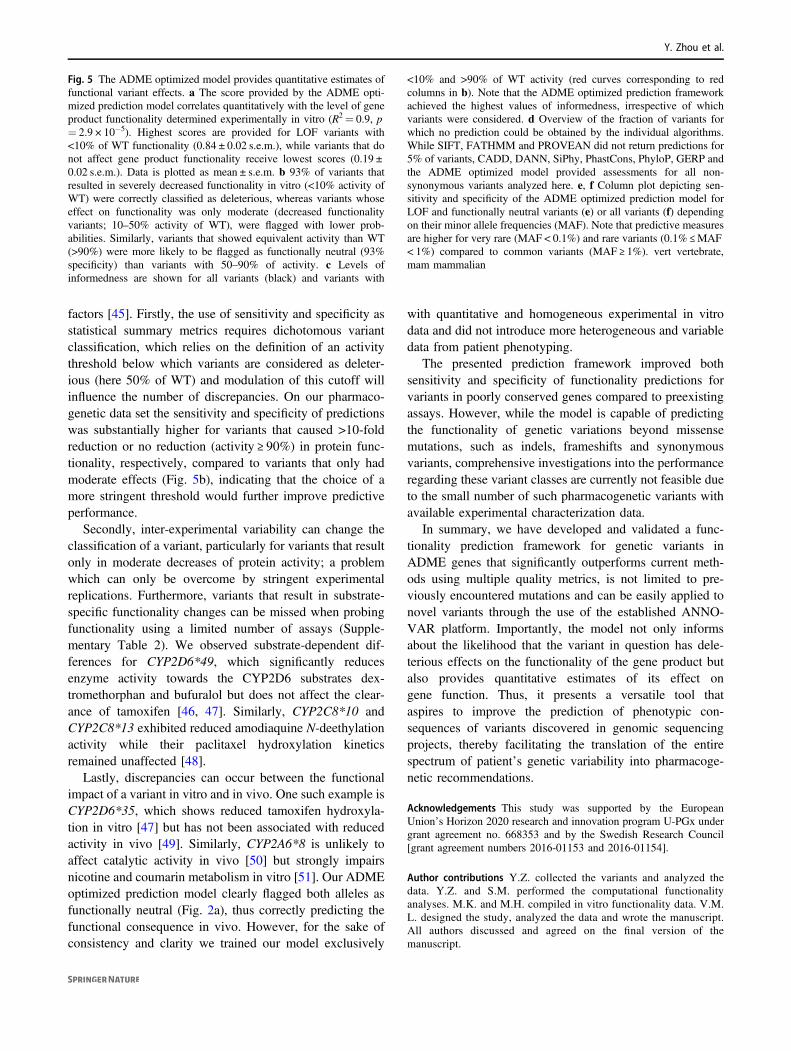
Importantly, when analyzing all 337 pharmacogeneticvariants using the developed ADME-optimized predictionframework, we found that the score of the ADME-optimized prediction model correlates well with the extentof functional impact of the variant in question (R2= 0.9, p= 2.9 × 10⁻⁵; Fig. 5a). For LOF variants (<10% activity ofWT) the model yielded scores of 0.84 ± 0.02 s.e.m., whichcontinuously decreased with increased functionality in vitroup to 0.19 ± 0.02 s.e.m. for functionally neutral variants(>90% activity of WT). When translating these scores intodichotomous functionality predictions, the model achieved
Table 1 Comparison of the predictive performance of functionalityprediction tools on pathogenic and pharmacogenetic data sets
Algorithm Category Performanceon disease-associateddata set(AUCROC)
Performance onpharmacogeneticdata set(AUCROC)
SIFT Functionalitypredictionalgorithms
0.76–0.88 0.74
PolyPhen-2 0.79–0.88 0.77
LRT 0.67–0.72 0.75
MutationAssessor 0.8–0.83 0.78
FATHMM 0.87–0.91 0.51
FATHMM-MKL 0.91 0.73
PROVEAN 0.85 0.76
VEST3 0.91 0.8
GERP++ Evolutionaryconservationscores
0.67–0.78 0.67
SiPhy 0.69–0.81 0.63
PhyloP(vertebrate)
0.67–0.83 0.64
PhyloP(mammalian)
0.64
PhastCons(vertebrate)
0.67–0.83 0.58
PhastCons(mammalian)
0.61
CADD Ensemblescores
0.93 0.81
DANN 0.95 0.75
MetaSVM 0.88–0.89 0.68
MetaLR 0.92–0.94 0.68
Performance measures on disease-associated data sets were obtainedfrom refs. [26–31]
An optimized prediction framework to assess the functional impact of pharmacogenetic variants

93% sensitivity (101/109 variants) for LOF variants thatdecreased activity >10-fold whereas variants with only mildfunctional effects were recognized with 55–70% sensitivity
(Fig. 5b). Conversely, prediction specificity for variants thatexhibited >90% of the functional activity of the WTallele, was 93% (66/71 variants), whereas the specificity for
Y. Zhou et al.

variants with 50–100% activity was only 56–82% . Overall,these performance metrics resulted in a predictiveaccuracy of 93% for LOF and functionally neutral variants,compared to 84% for CADD, the score with the nexthighest accuracy.
Overall, the ADME optimized model achieved thehighest extent of informedness for LOF and neutral variants(IADME= 0.86), followed by CADD (ICADD= 0.65) andLRT (ILRT= 0.63; Fig. 5c). Similarly, when all variants areconsidered and classified dichotomously, the ADME modelsubstantially outperformed current models (IADME= 0.6followed by ICADD= 0.51). In contrast, VEST3 andFATHMM only yielded overall values of IVEST= 0.11 andIFATHMM= 0.01, respectively. Besides the increased pre-dictive power, the integrated ADME model successfullyderived assessments for all variants, while some individualalgorithms were unable to predict the functional impact ofup to 5% of all variants analyzed (Fig. 5d).
Lastly, we analyzed whether the predictive performanceof the ADME optimized prediction model depended on thefrequency of the respective variant. The majority of the 337variants analyzed in this study were rare (n= 285) or veryrare (n= 232) with MAF < 1% or MAF < 0.1%, respec-tively. Notably, the predictive power of the model for LOFand functionally neutral variants was better for very rare(IMAF < 1%= 0.87) and rare mutations (I0.1%≤ MAF <1%= 1)compared to common variants (IMAF ≥ 1%= 0.45; Fig. 5e).Similar trends were observed when all variants were con-sidered either in our model (Fig. 5f) or in individually testedalgorithms (Supplementary Figure 2). While our resultscorrelated significantly with data from REVEL (R2= 0.5;Supplementary Figure 3), a prediction method to analyzethe pathogenicity of rare missense variants [38], the ADMEoptimized prediction framework performed substantiallybetter for the prediction of pharmacogenetic variants: Whenusing the threshold score that resulted in the best Youden
Fig. 3 Pharmacogenetic threshold optimization results in substantiallyhigher probabilities to make informed decisions. a The degree ofinformedness is plotted as a function of threshold score for eightfunctionality prediction algorithms, six evolutionalry conservationscores and four ensemble scores. The threshold score corresponding tothe global maximum of informedness is indicated. ΔI denotes the gainin informedness between using the pharmacogenetically optimizedthreshold and the conventional threshold provided in the literature.
Results are depicted for one of the five folds in our cross-validationanalysis. b Averaging the ΔI values of the five folds demonstrates thatthe increases in informedness due to ADME-specific parameterizationdiffer substantially between algorithms and are stable across folds. Asno standard thresholds for PhyloP and PhastCons are provided in theliterature, no ΔI values for these conservation scores are shown. Errorbars indicate S.D.
Table 2 Overview of computational method parameters to assess the functionality of pharmacogenetic variants
Conventional ADME optimized
Algorithm Category Threshold Sensitivity (%) Specificity (%) Threshold Sensitivity (%) Specificity (%)
SIFT Functionality predictionalgorithms
<0.05 80.7 54.2 <0.0376 75.6 57.6
PolyPhen-2 >0.447 80.8 63 >0.3841 83 61.6
LRT <0.001 66.3 72.3 <0.0025 77.3 65.2
MutationAssessor >1.9 79 63.7 >2.0566 74 67.8
FATHMM <−1.5 18.2 81.9 <0.486 69.9 27.1
FATHMM-MKL >0.73 64.2 68 >0.3982 77.4 63.3
PROVEAN <−2.5 80.7 56.9 <−3.286 72.2 72.2
VEST3 >0.9 14.3 95.9 >0.4534 67.6 78.8
GERP++ Evolutionary conservationscores
>4.4 28.4 84.4 >1.2482 84.2 47.6
SiPhy >12.17 32.1 78.2 >7.2442 51.9 72.7
PhyloP (vertebrate) NA NA NA >0.5216 70.5 53.7
PhyloP (mammalian) NA NA NA >0.0461 77.4 49
PhastCons (vertebrate) NA NA NA >0.07 81.1 34.7
PhastCons(mammalian)
NA NA NA >0.1872 67.4 49.7
CADD Ensemble scores >15 75.8 74.8 >19.19 74.2 78.9
DANN >0.99 68.9 70.1 >0.9688 85.8 54.4
MetaSVM >0 43.4 86.3 >−0.3371 51.6 78.1
MetaLR >0.5 41.2 84.2 >0.4039 52.2 76.7
Sensitivity and specificity of each prediction method is shown for conventional disease dataset-based parameterization and ADME optimizedparameters. Threshold values are in arbitrary units, values for sensitivity and specificity are provided in percentage (%)
An optimized prediction framework to assess the functional impact of pharmacogenetic variants
index for disease associated variants (0.5), REVELachieved informedness values of 0.36 and 0.61 on ourpharmacogenetic data set when considering all or only LOFand functionally neutral variants, respectively. In contrast,on the same variants the ADME-optimized model achievedinformedness levels of 0.6 and 0.86, respectively (Supple-mentary Table 5). These findings emphasize the usefulnessof the ADME optimized prediction model for the functionalinterpretation of pharmacogenetic variants with low fre-quencies, which, due to their large numbers, are difficult tosystematically characterize in vitro.
Discussion
Despite the abundance of genomic data generated in theframe of multiple completed and ongoing population-scalesequencing projects, the understanding of personal genomicdata and translation into clinically actionable information isstill very limited. Functional interpretation of identifiedmutations relies either on clinical or experimental data,which is only available for a small subset of well-characterized genetic variants, or on computational predic-tion tools. A vast number of algorithms and scores havebeen presented that predict the likelihood of whether agenetic variant has a functional impact based on sequence
homology, structural features, preexisting annotations or,most importantly, evolutionary constraints [39] and thesetools have been reasonably successful in predicting muta-tions associated with disease [40, 41]. However, the pre-dictive quality of these algorithms on specific classes ofgenes with lower evolutionary constraints that are often notdirectly disease-associated, has not been evaluated.
Here, we benchmarked 18 commonly used predictionmethods on a pharmacogenetic data set encompassing 337variants with available high-quality experimental char-acterization data using functional assays, which have beensuggested as gold standard sets for the benchmarking ofcomputational tools [42]. We focused on pharmacokineticgenes involved in drug metabolism and transport as thesecan be genetically highly polymorphic and are subject tolow evolutionary constraints. In contrast, drug targets arehighly heterogeneous regarding their evolutionary con-servation and are commonly associated with congenitaldiseases [43]. Importantly, we found that performance oftested algorithms on this ADME data set was substantiallylower than on data sets comprising of pathogenic variants(Table 1). Of the different methods tested, evolutionaryconservation scores exhibited overall the worst perfor-mance, supporting our hypothesis that selective constraintsare unreliable measures for assessing the functionality ofvariants in genes with low evolutionary pressure, such as
SIF
T
Pol
yPhe
n-2
LRT
Mut
atio
nA
sses
sor
FATH
MM
PR
OV
EA
N
VE
ST3
CA
DD
DA
NN
FATH
MM
-M
KL
Met
aSV
M
Met
aLR
GE
RP
++
Phy
loP
(ver
t)
Phy
loP
(mam
)
Pha
stC
ons
(ver
t)
Pha
stC
ons
(mam
)
SiP
hy
AD
ME
optim
ized
0%
25%
50%
75%
100%
TrainingValidation
TrainingValidation
Sensitivity Specificity
Functionality predictionalgorithms
Ensemblescores
Evolutionaryconservation
scores
Fig. 4 The ADME optimized model outperforms conventional meth-ods for the functionality prediction of pharmacogenetic variants.Column plot showing the sensitivity (shades of blue) and specificity(shades of red) of commonly used functionality prediction algorithms,ensemble scores and evolutionary conversation scores as well as of the
ADME optimized prediction model presented here. Notably, theADME optimized model was the only method achieving both sensi-tivity and specificity of >80% in both training and validation data set.Error bars indicate S.D. across folds
Y. Zhou et al.

ADME genes [44]. Given that most algorithms rely onevolutionary conservation as a core feature, these findingssuggest that ADME gene-specific parameter optimizationand integration of orthogonal approaches represent anappealing rationale to improve the pharmacogeneticpredictions.
After optimization our model significantly outperformedall individual functionality prediction methods achieving apredictive accuracy of 93% for LOF and functionally neu-tral variants, compared to 84% for CADD, the second best
algorithm. Interestingly, we achieved the best overall per-formance not by integrating the individually best perform-ing algorithms. For instance, LRT ranked only as 5 with anaccuracy of 81.8% but the LRT score was integrated intothe most predictive ADME model. This finding is inagreement with the performance of the model on humandisease alleles for which the overlap between LRT andother methods has been shown to be low [23].
Deviations between in vitro data and in silico predictionscan be allotted to both computational and experimental
Deleterious Neutral
0%
25%
50%
75%
100%
n=10
9
n=20
n=23
n=18
n=22
n=18
n=17
n=18 n=21 n=
71
93%
76%
56%
82%
61%
55%
67%
57%
70%
93%
0-10
%
10-2
0%
20-3
0%
30-4
0%
40-5
0%
50-6
0%
60-7
0%
70-8
0%
80-9
0%
>90%Activity
(% of WT):
Cor
rect
pre
dict
ions
All variants
Variants with <10%or >90% of WT activity
0
0.25
0.5
0.75
1
Info
rmed
ness
AD
ME
optim
ized
Pol
yPhe
n-2
Mut
atio
nAss
esso
r
CA
DD
DA
NN
LRT
SIF
T
FATH
MM
-MK
LP
RO
VE
AN
Met
aSV
MM
etaL
R
Phy
loP
(mam
)
Phy
loP
(ver
t)
Pha
stC
ons
(mam
)S
iPhy
GE
RP
++
Pha
stC
ons
(ver
t)V
ES
T3FA
THM
M
a
dc
b
SIF
TFA
THM
M
AD
ME
optim
ized
Pol
yPhe
n-2
Mut
atio
nAss
esso
r
CA
DD
DA
NN
LRT
FATH
MM
-MK
L
PR
OV
EA
N
Met
aSV
MM
etaL
R
Phy
loP
(mam
)P
hylo
P (v
ert)
Pha
stC
ons
(mam
)S
iPhy
GE
RP
++
Pha
stC
ons
(ver
t)
VE
ST3
6%
0%
2%
4%
Mis
sing
val
ues
0
0.25
0.5
0.75
1
0-10
%
10-2
0%
20-3
0%
30-4
0%
40-5
0%
50-6
0%
60-7
0%
70-8
0%
80-9
0%
>90%
Deleterious Neutral
Activity(% of WT):
Scor
e
e
0%
25%
50%
75%
100%
MAF <0.1% 0.1-1% ≥1%
n=125 n=26 n=29
Only LOF and neutral variants
Sensitivity Specificity
f
0%
25%
50%
75%
100%
<0.1% 0.1-1% ≥1%MAF
All variants
n=232 n=53 n=52
An optimized prediction framework to assess the functional impact of pharmacogenetic variants
factors [45]. Firstly, the use of sensitivity and specificity asstatistical summary metrics requires dichotomous variantclassification, which relies on the definition of an activitythreshold below which variants are considered as deleter-ious (here 50% of WT) and modulation of this cutoff willinfluence the number of discrepancies. On our pharmaco-genetic data set the sensitivity and specificity of predictionswas substantially higher for variants that caused >10-foldreduction or no reduction (activity ≥ 90%) in protein func-tionality, respectively, compared to variants that only hadmoderate effects (Fig. 5b), indicating that the choice of amore stringent threshold would further improve predictiveperformance.
Secondly, inter-experimental variability can change theclassification of a variant, particularly for variants that resultonly in moderate decreases of protein activity; a problemwhich can only be overcome by stringent experimentalreplications. Furthermore, variants that result in substrate-specific functionality changes can be missed when probingfunctionality using a limited number of assays (Supple-mentary Table 2). We observed substrate-dependent dif-ferences for CYP2D6*49, which significantly reducesenzyme activity towards the CYP2D6 substrates dex-tromethorphan and bufuralol but does not affect the clear-ance of tamoxifen [46, 47]. Similarly, CYP2C8*10 andCYP2C8*13 exhibited reduced amodiaquine N-deethylationactivity while their paclitaxel hydroxylation kineticsremained unaffected [48].
Lastly, discrepancies can occur between the functionalimpact of a variant in vitro and in vivo. One such example isCYP2D6*35, which shows reduced tamoxifen hydroxyla-tion in vitro [47] but has not been associated with reducedactivity in vivo [49]. Similarly, CYP2A6*8 is unlikely toaffect catalytic activity in vivo [50] but strongly impairsnicotine and coumarin metabolism in vitro [51]. Our ADMEoptimized prediction model clearly flagged both alleles asfunctionally neutral (Fig. 2a), thus correctly predicting thefunctional consequence in vivo. However, for the sake ofconsistency and clarity we trained our model exclusively
with quantitative and homogeneous experimental in vitrodata and did not introduce more heterogeneous and variabledata from patient phenotyping.
The presented prediction framework improved bothsensitivity and specificity of functionality predictions forvariants in poorly conserved genes compared to preexistingassays. However, while the model is capable of predictingthe functionality of genetic variations beyond missensemutations, such as indels, frameshifts and synonymousvariants, comprehensive investigations into the performanceregarding these variant classes are currently not feasible dueto the small number of such pharmacogenetic variants withavailable experimental characterization data.
In summary, we have developed and validated a func-tionality prediction framework for genetic variants inADME genes that significantly outperforms current meth-ods using multiple quality metrics, is not limited to pre-viously encountered mutations and can be easily applied tonovel variants through the use of the established ANNO-VAR platform. Importantly, the model not only informsabout the likelihood that the variant in question has dele-terious effects on the functionality of the gene product butalso provides quantitative estimates of its effect ongene function. Thus, it presents a versatile tool thataspires to improve the prediction of phenotypic con-sequences of variants discovered in genomic sequencingprojects, thereby facilitating the translation of the entirespectrum of patient’s genetic variability into pharmacoge-netic recommendations.
Acknowledgements This study was supported by the EuropeanUnion’s Horizon 2020 research and innovation program U-PGx undergrant agreement no. 668353 and by the Swedish Research Council[grant agreement numbers 2016-01153 and 2016-01154].
Author contributions Y.Z. collected the variants and analyzed thedata. Y.Z. and S.M. performed the computational functionalityanalyses. M.K. and M.H. compiled in vitro functionality data. V.M.L. designed the study, analyzed the data and wrote the manuscript.All authors discussed and agreed on the final version of themanuscript.
Fig. 5 The ADME optimized model provides quantitative estimates offunctional variant effects. a The score provided by the ADME opti-mized prediction model correlates quantitatively with the level of geneproduct functionality determined experimentally in vitro (R2= 0.9, p= 2.9 × 10⁻⁵). Highest scores are provided for LOF variants with<10% of WT functionality (0.84 ± 0.02 s.e.m.), while variants that donot affect gene product functionality receive lowest scores (0.19 ±0.02 s.e.m.). Data is plotted as mean ± s.e.m. b 93% of variants thatresulted in severely decreased functionality in vitro (<10% activity ofWT) were correctly classified as deleterious, whereas variants whoseeffect on functionality was only moderate (decreased functionalityvariants; 10–50% activity of WT), were flagged with lower prob-abilities. Similarly, variants that showed equivalent activity than WT(>90%) were more likely to be flagged as functionally neutral (93%specificity) than variants with 50–90% of activity. c Levels ofinformedness are shown for all variants (black) and variants with
<10% and >90% of WT activity (red curves corresponding to redcolumns in b). Note that the ADME optimized prediction frameworkachieved the highest values of informedness, irrespective of whichvariants were considered. d Overview of the fraction of variants forwhich no prediction could be obtained by the individual algorithms.While SIFT, FATHMM and PROVEAN did not return predictions for5% of variants, CADD, DANN, SiPhy, PhastCons, PhyloP, GERP andthe ADME optimized model provided assessments for all non-synonymous variants analyzed here. e, f Column plot depicting sen-sitivity and specificity of the ADME optimized prediction model forLOF and functionally neutral variants (e) or all variants (f) dependingon their minor allele frequencies (MAF). Note that predictive measuresare higher for very rare (MAF < 0.1%) and rare variants (0.1% ≤MAF< 1%) compared to common variants (MAF ≥ 1%). vert vertebrate,mam mammalian
Y. Zhou et al.
Compliance with ethical standards
Conflict of interest V.M.L. is a co-founder and owner of HepaPredictAB. The remaining authors declare that they have no conflict ofinterest.
Open Access This article is licensed under a Creative CommonsAttribution 4.0 International License, which permits use, sharing,adaptation, distribution and reproduction in any medium or format, aslong as you give appropriate credit to the original author(s) and thesource, provide a link to the Creative Commons license, and indicate ifchanges were made. The images or other third party material in thisarticle are included in the article’s Creative Commons license, unlessindicated otherwise in a credit line to the material. If material is notincluded in the article’s Creative Commons license and your intendeduse is not permitted by statutory regulation or exceeds the permitteduse, you will need to obtain permission directly from the copyrightholder. To view a copy of this license, visit http://creativecommons.org/licenses/by/4.0/.
References
1. Wetterstrand KA DNA Sequencing Costs: Data from the NHGRIGenome Sequencing Program (GSP) http://www.genome.gov/sequencingcostsdata. Accessed 14 Aug 2017.
2. Illumina Press Release. https://www.illumina.com/company/news-center/press-releases/press-release-details.html?newsid=2236383.
3. Stadler ZK, Thom P, Robson ME, Weitzel JN, Kauff ND, HurleyKE, et al. Genome-wide association studies of cancer. J ClinOncol. 2010;28:4255–67.
4. Foulkes WD, Knoppers BM, Turnbull C. Population genetictesting for cancer susceptibility: founder mutations to genomes.Nat Rev Clin Oncol. 2015;13:41–54.
5. McCarthy MI. Genomics, type 2 diabetes, and obesity. New EnglJ Med. 2010;363:2339–50.
6. Giusti-Rodríguez P, Sullivan PF. The genomics of schizophrenia:update and implications. J Clin Investig. 2013;123:4557–63.
7. Boycott KM, Vanstone MR, Bulman DE, MacKenzie AE. Rare-disease genetics in the era of next-generation sequencing: dis-covery to translation. Nat Rev Clin Oncol. 2013;14:681–91.
8. Sawyer SL, Hartley T, Dyment DA, Beaulieu CL, Schwartzen-truber J, Smith A, et al. Utility of whole-exome sequencing forthose near the end of the diagnostic odyssey: time to address gapsin care. Clin Genet. 2015;89:275–84.
9. Hyman DM, Taylor BS, Baselga J. Implementing genome-drivenoncology. Cell. 2017;168:584–99.
10. Consortium GP, Auton A, Brooks LD, Kang HM, College B,Harvard BIoMa, et al. An integrated map of genetic variation from1092 human genomes. Nature. 2012;491:56–65.
11. Nelson MR, Wegmann D, Ehm MG, Kessner D, St Jean P,Verzilli C, et al. An abundance of rare functional variants in 202drug target genes sequenced in 14,002 people. Science.2012;337:100–4.
12. Fujikura K, Ingelman-Sundberg M, Lauschke VM. Genetic var-iation in the human cytochrome P450 supergene family. PharmGenom. 2015;25:584–94.
13. Bush WS, Crosslin DR, Owusu-Obeng A, Wallace J, AlmogueraB, Basford MA, et al. Genetic variation among 82 pharmaco-genes: the PGRNseq data from the eMERGE network. ClinPharmacol Ther. 2016;100:160–9.
14. Sim SC, Kacevska M, Ingelman-Sundberg M. Pharmacogenomicsof drug-metabolizing enzymes: a recent update on clinical impli-cations and endogenous effects. Pharm J. 2013;13:1–11.
15. Lauschke VM, Ingelman-Sundberg M. Precision medicine andrare genetic variants. Trends Pharmacol Sci. 2016;37:85–86.
16. Kozyra M, Ingelman-Sundberg M, Lauschke VM. Rare geneticvariants in cellular transporters, metabolic enzymes, and nuclearreceptors can be important determinants of interindividual differ-ences in drug response. Genet Med. 2017;19:20–29.
17. Peterson TA, Doughty E, Kann MG. Towards precision medicine:advances in computational approaches for the analysis of humanvariants. J Mol Biol. 2013;425:4047–63.
18. Trost B, Kusalik A. Computational prediction of eukaryoticphosphorylation sites. Bioinformatics. 2011;27:2927–35.
19. Kulshreshtha S, Chaudhary V, Goswami GK, Mathur N. Com-putational approaches for predicting mutant protein stability. JComput Aided Mol Des. 2016;30:401–12.
20. Wang K, Li M, Hakonarson H. ANNOVAR: functional annota-tion of genetic variants from high-throughput sequencing data.Nucleic Acids Res. 2010;38:e164–e164.
21. Ng PC, Henikoff S. Predicting deleterious amino acid substitu-tions. Genome Res. 2001;11:863–74.
22. Adzhubei IA, Schmidt S, Peshkin L, Ramensky VE, GerasimovaA, Bork P, et al. A method and server for predicting damagingmissense mutations. Nat Methods. 2010;7:248–9.
23. Chun S, Fay JC. Identification of deleterious mutations withinthree human genomes. Genome Res. 2009;19:1553–61.
24. Reva B, Antipin Y, Sander C. Predicting the functional impact ofprotein mutations: application to cancer genomics. Nucleic AcidsRes. 2011;39:e118–e118.
25. Shihab HA, Gough J, Cooper DN, Stenson PD, Barker GLA,Edwards KJ, et al. Predicting the functional, molecular, andphenotypic consequences of amino acid substitutions using Hid-den Markov models. Hum Mutat. 2012;34:57–65.
26. Shihab HA, Rogers MF, Gough J, Mort M, Cooper DN, DayINM, et al. An integrative approach to predicting the functionaleffects of non-coding and coding sequence variation. Bioinfor-matics. 2015;31:1536–43.
27. Choi Y, Sims GE, Murphy S, Miller JR, Chan AP. Predicting thefunctional effect of amino acid substitutions and indels. PLoSONE. 2012;7:e46688–46613.
28. Carter H, Douville C, Stenson PD, Cooper DN, Karchin R.Identifying Mendelian disease genes with the variant effect scor-ing tool. BMC Genom. 2013;14(Suppl 3):S3.
29. Kircher M, Witten DM, Jain P, O'Roak B J, Cooper G M,Shendure J. A general framework for estimating the relativepathogenicity of human genetic variants. Nat Genet. 2014;46:310–5.
30. Quang D, Chen Y, Xie X. DANN: a deep learning approach forannotating the pathogenicity of genetic variants. Bioinformatics.2015;31:761–3.
31. Dong C, Wei P, Jian X, Gibbs R, Boerwinkle E, Wang K, et al.Comparison and integration of deleteriousness prediction methodsfor nonsynonymous SNVs in whole exome sequencing studies.Hum Mol Genet. 2015;24:2125–37.
32. Davydov EV, Goode DL, Sirota M, Cooper GM, Sidow A, Bat-zoglou S. Identifying a high fraction of the human genome to beunder selective constraint using GERP++. PLoS Comput Biol.2010;6:e1001025–1001013.
33. Garber M, Guttman M, Clamp M, Zody MC, Friedman N, Xie X.Identifying novel constrained elements by exploiting biased sub-stitution patterns. Bioinformatics. 2009;25:i54–i62.
34. Pollard KS, Hubisz MJ, Rosenbloom KR, Siepel A. Detection ofnonneutral substitution rates on mammalian phylogenies. GenomeRes. 2010;20:110–21.
35. Siepel A, Bejerano G, Pedersen JS, Hinrichs AS, Hou M, Rosen-bloom K, et al. Evolutionarily conserved elements in vertebrate,insect, worm, and yeast genomes. Genome Res. 2005;15:1034–50.
36. Youden WJ. Index for rating diagnostic tests. Cancer. 1950;3:32–35.
An optimized prediction framework to assess the functional impact of pharmacogenetic variants

37. Powers DMW. Evaluation: from precision, recall and F-measureto ROC, informedness, markedness and correlation. J Mach LearnTechnol. 2011;2:37–63.
38. Ioannidis NM, Rothstein JH, Pejaver V, Middha S, McDonnellSK, Baheti S, et al. REVEL: an ensemble method for predictingthe pathogenicity of rare missense variants. Am J Human Genet.2016;99:877–85.
39. Ng PC, Henikoff S. Predicting the effects of amino acid sub-stitutions on protein function. Annu Rev Genom Hum Genet.2006;7:61–80.
40. Thusberg J, Olatubosun A, Vihinen M. Performance of mutationpathogenicity prediction methods on missense variants. HumMutat. 2011;32:358–68.
41. Martelotto LG, Ng CK, De Filippo MR, Zhang Y, Piscuoglio S,Lim RS, et al. Benchmarking mutation effect prediction algo-rithms using functionally validated cancer-related missensemutations. Genome Biol. 2014;15:453–420.
42. Mahmood K, Jung C-h, Philip G, Georgeson P, Chung J, Pope BJ,et al. Variant effect prediction tools assessed using independent,functional assay-based datasets: implications for discovery anddiagnostics. Hum Genom. 2017;11:10.
43. Sun J, Zhu K, Zheng W, Xu H. A comparative study of diseasegenes and drug targets in the human protein interactome. BMCBioinforma. 2015;16Suppl 5(Suppl 5):S1.
44. Lauschke VM, Milani L, Ingelman-Sundberg M. Pharmacoge-nomic biomarkers for improved drug therapy—recent progressand future developments. AAPS J. 2017;20:4.
45. Gallion J, Koire A, Katsonis P, Schoenegge A-M, Bouvier M,Lichtarge O. Predicting phenotype from genotype: improving
accuracy through more robust experimental and computationalmodeling. Hum Mutat. 2017;38:569–80.
46. Sakuyama K, Sasaki T, Ujiie S, Obata K, Mizugaki M, IshikawaM, et al. Functional characterization of 17 CYP2D6 allelic var-iants (CYP2D6.2, 10, 14A-B, 18, 27, 36, 39, 47-51, 53-55, and57). Drug Metab Dispos. 2008;36:2460–7.
47. Muroi Y, Saito T, Takahashi M, Sakuyama K, Niinuma Y, Ito M,et al. Functional characterization of wild-type and 49 CYP2D6allelic variants for N-desmethyltamoxifen 4-hydroxylation activ-ity. Drug Metab Pharmacokinet. 2014;29:360–6.
48. Tsukada C, Saito T, Maekawa M, Mano N, Oda A, Hirasawa N,et al. Functional characterization of 12 allelic variants of CYP2C8by assessment of paclitaxel 6 alpha-hydroxylation and amodia-quine N-deethylation. Drug Metab Pharmacokinet. 2015;30:366–73.
49. Gaedigk A, Ryder DL, Bradford LD, Lceder JS. CYP2D6 poormetabolizer status can be ruled out by a single genotyping assayfor the-1584G promoter polymorphism. Clin Chem.2003;49:1008–11.
50. Xu C, Rao YS, Xu B, Hoffmann E, Jones J, Sellers EM, et al. Anin vivo pilot study characterizing the new CYP2A6*7, *8,and *10 alleles. Biochem Biophys Res Commun. 2002;290:318–24.
51. Hosono H, Kumondai M, Maekawa M, Yamaguchi H, Mano N,Oda A, et al. Functional Characterization of 34 CYP2A6Allelic Variants by Assessment of Nicotine C-Oxidation andCoumarin 7-Hydroxylation Activities. Drug Metab Dispos.2017;45:279–85.
Y. Zhou et al.