an open source toolkit for identifying comparative space-time research questions
TRANSCRIPT

Chin. Geogra. Sci. 2014 Vol. 24 No. 2 pp. 1–14 Springer Science Press
doi: 10.1007/s11769-014-0679-0 www.springerlink.com/content/1002-0063
Received date: 2013-09-02; accepted date: 2013-11-25
Foundation item: Under the auspices of Humanities and Social Science Research, Major Project of Chinese Ministry of Education (No.
13JJD790008), Basic Research Funds of National Higher Education Institutions of China (No. 2722013JC030), Zhongnan University
of Economics and Law 2012 Talent Grant (No. 31541210702), Key Research Program of Chinese Academy of Sciences (No.
KZZD-EW-06-03, KSZD-EW-Z-021-03), National Key Science and Technology Support Program of China (No. 2012BAH35B03) Corresponding author: CHENG Yeqing. E-mail: [email protected] © Science Press, Northeast Institute of Geography and Agroecology, CAS and Springer-Verlag Berlin Heidelberg 2014
An Open Source Toolkit for Identifying Comparative Space-time Re-search Questions
YE Xinyue1, SHE Bing2, WU Ling3, ZHU Xinyan2, CHENG Yeqing4
(1. Computational Social Science Lab & Department of Geography, Kent State University, Kent 44242, United States; 2. State Key Lab of Information Engineering in Surveying Mapping and Remote Sensing, Wuhan University, Wuhan 430079, China; 3. College of Crimi-nal Justice, Zhongnan University of Economics and Law, Wuhan 430073, China; 4. Northeast Institute of Geography and Agroecology, Chinese Academy of Sciences, Changchun 130102, China)
Abstract: Comparative space-time thinking lies at the heart of spatiotemporally integrated social sciences. The multiple dimensions and
scales of socioeconomic dynamics pose numerous challenges for the application and evaluation of public policies in the comparative
context. At the same time, social scientists have been slow to adopt and implement new spatiotemporally explicit methods of data analy-
sis due to the lack of extensible software packages, which becomes a major impediment to the promotion of spatiotemporal thinking.
The proposed framework will address this need by developing a set of research questions based on space-time-distributional features of
socioeconomic datasets. The authors aim to develop, evaluate, and implement this framework in an open source toolkit to comprehen-
sively quantify the changes and level of hidden variation of space-time datasets across scales and dimensions. Free access to the source
code allows a broader community to incorporate additional advances in perspectives and methods, thus facilitating interdisciplinary
collaboration. Being written in Python, it is entirely cross-platform, lowering transmission costs in research and education.
Keywords: open source; comparative; spatiotemporally integrated social sciences
Citation: Ye Xinyue, She Bing, Wu Ling, Zhu Xinyan, Cheng Yeqing. An open source toolkit for identifying comparative space-time
research questions. Chinese Geographical Science. doi: 10.1007/s11769-000-0679-0
1 Introduction
Growing socioeconomic inequality across various spa- tial scales threatens the social harmony and erodes the political basis for sustainable growth. This concern is exemplified by Levy and Chowdhury (1995)′s comment that ′large income and wealth differences between coun- tries and regions generated acts of aggression which inflicted considerable human suffering, loss of resources and knowledge, destruction of civilizations and envi- ronmental damage′. Meanwhile, a number of fascinating
debates on the trajectories and mechanisms of regional development are reflected in numerous empirical studies of specific regions and countries (Moulaert and Mehmood, 2009; Yeung, 2009; Vasquez, 2011; Wei and Liefner, 2012; Wei, 2013). Despite rich and growing list of empirical literature, comparative analysis of devel- opment and inequality within and between economic systems remains largely unexplored (Ye, 2010). It is fascinating to detect a list of differences and similarities across various scales and dimensions between and within multiple regional and urban systems. In other

2 Chinese Geographical Science
words, many cases studies and good practices exist, but a systematical comparison toolkit is missing.
At the same time, the volume of available space-time data in various disciplines and domains has increased dramatically due to the growing sophistication and ubiquity of information and communication technology (Batty, 2005; Wang, 2005; Mennis and Guo, 2009; Yang et al., 2010; Gui et al., 2012, Ye and Shi, 2012). Spatial statistics and spatial econometrics have enabled social scientists to leverage these new data sources, while sig-nificant difficulties still exist (Getis et al., 2004; LeSage and Pace, 2009; Anselin, 2012; Anselin and Rey, 2012). It is clear that a space-time perspective has become in-creasingly relevant to our understanding of socioeco-nomic dynamics and a framework is needed to system-atically integrate space and time (Miller and Wentz, 2003; Goodchild, 2008; Wang and Arnold, 2008; Rey and Ye, 2010; Ye and Liu, 2012). Thus, the availability of codes and tools to support space-time data analysis will play a critical role in the adoption of such a per-spective across the social sciences (Anselin, 2010; Bivand, 2011; Ye and Carroll, 2011a).
Methods developed in the mainstream social science disciplines have been applied with little attention paid to the potential challenges posed by the spatial effects over time across multiple scales and dimensions (Rey and Ye, 2010). Though rich conceptual frameworks have high-lighted the spatial unevenness of socioeconomic proc-esses, the gap has been widening between the empirical studies and theories (Ye, 2010). Hence, the most crucial step is to systematically understand the data from the theoretical and policy context before testing hypotheses. It is worth noticing that data are also collected based on the understanding of the systems including hypotheses (Ye, 2010). Comparison is at the heart of human behav-ior and reasoning. Comparative analysis is a method to observe and interpret the world, including its spatial and temporal characteristics. In many disciplines, research-ers are asked to compare and contrast two things, such as two temporal trends, two spatial processes, and so on. When one or two space-time datasets are presented, it is interesting to detect crucial differences or surprising commonalities among or between the two systems, which can be refined to generate many important re-search questions. Faced with a daunting task of finding a variety of differences and similarities across all possible perspectives, it is necessary to design research questions
more logically and comprehensively. However, existing exploratory approaches to space-time analysis, from data mining to visualization, are limited to building a framework to generate research questions for one space- time dataset, let alone two datasets. This papers aims to suggest a framework of research questions to compare space-time patterns and trends within one dataset, as well as across two datasets. The proposed framework aims to systematically evaluate the integrated treatment of three dimensions (space, time, and distribution) and four scales (global, meso, local, and individual) in so-cioeconomic studies. The framework will address the following broad questions: 1) What role does three di-mensions and four scales play in the empirical analysis of socioeconomic dynamics and discrete space? 2) Though this framework was initialized in regional ine-quality studies, can it be applied to human mobility and continuous space? 3) Can generic comparative research questions be systematically asked based on the combi-nation of three dimensions and four scales of the data?
2 Literature Review
The existing spatial analysis methods have been devel-oped primarily in the static context. Yet, all of the proc-esses of interest to social scientists operate over spatial, temporal, and distributional dimensions across scales. Questions on inequality lie at the heart of the discipline of geography, although recent work in human geography has been criticized for failure to address the key chal-lenges of development and inequality. The last two dec-ades have witnessed an enormous literature of empirical studies on socioeconomic inequality across multiple social sciences (Barro et al., 1991; Chen and Fleisher, 1996; Le Gallo and Ertur, 2003; Ezcurra, 2007; Tselios, 2009; Li and Wei, 2010; Rosés et al., 2010; Marrero and Rodríguez, 2013). Though many earlier studies relied on the same underlying theoretical and empirical frame- works used in the international analyses of income dy- namics, the spatial effects in convergence studies is now a central theme in the literature (Rey and Janikas, 2005; Fingleton and López-Bazo, 2006; Dall'erba and Le Gallo, 2008; Le Gallo and Kamarianakis, 2010).
Most exploratory data analysis methods focus on ei- ther longitudinal or cross-sectional datasets, which largely ignore the inseparability of space and time. The treat- ment of space-time effects in the comparative socio-

YE Xinyue et al. An Open Source Toolkit for Identifying Comparative Space-time Research Questions 3
economic analysis has only recently begun to receive attention (Bosch and Maloney, 2010; Rey and Ye, 2010; Ye, 2010; García et al., 2012; Tonts et al., 2012). At the same time, the findings are mixed and sometimes con-flicting for the same socioeconomic dynamics (Ye and Wei, 2005; Ye and Xie, 2012). This is because socio-economic process is a multi-dimensional and multi-scale phenomenon. However, most empirical studies are mo-tivated by only a few well defined research questions. Then the researcher chooses the appropriate analytical methods while also obtaining the data needed for appli-cation of the methods. Only at the end of the process does the analyst interpret and evaluate the results. Nev-ertheless, these traditional research methods and proce-dures tend not to be very useful in revealing patterns and trends in new, large, and complicated space-time dataset. In other words, the analyst has to get acquainted with the data before formulating novel questions, instead of test-ing the hypotheses without a full exploration of the dataset features. The process of ′getting acquainted with data′ is the basis of exploratory data analysis (EDA) (Andrienko and Andrienko, 2006; Anselin et al., 2006). EDA is a philosophy of conducting data analysis, which originates from Tukey′s seminal work (Tukey, 1977). As argued by Tukey, EDA is to analyze data for the purpose of interactively formulating hypotheses instead of test-ing hypotheses (Anselin et al., 2006). Exploratory space-time data analysis can reveal complex patterns and trend not identified otherwise, and it forms the basis for formulating novel research questions for space-time dataset. These tools have now nourished a vibrant re-search agenda-Geovisual Analytics focusing on the space- time dynamics (Andrienko et al., 2010; Andrienko et al., 2011; Anselin, 2012). Recent years has seen an explo-sion of such exploratory methods and software tools developed in diverse fields (Henriques et al., 2012; Rohde and Corcoran, 2012; Sadahiro, 2012; Templ et al., 2012; Traun and Loidl, 2012; Rey et al., 2013).
During the past several decades, burgeoning efforts have been witnessed on the development and imple-mentation of spatial analysis packages (Anselin and Getis, 1992; Rey and Anselin, 2006; Anselin, 2010; Anselin, 2012; Bivand, 2011). The pioneering spatial analysis toolbox SpaceStat was developed in the 1990s, implementing a set of spatial statistics routines (Anselin, 1991). SpaceStat relies on Environmental Systems Re-search Institute (ESRI)′s ArcView to manage data han-
dling and visualization. However, general GIS solutions typically lack support for rich interactions such as dy-namic linking and brushing, which are central to the exploratory process (Anselin, 2012). Therefore, tools emphasizing exploratory analysis are often standalone, demonstrated by the transition from SpaceStat to GeoDa (Anselin et al., 2006).
The history of open source movement is much younger, but its impact on GIS world is impressive (Rey, 2009; Shao et al., 2012; Steiniger and Hunter, 2013). As Rey (2009) comments, ′a tenet of the free software (open source) movement is that because source code is fundamental to the development of the field of computer science, having freely available source code is a necessity for the innovation and progress of the field′. The development of open source packages has been boosted. Steiniger and Hunter (2013) map the free and open source GIS of 2012, clearly depicting the current geospatial ecosystem for both business and research use. The Open Source Geospatial Foundation (OSGeo) pro-jects that support spatial data handling has a vibrate de-veloper community with extensive collaborative activi-ties, possibly due to the wide audience and public ado-pted Open Geospatial Consortium (OGC) standards. In comparison, spatial analysis can be quite flexible and is often discipline-specific and data-specific. Therefore, analysis routines are often written by domain scientists with specific scientific questions in hand (Bivand, 2011). The explosion of these routines is also contributed by the increasingly easier developing processes with pow-erful scripting language environments such as R and Python. However, many duplicates and gaps in the methodological development have also been witnessed.
Ye (2010) and Ye and Rey (2013) argue that the method duplicates and gaps exist due to the lack of sys-tematic exploration of space-time dataset. However, the definitions of the unit of analysis and the unit of obser-vation should be distinguished before the structure of the space-time dataset can be characterized. The unit of analysis is the major entity that is being analyzed in the research, while the unit of observation is the basic entity that the data is reported upon. The unit of analysis is the ′what′ that is being studied, which is designed by the researcher. However, the unit of observation is decided by the way the dataset was collected, which can not be fully controlled by the researcher. In most studies, the difference between the unit of analysis and the unit of

4 Chinese Geographical Science
observation is not emphasized. Although this has been an issue for some time, it is important to recognize the difference between the unit of analysis and the unit of observation in the framework for comparative space- time analysis. The main reason is that the unit of analy-sis involves the issues of scales and aggregation of data, which are very useful for designing data analysis tasks. Census data, for instance, serves as the unit of observa-tion for many socioeconomic studies. Census data may be aggregated into census enumeration districts (block, block group, census tract, place, county, Metropolitan Statistical Area, State, and so on), by postcode areas (Zip Code Tabulation areas), with considerable diffi-culty into other geographic subdivisions such as police beats or flood zones, or any other polygonal spatial par-tition. Various spatial partition schemes lead to different types of unit of analysis, which in turn generate different perspectives of looking at the same data. Hence, it is valuable to consider all possible perspectives before formulating research questions. At the same time, it is worth noticing that all possible temporal configurations should be considered. Monthly unemployment counts (the unit of observation), for instance, can be aggregated into quarterly or yearly periods. Many types of units of analysis can be generated when both spatial and tempo-ral partition schemes are considered. Unemployment issues, for instance, can be analyzed at the county level using monthly counts, or at the state level using yearly counts, or at the level of any other polygonal spatial par-tition with any other temporal partition.
Stimulated by open source geocomputation and geo-visualization, the researchers have developed a series of new statistics to integrate space and time in analyzing regional and urban systems (e.g., Ye and Carroll, 2011a; Ye and Carroll, 2011b; Wells et al., 2012; Ye and Shi, 2012; Ye and Xie, 2012; Ye and Rey, 2013). A more thorough and comprehensive open source toolkit is needed for developing generic research questions and tasks for space-time socioeconomic data. The authors have also been active in dissemination of new metrics for the broader research community by developing open source spatial analysis software to facilitate the dialogue among geographers, economists and policy-makers (Ye and Carroll, 2011a). These non-parametric methods examine the patterns and trends masked by macro sta- bilities in regional and urban systems, which have been implemented in two open source space-time analysis packages led by Rey and Anselin (2007): Space Time
Analysis of Regional Systems (STARS) and Python Spatial Analysis Library (PySAL). STARS is a package designed for the analysis of areal data measured over time (Rey and Janikas, 2006). PySAL is a library of spa-tial analysis functions (Rey and Anselin, 2007). The authors have been contributing a number of computa-tional geometry methods of space-time analysis and a series of new comparative statistics, and bringing them into a user-friendly graphical environment with an array of dynamically linked graphical views (Ye and Carroll, 2011a; Ye and Carroll, 2011b).
Local indicator of spatial association (LISA) is an in-dicator to examine local spatial dependence (Anselin, 1995). LISA Time Path extends this static spatial statis-tics to a temporal setting by plotting the pair-wise movement of a given variable of the focal unit (X coor-dinate) and its spatial lag (Y coordinate) over time (Rey et al., 2005; Rey and Ye, 2010). At a given time, each region can be identified with a position whose coordi-nates are defined above. Hence, each region has a direc-tional path connecting all the coordinates by temporal order. A variety of geometric properties can be summa-rized for each region′s LISA time path, since individual aspects of the same contemporaneous process can be dissected by interval gaps. When viewed in a compara-tive context, the geometry of the paths (the trajectory of LISA of specific economies) can illuminate aspects of various regional growth processes. Hence, the compari-son of LISA Time-Paths can reveal important insights as to socioeconomic dynamics across space and over time. The relative levels and pace of change of a region can be investigated and compared at the individual scale. That is, a particular region′s economic status fluctuates, or moves up/down relative to the national average. At the local scale, a focal economy might have a different velocity of development rate from its neighbors over time. This comparison provides important insights to the finer-scale aspects of stability and distinct directional movement within various regional income dynamics, because the convergence hypothesis is concerned with these distributions over time.
3 A Framework
3.1 Dimensions and scales for socioeconomic dy-namics and discrete space According to Waldo Tobler, everything is related to everything else, but near things are more related than

YE Xinyue et al. An Open Source Toolkit for Identifying Comparative Space-time Research Questions 5
distant things (Tobler, 1970). In addition to space, things near in time or near in statistical distribution should also be more related than distant things. Hence, the interde- pendence across space, time, and statistical distribution should be the rule rather than the exception. Ignoring these relationships leads to overlooking many possible interactions and dependence among space, time, and attributes. To reveal these relationships, the distributions of space, time, and attributes should be treated as the context in which a measurement is made, instead of specifying a single space and/or time as the context. The ′distribution′ of space (the dimension of space) refers to the spatial distribution of attributes while the ′distribu- tion′ of attributes (the dimension of statistical distribu- tion) implies the arrangement of attributes showing their observed or theoretical frequency of occurrence. In ad- dition, the ′distribution′ of time (the dimension of time) signifies the temporal trend of attributes.
Besides the dimensions, it is also important to recog- nize the issue of scales. Four scales are taken into con- sideration. The unit of analysis at the individual scale signifies the geographical location of an attribute (A1, Table 1), the temporal label of an attribute (A5, Table 1), or the rank of an attribute (A9, Table 1). The unit of analysis at the local scale explores a group of units which is formed by the focal observation and its neigh- boring observations in one of these three dimensions. A focal state and its neighboring states, for example, can be considered as a unit of analysis from the perspective of the spatial dimension (distribution) at the local scale (A2, Table 1). A focal year, the previous year, and the following year can be considered as a unit of analysis from the perspective of the temporal dimension at the local scale (A6, Table 1). A focal rank and the two im- mediate higher/lower ranks can be considered as a unit of analysis from the perspective of the statistical dimen-sion (distribution) at the local scale (A10, Table 1).
A meso-scale analysis studies a group of entities which shares similar features in spatial, temporal or sta-
tistical distributions. In other words, the local-scale analysis differs from the meso-scale analysis in the way how a subset of space-time data is retrieved for analysis. The former emphasizes that the rest of the subset are ′near things′ to the focal element while the latter does not have this constraint. Hence, the latter usually has a larger subset (larger in space and lengthier in time) as the unit of analysis than the former does. The spatial distribution of rich states, for example, can be consid-ered as a unit of analysis from the perspective of the spatial dimension (distribution) at the meso scale (A3, Table 1). All the years since a policy was implemented can be considered as a unit of analysis from the perspec-tive of the temporal dimension at the meso scale (A7, Table 1). An income quartile can be considered as a unit of analysis from the perspective of statistical dimension (distribution) at the meso scale (A11, Table 1). The analysis at the global scale examines the distributions of all the regions, times, or attributes. Spatial distribution of all the incomes, for example, can be considered as a unit of analysis from the perspective of the spatial di-mension (distribution) at the global scale (A4, Table 1); all the years can be considered as a unit of analysis based on the temporal dimension at the global scale be-cause the research of the space-time dynamics is very sensitive to the selected starting and ending years (A8, Table 1); the statistical distribution of all the incomes can be considered as a unit of analysis based on statisti-cal dimension (distribution) at the global scale (A12, Table 1). Limiting attention to only one of these dimen-sions or scales may result in a misguided or partial un-derstanding of the economic growth dynamics.
3.2 Dimensions and scales for human mobility and continuous space The fast methodological advancements in recent years call for a unified framework of time geography (Sui, 2012), and also a toolkit that help researchers to system-atically exploring the movement data from different
Table 1 Examples for unit of analysis (socioeconomic dynamics and discrete space)
Levels
Individual Local Meso Global
Spatial Ohio (A1)
Ohio and its neighboring states(A2)
Spatial distribution of rich states (A3)
Spatial distribution of all incomes (A4)
Temporal 2009 (A5)
2008, 2009 and 2010 (A6)
2000s (A7)
1929–2012 (study period) (A8)
Distributions
Statistical No.6 income
(A9) No. 5, 6, and 7 incomes
(A10) First income quartile
(A11) Statistical distribution of all incomes
(A12)
6 Chinese Geographical Science
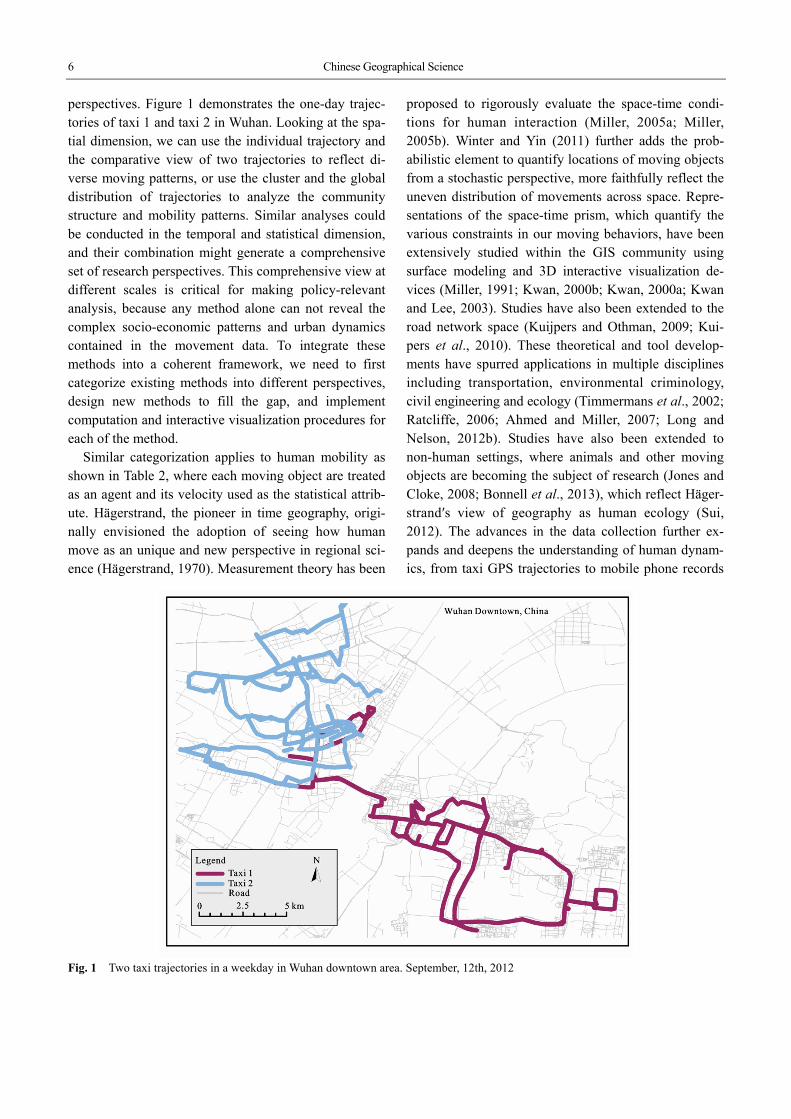
perspectives. Figure 1 demonstrates the one-day trajec-tories of taxi 1 and taxi 2 in Wuhan. Looking at the spa-tial dimension, we can use the individual trajectory and the comparative view of two trajectories to reflect di-verse moving patterns, or use the cluster and the global distribution of trajectories to analyze the community structure and mobility patterns. Similar analyses could be conducted in the temporal and statistical dimension, and their combination might generate a comprehensive set of research perspectives. This comprehensive view at different scales is critical for making policy-relevant analysis, because any method alone can not reveal the complex socio-economic patterns and urban dynamics contained in the movement data. To integrate these methods into a coherent framework, we need to first categorize existing methods into different perspectives, design new methods to fill the gap, and implement computation and interactive visualization procedures for each of the method.
Similar categorization applies to human mobility as shown in Table 2, where each moving object are treated as an agent and its velocity used as the statistical attrib-ute. Hägerstrand, the pioneer in time geography, origi-nally envisioned the adoption of seeing how human move as an unique and new perspective in regional sci-ence (Hägerstrand, 1970). Measurement theory has been
proposed to rigorously evaluate the space-time condi-tions for human interaction (Miller, 2005a; Miller, 2005b). Winter and Yin (2011) further adds the prob-abilistic element to quantify locations of moving objects from a stochastic perspective, more faithfully reflect the uneven distribution of movements across space. Repre-sentations of the space-time prism, which quantify the various constraints in our moving behaviors, have been extensively studied within the GIS community using surface modeling and 3D interactive visualization de-vices (Miller, 1991; Kwan, 2000b; Kwan, 2000a; Kwan and Lee, 2003). Studies have also been extended to the road network space (Kuijpers and Othman, 2009; Kui-pers et al., 2010). These theoretical and tool develop-ments have spurred applications in multiple disciplines including transportation, environmental criminology, civil engineering and ecology (Timmermans et al., 2002; Ratcliffe, 2006; Ahmed and Miller, 2007; Long and Nelson, 2012b). Studies have also been extended to non-human settings, where animals and other moving objects are becoming the subject of research (Jones and Cloke, 2008; Bonnell et al., 2013), which reflect Häger-strand′s view of geography as human ecology (Sui, 2012). The advances in the data collection further ex-pands and deepens the understanding of human dynam-ics, from taxi GPS trajectories to mobile phone records
Fig. 1 Two taxi trajectories in a weekday in Wuhan downtown area. September, 12th, 2012

YE Xinyue et al. An Open Source Toolkit for Identifying Comparative Space-time Research Questions 7
Table 2 Examples for unit of analysis (human mobility and continuous space)
Levels
Individual Local Meso Global
Spatial Agent I
(A1)
Agent I′s movement and move-ments of its neighboring agents
(A2)
Spatial distribution of fast movements
(A3)
Spatial distribution of all movements
(A4)
Temporal 12:00 (A5)
12:00, 13:00, 14:00 (A6)
Morning (A7)
Feb 1th to March 1th (study period)(A8)
Distributions
Statistical No. 3 velocity
(A9) No. 2, 3, and 4 velocities
(A10) First velocity quartile
(A11)
Statistical distribution of all movement velocities
(A12)
(Downs and Horner, 2012; Gao et al., 2013), from physical movements to virtual activities (Yu and Shaw, 2008; Shaw and Yu, 2009).
With huge amount of movement data readily avail-able, we can explore the interactions and patterns of moving objects across all possible scales, stimulating a range of new research questions. Movement of individ-ual spatial scale mostly concerns the construction of space-time prisms and choice set of individual′s activi-ties (Kuijpers et al., 2010, Chen and Kwan, 2012). At the local spatial scale, we can examine how a focal agent interacts with others (Winter and Raubal, 2006; Neutens et al., 2010), and answer questions such as an alibi query to test whether two moving objects have physically met (Kuijpers et al., 2011). Meso spatial scale analysis includes clustering and generalization of trajectories (Andrienko and Andrienko, 2011; Guo et al., 2012a; Murray et al., 2012). Spatial analysis at the global scale considers the overall spatial pattern, such as the social interaction potential in a city (Farber et al., 2012), or predictions of future movements (Song et al., 2010; Horner et al., 2012). Movement data are essen-tially longitudinal, so these studies can all be viewed from a temporal dimension. The statistical dimension has not been fully studied (Long and Nelson, 2012a).
Continuous space is largely explored by natural sci-ence disciplines such as hydrology, geophysics, ocean-ography, meteorology, and soil science (Corazza et al., 2012; Galanis et al., 2012; Guo et al., 2012b; Yang et al., 2012; Yue et al., 2012), where the attribute of inter-est are continuously measurable across the study area (O′Sullivan and Unwin, 2010). The categorization framework is also valuable for analysis of continuous space data. We categorized the articles published in the Journal-Stochastic Environmental Research and Risk Assessment (SERRA) in 2012, which focuses on sto-chastic approaches in environmental sciences and engi-neering applied to continuous space data. By identifying
the research focus, we can find the gaps and implement tools accordingly. Table 3 demonstrates the categoriza-tion of the research work published in SERRA (71 of them, excluding 12 articles on purely theoretical issues and one erratum).
Table 3 Classification of unit of analysis in research works published in Journal of Stochastic Environmental Research and Risk Assessment in 2012
Levels
Individual Local Meso Global
Spatial 37 5 6 38
Temporal 30 3 21 39 Distributions
Statistical 15 3 9 62
In the continuous space, a common task is to interpo-
late data in unsampled location, a main theme in geosta-tistics (Chun and Griffith, 2013). Techniques include semi-variogram, inverse distance weighting and Krig-ing, which are still being actively studied (Ankenman et al., 2010; Kerry et al., 2012; Zhang, 2012). A related analytic method is kernel density estimation (KDE). Different from interpolation, KDE generates estimates of a certain phenomenon across the continuous space from original counts recorded in the locations of occur-rence. KDE is often used as an exploratory tool in map-ping accessibility or risks (Spencer and Angeles, 2007; Cai et al., 2012). KDE has also been extended into net-work space to study traffic accidents (Xie and Yan, 2008; Sugihara et al., 2010; Loo et al., 2011).
Depending on the smallest functional unit being studied, research in continuous space can also be cate-gorized by the different spatial, temporal and statistical scales. For example, studies dedicated to study the properties of a single spatial entity can be categorized into individual spatial scale, such as studying the drift-ing pattern of a moving object in the ocean (Mínguez et al., 2012). Local-scale spatial analyses are normally

8 Chinese Geographical Science
seen in local regression analyses (Tutmez et al., 2012). Meso-scale spatial analyses concerns the partition of space into subspaces such as primary forest and secon-dary forest in (Funwi-Gabga and Mateu, 2012). Finally the global spatial scale analysis observes the pattern across the study area, examples include quantifying the spatial behaviors and intensity of fires in the whole study area (Juan et al., 2012). Similar categorization can be made in the temporal dimension. Statistical dimen-sion normally couples with the spatiotemporal pattern and depends on the specific statistical method used.
3.3 Task typology and workflow The total of 12 basic units of analysis can be conceptu-alized through combining three dimensions and four scales (Table 1). This view of a space-time dataset helps to describe patterns of socioeconomic activities such as geographical spillover occurring across scales. By iden-tifying the unit of analysis, a general task typology can build on top of Table 1. Three conceptual tables involve various possible research questions based on the com-bination of these 12 units of analysis (Tables 4, 5, and 6) (Ye and Rey 2013).
Table 4 Spatial-temporal research questions
Temporal Spatial
Individual Local Meso Global
Individ-ual
A1+A5 A1+A6 A1+A7 A1+A8
Local A2+A5 A2+A6 A2+A7 A2+A8
Meso A3+A5 A3+A6 A3+A7 A3+A8
Global A4+A5 A4+A6 A4+A7 A4+A8
Table 5 Statistical-temporal research questions
Temporal Statistical
Individual Local Meso Global
Individual A9+A5 A9+A6 A9+A7 A9+A8
Local A10+A5 A10+A6 A10+A7 A10+A8
Meso A11+A5 A11+A6 A11+A7 A11+A8
Global A12+A5 A12+A6 A12+A7 A12+A8
Table 6 Statistical-spatial research questions
Spatial Statistical
Individual Local Meso Global
Individual A9+A1 A9+A2 A9+A3 A9+A4
Local A10+A1 A10+A2 A10+A3 A10+A4
Meso A11+A1 A11+A2 A11+A3 A11+A4
Global A12+A1 A12+A2 A12+A3 A12+A4
A framework developed based on Tables 4–6 can be used to systematically design research questions re-garding patterns, trends, interactions, and relationships in space-time data. In other words, this work lead to a general task topology for socioeconomic data by inte-grating spatial, temporal, and statistical distributions at individual, local, meso, and global scales. One research question can thus engender many follow-up research questions. This framework allows the behavior of a dy-namic system to be reconstructed from a group of units of analysis. The key aspect of the work is to integrate the three dimensions of a space-time dataset in a four- scale environment. Spatial data analysis, temporal data analysis, and probability distribution analysis are three fundamental analytical methods for space-time dataset (Ye, 2010). Taxonomy of methods can then be built by combining any two methods at any two scales, which aims to address the tasks raised by the framework of research task.
This framework will enable the analyst to open-min-dedly explore the structure of the dataset and gain new insights. According to Shneiderman (1996), exploratory data analysis can be generalized as a three-step process: ′overview first, zoom and filter and then details-on- demand′. In the first step, an analyst must obtain an overview of the entire dataset, which is referred to as global-scale methods. In the second step, the analyst zooms in on the items of interest, which is referred as meso-scale methods. At the third stage, the analyst se-lects an item and/or its vicinity for examination of more details, which is referred as local-scale or individ-ual-scale methods. This process is iterative and the ana-lyst can frequently return to the previous steps. Based on Tables 4–6, 48 comparative research questions can be generated based on spatial-temporal task, temporal- statistical task, and statistical-spatial task. To address these 48 research questions, current methods will be surveyed and gaps will be highlighted and addressed. It is valuable to have a toolkit to fully explore the interac-tions among space, time, and attributes across scales on one hand, and to generate a systematic group of research questions which can guide the design of EDA on the other hand. A whole analytic workflow using the toolkit is demonstrated in Fig. 2, the exploratory process can be separated into four main steps:
(1) Data preparation and perspective suggestion. When the file IO operation takes place, the toolkit will analyze data characteristics such as data type and count,

YE Xinyue et al. An Open Source Toolkit for Identifying Comparative Space-time Research Questions 9
Fig. 2 Workflow
combined with user inputs specifying the spatial and temporal ranges as well as unit and related data seman-tics. Based on the data characteristics, the toolkit will display available perspectives providing users with a set of tools for certain types of analytic tasks.
(2) Tool selection. The researchers can now select a perspective, and choose a tool from the suggested tool-set. Descriptive information of the tool and suggested analytic procedure will be displayed in the GUI in a user-friendly way. The user then inputs the parameters and runs the method.
(3) Computation and visualization. The analytic en-vironment will be initialized for the selected tool. The computation will then take place, which invokes a set of computation primitives. After computation, different visualization primitive will be initialized and displayed.
(4) Interactive exploration. Researchers can now ex-plore the data through multiple linked map and plots, through which they can identify patterns and form re-search questions. After the process, they may continue the analytic process by refining the parameters, chang-ing a different tool, selecting a subset of data, or starting a different perspective.
4 Summary
Spatial turn in many socioeconomic theories has been noted in a vast field, encompassing both social and physical phenomena (Krugman, 1999; Goodchild et al., 2000; Goodchild, 2008; Goodchild and Janelle, 2010). The fast growth in socioeconomic dynamics analysis is increasingly seen as attributable to the availability of
panel datasets (Goodchild and Glennon, 2008; Elhorst, 2010). By contrast, spatial social scientists have been slower to adopt and implement new spatiotemporally explicit methods of data analysis due to the lack of ex-tensible software packages, which becomes a major im-pediment to promote spatiotemporal thinking. The cur-rent research implements the new methodological ad-vances in an open source environment for exploring space-time socioeconomic data, which lend support to the notion that space and time can not be meaningfully separated. This research interfaces the open source revolution and socioeconomic analysis, which is among the burgeoning efforts seeking the cross-fertilization between the two fast-growing communities. As Rey (2009) suggests, ′increased adoption of open source practices in spatial analysis can enhance the develop-ment of the next generation of tools and the wider prac-tice of scientific research and education′. This open source work procedure can facilitate the interdiscipli-nary research due to ′the collaborative norms involving positive spillover effects in building a community of scholars′ (Rey 2009). The methods are built in open source environments and thus easily extensible and cus-tomizable (Lewis, 2012). Hence, this research can pro-mote collaboration among researchers who want to im-prove current functions or add extensions to address specific research questions in regional studies.
A unique feature of this research is that it utilizes the notion of unit of analysis to identify research questions and methodological gaps/opportunities. The proposed research can greatly enhance our ability to explore and compare the potential interactions among space, time, and attributes across scales and dimensions. The interac-tive spatial data analysis has motivated, if not directly provoked, new queries that are worthy of additional re-search. The framework of comparative space-time analysis enables access to a much wider thinking which addresses the role of dimensions and scales at different stages of socioeconomic dynamics for more in-depth study. In other words, the current work is mainly from an exploratory perspective, which can motivate geogra-phers and social scientists to design a series of tasks and formulate new hypotheses from theoretical and policy perspectives. This space-time work provides an impor-tant contribution to the current spatial science and spa-tial humanities literature, which lacks a framework of asking comparative space-time questions. Although this comparative framework arose in the analysis of regional
10 Chinese Geographical Science
income dynamics, it can also be applied to a wide set of socioeconomic processes with geo-referenced data measured over time.
Space-time variations of socioeconomic dynamics are highly topical subjects for intellectual inquiry and have long been the focus of policy initiatives (Anselin, 2010; Wu et al., 2013). This paper notes that the multi-scale and multi-dimension methods can expose some hidden patterns and trends that otherwise would be very diffi-cult to detect. This research presents a general frame-work for pattern discovery and hypothesis exploration in space-time datasets. On this basis, this framework and specific domain could benefit from each other in the following procedures: First, the analyst has the specific reason for investigating distinct socioeconomic issues, which can be expressed as a general question or a set of general questions. Second, this nature of the investiga-tion is checked against the task topology of the dataset. Third, the analyst carries out the matched tasks and de-tects something both interesting and relevant to this in-vestigation. Fourth, new, more specific questions might appear, motivating the analyst to look for more details. These questions affect what details will be viewed and in what ways. Lastly, the general questions in step 1 are revised and the investigator goes through the procedures again. The open source environment offers a straight-forward way of benefiting wider community (Rey, 2009). As such, explanations of various socioeconomic dynamics can be provided based on rigorous analysis, and policy interventions are then proposed in light of the understanding of the space-time dataset, which will open up a rich empirical context for the social sciences (Ye and Wei, 2012).
References
Ahmed N, Miller H J, 2007. Time-space transformations of geographic space for exploring, analyzing and visualizing transportation systems. Journal of Transport Geography, 15(1): 2–17. doi: 10.1016/j.jtrangeo.2005.11.004
Andrienko G, Andrienko N, Demsar U et al., 2010. Space, time and visual analytics. International Journal of Geographical Information Science, 24(10): 1577–1600. doi: 10.1080/ 13658816.2010.508043
Andrienko G, Andrienko N, Keim D et al., 2011. Editorial: Challenging problems of geospatial visual analytics. Journal of Visual Languages and Computing, 22(4): 251–256. doi: 10.1016/j.jvlc.2011.04.001
Andrienko N, Andrienko G, 2006. Exploratory Analysis of Spatial
and Temporal Data. Germany: Springer Berlin. Andrienko N, Andrienko G, 2011. Spatial generalization and agg-
regation of massive movement data. Visualization and Com-puter Graphics, IEEE Transactions on, 17(2): 205–219. doi: 10.1109/TVCG.2010.44
Ankenman B, Nelson B L, Staum J, 2010. Stochastic kriging for simulation metamodeling. Operations Research, 58(2): 371– 382. doi: 10.1287/opre.1090.0754
Anselin L, 1991. SpaceStat, a Software Program for Analysis of Spatial Data. Santa Barbara: National Center for Geographic Information and Analysis (NCGIA), University of California, Technical report.
Anselin L, 1995. Local indicators of spatial association—LISA. Geographical Analysis, 27(2): 93–115. doi: 10.1111/j.1538– 4632.1995.tb00338.x
Anselin L, 2010. Thirty years of spatial econometrics. Papers in Regional Science, 89(1): 3–25. doi: 10.1111/j.1435-5957.2010. 00279.x
Anselin L, 2012. From spacestat to cyberGIS: Twenty years of spatial data analysis software. International Regional Science Review, 35(2): 131–157. doi: 10.1177/0160017612438615
Anselin L, Getis A, 1992. Spatial statistical analysis and geo-graphic information systems. The Annals of Regional Science, 26(1): 19–33. doi: 10.1007/BF01581478
Anselin L, Rey S J, 2012. Spatial econometrics in an age of CyberGIScience. International Journal of Geographical Infor-mation Science, 26(12): 2211–2226. doi: 10.1080/13658816. 2012.664276
Anselin L, Syabri I, Kho Y, 2006. GeoDa: An introduction to spatial data analysis. Geographical Analysis, 38(1): 5–22. doi: 10.1111/j.0016-7363.2005.00671.x
Barro R J, Sala-I-Martin X, Blanchard O J et al., 1991. Conver-gence across states and regions. Brookings Papers on Econo-mic Activity: 107–182.
Batty M, 2005. Approaches to modeling in GIS: Spatial repre-sentation and temporal dynamics. GIS, Spatial Analysis, and Modeling. ESRI Press, 41–61.
Bivand R, 2011. Geocomputation and open source software: com-ponents and software stacks. NHH Deptment of Economics Discussion Paper.
Bonnell T R, Dutilleul P, Chapman C A et al., 2013. Analysing small-scale aggregation in animal visits in space and time: The ST-BBD method. Animal Behaviour, 85(2): 483–492. doi: 10.1016/j.anbehav.2012.12.014
Bosch M, Maloney W F, 2010. Comparative analysis of labor market dynamics using Markov processes: An application to informality. Labour Economics, 17(4): 621–631. doi: 10.1016/ j.labeco.2010.01.005
Cai Q, Rushton G, Bhaduri B, 2012. Validation tests of an improved kernel density estimation method for identifying disease clusters. Journal of Geographical Systems, 14(3): 243– 264. doi: 10.1007/s10109-010-0146-0
Chen J, Fleisher B M, 1996. Regional income inequality and economic growth in China. Journal of Comparative Econo-mics, 22(2): 141–164. doi: 10.1006/jcec.1996.0015

YE Xinyue et al. An Open Source Toolkit for Identifying Comparative Space-time Research Questions 11
Chen X, Kwan M P, 2012. Choice set formation with multiple flexible activities under space–time constraints. International Journal of Geographical Information Science, 26(5): 941–961. doi: 10.1080/13658816.2011.624520
Chun Y, Griffith D A, 2013. Methods for spatial interpolation in two dimensions. Spatial Statistics and Geostatistics. SAGE Publications Ltd, 127–148.
Corazza M, Abrão T, Lepri F et al., 2012. Monte Carlo method applied to modeling copper transport in river sediments. Stochastic Environmental Research and Risk Assessment, 26(8): 1063–1079. doi: 10.1007/s00477-012-0564-2
Dall'erba S, Le Gallo J, 2008. Regional convergence and the impact of European structural funds over 1989–1999: A spatial econometric analysis. Papers in Regional Science, 87(2): 219–244. doi: 10.1111/j.1435-5957.2008.00184.x
Downs J A, Horner M W, 2012. Probabilistic potential path trees for visualizing and analyzing vehicle tracking data. Journal of Transport Geography, 23: 72–80. doi: 10.1016/j.jtrangeo. 2012.03.017
Elhorst J P, 2010. Spatial panel data models. In: Fischer M M et al. (eds.). Handbook of Applied Spatial Analysis. Germany: Springer Berlin Heidelberg, 377–407.
Ezcurra R, 2007. Is income inequality harmful for regional growth? evidence from the European Union. Urban Studies, 44(10): 1953–1971. doi: 10.1080/00420980701471877
Farber S, Neutens T, Miller H J et al, 2012. The social interaction potential of metropolitan regions: A time-geographic measure-ment approach using joint accessibility. Annals of the Associa-tion of American Geographers, 103(3): 483–504. doi: 10.1080/ 00045608.2012.689238
Fingleton B, López-Bazo E, 2006. Empirical growth models with spatial effects. Papers in Regional Science, 85(2): 177–198. doi: 10.1111/j.1435-5957.2006.00074.x
Funwi-Gabga N, Mateu J, 2012. Understanding the nesting spatial behaviour of gorillas in the Kagwene Sanctuary, Cam-eroon. Stochastic Environmental Research and Risk Assess-ment, 26(6): 793–811. doi: 10.1007/s00477-011-0541-1
Galanis G, Chu P, Kallos G et al., 2012. Wave height charac-teristics in the north Atlantic ocean: A new approach based on statistical and geometrical techniques. Stochastic Environ-mental Research and Risk Assessment, 26(1): 83–103. doi: 10.1007/s00477-011-0540-2
Gao S, Liu Y, Wang Y et al., 2013. Discovering spatial interaction communities from mobile phone data. Transactions in GIS, 17(3): 463–481. doi: 10.1111/tgis.12042
García A M, Santé I, Boullón M et al., 2012. A comparative analysis of cellular automata models for simulation of small urban areas in Galicia, NW Spain. Computers, Environment and Urban Systems, 36(4): 291–301. doi: 10.1016/ j.compenvurbsys.2012.01.001
Getis A, Mur J, Zoller H G et al., 2004. Spatial Econometrics and Spatial Statistics. Hampshire: Palgrave Macmillan.
Goodchild M F, Janelle D, 2010. Toward critical spatial thinking in the social sciences and humanities. GeoJournal, 75(1): 3– 13. doi: 10.1007/s10708-010-9340-3
Goodchild M F, 2008. Geographic information science: The grand challenges. In: Wilson J et al. (eds.). The Handbook of Geo-graphic Information Science. Malden: Blackwell Publishing Ltd, 596–608.
Goodchild M F, Anselin L, Appelbaum R P et al., 2000. Toward spatially integrated social science. International Regional Science Review, 23(2): 139–159. doi: 10.1177/01600176000 2300201
Goodchild M F, Glennon A, 2008. Representation and compu-tation of geographic dynamics. In: Hornsby K S et al. (eds.). Understanding Dynamics of Geographic Domains. Boca Raton: CRC Press, 13–30.
Gui Z, Yang C, Xia J et al., 2012. A performance, semantic and service quality-enhanced distributed search engine for improv-ing geospatial resource discovery. International Journal of Geographical Information Science, 27(6): 1109–1132. doi: 10.1080/13658816.2012.739692
Guo D, Zhu X, Jin H et al., 2012a. Discovering spatial patterns in origin-destination mobility data. Transactions in GIS, 16(3): 411–429. doi: 10.1111/j.1467-9671.2012.01344.x
Guo J, Chen H, Xu C Y et al., 2012b. Prediction of variability of precipitation in the Yangtze River Basin under the climate change conditions based on automated statistical downscaling. Stochastic Environmental Research and Risk Assessment, 26(2): 157–176. doi: 10.1007/s00477-011-0464-x
Hägerstrand T, 1970. What about people in regional science? Papers of the Regional Science Association, 24(1): 6–21. doi: 10.1007/BF01936872
Henriques R, Bacao F, Lobo V, 2012. Exploratory geospatial data analysis using the GeoSOM suite. Computers, Environment and Urban Systems, 36(3): 218–232. doi: 10.1016/j. compenvurbsys.2011.11.003
Horner M W, Zook B, Downs J A, 2012. Where were you? Deve-lopment of a time-geographic approach for activity destination re-construction. Computers, Environment and Urban Systems, 36(6): 488–499. doi: 10.1016/j.compenvurbsys.2012.06.002
Jones O, Cloke P, 2008. Non-human agencies: Trees in place and time. In: Malafouris L et al. (eds.). Material Agency. Springer US, 79–96.
Juan P, Mateu J, Saez M, 2012. Pinpointing spatio-temporal in-teractions in wildfire patterns. Stochastic Environmental Re-search and Risk Assessment, 26(8): 1131–1150. doi: 10.1007/ s00477-012-0568-y
Kerry R, Goovaerts P, Rawlins B G et al., 2012. Disaggregation of legacy soil data using area to point kriging for mapping soil organic carbon at the regional scale. Geoderma, 170: 347–358. doi: 10.1016/j.geoderma.2011.10.007
Krugman P, 1999. The role of geography in development. International Regional Science Review, 22(2): 142–161. doi: 10.1177/016001799761012307
Kuijpers B, Grimson R, Othman W, 2011. An analytic solution to the alibi query in the space–time prisms model for moving object data. International Journal of Geographical Informa-tion Science, 25(2): 293–322. doi: 10.1080/13658810902967397
Kuijpers B, Miller H J, Neutens T et al., 2010. Anchor uncer-

12 Chinese Geographical Science
tainty and space-time prisms on road networks. International Journal of Geographical Information Science, 24(8): 1223– 1248. doi: 10.1080/13658810903321339
Kuijpers B, Othman W, 2009. Modeling uncertainty of moving objects on road networks via space-time prisms. International Journal of Geographical Information Science, 23(9): 1095– 1117. doi: 10.1080/13658810802097485
Kwan M P, 2000a. Human extensibility and individual hybrid- accessibility in space-time: A multi-scale representation using GIS. In: Janelle D et al. (eds.). Information, Place, and Cy-berspace. Springer Berlin Heidelberg, 241–256.
Kwan M P, 2000b. Interactive geovisualization of activity-travel patterns using three-dimensional geographical information systems: A methodological exploration with a large data set. Transportation Research Part C: Emerging Technologies, 8(1– 6): 185–203. doi: 10.1016/S0968-090X(00)00017-6
Kwan M P, Lee J, 2003. Geovisualization of human activity patterns using 3D GIS: A time-geographic approach. In: Goodchild M et al. (eds.). Spatially Integrated Social Science: Examples in Best Practice. Oxford: Oxford University Press.
Le Gallo J, Ertur C, 2003. Exploratory spatial data analysis of the distribution of regional per capita GDP in Europe, 1980−1995. Papers in Regional Science, 82(2): 175–201. doi: 10.1007/ s101100300145
Le Gallo J, Kamarianakis Y, 2010. The evolution of regional productivity disparities in the European Union from 1975 to 2002: A combination of shift-share and spatial econometrics. Regional Studies, 45(1): 123–139. doi: 10.1080/0034340090 3234662
Lesage J, Pace R K, 2009. Introduction to Spatial Econometrics. Boca Raton, FL: CRC Press Taylor & Francis Group.
Levy A, Chowdhury K, 1995. A geographical decomposition of intercountry income inequality. Comparative Economic Studies, 37(4): 1–17. doi: 10.1057/ces.1995.38
Lewis B, 2012. Open Source GIS. Available at: http://opensourcegis. org
Li Y, Wei Y H D, 2010. The spatial-temporal hierarchy of regional inequality of China. Applied Geography, 30(3): 303– 316. doi: 10.1016/j.apgeog.2009.11.001
Long J A, Nelson T A, 2012a. A review of quantitative methods for movement data. International Journal of Geographical Information Science, 27(2): 292–318. doi: 10.1080/13658816. 2012.682578
Long J A, Nelson T A, 2012b. Time geography and wildlife home range delineation. The Journal of Wildlife Management, 76(2): 407–413. doi: 10.1002/jwmg.259
Loo B P Y, Shenjun Y, Jianping W, 2011. Spatial point analysis of road crashes in Shanghai: A GIS-based network kernel density method. Geoinformatics, 2011 19th International Conference on, 1–6.
Mínguez R, Abascal A J, Castanedo S et al., 2012. Stochastic Lagrangian trajectory model for drifting objects in the ocean. Stochastic Environmental Research and Risk Assessment, 26(8): 1081–1093. doi: 10.1007/s00477-011-0548-7
Marrero G A, Rodríguez J G, 2013. Inequality of opportunity and
growth. Journal of Development Economics, 104(0): 107–122. doi: 10.1016/j.jdeveco.2013.05.004
Mennis J, Guo D, 2009. Spatial data mining and geographic knowledge discovery—An introduction. Computers, Environ-ment and Urban Systems, 33(6): 403–408. doi: 10.1016/j. compenvurbsys.2009.11.001
Miller H J, 1991. Modelling accessibility using space-time prism concepts within geographical information systems. Interna-tional Journal of Geographical Information Systems, 5(3): 287–301. doi: 10.1080/02693799108927856
Miller H J, 2005a. A Measurement Theory for Time Geography. Geographical Analysis, 37(1): 17–45. doi: 10.1111/j.1538- 4632.2005.00575.x
Miller H J, 2005b. Necessary space-time conditions for human interaction. Environment and Planning B: Planning and Design, 32(3): 381–401.
Miller H J, Wentz E A, 2003. Representation and spatial analysis in Geographic Information Systems. Annals of the Association of American Geographers, 93(3): 574–594. doi: 10.1111/1467- 8306.9303004
Moulaert F, Mehmood A, 2009. Analysing regional development and policy: A structural-realist approach. Regional Studies, 44(1): 103–118. doi: 10.1080/00343400802251478
Murray A, Liu Y, Rey S et al., 2012. Exploring movement object patterns. The Annals of Regional Science, 49(2): 471–484. doi: 10.1007/s00168-011-0459-z
Neutens T, Schwanen T, Miller H J, 2010. Dealing with timing and synchronization in opportunities for joint activity partici-pation. Geographical Analysis, 42(3): 245–266. doi: 10.1111/ j.1538-4632.2010.00792.x
O'sullivan D, Unwin D J, 2010. Describing and analyzing fields. Geographic Information Analysis. John Wiley & Sons, Inc., 239–276.
Ratcliffe J H, 2006. A temporal constraint theory to explain opportunity-based spatial offending patterns. Journal of Res-earch in Crime and Delinquency, 43(3): 261–291. doi: 10.1177/0022427806286566
Rey S J, Ye X Y, 2010. Comparative spatial dynamics of regional systems. In: Páez A et al. (eds.). Progress in Spatial Analysis. Germany: Springer Berlin Heidelberg, 441–463.
Rey S J, 2009. Show me the code: Spatial analysis and open source. Journal of Geographical Systems, 11(2): 191–207. doi: 10.1007/s10109-009-0086-8
Rey S J, Anselin L, 2006. Recent advances in software for spatial analysis in the social sciences. Geographical Analysis, 38(1): 1–4. doi: 10.1111/j.0016-7363.2005.00670.x
Rey S J, Anselin L, 2007. PySAL: A python library of spatial analytical methods. The Review of Regional Studies, 37.
Rey S J, Anselin L, Pahle R et al., 2013. Parallel optimal choropleth map classification in PySAL. International Journal of Geographical Information Science, 27(5): 1023–1039. doi: 10.1080/13658816.2012.752094
Rey S J, Janikas M V, 2005. Regional convergence, inequality, and space. Journal of Economic Geography, 5(2): 155–176. doi: 10.1093/jnlecg/lbh044

YE Xinyue et al. An Open Source Toolkit for Identifying Comparative Space-time Research Questions 13
Rey S J, Janikas M V, 2006. STARS: Space-time analysis of regional systems. Geographical Analysis, 38(1): 67–86. doi: 10.1111/j.0016-7363.2005.00675.x
Rey S J, Janikas M V, Smirnov O, 2005. Exploratory geovi-sualization of spatial dynamics. Geocomputation 2005 Procee-dings, Michigan.
Rohde D, Corcoran J, 2012. Graphical tools for conditional probabilistic exploration of multivariate spatial datasets. Computers, Environment and Urban Systems, 36(5): 359–370. doi: 10.1016/j.compenvurbsys.2012.03.003
Rosés J R, Martínez-Galarraga J, Tirado D A, 2010. The upswing of regional income inequality in Spain (1860–1930). Explora-tions in Economic History, 47(2): 244–257. doi: 10.1016/j.eeh. 2010.01.002
Sadahiro Y, 2012. Exploratory analysis of polygons distributed with overlap. Geographical Analysis, 44(4): 350–367. doi: 10.1111/j.1538-4632.2012.00857.x
Shao J, Kuk G, Anand S et al., 2012. Mapping collaboration in open source geospatial ecosystem. Transactions in GIS, 16(4): 581–597. doi: 10.1111/j.1467-9671.2012.01305.x
Shaw S L, Yu H, 2009. A GIS-based time-geographic approach of studying individual activities and interactions in a hybrid phy-sical–virtual space. Journal of Transport Geography, 17(2): 141–149. doi: 10.1016/j.jtrangeo.2008.11.012
Shneiderman B, 1996. The eyes have it: a task by data type taxonomy for information visualizations. Proceedings of the 1996 IEEE Symposium on Visual Languages, Piscataway, 336–343.
Song C, Qu Z, Blumm N et al., 2010. Limits of predictability in human mobility. Science, 327(5968): 1018–1021. doi: 10.1126/ science.1177170
Spencer J, Angeles G, 2007. Kernel density estimation as a technique for assessing availability of health services in Nicaragua. Health Services and Outcomes Research Metho-dology, 7(3–4): 145–157. doi: 10.1007/s10742-007-0022-7
Steiniger S, Hunter A J S, 2013. The 2012 free and open source GIS software map–A guide to facilitate research, development, and adoption. Computers, Environment and Urban Systems, 39(0): 136–150. doi: 10.1016/j.compenvurbsys.2012.10.003
Sugihara K, Satoh T, Okabe A, 2010. Simple and unbiased kernel function for network analysis. 10th International Symposium on Communications and Information Technologies. Meiji Uni-versity, Japan, 827–832.
Sui D, 2012. Looking through Hägerstrand′s dual vistas: Towards a unifying framework for time geography. Journal of Trans-port Geography, 23(0): 5–16. doi: 10.1016/j.jtrangeo.2012.03. 020
Templ M, Hulliger B, Kowarik A et al., 2012. Combining geographical information and traditional plots: The checker-plot. International Journal of Geographical Information Science, 27(4): 685–698. doi: 10.1080/13658816.2012.684386
Timmermans H, Arentze T, Joh C H, 2002. Analysing space-time behaviour: New approaches to old problems. Progress in Human Geography, 26(2): 175–190. doi: 10.1191/0309132502 ph363ra
Tobler W R, 1970. A computer movie simulating urban growth in the Detroit Region. Economic Geography, 46: 234–240. doi: 10.2307/143141
Tonts M, Plummer P, Lawrie M, 2012. Socio-economic wellbeing in Australian mining towns: A comparative analysis. Journal of Rural Studies, 28(3): 288–301. doi: 10.1016/j.jrurstud.2011. 10.006
Traun C, Loidl M, 2012. Autocorrelation-based regioclassifica-tion: A self-calibrating classification approach for choropleth maps explicitly considering spatial autocorrelation. Interna-tional Journal of Geographical Information Science, 26(5): 923–939. doi: 10.1080/13658816.2011.614246
Tselios V, 2009. Growth and convergence in income per capita and income inequality in the regions of the EU. Spatial Economic Analysis, 4(3): 343–370. doi: 10.1080/1742177090 3114711
Tukey J W, 1977. Exploratory Data Analysis. MA: Addison- Wesley.
Tutmez B, Kaymak U, Tercan A E, 2012. Local spatial regression models: A comparative analysis on soil contamination. Stochastic Environmental Research and Risk Assessment, 26(7): 1013–1023. doi: 10.1007/s00477-011-0532-2
Vasquez K G, 2011. A pluralist alternative: Mexican women, migration, and regional development. American Journal of Economics and Sociology, 70(3): 671–698. doi: 10.1111/j. 1536-7150.2011.00788.x
Wang F, 2005. Job access and homicide patterns in Chicago: An analysis at multiple geographic levels based on scale-space theory. Journal of Quantitative Criminology, 21(2): 195–217. doi: 10.1007/s10940-005-2492-5
Wang F, Arnold M T, 2008. Localized income inequality, concentrated disadvantage and homicide. Applied Geography, 28(4): 259–270. doi: 10.1016/j.apgeog.2008.07.004
Wei Y D, 2013. Regional Development in China: States, Globalization and Inequality. Taylor & Francis.
Wei Y H D and Liefner I, 2012. Globalization, industrial restructuring, and regional development in China. Applied Geography, 32(1): 102–105. doi: 10.1016/j.apgeog.2011.02. 005
Wells W, Wu L, Ye X Y, 2012. Patterns of near-repeat gun assaults in Houston. Journal of Research in Crime and Delinquency, 49(2): 186–212. doi: 10.1177/0022427810397946
Winter S, Raubal M, 2006. Time geography for Ad Hoc dhared-tide trip planning. Mobile Data Management, 2006. MDM 2006. 7th International Conference on.
Winter S, Yin Z C, 2011. The elements of probabilistic time geography. GeoInformatica, 15(3): 417–434. doi: 10.1007/ s10707-010-0108-1
Wu K Y, Ye X Y, Qi Z F et al., 2013. Impacts of land use/land cover change and socioeconomic development on regional ecosystem services: The case of fast-growing Hangzhou me-tropolitan area, China. Cities, 31: 276–284. doi: 10.1016/ j.cities.2012.08.003
Xie Z, Yan J, 2008. Kernel density estimation of traffic accidents in a network space. Computers, Environment and Urban Sys-

14 Chinese Geographical Science
tems, 32(5): 396–406. doi: 10.1016/j.compenvurbsys.2008.05. 001
Yang C, Raskin R, Goodchild M et al., 2010. Geospatial cyberin-frastructure: Past, present and future. Computers, Environment and Urban Systems, 34(4): 264–277. doi: 10.1016/j. compenvurbsys. 2010.04.001
Yang T, Xu C Y, Zhang Q et al., 2012. DEM-based numerical modelling of runoff and soil erosion processes in the hilly– gully loess regions. Stochastic Environmental Research and Risk Assessment, 26(4): 581–597. doi: 10.1007/s00477-011- 0515-3
Ye X Y, 2010. Comparative Space Time Dynamics. University of California, Santa Barbara and San Diego State University.
Ye X Y, Carroll M C, 2011a. Exploratory space-time analysis of local economic development. Applied Geography, 31(3): 1049–1058. doi: 10.1016/j.apgeog.2011.02.003
Ye X Y, Carroll M C, 2011b. The warn notice toolbox: Open- source geovisualization of large layoff events data. 19th Inter-national Conference on Geoinformatics, Shanghai: 1–4.
Ye X and Liu L, 2012. Special issue on spatial crime analysis and modeling. Annals of GIS, 18(3): 157–241. doi: 10.1080/ 19475683.2012.693342
Ye X Y, Rey S J, 2013. A framework for exploratory space-time analysis of economic data. The Annals of Regional Science, 50(1): 315–339. doi: 10.1007/s00168-011-0470-4
Ye X Y, Shi X, 2012. Pursuing spatiotemporally integrated social science over cyberinfrastructure. GIScience 2012 Proceedings,
Ohio. Ye X Y, Wei Y D, 2005. Geospatial analysis of regional develo-
pment in China: The case of Zhejiang Province and the Wenzhou Model. Eurasian Geography and Economics, 46(6): 445–464. doi: 10.2747/1538-7216.46.6.445
Ye X Y, Wei Y H D, 2012. Special issues on globalization, regional development and public policy in Asia. Regional Sci-ence Policy & Practice, 4(3): 179–333. doi: 10.1111/j.1757- 7802.2012.01067.x
Ye X Y, Xie Y C, 2012. Re-examination of Zipf′s law and urban dynamic in China: A regional approach. The Annals of Reg-ional Science, 49(1): 135–156. doi: 10.1007/s00168-011-0442-8
Yeung H W C, 2009. Regional development and the competitive dynamics of global production networks: An East Asian perspective. Regional Studies, 43(3): 325–351. doi: 10.1080/ 00343400902777059
Yu H, Shaw S L, 2008. Exploring potential human activities in physical and virtual spaces: A spatiotemporal GIS approach. International Journal of Geographical Information Science, 22(4): 409–430. doi: 10.1080/13658810701427569
Yue W, Liu Y, Fan P et al., 2012. Assessing spatial pattern of urban thermal environment in Shanghai, China. Stochastic Environmental Research and Risk Assessment, 26(7): 899–911. doi: 10.1007/s00477-012-0638-1
Zhang Z, 2012. Iterative posterior inference for Bayesian Kriging. Stochastic Environmental Research and Risk Assessment, 26(7): 913–923. doi: 10.1007/s00477-011-0544-y