an open source architecture of a wireless body area...
TRANSCRIPT
An Open Source Architecture of a Wireless Body Area Network in a Medical
Environment
George Kokkonis,
Department of Applied
Informatics, University of
Macedonia, Thessaloniki,
Greece
Sotirios Kontogiannis,
Dept. of Informatics and
Telecommunications Eng.,
University of West
Macedonia, Kozani, Greece
Dimitrios Tomtsis
Department of Business
Administration, Technological
Educational Institute of West
Macedonia, Grevena, Greece
ABSTRACT
This contribution describes the design and
implementation of a novel Wireless Body Area
Network system for healthcare monitoring, the
architecture of which is based on commercially
available and cost-effective hardware components,
open-source software and a remote data repository for
storage. In particular, the system utilizes a number of
wearable medical sensors to measure different patient
bio-signals which are all collected to a wearable
microcomputer station. Medical sensor measurements
are then categorized based on the criticality of the
measurement and transmitted to a remote station. This
long-range transmission is supported by a new network
adaptive protocol designed to mainly transmit real-time
medical data. In a prototype system, tests based on real-
time and close to real-time transmission architectures
have so far yielded favorable results in comparison to
other existing protocols.
KEYWORDS
Medical sensors, monitoring protocols, Wearable
Health Monitoring Systems, Body Area Networks.
1 INTRODUCTION
One of the most promising application domains of
medical monitoring systems is the Wireless Body
Area Network (WBAN), an emerging and
promising health monitoring technology which
promotes treatment of the specific and individual
needs of each patient separately. A WBAN in a
medical environment may consist of multiple
wearable sensor nodes, strategically placed on the
human body, which are capable of measuring and
reporting the user’s physiological state. The sensor
nodes are designed as embedded or stand-alone
devices which differ on the sensor type, size and
weight. In general, each sensor node enables
periodic or continuous sensing, sampling and bio-
signal processing, while wirelessly transmitting
one or more physiological signals (such as heart
rate, blood pressure, body and skin temperature,
oxygen saturation, respiration rate and
electrocardiogram), but depending on the
application, may also determine the user’s
location, state or physical activity.
In many cases, the obtained measurements are
transmitted over a short distance via custom-made
or industry standard wireless protocols to a small
in size central node, such as a Personal Digital
Assistant (PDA) or a microcontroller board, worn
on the body or placed at an accessible location.
Existing monitoring systems use the short-range
wireless systems such as ZigBee (IEEE 802.15.4),
WLANs, GSM and Bluetooth (IEEE 802.15.1).
The central node may display the information on a
user interface or transmit the collected vital signs
to a remote medical center for diagnostic purposes
by incorporating another wireless network for
long-range transmission.
In this way, WBAN systems offer to the patient
freedom of movement and assisted monitoring in
selected living environments and also provide
minimal feedback to help maintain an optimal
health status. It is evident from the above, that a
WBAN system may encompass a wide variety of
components and advanced algorithms for data
extraction, communication, storage and decision
International Journal of Digital Information and Wireless Communications (IJDIWC) 6(2): 63-77The Society of Digital Information and Wireless Communications, 2016 ISSN: 2225-658X (Online); ISSN 2412-6551 (Print)
63

support making, which when integrated all
together, may suggest the usage of cloud
computing as a potential technology.
Cloud computing can be described as an on-
demand service model which is often based on
virtualization and distributed computing
technologies to provide information delivery and
consumption where applications and information
are accessed from a web browser while software
and data are stored on web servers [1, 2]. Cloud
components communicate and exchange data with
one another using service-oriented architectures
(SOA), as well as web services which allow self-
contained business processes to operate over the
internet [3]. The incorporation of cloud
capabilities in medical applications means that
medical data can be stored in a virtual archive,
accessed and shared by healthcare providers and
medical personnel when and as needed. The
development of private cloud based services for
health-care minimizes the limitations of traditional
medical systems such as small physical storage,
security and privacy, limited availability,
processing limitations and lack of responsiveness.
This contribution describes the design and
implementation of a novel WBAN system for
healthcare monitoring, the architecture of which is
based on low-cost off the shelf sensors and
computing components, open-source software and
a private repository for data storage in order to
provide an economical solution to personalized
health care monitoring problems, while retaining
all the functionality and flexibility of more
expensive systems. In particular, the system
utilizes a number of wearable medical sensors to
measure different patient bio-signals which are all
collected to a wearable central microcomputer
station. Medical sensor measurements are then
categorized based on the criticality of the
measurement and transmitted to a remote station.
This long-range transmission is supported by a
new network adaptive protocol designed to mainly
transmit real-time medical data. Its novelty derives
from its associated monitoring, notification, trend-
calculation services and middleware protocols.
The rest of the paper is organized as follows:
Section 2 presents existing health care monitoring
systems and their monitoring capabilities. Section
3 describes the architecture of the proposed system
and its framework, section 4 presents the
classification of medical services while section 5
describes existing network protocols. Section 6
explains the design and implementation of the
proposed network adaptive protocol. Section 7
presents experimental scenario results and section
8 summarizes and concludes this paper.
2 EXISTING MEDICAL MONITORING
SYSTEMS
A substantial number of medical monitoring
systems is described in literature, the majority of
which may be grouped into the following
categories:
2.1 Communication Systems
This category includes a collection of papers
which reflect interesting concepts and recent
advances in medical monitoring systems and
applications concentrated on the design,
simulation, and implementation of mobile and
networking technologies.
In Yuce et al. [4] a multi-hoping 4-channel sensor
network system is implemented to monitor
physiological parameters from multiple patients
using the Medical Implant Communication Service
(402-405 MHz) to establish communication
between the sensor nodes and a remote central
control unit, and the Wireless Medical Telemetry
Service (608-614 MHz) to exchange information
between the remote central control unit and the
remote base stations. These two services utilize
frequency bands that are mainly assigned to
medical applications. A single sensor channel is
dedicated to support a continuous physiological
signal such as ECC/EEG. Another example by
Aydin et al. [5] present the development and
implementation of a direct-sequence spread-
spectrum system for real-time communication of
physiological data such as temperature, PH and
oxygen concentration using an implanted sensor
within the system for diagnostic and monitoring
purposes. Chu et al. [6] implements and evaluates
the performance of a portable tele-trauma system
to assist health-care centers. The system is based
on commercially available 3G networks for
simultaneous transmission of a patient’s video,
medical images and ECG signals.
2.2 Sensors
This category focuses on the implementation,
issues, challenges and integration of general
International Journal of Digital Information and Wireless Communications (IJDIWC) 6(2): 63-77The Society of Digital Information and Wireless Communications, 2016 ISSN: 2225-658X (Online); ISSN 2412-6551 (Print)
64

purpose or application-specific sensors to the
communication infrastructure of medical
monitoring systems.
In Milenkovic et al. [7] a prototype sensor network
is presented for health monitoring which discusses
implementation issues and utilizes off the shelf
802.15.4 compliant network nodes and custom-
built motion and heart activity sensors. In Jovanov
et al. [8] the architecture of a wireless body area
network is described composed of off the shelf
sensor platforms with application-specific signal
conditioning modules. A custom made sensor is
developed, which can be used as a heart activity
sensor and also to monitor position and activity of
the upper and lower extremities. A three level
wearable health system is presented using WBAN
for patient monitoring. The first level consists of
various physiological sensors, the second level
contains the personal server and the third level
includes the health care servers and other related
services. In order to address some of WBAN
challenges, C. Otto et al. [9] designed a system
that includes accelerometer-based motion sensors,
an ECG sensor, and a pocket PC based personal
server. The WBAN hardware architecture is based
on off the shelf commodity sensor platforms while
the software architecture utilizes an open-source
operating system for embedded sensor networks.
2.3 Systems
This category presents a collection of papers
concentrated on the architecture and
implementation of medical monitoring systems,
addressing issues and challenges of system
integration.
In Bourouis et al. [10] the architecture of a
ubiquitous health monitoring system is presented
which is based on wireless body area sensor
networks to collect and send data through
GPRS/UMTS to a cloud server. A smartphone
application evaluates the state of a patient utilizing
cloud technology, location data and a neural
network running as a cloud service. In Choi et al.
[11] a bedroom system for ubiquitous health
monitoring is presented based on Bluetooth and
Wireless LAN networks. Sensors attached to a
patient's bed transmit all medical information to a
remote monitoring station for further data
processing and analysis. In Dai et al. [12], a
wireless physiological multi-parameter monitoring
system is based on mobile communication
networks where the system monitors vital signs
and transmits data via mobile communication
networks to a mobile monitoring station and
finally to a hospital central management system
for data review and interpretation by medical
personnel. A comprehensive review of the current
research and development on medical monitoring
systems is also available in Pantelopoulos et al.
[13] where system implementations are compared
with an emphasis given to multi-parameter
physiological sensing system design in order to
provide reliable vital sign measurements and to
incorporate real-time decision support for early
detection of symptoms.
2.4 Support Devices
The next group of papers covers different aspects
of support devices, such as PDAs and tablets for
medical monitoring applications.
Rodriguez et al. [14] present a location-aware
medical information system that was developed to
provide access to hospital information and services
based on the user’s location. A PDA was used to
access and adapt user interfaces and resources
such as patient’s records or the location of a
medical specialist, based on the user location
detected by a trained backpropagation neural-
network with radio-frequency signal strengths
used as inputs. In order to reduce power
consumption, connection time and at the same
time increase autonomy and reliability of the
monitoring system, local signal processing by
PDAs was suggested by Lin et al. [15] and Rasid
et al. [16]. Both systems are used for data
acquisition, collection, processing and
transmission.
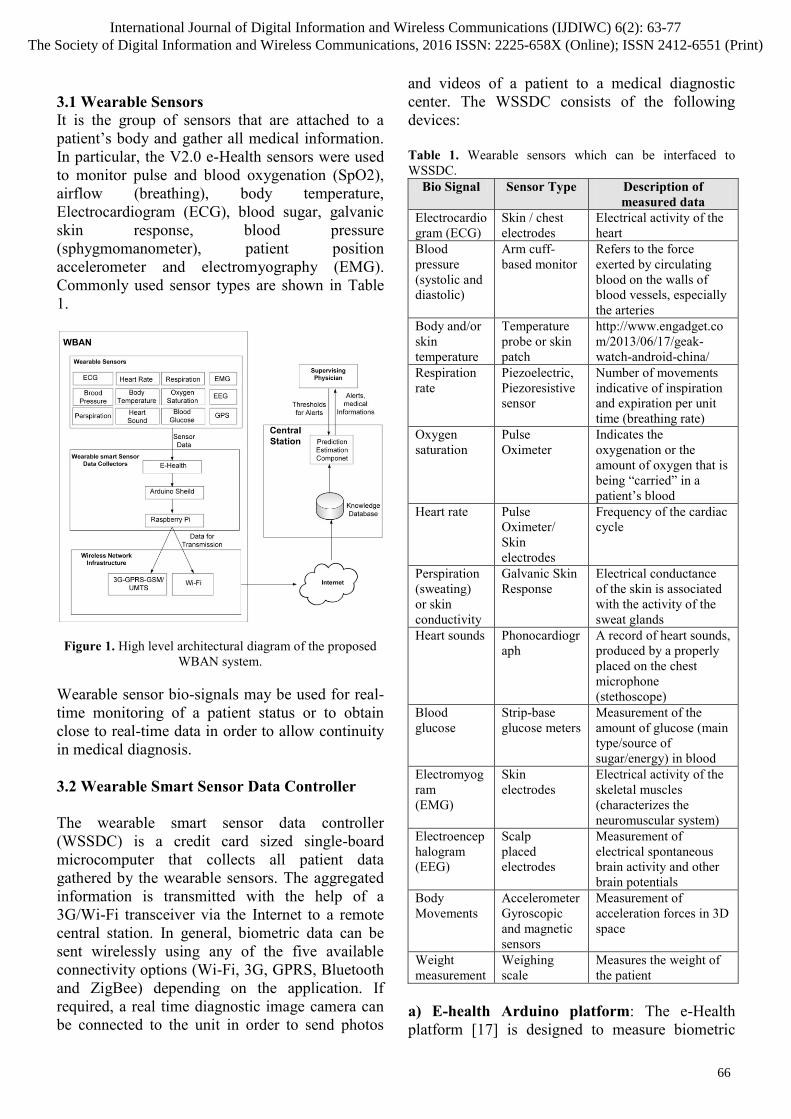
3 SYSTEM ARCHITECTURE
The proposed system utilizes low-cost off the shelf
sensors, computing and transmission components,
as shown in Figure 1, to provide an economical
solution to personalized health care monitoring
problems, while retaining all the functionality and
flexibility of more expensive systems. In
particular, a WBAN is designed and developed
based on wearable medical sensors to exchange
patient information with a remote Central Station.
Data transmission is performed using services over
existing wireless technologies (3G or Wi-Fi) and
protocols.
International Journal of Digital Information and Wireless Communications (IJDIWC) 6(2): 63-77The Society of Digital Information and Wireless Communications, 2016 ISSN: 2225-658X (Online); ISSN 2412-6551 (Print)
65
3.1 Wearable Sensors
It is the group of sensors that are attached to a
patient’s body and gather all medical information.
In particular, the V2.0 e-Health sensors were used
to monitor pulse and blood oxygenation (SpO2),
airflow (breathing), body temperature,
Electrocardiogram (ECG), blood sugar, galvanic
skin response, blood pressure
(sphygmomanometer), patient position
accelerometer and electromyography (EMG).
Commonly used sensor types are shown in Table
1.
Figure 1. High level architectural diagram of the proposed
WBAN system.
Wearable sensor bio-signals may be used for real-
time monitoring of a patient status or to obtain
close to real-time data in order to allow continuity
in medical diagnosis.
3.2 Wearable Smart Sensor Data Controller
The wearable smart sensor data controller
(WSSDC) is a credit card sized single-board
microcomputer that collects all patient data
gathered by the wearable sensors. The aggregated
information is transmitted with the help of a
3G/Wi-Fi transceiver via the Internet to a remote
central station. In general, biometric data can be
sent wirelessly using any of the five available
connectivity options (Wi-Fi, 3G, GPRS, Bluetooth
and ZigBee) depending on the application. If
required, a real time diagnostic image camera can
be connected to the unit in order to send photos
and videos of a patient to a medical diagnostic
center. The WSSDC consists of the following
devices:
Table 1. Wearable sensors which can be interfaced to
WSSDC.
Bio Signal Sensor Type Description of
measured data
Electrocardio
gram (ECG)
Skin / chest
electrodes
Electrical activity of the
heart
Blood
pressure
(systolic and
diastolic)
Arm cuff-
based monitor
Refers to the force
exerted by circulating
blood on the walls of
blood vessels, especially
the arteries
Body and/or
skin
temperature
Temperature
probe or skin
patch
http://www.engadget.co
m/2013/06/17/geak-
watch-android-china/
Respiration
rate
Piezoelectric,
Piezoresistive
sensor
Number of movements
indicative of inspiration
and expiration per unit
time (breathing rate)
Oxygen
saturation
Pulse
Oximeter
Indicates the
oxygenation or the
amount of oxygen that is
being “carried” in a
patient’s blood
Heart rate Pulse
Oximeter/
Skin
electrodes
Frequency of the cardiac
cycle
Perspiration
(sweating)
or skin
conductivity
Galvanic Skin
Response
Electrical conductance
of the skin is associated
with the activity of the
sweat glands
Heart sounds Phonocardiogr
aph
A record of heart sounds,
produced by a properly
placed on the chest
microphone
(stethoscope)
Blood
glucose
Strip-base
glucose meters
Measurement of the
amount of glucose (main
type/source of
sugar/energy) in blood
Electromyog
ram
(EMG)
Skin
electrodes
Electrical activity of the
skeletal muscles
(characterizes the
neuromuscular system)
Electroencep
halogram
(EEG)
Scalp
placed
electrodes
Measurement of
electrical spontaneous
brain activity and other
brain potentials
Body
Movements
Accelerometer
Gyroscopic
and magnetic
sensors
Measurement of
acceleration forces in 3D
space
Weight
measurement
Weighing
scale
Measures the weight of
the patient
a) E-health Arduino platform: The e-Health
platform [17] is designed to measure biometric
International Journal of Digital Information and Wireless Communications (IJDIWC) 6(2): 63-77The Society of Digital Information and Wireless Communications, 2016 ISSN: 2225-658X (Online); ISSN 2412-6551 (Print)
66
data from medical sensors and transmit that data to
the controller processor (RPI) via a Serial
Peripheral Interface (SPI). Sensors connected to
the E-health platform and through the RPI’s
communication channel (an external USB data
transceiver) transmit medical data to the remote
Central Station, as shown in Figure 1.
b) Arduino Shield: The connectivity between the
Arduino E-health platform and the Raspberry Pi
B+ was established with the use of a stackable
Arduino shield.
c) Raspberry Pi B+: The Raspberry Pi B+ (RPI)
is a low power (0.7-1.2W) single-board computer
which includes a 32 bit, 700 MHz quad-core ARM
processor with 512 MB of RAM, running a
Rasbian Jessie Linux distribution. It consists of a
40 Pin GPIO that has 16 digital I/O pins used by
digital sensors, an I2C interface for two wire
sensors and an SPI interface for the connection for
up to 8 analog sensors with the use of the
MCP3008 8 channel 10-bit analog to digital chip.
In this case though, a COTS Arduino based E-
health platform was used. The RPI is responsible
for the collection and transmission of all sensor
data, from the WSSDC to the remote Central
Station, using a USB Wi-Fi and a 3G dongle. The
transmission protocol on the sender side is
implemented on the Raspberry.
3.3 Wireless Network Infrastructure
It is the wireless network through which all data
from the WSSDC is transmitted to the Central
Station. All wireless communication standards that
could be used for this transmission are shown in
Table 2.
Existing standards fail to address the requirements
of BANs, either due to security concerns [18] or
interference problems [19] or due to the form
factor of hardware modules or power
consumption. As a response to these issues, the
802.15.6 IEEE Task Group [20, 21] is planning the
development of a communication standard
optimized for low power devices and operation on,
in or around the human body. Furthermore, the
Bluetooth Special Interest Group announced and
implemented recently an alternative protocol, the
Bluetooth Low Energy (BLE) [22], an ultra-low
power technology for devices with limited battery
capacity allowing consumption of only a small
fraction of the power of the original Bluetooth
products, which is targeting sports and wellness,
and health care devices. Another promising
wireless technology is the 5G (5th generation
mobile network or 5th generation wireless system)
[23] and its main target is to offer 1 GBps
bandwidth with lower than 1 ms end-to-end delay.
As far as its efficiency is concerned, it should be
significantly enhanced compared to 4G. Up to now, the most promising standards for long range transmission of patient information are the GPRS/3G/4G and the 802.11g because of the available range they offer. The GPRS/3G/4G uses the cellular network to offer unlimited range, while the range of a Wi-Fi network may be extended to several hundreds of meters.
Table 2. Wireless Communication Standards.
Max.
Theoretic
al Range
Max.
Theoretic
al Data
Rate
Power Frequency
ZigBee 10 – 75 m 20 / 40 /
250 kbps
30 mW 868 MHz /
915 MHz /
2.4 GHz
Blue
tooth
10-100 m 1-3 Mbps 2.5-100
mW
2.4 GHz
IrDA 1 m 16 Mbps 10 μW Infrared
MICS 2 m 500 kbps 25 μW 402-405
MHz
802.11
g
200 m -1
Km
54 Mbps 100
mW-
1W
2.4 GHz
GPRS/
3G/4G
Cellular
based
12Kbps/5
Mbps/12M
Bps
32-200
mW
900MHz/
1800MHz/2
.3GHz
5G Cellular
based
1 GBps Lower
than
4G
Undefined
3.4 The Central Station
This is the main station of the WBAN where all
medical and positional patient data is stored. It is
an Apache Tomcat JSP/PHP based application
server with a MySQL database for medical data
storage capabilities. A physician may access the
history and real time medical information over the
Internet, alter the thresholds and the destination of
the medical alerts, as well as to start/stop
monitoring a patient sensor.
The Central Station includes a knowledge database
for the storage of current measurements and
historical information which can also be used
International Journal of Digital Information and Wireless Communications (IJDIWC) 6(2): 63-77The Society of Digital Information and Wireless Communications, 2016 ISSN: 2225-658X (Online); ISSN 2412-6551 (Print)
67

offline either for locating an accurate and detailed
patient medical history or for post processing data
mining, statistical analysis and research. Such
information may become useful by the Prediction
and Estimation Component (PEC). Its main
functionality is to perform prediction algorithms
on historical database records in order to generate
behavioral responses for each application incident.
Data mining algorithms for statistical model
development are also considered to be applicable.
4 MEDICAL SERVICES
All medical sensor bio-signals are classified into
four distinct categories, depending on resolution,
data update intervals and priority:
4.1 Real-time Services
In this category, real-time traffic is generated by
sensors that are performing measurements at short
time intervals. Examples of such sensors are the
electrocardiogram, the accelerometer and the
electromyography sensors. The WSSDC, either
stores this data on a local drive and transmits it
later on or sends it on the fly. The first approach
demands storage space while the second approach
demands good network conditions. Real-time
services follow the second approach. Such devices
may support a delay buffering mechanism of no
more than 1-3 seconds per transmission.
4.2 Periodic Services
In this category, sensor data are periodically
transmitted to the Central Station. Examples of
such services are the notification service, the
reminding service, the nutrition proposal service
and the health cognitive service. Cognitive
services provide a health model based on previous
sensor measurements and use data mining to
decide if a patient is in accordance with a specific
model.
Periodic services require a shared timing
mechanism set by the Central Station at the
application layer. Periodic services are RESTful
web services that take as input JSON data
(JavaScript Object Notation) and reply with XML
or JSON responses. Periodic services may include
an authentication and encryption mechanism with
the use of SSL/TLS protocols and x.509
certificates for authentication.
Furthermore, they are divided into periodic stream
services (where the HTTP v.1.1 persistent session
with the central session never expires) and
periodic trend services (where the HTTP
connection is re-initiated every time the WBAN
system needs to transmit data).
4.3 Close to Real-time Services
In this category belong services that trigger on
demand sensor measurements. A close to real-time
service initiates sensor data measurement and
transmission when there is indication of an abrupt
medical status such as rapid temperature increase,
fast posture and acceleration change. When a
patient’s results are not within the thresholds set
remotely by medical personnel then alerts are
produced and send by the system.
Close to real-time services need to be treated with
respect to the content of the transmitted message.
That is, a message acknowledgment mechanism is
needed and a persistent retransmission mechanism
for every packet loss is required.
4.4 Interactive Services
This category includes mostly multimedia medical
services and action feedback services. That is,
voice and video transmissions and Haptic services.
Haptic data transmission is denoted by devices that
provide real-time sense or touch or precise spatial
position interaction between patient and doctor.
Interactive voice and video services use the RTP
(Real-Time Transport Protocol) that includes
required timing and synchronization mechanism
for multimedia flows.
5 EXISTING REAL-TIME PROTOCOLS
Many interesting protocols have been introduced
for the transfer of real-time medical data over the
internet. The most important of them are:
5.1 Transmission Control Protocol (TCP) –
HTTP/TCP
The transmission control protocol (TCP) is a
transport layer network protocol that provides a
reliable and connection-oriented service to medical
internet applications. The TCP mechanism of
International Journal of Digital Information and Wireless Communications (IJDIWC) 6(2): 63-77The Society of Digital Information and Wireless Communications, 2016 ISSN: 2225-658X (Online); ISSN 2412-6551 (Print)
68

packet retransmissions assists on packets
reception. TCP also performs congestion control in
order to regulate the transmission rate and
provides a typical flow authentication mechanism
by establishing a 3-way handshake prior to data
delivery. For real-time services, the TCP
retransmission mechanism and the congestion
control algorithms lead to excess jittering, which is
not suitable for real-time traffic.
TCP is commonly used by periodic services,
which use the HTTP protocol for the end-to-end
delivery of medical data using XML and JSON
data notation. This promotes the HTTP protocol
as a reliable end-to-end protocol for periodic and
close to real-time medical services.
5.2 User Datagram Protocol (UDP)
UDP is an unreliable and connectionless protocol
for medical applications that transmits interactive
and real-time data but it is considered to be a good
candidate protocol for multimedia streaming and
voice transmission over the internet protocol
(VoIP). The UDP uses packet flows (datagrams)
transmitted at constant rates without
acknowledgments, loss or packet reorder
provisions. Unlike TCP, it does not guarantee data
packet delivery or rate adjustments in case of
congestion. Hence, data transfers using UDP can
be accomplished without significant time delay
and variations, if indeed delivered.
In medical systems, UDP is useful for the
transmission of real-time insensitive data, without
a guarantee of a reliable transmission, but if
channel capacity is exceeded then it leads to data
loss and real-time flow corruption. UDP is a best
effort protocol for the transmission of interactive
services. Even if it does not guarantee data
reliability, since it manages to maintain a constant
flow rate by minimizing jitter.
5.3 Real-Time Transport Protocol (RTP)
RTP has been introduced as a successor of UDP,
to carry interactive flow information between two
end-systems. It includes flow control and packet
retransmission provisions, in order to maintain
real-time flow consistency [24]. It is augmented by
another protocol called RTCP [25], which
provides feedback to both communicating
participants regarding data transmission such as
the inter-arrival jitter estimate, information about
the highest sequence number received, fraction of
packets lost and cumulative number of packets
lost. The RTP is mainly used by real-time medical
applications that include video and audio
streaming services.
5.4 Interactive Real-Time Protocol (IRTP)
The IRTP has been designed for interactive
internet-based services [26] in order to reduce the
end-to-end delay. It uses the TCP handshake for
flow connection establishment, as well as the RTP
flow control, and a re-transmission mechanism for
crucial data. For real-time and interactive non-
crucial data, the IRTP uses TCP in contrast to
UDP for crucial data flow delivery.
5.4 Efficient Transport Protocol (ETP)
ETP is an alternative protocol to IRTP. It is also
designed for internet-based interactive services.
ETP focuses on reducing the end-to-end delay by
introducing a time gap called the IPG (Inter Packet
Gap), between two successive data packets [27].
This IPG-based control mechanism provides
congestion control similar to the TCP window size
based congestion control. ETP is UDP based. It
does not differentiate real-time medical services
into critical and non-critical, but in cases of
network congestion attempts to provide a uniform
end-to-end delay by modifying data packets in
flight based on receiver IPG feedback.
6 PROPOSED PROTOCOL
In order to accomplish long-range transmission of
medical data, from the WBAN controller to the
remote Central Station, a protocol was designed
and implemented, named MESETP (Medical
Services Transport Protocol). This protocol
includes three sub-protocols, where each one was
designed to meet the requirements of a different
medical service (periodic, close to real-time and
real-time, described in sections 4.1 to 4.3). The
following sections describe each sub-protocol but
concentrate mainly on the development of the
Adaptive Medical Sensor Transmission Protocol
(AMESETP), a new network adaptive
transmission protocol for real-time medical
services.
International Journal of Digital Information and Wireless Communications (IJDIWC) 6(2): 63-77The Society of Digital Information and Wireless Communications, 2016 ISSN: 2225-658X (Online); ISSN 2412-6551 (Print)
69

6.1 MESETP for Periodic Services
For periodic services MESETP uses an application
layer RESTful protocol with different options per
service. If it is a non-streaming periodic service,
then HTTP v.1.0 requests are used with keep-alive
timeouts. If it is a streaming service, then HTTP
v.1.1 persistent connections are performed to
maintain connectivity at non-streaming time
intervals.
6.2 MESETP for Close to Real-time Services
This protocol used for close to real-time services is
based on a custom TCP half-open connection
mechanism to transmit sensor data over an HTTP
or an authenticated by SSL secure HTTP (ports 80
and 443 respectively). Data acquisition is
accomplished with the exchange of only two data
packets. The first one is used for a connection/data
initiation transmission (TCP connection initiation
SYN packet), while the second is used as a
connection acknowledgement packet (TCP
acknowledgement packet reception). Upon one
packet exchange gesture a TCP RST packet is send
by the sender indicating HTTP connection
termination. Data collection of this arbitrary data
exchange is performed and buffered at kernel level
thus reducing unnecessary application processing
delays during data exchange.
6.3 MESETP for Real-time Services
For real-time services MESETP protocol is renamed to Adaptive Medical Sensor Transmission Protocol (AMESETP). In general, the AMESETP reads the network status in frequent intervals and depending on the detected network conditions, it adapts the sending rate of the data packets and the quantization levels of the transmission in order to overcome congestion incidents. The header of the AMESETP protocol for a single data packet is depicted at Figure 2.
Bits 0 1-4 5-7 8 - 15 16-23 24-31
0 Sequence Number CheckSum
32 En SRL SenId PatientId -
Data
Figure 2. Header of AMESETP sub-protocol.
AMESETP protocol header includes the following
fields:
The Sequence Number, used to reinforce the
reliability of the protocol through the
acknowledgment process.
The Checksum used for error-checking of both
header and payload data.
The Sending Rate Level (SRL) field that informs
the receiver for the sending rate level, described in
following section. Based on this level the sending
data rate and the packed data values per packet can
be calculated (see Table 4).
The Sensor ID (SenID) field informs the receiver
to which sensor the data correspond to.
The PatientID field informs the receiver to which
patient the data correspond to.
The Encryption (En) field informs the receiver if
encryption is used for security reasons. As the
AMESETP carries private medical data, the
symmetric 3DES with ECB mode encryption is
enforced at the application layer.
Table 3 shows the efficiency of the AMESETP
when it is compared to other common transport
protocols such as the UDP, the RTP and the TCP.
Table 3. AMESETP Protocol Efficiency
AMESETP UDP RTP TCP
HEADER (bytes) 7 8 12+8(UDP) 20
PAYLOAD
(bytes) 10-33 10-33 10-33 10-33
EFFICIENCY
% 58.82- 82.50 55.55-80.48 33.33-60.00 33.33-60.00
The overhead of the AMESETP header is only 7
bytes. The payload of each packet varies from 60
bytes to 500 bytes depending on the number of
values that are grouped and the quantization level
that is used. The maximum transmission rate of a
real-time sensor is about 2 bytes of sensor data per
ms. Using this value as a nominal real time
transmission value the result is a data recording
rate of 2 Kbytes/s per sensor at the WBAN system.
AMESETP protocol packs these values into
packets using as initially transmission rate the
Normal data at Table 5, Level 5.
The Normal data rate sends 10 packets/s (10 Hz)
of 200 bytes of payload that correspond to 100 (2
byte) sensor values per packet and a quantization
level of 16bit per value. The level 6 Quantization-
Normal data rate has values of 8 bit that
correspond to a smaller amount of payload data
per packet. The combination of rates and bits per
sensor value (quantization of value) that the
International Journal of Digital Information and Wireless Communications (IJDIWC) 6(2): 63-77The Society of Digital Information and Wireless Communications, 2016 ISSN: 2225-658X (Online); ISSN 2412-6551 (Print)
70

AMESETP protocol uses is presented at Table 5
and is consisted of 12 distinct levels. The higher
the level the more frequent and more quantized the
sensor values. The rate level that AMESETP uses
is controlled by the acknowledgment packets send
by the receiver and the rate control mechanism
described in the following section.
6.3.1 AMESETP Rate Control Mechanism
Based on existing real-time protocol
measurements, the maximum acceptable values of
delay, jitter and packet loss of the video, audio and
graphic data are shown in Table 4 [28]. These
quantities were evaluated based on the Quality of
Experience that a user feels when he uses the
corresponding real-time or interactive services.
Table 4. Tolerable delay time reports for real-time audio,
video and graphics [28].
QOS VIDEO AUDIO GRAPHICS
JITTER (ms) ≤ 30 ≤ 30 ≤ 30
DELAY (ms) ≤ 400 ≤ 150 ≤ 100-300
PACKET LOSS
(%) ≤ 1 ≤ 1 ≤ 10
REFRESH
RATE (Hz) ≥ 30 ≥ 50 ≥ 30
When network conditions deteriorate, then the
proposed protocol lowers its sending rate in order
to avoid congestion [28]. To lower the sending
rate, sensor generated measurements (at a
maximum steady rate of 1 KHz) are grouped
together into bigger data packets or quantized to a
number of less accuracy bits. The size of bytes per
packet and quantization of sensor values changes
according to the network conditions shown in
Table 5.
Table 5. AMESETP Protocol Rates and Compressed Rates
for Real-time Services.
Sending
Rate
Level Packets/s
(Pkt-Hz)
Values/
Packet
Bytes/
packet
Quantization
Bits/value
High data
rate
1-
0000
33 30 60 16
Q-High
data rate
2-
0001
33 30 30 8
Medium
data rate
3-
0010
20 50 100 16
Q-Medium
Data rate
4-
0011
20 50 50 8
Normal
data rate
5-
0100
10 100 200 16
Q-Normal
data rate
6-
0101
10 100 100 8
Q-Slow
data rate
7-
0110
5 200 300 12
Q-very
slow data
rate
8-
0111
5 200 250 10
Q-very very
slow data
rate
9-
1000
5 200 200 8
Extra slow
data rate
10-
1010
4 250 250 8
Compressed
1 data rate
11-
1011
2 500 375
6
Compressed
2 data rate
12-
1100
2 500 250
4
The mechanism for AMESETP rate level
adaptation is the following: At the receiver, the
AMESETP records periodically packet loss, as
well as the inter-package delay variation time
based on Eq. 1. The inter-packet delay variation is
measured using the average packet reception gap
among two consecutive packets, as shown by Eq.
2:
Tdi=(Ri-Ri-1)-(Si-Si-1+Ki+IPGi) (1)
Tdi=dt(Ri-Ri-1)-0.0013 (2)
Where Tdi is the inter-package delay time for
packet i, Ri is the reception time of packet i, Si is
the transmission time of packet i and IPG is the
inter-packet gap set by the technology used. Ki is
the user to kernel space delay insertion of a packet
at the transmitter, an average experimental
measurement of which is 120.5 usec for each
packet insertion at kernel level for the RPI.
Because data transmission by the sender is
performed at a maximum of 1ms intervals and
since the IPG during packet insertion is close to
9.2 sec, the negative term of eq. 1 is a constant
value (Eq. 2). It should be noted that the average
10BASE-T IPG value of 9.6 us is used for both 3G
and Wi-Fi technologies for packet insertion. The
difference between two consecutive time inter-
packet delays corresponds to the value of inter-
arrival jitter estimate or inter-packet delay
variation Ji. Ji value is then smoothed (SJi) for
AMESETP based on Eq. 3.
Ji=Tdi- Tdi-1,
International Journal of Digital Information and Wireless Communications (IJDIWC) 6(2): 63-77The Society of Digital Information and Wireless Communications, 2016 ISSN: 2225-658X (Online); ISSN 2412-6551 (Print)
71

SJi=(15/16)Ji-1 +(1/16)Tdi (3)
Eq. 3, is similar to the equation used by the RTP
protocol for the calculation of the inter-arrival
jitter at the receiver in order to adjust its flow rate.
SRL metric (Eq. 4) defines AMESETP transmitter
rate level (Table 5). When an increased packet loss
is detected then the transmitter is notified by an
acknowledgment packet to lower its rate (the
number of the grouped values is increased based
on Table 5). There are 12 levels of grouping and/or
compression of sensor values per packet
transmission and is changing according to Table 5
based on Sending Rate Level (SRL) and calculated
from Eq. 4.
(4)
AMESETP SRL metric divides packet loss into
three intervals: The first packet loss interval
pl<plmax/2 or SJi<SJi-1/4 corresponds to perfect
network conditions and the protocol attempts to
increase the sending rate. The second interval
plmax/2<pl<plmax corresponds to good network
conditions and the protocol attempts to keep the
sending rate steady. The last interval pl>plmax
corresponds to unacceptable network conditions
and the protocol lowers the sending rate in order to
avoid congestion.
For example when AMESETP detects a decrement
on packet loss based on Eq. 4 or an average jitter Ji
decrement of Ji/4 for a measurement receiver
period then it signals via ACK the transmitter to
increase its sending rate by one level based on
Table 5. If packet loss is more than maximum
packet loss (plmax) then the sending rate is
decreased according to Eq. 4 by one level based on
Table 5 and so forth.
The packet loss pl can be evaluated by the
negative acknowledgements of the lost packets
that the receiver sends to the sender. The factor
plmax is the maximum acceptable packet loss taken
from Table 4. For real-time graphics the maximum
acceptable packet loss is set to plmax=10 %.
Another method the AMESETP uses to avoid
congestion is the network adaptive quantization
where quantization levels are changing according
to detected network conditions. When network
conditions are good, the quantization levels
increase and vice versa. Three different levels are
used, denoted as the minimum, medium and
maximum quantization levels (qlmin=16=24,
qlmed=4096=212
, qlmax=65536=216
) at Table 5
respectively.
6.3.2 AMESETP Flow Control Mechanism
AMESETP flow control mechanism uses a unique
sequence number for every packet and the method
of the cumulative negative acknowledgement
(CNAK) for packet drops signaling. Moreover, the
sender transmits the packet with the grouped
values as soon as they are created. A copy of this
packet is stored in a buffer in case a negative
acknowledgement is received. The maximum size
of the sender buffer is set to 65536 packets. The
maximum packet size and headers is 241 bytes.
Consequently, the maximum buffer size is 16
Mbytes.
The receiver sends a CNAK with the packets that
have not reached their destination every k sec
(where k=2-12sec based on protocol
configuration). The receiver also sends the
sequence number of the last received packet to
help the sender to empty its buffer.
Bits 0-3 4-7 8 – 15 16-31
0 Sensor
Id ACK Sequence Number CheckSum
32 PatientId -
Data (Last Received Sequence Number, Dropped Sequence
Numbers)
Figure 3. The AMESETP Header of Cumulative Negative
Acknowledgment Packets (CNAK).
The maximum period of time for the CNAK
cannot exceed the kmax=212 sec as the sequence
number will be reset at this time for a packet rate
of 33 Hz. In our case study we set the period for
cumulative acknowledgment k=1 sec. The packet
header for the CNAK is shown in Figure 3.
To enforce reliable transmission of the CNAK
packet an acknowledgment is sent by the sender. If
the receiver doesn’t get the acknowledgment in a
specific time period, a copy of the CNAK is sent
again.
International Journal of Digital Information and Wireless Communications (IJDIWC) 6(2): 63-77The Society of Digital Information and Wireless Communications, 2016 ISSN: 2225-658X (Online); ISSN 2412-6551 (Print)
72

A flow diagram of the proposed protocol with the
CNAK is shown in Figure 4.
Figure 4. Flow Diagram of the AMESETP.
7 AMESETP PERFORMANCE
The AMESETP performance was experimentally
tested against the UDP and the RTP for real-time
services (Scenario I, II), as well as the TCP
protocols for close to real-time services. All
scenarios include transmission flows from the
WSSDC to the Central Station (an Intel core I7
32bit system at 3.2GHz and 8GB DDR3 RAM –
running Ubuntu server 14.10 Linux distribution).
Two different types of communication channels
were used during experimentation:
Type A - 3G HSDPA (High Speed Downlink
Packet Access): HSDPA provides packet data
transmission over UMTS – W/CDMA cellular
systems, by utilizing reduced delays, and a peak
raw data rate of 14 Mbps. It also provides around
three times the capacity of the 3G UMTS
technology. That is a maximum of 14Mbit
downlink speed and 512Kbit/s uplink (Average
speeds tests showed for the test link 4.5Mbit/s
Downlink and 420Kbit/s Uplink speeds). A 3G
USB dongle was plugged into the RPI controller to
transmit data.
Type B – Wi-Fi IEEE802.11n wireless network
transmission over ADSLv2: Wi-Fi transmission
provides a symmetrical radio channel at an
average of 54Mbit/s from the medical data
collector to a central access point where data are
redirected to the central medical station using
ADSLv2 wired transmission. ADSL utilized a
maximum downlink capacity of 24Mbps and an
uplink of 1Mbit/s (Average speed tests for the test
link showed 12Mbit/s Downlink and 784Kbit/s
Uplink).
7.1 Scenario I Experimental Results
In this scenario, 20 EMG real-time flows were
transmitted from the WSSDC to the Central
Station using UDP protocol. The same
transmission was then repeated but this time using
the AMESETP for real-time services. In addition,
a single real-time EMG flow was transmitted using
an HTTP/TCP communication channel. All the
transmissions shared the same measurements from
a 2byte/ms sensor source which was transmitting a
single data packet every 100ms (19.6Kbit/s per
flow). Table 6 summarizes the experimental
results. As it is seen, the AMESETP
implementation outperforms the simple UDP
transmission in the case of less packet drops due to
the NACK periodic retransmission mechanism.
Table 6. AMESETP performance comparison results with
other common real-time protocols.
Wi-
Fi
3G Min Inter-
packet delay
(msec)
Max Inter-
packet delay
(msec)
%
Packet
Drops
UDP 48 124 1048 1214 2 8
AMESETP 73 114 912 998 - 2
TCP
RTT
260 448 389 1042 - -
As far as the 3G transmission is concerned, latency
is introduced by the communication channel.
Continuous system testing over long periods of
time showed that the 3G transmission can tolerate
spurious or continuous latencies up to 890msec
before packet drops occur. 3G communication
channel is also jitter tolerant maintaining similar
inter-packet delays for AMESETP and UDP flows.
In general, 3G is preferable in a mobile
environment due to its extended range of
transmission. However, in a good 3G signal
reception, the packet delivery delay time is less
than 130 msec. In environments with increased
contention, low signal and/or mobility the inter
packet delay time may reach up to 1200 msec.
Furthermore, significant jitter was spotted in a 3G
International Journal of Digital Information and Wireless Communications (IJDIWC) 6(2): 63-77The Society of Digital Information and Wireless Communications, 2016 ISSN: 2225-658X (Online); ISSN 2412-6551 (Print)
73
network with increased mobility. In addition, Wi-
Fi networks with the same environmental
conditions, present spurious and burst drops.
As far as the Wi-Fi transmission is concerned,
continuous system testing over long periods of
time showed that it is preferable in less mobile and
more stationary environments. When the WSSDC
was in optical contact with an Access Point with a
signal power more than -68dBm, then the Wi-Fi
network provided fair real-time services with inter-
packet delays less than 120 msec. The Wi-Fi
network is less tolerant to excessive jitter or delays
and responded with packet drops for simple UDP
flows when the packet inter-arrival time was more
than 168 msec. Moreover, the Wi-Fi transmission
medium introduces important jitter when there is
no optical contact (multipath propagation) or
interference from other sources close to the Wi-Fi
access point. If such jitter persists more than 2-3
sec it may lead a UDP flow to burst drops and the
AMESETP protocol to a full stop.
7.2 Scenario II Experimental Results
In this scenario, Real-Time Medical sensor data
flows (RTMs) are transmitted from the WSSDC to
the Central Station in order to experimentally
compare the performance of the UDP, the RTP
over HTTP tunneling and the AMESETP
protocols. Such flows simulate real ECG
(Electrocardiogram) transmissions when a three-
electrode wearable sensor is attached to a patient.
Each flow transmits a total 1 Mbyte of medical
data then it stops. Sensor data are transmitted
every 1msec and the sensor resolution is 16bits (2
bytes of data every 1 us, equivalent to sensor real-
time rate of 2 Kbyte/s of data per second and per
flow). The experiment was repeated using 5, 10,
25, 50, 75 and 100 concurrent flows of AMESETP
protocol and then the same experiment was
repeated using the same number of flows for UDP
and RTP protocols respectively.
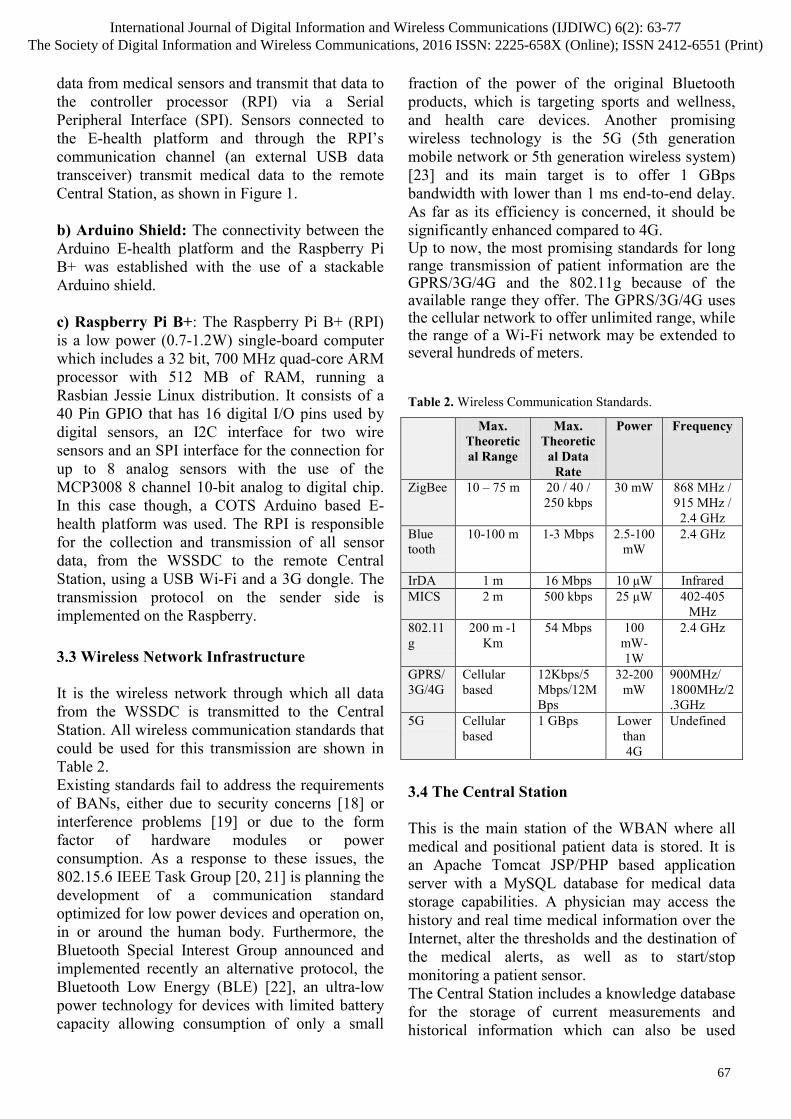
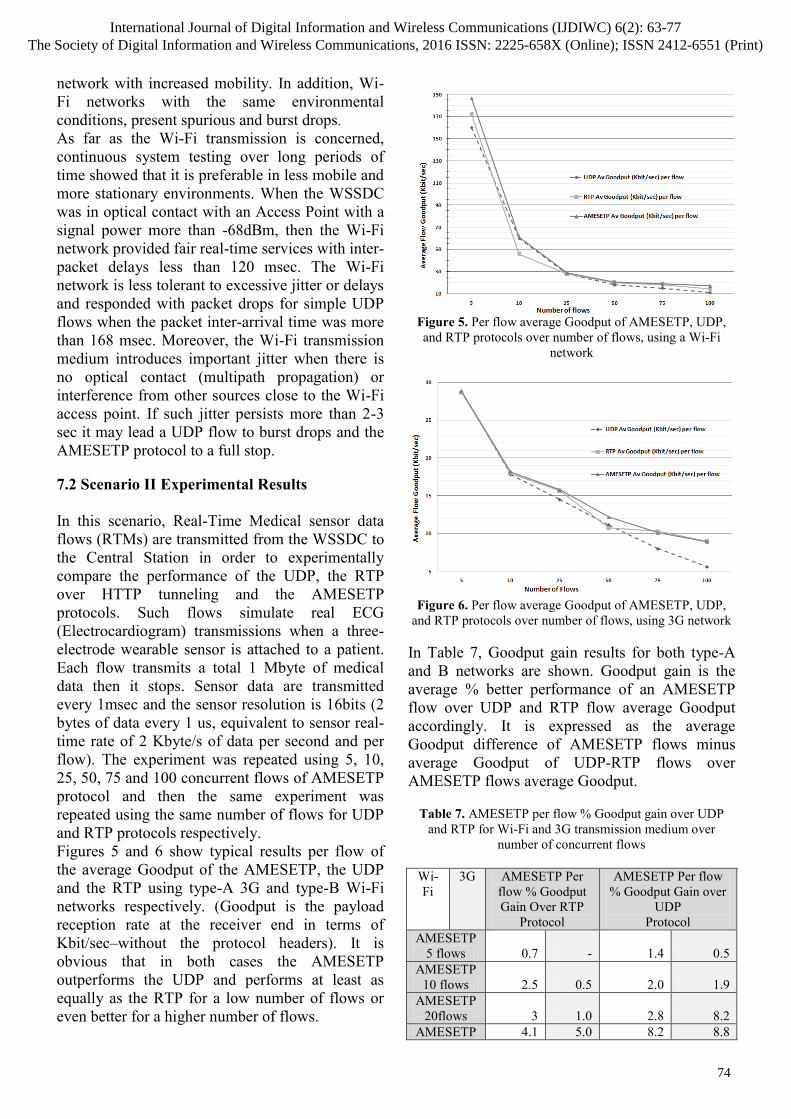
Figures 5 and 6 show typical results per flow of
the average Goodput of the AMESETP, the UDP
and the RTP using type-A 3G and type-B Wi-Fi
networks respectively. (Goodput is the payload
reception rate at the receiver end in terms of
Kbit/sec–without the protocol headers). It is
obvious that in both cases the AMESETP
outperforms the UDP and performs at least as
equally as the RTP for a low number of flows or
even better for a higher number of flows.
Figure 5. Per flow average Goodput of AMESETP, UDP,
and RTP protocols over number of flows, using a Wi-Fi
network
Figure 6. Per flow average Goodput of AMESETP, UDP,
and RTP protocols over number of flows, using 3G network
In Table 7, Goodput gain results for both type-A
and B networks are shown. Goodput gain is the
average % better performance of an AMESETP
flow over UDP and RTP flow average Goodput
accordingly. It is expressed as the average
Goodput difference of AMESETP flows minus
average Goodput of UDP-RTP flows over
AMESETP flows average Goodput.
Table 7. AMESETP per flow % Goodput gain over UDP
and RTP for Wi-Fi and 3G transmission medium over
number of concurrent flows
Wi-
Fi
3G AMESETP Per
flow % Goodput
Gain Over RTP
Protocol
AMESETP Per flow
% Goodput Gain over
UDP
Protocol
AMESETP
5 flows 0.7 - 1.4 0.5
AMESETP
10 flows 2.5 0.5 2.0 1.9
AMESETP
20flows 3 1.0 2.8 8.2
AMESETP 4.1 5.0 8.2 8.8
International Journal of Digital Information and Wireless Communications (IJDIWC) 6(2): 63-77The Society of Digital Information and Wireless Communications, 2016 ISSN: 2225-658X (Online); ISSN 2412-6551 (Print)
74

50 flows
AMESETP
75 flows 5 6.1 12 12.8
AMESETP
100flows 7.2 9.7 19.4 17.14
It is obvious that the AMESETP significantly
outperforms UDP real-time flows for both 3G and
Wi-Fi networks. The Goodput gains for up to 10
flows is 1-1.5% more Goodput on average per
flow over a UDP flow carrying the same data
using the same initial transmission rate with the
AMESETP.
For less than 3 flows and non-congested links the
AMESETP and the UDP perform similarly (no
Goodput gain of AMESETP over UDP was
detected). For more than 10 flows the UDP
transmission deteriorates significantly to burst
drops (10-15% packet drops per flow on average –
Table 8).
Table 8. AMESETP, UDP, RTP cumulative %packet drops
for all flows for Wi-Fi and 3G transmission medium over
number of concurrent flows
Wi-
Fi
3
G
%Packet
Drops UDP
%Packet
Drops RTP
% Packet
Drops
AMESETP
5 flows 0.1 0.2 0 0 0 0
10 flows 0.5 1.0 0.1 0.1 0.5 0.5
20 flows 1.1 5.0 0.2 0.1 1.0 2.0
50 flows 2.0 9.0 1.2 4 1.5 3.5
75 flows 4.7 12 2.0 8 3.1 8
100 flows 9.1 20 4.1 11 7.0 9
The RTP performance is significantly better than
that of UDP. For less than 10 flows the RTP
presents similar performance characteristics with
the AMESETP in terms of Goodput and packet
drops (Tables 7, 8). As the number of flows
increases the RTP abrupt rate scaling mechanism
decreases significantly RTP transmission rates.
This can be seen both at Goodput gains of Table 7
for rates of 50 flows and over. This rate decrement
leads also to significant burst packet drops at least
2 times more than that of the AMESETP.
Figures 8 and 9 show the average inter-packet
delay time for the Wi-Fi and the 3G networks
respectively. It is evident from these figures that
the UDP presents less jitter in terms of inter-packet
delay time than the AMESETP, which is more
than 20% as the number of flows increases, but
there is also a significant increase of packet drops
(10-20%) which lowers its Goodput.
Figure 7.Average inter packet delay time (ms) per flow of
AMESETP, UDP, and RTP protocols over number of flows,
using Wi-Fi network
Figure 8.Average inter packet delay time (ms) per flow of
AMESETP, UDP, and RTP protocols over number of flows,
using 3G network
The same figures show that the RTP performance
is comparable to that of the AMESETP as far as
inter-packet delay time is concerned. For the Wi-Fi
transmission, the AMESETP performs better than
the RTP in terms of jitter for both low and high
number of flows, presenting at an average 10-15%
less inter-packet delay. For the 3G transmission,
the inter-packet delay of the RTP is less than that
of the AMESETP for low flow numbers, but the
situation reverses for higher than 50 flows
numbers. This is an indication that the AMESETP
attempts to increase the sending rate level (SRL),
but in this case it fails to do so. Possibly a more
aggressive adaptation rate is required based only
on jitter or inter-packet delays.
8 CONCLUSIONS
This contribution describes the design and implementation of a novel WBAN system, the architecture of which is based on low-cost off the
International Journal of Digital Information and Wireless Communications (IJDIWC) 6(2): 63-77The Society of Digital Information and Wireless Communications, 2016 ISSN: 2225-658X (Online); ISSN 2412-6551 (Print)
75

shelf hardware components, open-source software and programming environments such as the Linux (RPI) and the Arduino IDE, to provide an economical solution to personalized health care monitoring problems.
In particular, the system utilizes the V2.0 e-Health wearable sensors to measure different patient bio-signals (airflow, body temperature, electrocardiogram, blood sugar, etc.), which are all collected to a wearable microcomputer station. Medical sensor measurements are then categorized into real-time, close to real-time and periodic based on resolution, data update intervals and priority of the measurement and transmitted to a remote station. The remote station serves as a repository for data storage, as well as a data processing unit where a physician may access the history and real time medical information, alter thresholds and send alerts.
The long-range transmission between the microcomputer and the remote station is supported by a new real-time network protocol, which reads the network status in frequent intervals and depending on the detected network conditions, such as packet loss, jitter and inter-package delay time, it adapts the sending rate of the data packets and the quantization levels of the transmission in order to avoid congestion.
In a prototype system, experimental tests have shown that the proposed protocol is a promising candidate for real-time Wi-Fi or 3G transmission of medical data since it outperforms in most cases other existing protocols, such as the TCP, UDP and RTP, although a more aggressive adaptation rate may improve its performance. However a better calibration of AMESETP rate level change for non congestive intervals may further increase AMESETP performance characteristics.
REFERENCES
[1] R. Buyya, C.S. Yeoa, S. Venugopala, J. Broberga, I. Brandicc, "Cloud computing and emerging IT platforms: Vision, hype, and reality for delivering computing as the 5th utility", Future Generation Computer Systems, Vol. 25, pp. 599-616, 2009.
[2] P. Bruening, B. Treacy, "Cloud Computing: Privacy, Security Challenges". In The Bureau of National Affairs, 2009.
[3] M. Poulymenopoulou, F. Malamateniou, G. Vassilacopoulos, "Emergency Healthcare Process Automation using Workflow Technology and Web Services". Int. J. Med. Inform., Vol. 28, no. 3, pp. 195-207, 2005.
[4] M.R. Yuce and C.K. Ho, “Implementation of body area networks based on MICS/WMTS medical bands for healthcare systems”, 30th Annual International IEEE EMBS Conference, August 20-24, 2008.
[5] N. Aydin, T. Arslan, and D.R.S. Cumming, “A direct sequence spread-spectrum communication system for integrated sensor microsystems”, IEEE Transactions on Information Technology in Biomedicine, Vol. 9, No 1, pp. 4-12, March 2005.
[6] Y. Chu and A. Ganz, “A mobile teletrauma system using 3G networks”, IEEE Trans. Inform. Technol. Biomed., vol. 8, no. 4, pp. 456–462, Dec. 2004.
[7] A. Milenkovic, C. Otto, E. Jovanov, “Wireless sensor networks for personal health monitoring: Issues and an implementation”, Elsevier, Computer Communications 29 (2006), pp. 2521–2533.
[8] E. Jovanov, A. Milenkovic, C. Otto and P. C. de Groen, “A wireless body area network of intelligent motion sensors for computer assisted physical rehabilitation”, Journal of NeuroEngineering and Rehabilitation, Vol. 2, March 2005.
[9] C. Otto, A. Milenkovic, C. Sanders, E. Jovanov, “System Architecture of a Wireless Body Area Sensor Network for Ubiquitous Health Monitoring”, Journal of Mobile Multimedia, Vol. 1, No.4 (2006) pp. 307-326.
[10] A. Bourouis, M. Feham and A. Bouchachia, “A new architecture of a ubiquitous health monitoring system: a prototype of cloud mobile health monitoring system.” International Journal of Computer Science Issues, Vol. 9, Issue 2, No 2, March 2012.
[11] J.M. Choi, B.H. Choi, J.W. Seo, R.H. Sohn, M.S. Ryu, W. Yi, K.S. Park, “A System for Ubiquitous Health Monitoring in the Bedroom via a Bluetooth Network and Wireless LAN”, Proc. The 26th Annual International Conference of the IEEE Eng. Med. Biol. Soc. (EMBS), Vol. 5, 2004, pp. 3362-3365.
[12] S. Dai, Y. Zhang, “Wireless Physiological Multi-Parameter Monitoring System Based on Mobile Communication Networks”, In 19th IEEE Symposium on Computer-Based Medical Systems Based on Mobile Communication Networks, Washington, DC, USA: IEEE Computer Society, 2006, pp. 473-478.
[13] A. Pantelopoulos and N. G. Bourbakis, “A Survey on Wearable Sensor-Based Systems for Health Monitoring and Prognosis”, IEEE Transactions on Systems, Man, and Cybernetics, Part C: Applications and Reviews, Vol. 40, No. 1, January 2010.
[14] M. Rodriguez, J. Favela, E.A. Martinez, and M.A. Muñoz, “Location-aware access to hospital information and services,” IEEE Transactions on Information Technology in Biomedicine, Vol. 8, no. 4, pp. 448–455, Dec. 2004.
[15] Y.H. Lin, Y.Y. Chen, P.C.I. Ko, I.C. Jan, J.M. Wong, and G.J. Jan, “A wireless PDA-based physiological monitoring system for patient transport,” IEEE Trans. Inform. Technol. Biomed., vol. 8, no. 4, pp. 439–447, 2004.
[16] M.F. Rasid, B. Woodward, “Bluetooth telemedicine processor for multi-channel biomedical signal transmission via mobile cellular networks”, IEEE Trans. Inform. Technol. Biomed., 2005 Mar;9(1):35-43.
[17] E-Health Sensor Platform V2.0 for Arduino and Raspberry Pi. https://www.cooking-hacks.com/-documentation/tutorials/ehealth-biometric-sensor-platform-Arduino-raspberry-pi-medical, 2013.(Accessed 31 Dec 2015)
[18] C. Hager and S. Midkiff, “An analysis of bluetooth security vulnerabilities”, IEEE Wireless Communications and Networking, vol. 3, pp. 1825–1831, March 2003.
[19] A. Sikora and V. F. Groza, “Coexistence of IEEE 802.15.4 with other systems in 2.4 GHz ISM-Band”, In Proc. of Instrumentation and Measurement (IMTC), vol. 1, pp.1786-1791, May 2006.
[20] S. Ullah, P. Khan, N. Ullah, S. Saleem, H. Higgins, and K. S. Kwak, “A review of wireless body area networks for medical applications”, CoRR, abs/1001.0831, 2010.
[21] IEEE 802.15 WPAN Task Group 6. Available at: http://www.ieee802.org/15/pub/-TG6.html, 2009. (Accessed 31 Dec 2015).
International Journal of Digital Information and Wireless Communications (IJDIWC) 6(2): 63-77The Society of Digital Information and Wireless Communications, 2016 ISSN: 2225-658X (Online); ISSN 2412-6551 (Print)
76

[22] C. Gomez, J. Oller, J. Paradells, “Overview and Evaluation of Bluetooth Low Energy: An Emerging Low-power Wireless Technology”, Sensors2012, vol 12, pp-11734–11753, August 2012.
[23] J.G. Andrews, S.Buzzi, Wan Choi; S.V. Hanly, A.Lozano, A.C.K. Soong, J.C. Zhang, "What Will 5G Be?", IEEE Journal in Selected Areas in Communications, vol. 32, no. 6, pp.1065-1082, June 2014
[24] H. Schulzrinne, S. Casner, R. Frederick, V. Jacobson “RTP: A Transport Protocol for Real-Time Applications”, RFC 3550, 2003.
[25] J. Ott, C. Perkins, "Guidelines for Extending the RTP Control Protocol (RTCP)", RFC 5968, September 2010.
[26] L. Ping, L. Wenjuan, and S. Zengqi, “Transport layer protocol reconfiguration for network-based robot control system,” in Networking, Sensing and Control, 2005. Proceedings. 2005 IEEE, Mar. 2005, pp. 1049 – 1053.
[27] R. Wirz, M. Ferre, R. Marin, J. Barrio, J. Claver, and J. Ortego, “Efficient transport protocol for networked haptics applications,” in Haptics: Perception, Devices and Scenarios, ser. Lecture Notes in Computer Science, M. Ferre, Ed. Springer Berlin / Heidelberg, 2008, vol. 5024, pp. 3–12.
[28] G. Kokkonis, K. E. Psannis, M. Roumeliotis,”Network Adaptive Flow Control Algorithm for Haptic Data Over the Internet–NAFCAH”, Genetic and Evolutionary Computing, vol. 388, pp 93-102, Sept. 2015.
International Journal of Digital Information and Wireless Communications (IJDIWC) 6(2): 63-77The Society of Digital Information and Wireless Communications, 2016 ISSN: 2225-658X (Online); ISSN 2412-6551 (Print)
77