an oceanographic study of james bay before the...
TRANSCRIPT

An Oceanographic Study of James before the Completion of the La Grande Hydroelectric Complex
MOHAMMED I. EL-SABHl AND VLADIMIR G. KOUTITONSKY2
ABSTRACT. From observations made at a number of oceanographic stations estab- lished in the northern part of James Bay, data for freshwater budget ice conditions, salinity, temperature distribution and water circulation are presented and discussed. With the completion of the hydroelectric complex, the mean annual rate of discharge of the La Grande River will increase by 88 per cent, through addition of the diverted head waters of other rivers, but will become approximately constant throughout the year instead of being subject to spring peaks and winter lows. Changes to be expected in oceanographic conditions in James Bay are discussed, and recommenda- tions made for the planning of future studies.
RlbUM&. Une étude océanographique de la baie James avant I'ach2vement du complexe hydroélectrique de la Grande rivi2re. En partant d'observations faites dans plusieurs stations océanographiques installées dans la partie septentrionale de la baie James, on expose et on discute les données concernant le budget d'eau douce, les conditions de la glace, la distribution de la température et la circulation des eaux. Lorsque le complexe hydroélectrique sera terminé, le débit moyen de la Grande rivière augmentera de 88% grâce à la diversion des eaux d'amont d'autres rivihres. Par contre, ce débit deviendra à peu près constant tout au cours de I'année, au lieu de subir les variations saisonnières de maximum au printemps et de minimum en hiver. Suit une discussion des changements auxquels on peut s'attendre en ce qui concerne les conditions océanographiques et on fait des recommandations en vue de la planification des études à venir.
INTRODUCTION
James Bay (Fig. 1) is a large shallow embayment of rectangular shape, 67,000 square kilometres in area. It forms part of a large aquatic system including Hudson Bay and Foxe Basin, and is connected to the Atlantic Ocean through Hudson Strait. Only at its northeastern corner is James Bay deeper than 80 metres (maxi- mum 1 1 O m). Over the remaining 98 per cent of its superficial area the bay is extremely shallow, with the result that the overall average depth is only 28 m.
The hydroelectric project referred to as the La Grande Complex, now under Wection d'océanographie, Université du Québec àRimouski, Québec, Canada. 2Institut National de la Recherche Scientifique, Rimouski, Québec, Canada.

170 OCEANOGRAPHIC STUDY OF JAMES BAY
FIG. 1. Bathymetric chart for James Bay. The locations of the oceanographic stations are indicated on the inset map. Depths are in metres.
construction along the La Grande River and scheduled for completion by 1986, will bring an alteration in the natural annual cycles of freshwater flow rates of two major rivers discharging into James Bay, namely the La Grande and the Eastmain. The mean annual outflow of the Eastmain will be reduced by 87 per cent, while that of the Koksoak river, with its major tributary, the Caniapiscau, into Ungava Bay will be reduced by 28 per cent. The La Grande's mean annual rate of

OCEANOGRAPHIC STUDY OF JAMES BAY 171
discharge will increase from 1,805 to 3,400 cubic metres per second, or by 88 per cent. The La Grande watershed, which now covers an area of 98,000 sq km, will be increased to 177,000 s q km through the diversions of the upper portions of the Caniapiscau and Eastmain-Opinaca watersheds. More details of the project can be found in publications of the Socihth d'Energie de la Baie James (S.E.B.J. 1974) and the Department of the Environment (Lands Directorate 1975).
In view of the possible influence on the oceanographic conditions of James Bay as a result of the extensive development of hydroelectric potential and the proposed major changes in river-flow conditions, an oceanographic survey was initiated in 1972 by the Department of the Environment of the Government of Canada with the object of obtaining basic data for use in the monitoring of conditions in James Bay in the future. The present paper, which provides a descriptive treatment of the physical oceanography of James Bay, is based on data collected in 1972 and 1973, and is intended to supplement the studies made by Barber (1972) and Murty (1972) on the effect of modifications of river inflow on marine and estuarine circulation in the bay.
THE DATA
During the summer of 1972, sixteen oceanographic stations were established in the northern part of James Bay, mainly along two latitudinal sections (Fig. 1). They were occupied at various times between August and October, some of them (nos. 10-16) on a fortnightly basis, and the remainder on a monthly basis, so that 65 sets of observations were obtained in 1972. In 1973, the same network was occupied during the months of August and October.
With the aid of Knudsen-type bottles and reversing thermometers, temperatures were measured at standard depths, and water samples obtained for the purposes of determining salinity and amount of dissolved oxygen. A Bissett-Berman salinity- temperature-depth proiiler was also used - for the obtaining of on-station mea- surements. Meteorological observations were recorded at each station on board the Narwhal, and some were also taken at Fort George by the hydrographic shore team. Temperature, salinity and oxygen measurements, together with the meteo- rological observations gathered in the field surveys in 1972 and 1973, are available in the archives of the Marine Environmental Data Service of Environment Canada. Section contours of salinity, temperature, density and dissolved oxygen for the two surveys have been plotted and compiled by Pullen (1973) and Peck (1976) along with the other basic data.
RESULTS Freshwater budget
At the present time, James Bay receives through fourteen main rivers the drainage from an area of approximately 450,000 km2. This watershed has few natural storage basins, and the rates of discharge of the rivers are characterized by seasonal variations, being low in winter and high in spring.
Mean monthly values of rates of discharge of the rivers on the eastern and western sides of James Bay were extracted from the published data for the years 1964-1973 (W.S.C. 1964-1973; Service de l'Hydrom6trie 1964-1973). These

TABLE 1. Mean monthly rates of river run-off and precipitation into James Bay, 1964-73, in thousands of cubic metres per second.
JAN. FEB. MAR. APR. MAY JUNE JULY AUG. SEPT. O m . NOV. DEC. MEAN
RUN-OFF Eastern side
La Grande Eastmain Others Tola1
. . .
Western side
TOTAL RUN-OFF (R) PRECIPITATION (P)
R + P
0.818 0.473 1.535 2.826 1.192 4.018 0.91 4.928
0.586 0.340 1.169 2.095 0.996 3.091 0.84 3.931
0.471 0.486 0.261 0.374 0.978 1.467 1.710 2.327 0.956 2.963 2.666 5.290 0.80 0.92 3.466 6.210
2.321 2.182 5.322 9.825
13.282 23.107
1.41 24.517
3.632 2.169 5.024
10.825 6.889
17.714 i .88
19.594
2.723 1.453 3.911 8.087 4.681
12.768 2.16
14.928
2.134 1.610 3.433 7.177 3.664
10.841 2.12
12.961
2.380 1.568 3.420 7.368 4.105
11.473 2.21
13.683
2.739 2.057 1 .805 1.223 3.975 3.321 8.519 6.601 5.392 3.404
13.911 10.005 0.87 1.68
14.781 11.685
1.313 0.776 2.359 4.448 1.790 6.238 1.24 7.478
1 .805 1.186 2.993 5.984 4.110 m
9
10.094 z 0
1.35 B v
11.513 z d v) cl
8
2 8

OCEANOGRAPHIC STUDY OF JAMES BAY 173
are presented in Table 1, together with mean monthly precipitation values for James Bay (A.E.S. 1973). Run-off in thousands of cubic metres per second varies from a mean minimum of 2.67 in March to a maximum of 23.11 in May, with a mean annual value of 10.09, about 60 per cent of which comes from rivers along the eastern side of the bay. Furthermore, it is apparent from this table that the La Grande and Eastmain rivers alone supply approximately 30 per cent of the total run-off into the bay. Precipitation over James Bay, again estimated in thou- sands of cubic metres per second, varies from a mean minimum of 0.8 in March to a maximum of 2.21 in September, so that the mean total annual freshwater input through precipitation and rivers discharge is thus 11.5 1, which agrees with the value of 9.68 estimated by Barber (1972).
Together with the climate, this freshwater budget is partially responsible for the spatial and temporal distribution of most of the oceanographic features of James Bay, such as ice conditions, salinity and temperature distributions, flushing time, currents and transport, and parameters of exchange as between James Bay and Hudson Bay.
Ice conditions Degree of ice cover is the factor partially responsible for the seasonal variations
in oceanographic features of James Bay. Of most importance for a study of these is the knowledge of freeze-up periods at different locations in the bay. Maps of mean ice concentration in it were compiled from all data available till 1968 (U.S. Navy 1968) and are shown inFig. 2.
Towards the beginning of November, when mean air temperatures over the bay drop precipitately below -4°C (Danielson 1969), nilas (gray or dark- coloured ice that forms in a sheet on a calm sea) appear near most river mouths. On further cooling of the air, new ice forms in coastal inlets and shallow areas where less heat is stored and lower salinities are to be found. During the second half of November, coastal areas and shelves become covered with scattered pieces of ice which finally coalesce to form fast ice. A broader fast-ice band forms on the eastern shores, a fact which is due in part to the predominance of northwest or southwest winds over the bay (El-Sabh and Koutitonsky 1975). From January to Axil, the bay is nearly covered with consolidated rough ice, except for some open leads frequently observed to run parallel to the eastern shore (Larnder 1968; Barber 1974; Croal 1974). These leads seem to develop as a result of the action of occasional southeast winds, coastal current flowing north-northwest and tides, which together might force the consolidated ice frozen to the seaward edge of fast ice to break away from it.
During the month of May, river ice begins to melt, due in part to the increase in solar radiation, and in part to the amount of water flowing (Table 1). This relatively warm water can be considered as a source of heat which, in conjunction with increasing solar radiation, causes the ice covering the bay to begin to break up. During the first two weeks of May, ice in the centre of the bay becomes looser and, assisted by the wind, drifts at greater speed. By the second half of May, a central block of heavy ice breaks loose from the ice surrounding it and starts clearing the bay from the south. Fast ice is still found in that period of the year,
9

174 OCEANOGRAPHIC STUDY OF JAMES BAY

OCEANOGRAPHIC STUDY OF JAMES BAY 175
0
w
.... . 1 7
m z 0 a t- cn
LD
2
4 c t- (0
0
c - .- L Q
-m-• a N 0
N 0 P O ( D o W
I , , , , , , , , ,
I ,
4 Q)
Y .I
x 0
v1 m .-

OCEANOGRAPHIC STUDY OF JAMES BAY
FIG. 4. Surface distribution of temperature ("C): TOP LEFT, 7-11 August 1972; TOP RIGHT, 1-2 August 1973; BOlTOM LEFT, 11-14 October 1972; BOTTOM RIGHT, 30 September-1 October 1973.
although some southern rivers and estuaries are almost ice-free by early June. Generally, James Bay becomes completely clear of ice by late August, and remains so until late October.
Salinity and temperature distribution Vertical profiles of temperature and salinity for stations 1, 3 and 5 at the mouth
of James Bay are shown in Fig. 3. In August, when James Bay has just become clear of ice, a two-layer system develops as a result of increasing amounts of discharged freshwater reaching the mouth, melting of the ice and heating of the surface layer. The warm and low-salinity (i.e., less dense) water is driven by the Coriolis force to the eastern side as it leaves the bay. The inflowing water of Hudson Bay also has a low-salinity portion, but is not as warm. Both water masses are well separated from the deeper water by a sharp pycnocline which was found to lie at depths of 15-20 metres on the eastern side of the bay. The pycnocline is absent on the western side, due to a higher degree of turbulent tidal mixing over the shallow bottom.
Although mean incident solar radiation over James Bay is at a maximum in July (Danielson 1969), the isolated patches of ice then remaining could impede the heating of the surface layer until August when they melt away. This likelihood could partially serve to explain why higher water temperatures are observed during September in the surface layer at the mouth of the bay. As October approaches, air temperatures drop markedly and wind strength increases over the bay (El-Sabh

OCEANOGRAPHIC STUDY OF JAMES BAY
8P 82' 81' 80' 79' 78'
3 83' 82' 81' 80' 79' 78'
$
FIG. 5. Surface distribution of salinity (%.): TOP w, 7-11 August 1972; TOP RIGHT, 1-2 August 1973; BOTTOM LEFT, 11-14 October 1972; BOTTOM RIGHT, 30 September- 1 October 1973.
and Koutitonsky 1975). These factors will cause vertical mixing in the water to be enhanced, and the density gradient across the pycnocline to diminish. As the bay becomes ice-covered by January, vertical mixing caused by the wind stress acting on the surface will be prevented, and continuous cooling of the surface layer under the ice, coupled with release of brine from the ice to the water will bring about a vertical convection which will tend to decrease the temperature of the whole water column to that of maximum density if salinities are higher than 24.7 parts per thousand Bo). Such is the case at the mouth of the bay during winter, because of the low rates of run-off from the rivers, as is shown by the temperature profiles at stations 1,3 and 5 for the month of April.
In Figs. 4-7 are shown the horizontal distributions of temperature and salinity at the surface and at a depth of 50 metres. The measurements were taken at the oceanographic stations (Fig. 1) occupied in James Bay during the 1972 and 1973 field surveys. Surface temperatures in August 1972 (Fig. 4) ranged from 7°C in the approaches to the eastern side of the bay to less than 0°C near its northwestern side. Horizontal temperature gradients were less steep during the months of September and October. On the other hand, the horizontal salinity gradient was most steep near the mouth of the La Grande river, where, in August 1972, a surface salinity of less than increased to more than 26%0 at the main entrance to the bay. From a comparison between the distributions of temperature and salinity at the surface in 1972 and in 1973, it is evident that considerable varia- tions can occur from one year to another. Such variations can be partially attri-

OCEANOGRAPHIC STUDY OF JAMES BAY
, . . .
. . . . .
FIG. 6. Horizontal distribution of temperature ("0) at a depth of 50 metres: TOP LEFT, 7-11 August 1972; TOP RIGHT, 1-2 August 1973; BOTTOM LEFT, 11-14 October 1972; BOTTOM RIGHT, 30 September-1 October 1973.
buted to the patterns of formation and melting of ice, the yearly variability of which was pointed out by Larnder (1968) and Murty and Barber (1973), who indicate that in the spring of some years there is a net advection of ice into James Bay from the southeast of Hudson Bay. At depths of below 50 metres there was a cold saline body of water with temperatures ranging generally between - 1.6"C and 5°C (Fig. 6) and with salinities of between 27%0 and 32%0 (Fig. 7). From Figs. 6 and 7 it is also apparent that the deep layer in James Bay is subject to considerable variations in temperature and salinity, not only from season to season, but also from year to year, a fact which is due in part to the relative shallowness of the bay.
Flushing time When detailed measurements of current and diffusion are unavailable, it is
sometimes helpful to estimate flushing times (i.e., the times required to move - or reduce to a permissible concentration - any dissolved or suspended contami- nant in the bay) with the aid of very simple models and using parameters more easily estimated.
If it is assumed that the exchange of water between James Bay and Hudson Bay takes place entirely by advection, horizontal diffusion being negligible, then the rate of flow can be calculated from a knowledge of the mean salinities of the inflow- ing and outflowing layers and of the freshwater influx. As will be seen later, this assumption is apparently valid for the mouth of James Bay, and the flushing time

OCEANOGRAPHIC STUDY OF JAMES BAY
A " ' " " ' R
PIQ. 7. Horizontal distribution of salinity (go) at a depth of 50 metres; TOP LEFT, 7-11 August 1972; TOP RIGHT, 1-2 August 1973; BOTTOM LEFT, 11-14 October 1972; BOT- TOM RIGHT, 30 September-1 October 1973.
can be calculated using Bowden's formula (Bowden 1967). Using all the data in respect of the entrance to James Bay obtained for the period of August-October in various years, the average salinities of the surface (10-metre) and bottom layers were found to be 24.5 and 30.6%0 and the residence times three and seven months respectively, and ten months was the estimated flushing time for the whole bay. Prinsenberg (1977) has estimated at two months the time lag between the arrival of spring freshwater mainly in the southern part of the bay and the occurrence of minimum salinity at the surface in the northern part of the bay. It should be emphasized that all these calculations were based on data for the period August- October, over which time only about one quarter of the water in James Bay is flushed. More data are required for the other seasons in order to estimate the average annual salinities, and hence to estimate better the average flushing time for James Bay.
Geostrophic currents and water transport In recent years, the superiority of time-averaged data as opposed to individual-
cruise data, as a basis for geostrophic calculations has been demonstrated (For- rester 1970; El-Sabh 1975). Geostrophic currents and water transport through the mouth of James Bay were estimated over 10-metre intervals of depth from the average density field (average of all available data between 1958 and 1973) following the method of Forrester and El-Sabh (1974). Provided that short-term changes in the density field, such as those of tidal period, have been averaged out

180 OCEANOGRAPHIC STUDY OF JAMES BAY
of the observations, and the currents are adjusted to give the correct net transport of salt, the accuracy of geostrophic currents is believed to be remarkably good (Forrester and El-Sabh 1974; El-Sabh 1975,1977). In Fig. 8, the vertical distribution of the adjusted geostrophic currents is shown
for the months of August and October. Hudson Bay waters enter James Bay over its western half, as well as over its total bottom layer, at speeds of between one and five centimetres per second. These waters have relatively low salinities on the surface, due to the existence of large rivers on the southern coast of Hudson Bay, but are distinguishable from the remaining surface waters on the eastern half of the bay which have even lower salinities as well as higher temperatures. The surface outflow at the entrance to James Bay is restricted to a depth of 30 metres in August, which increases to 70 metres in October with currents of up to 15 cm per second. Currents are generally faster in October than in August. The geo- strophic currents as calculated agree with those taken directly across the entrance and reported by Prinsenberg (1977). In order to investigate to what degree the water circulation in James Bay is
coupled to that in Hudson Bay, it is necessary to have some knowledge of the vertical distribution of the water transport through the cross-section connecting the two bays. Using the adjusted velocities, the amount of inward, outward and net transports in August and October were calculated, and are shown in Table 2. The information provides clear evidence that, during summer and early fall, James Bay is a two-layer system. It consists of an upper layer, 20-50 metres thick with a net outward flow, and a lower layer with a net inward flow.
The total outward water transport through the main entrance to James Bay in thousands of cubic metres per second varies between 65 in August and 167 in October, most of it being confined to the eastern side. Minimum values can be expected in winter, due to a decrease in river run-off. On the other hand, in the same units the total inward transport from Hudson Bay to James Bay ranges between 52 in August and 151 in October, and the net outward transport through
TABLE 2. Average outward, inward and net volume of water transport (thou- sands of cubic metres per second) through the entrance to James Bay at varying
depths (metres) for August and October over the years 1958-73.
Depth
0-10 10-20 20-30 30-40 40-50 50-60 60-70 70-80 80-90 90-100 TOTAL
August October
Outward Inward Net Outward Inward Net
-38.50 2.32 -36.18 -48.35 18.60 -29.75 -18.85 0.0 -18.85 -38.72 17.38 -21.34 -07.03 7.62 00.59 -32.70 19.87 -12.83 -00.43 8.10 07.67 -21.95 18.16 -03.79 -00.11 9.37 09.26 -15.33 10.61 -04.72
0.0 9.87 09.87 -08.15 11.83 03.68 0.0 8.11 08.11 -02.40 12.91 10.51 0.0 4.90 04.90 0.0 14.83 14.83 0.0 1.79 01.79 0.0 17.45 17.45 0.0 0.25 00.25 0.0 09.80 09.80
-64.92 52.33 -12.59 -167.60 151.44 -16.16

OCEANOGRAPHIC STUDY OF JAMES BAY 181
0 0 0 0 0 0 0 m * a m o c \ l

182 OCEANOGRAPHIC STUDY OF JAMES BAY
the section, as estimated from geostrophic calculations, increases from 12.6 in August to 16.2 in October.
To gain a better idea of the dynamics of James Bay, the classification scheme proposed by Hansen and Rattray (1966) was used. In their method, estuarine dynamics are explicitly included and can be represented by two independent parameters, one for circulation (the ratio and net surface current to the mean velocity of river flow through the section) and the other for stratification (the ratio of the top-to-bottom salinity difference to the mean salinity over the section). The comparative importance of horizontal diffusion and advection for the upstream salt flux is represented by the diffusive fraction constant v, which has values of between 0 and 1. When v is unity, the gravitational convection ceases and the upstream salt flux occurs entirely by diffusion; while when v is zero, the diffusion is unimportant, and the upstream salt flux occurs almost entirely by gravitational convection in a two-layered flow. The distribution of oceanographic parameters and currents is such that James Bay is in a stratified fiord classification (v is less than 0.01), which means that the upstream salt flux is mostly achieved by advec- tion. This conclusion is in agreement with the results obtained by Prinsenberg (1977) who evaluated the various terms in the salt-continuity equation and con- cluded that the horizontal diffusion is less by two orders of magnitude than the horizontal advection.
Surface circulation pattern Using all the data available in respect of James Bay for the period between 1958
and 1973, a network of average stations was constructed for the months of August and October, and the dynamic method was used to calculate the geostrophic sur- face circulation. Because of the complex configuration of the bottom of the bay, particularly in its northern part, a variable reference layer for converting the relative velocities into absolute velocities was obtained for each month using Defant’s method (Defant 1941). The depth of this reference layer varied between 20 and 70 metres.
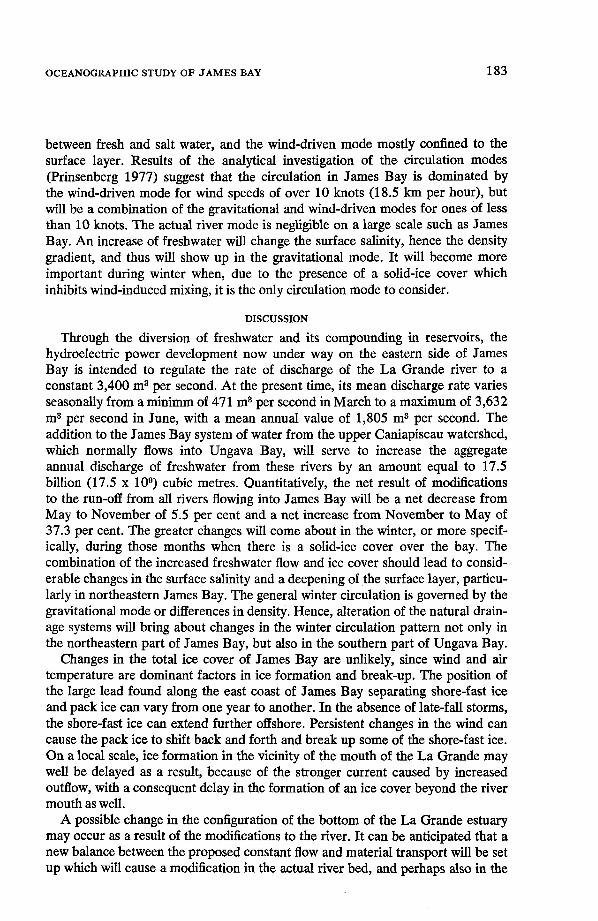
One of the consistent features observed in the surface circulation pattern in James Bay (Fig. 9) is the development of a well-defined narrow current, averaging 10-20 centimetres per second, and flowing in a northward direction along the eastern side of the bay. This boundary current is subject to wide variation in strength with time. On some occasions it divides into two branches, one of which continues to flow in the northward direction towards the east coast of Hudson Bay, while the other turns to the southwest and joins the inflow from Hudson Bay which takes place in the central part of the main entrance to James Bay.
Along the western side of James Bay there is a tendency towards a weak inflow from Hudson Bay (2-5 cm per second). Of this flow, part continues southward along the west coast while the other is deflected to the eastward and northeastward to flow back to Hudson Bay either on the western side or, by joining and rein- forcing the outflowing current, along the eastern side.
When James Bay is considered as a large estuary, its circulation can be broken down into the freshwater-discharge mode required for disposal of the input of freshwater, the gravitational-convection mode due to the difference in density
OCEANOGRAPHIC STUDY OF JAMES BAY 183
between fresh and salt water, and the wind-driven mode mostly confined to the surface layer. Results of the analytical investigation of the circulation modes (Prinsenberg 1977) suggest that the circulation in James Bay is dominated by the wind-driven mode for wind speeds of over 10 knots (1 8.5 km per hour), but will be a combination of the gravitational and wind-driven modes for ones of less than 10 knots. The actual river mode is negligible on a large scale such as James Bay. An increase of freshwater will change the surface salinity, hence the density gradient, and thus will show up in the gravitational mode. It will become more important during winter when, due to the presence of a solid-ice cover which inhibits wind-induced mixing, it is the only circulation mode to consider.
DISCUSSION
Through the diversion of freshwater and its compounding in reservoirs, the hydroelectric power development now under way on the eastern side of James Bay is intended to regulate the rate of discharge of the La Grande river to a constant 3,400 m3 per second. At the present time, its mean discharge rate varies seasonally from a minimm of 471 m3 per second in March to a maximum of 3,632 m3 per second in June, with a mean annual value of 1,805 m3 per second. The addition to the James Bay system of water from the upper Caniapiscau watershed, which normally flows into Ungava Bay, will serve to increase the aggregate annual discharge of freshwater from these rivers by an amount equal to 17.5 billion (17.5 x lo9) cubic metres. Quantitatively, the net result of modifications to the run-off from all rivers flowing into James Bay will be a net decrease from May to November of 5.5 per cent and a net increase from November to May of 37.3 per cent. The greater changes will come about in the winter, or more specif- ically, during those months when there is a solid-ice cover over the bay. The combination of the increased freshwater flow and ice cover should lead to consid- erable changes in the surface salinity and a deepening of ,the surface layer, particu- larly in northeastern James Bay. The general winter circulation is governed by the gravitational mode or differences in density. Hence, alteration of the natural drain- age systems will bring about changes in the winter circulation pattern not only in the northeastern part of James Bay, but also in the southern part of Ungava Bay.
Changes in the total ice cover of James Bay are unlikely, since wind and air temperature are dominant factors in ice formation and break-up. The position of the large lead found along the east coast of James Bay separating shore-fast ice and pack ice can vary from one year to another. In the absence of late-fall storms, the shore-fast ice can extend further offshore. Persistent changes in the wind can cause the pack ice to shift back and forth and break up some of the shore-fast ice. On a local scale, ice formation in the vicinity of the mouth of the La Grande may well be delayed as a result, because of the stronger current caused by increased outflow, with a consequent delay in the formation of an ice cover beyond the river mouth as well.
A possible change in the coniiguration of the bottom of the La Grande estuary may occur as a result of the modifications to the river. It can be anticipated that a new balance between the proposed constant flow and material transport will be set up which will cause a modification in the actual river bed, and perhaps also in the
I
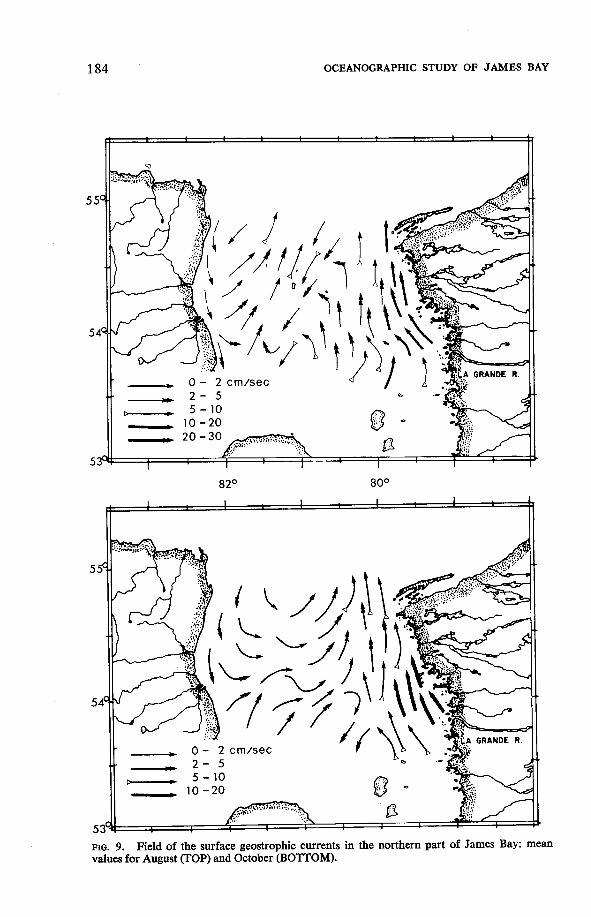
FIG. 9. Field of the surface geostrophic currents in the northern part of James Bay: mean values for August UOP) and October (BOTTOM).

OCEANOGRAPHIC STUDY OF JAMES BAY 185
upstream end of the La Grande estuary. A study of the geomorphical pattern and sediments in the estuary should be carried out in order to make it possible to predict the changes in the shorelines and bottom that might take place with alteration of the physical oceanographic environment.
Neu (1975) has pointed out that changes in the amounts of freshwater discharg- ing into the sea through the regulation or diversion of rivers may subsequently result in significant alterations in marine ecosystems. Furthermore, it has been revealed in studies by Sutcliffe (1 972, 1973) and Sutcliffe et al. (1976) that fluctua- tions in the numbers of certain fish species, and hence in the biological balances in the Gulf of St. Lawrence, are correlated with the pattern of freshwater discharge of the St. Lawrence river system. Strong correlations were found between the dis- charge of the latter and various parameters, not only in the Gulf of St. Lawrence but also on the Scotian Shelf and in the Gulf of Maine. The inference to be drawn from the correlations is that variable freshwater input into the estuary of the St. Lawrence results in a corresponding variable nutrient entrainment via the estuarine circulation which influences the level of primary production in the Gulf of St. Lawrence and consequently the survival of fish larvae. In the light iof these findings, immediate and comprehensive consideration should be given to the role freshwater inflow plays in James Bay, before further man-made modifications to the Rupert, Broadback and Notaway rivers are implemented.
The present authors recommend that future oceanographic surveys of James Bay be so planned that the same network of oceanographic stations be occupied not only during the ice-free season but also during the period when ice is present in varying concentrations. Additional oceanographic stations should be occupied in the southern part of the Bay. In order to speculate on the probable modifications which will occur in circulation and in the pattern of oceanographic parameters, the coupling between James and Hudson Bay has to be understood. The authors therefore also recommend that current-meter strings should be moored along the lines of intersection of the two bays, not only in summer months but also during periods of high (spring) and low (winter) river run-off.
ACKNOWLEDGEMENTS
It is not possible to name all those who helped in preparing this study. The authors, however, wish to express their sincere thanks to G. Drapeau, E. M. Hassan, N. G. Freeman, F. G. Barber, T. S. Murty, S. J. Prinsenberg, and S. Peck, in particular, for the valuable comments and criticism they offered during the various stages of preparation of this study; to S. J. Prinsenberg for so willingly providing information and comments from as-yet-unpublished material; and to Ms. L. Allard for typing the manuscript. This work was supported by Environment Canada, Ocean and Aquatic Sciences, Central Region (contract number OSQ3-0519).
REFERENCES
A. E. s. (Atmospheric Environment Service). 1973. Canadian Normals 1941-70. Vol. 2: Precipitation. Downsview, Ontario: Department of the Environment.
BARBER, F. G. 1972. On the oceanography of James Bay. Canada. Department of the Environ- ment, Marine Sciences Branch, Manuscript Report Series no. 24. pp. 3-96.
1974. Some thoughts on the winter oceanography. In: Freeman, N. G. (ea.), Proceedings of the First James Bay Oceanographic Workshop. Burlington, Ontario: Canada Centre for Inland Waters. pp. 51-52.

186 OCEANOGRAPHIC STUDY OF JAMES BAY
BOWDEN, K. F. 1967. circulation and diffusion. In. Lauff, G. H. (ed.), Estuaries. Washington, D. C.: American Association for the Advancement of Science. pp. 15-36.
CROAL, J. 1974. Summary: Winter Oceanography, James Bay 1973-74. In. Freeman, N. G. (ea.), Proceedings of the First James Bay Oceanographic Workshop. Burlington, Ontario: Canada Centre f o r Inland Waters. pp. 46-50.
DANIEBON, E. W. 1969. The surface heat budget of Hudson Bay. Manuscript report (no. 9) on me at the Marine Sciences Centre, McGill University, Montreal.
D E F ~ , A. 1941. Die absolute Topographie des physikalischen Meereniveaus und der Druckfiachen, sowie die Wasssrbewegungen im Atlantischen Ozean. Meteorwerk, 6 (2). Liefung 5: 191-260.
EL-SABH, M. I. 1975. Transport and Currents in the Gulf of St. Lawrence. Dartmouth, Nova Scotia: Bedford Institute of Oceanography (Report Series BI-R-75-9).
1977. Oceanographic features, currents and transport in Cabot Strait. Journal of the Fisheries Research Board of Canada, 34(4): 516-28.
and KOUTITONSKY, V. 0. 1975. Physical Oceanographic Study in James Bay. Burlington, Ontario: Canada Centre for Inland Waters.
FORRESTER, w. D. 1970. Geostrophic approximation in St. Lawrence Estuary. Tellus, 22:
and EL-SABH, M. I. 1974. Principle of salt continuity applied to estuarine trans- port calculations. Symposium on Physical Processes Responsible for Dispersal of Pollutants in the Sea, Arhus, Denmark, 1972. Charlottenlund Slot, Denmark Conseil international pour l'Exploration de la Mer. (Rapports et ProcBs-verbaux des Rkunions, vol. 167).
HANSEN, D. v. and R A m Y , M., JR. 1966. New dimensions in estuary classiiication. Lim- nology and Oceanography, 11: 319-25.
LANDS DIRECTORATE. 1975. James Bay hydro-electric project: a statement of environmental concerns and recommendations for protection and enhancement measures. Canada, Depart- ment of the Environment.
LARNDER, M. M. 1968. The ice of Hudson Bay. In: Beals, C. S. (ea.), Science, History and Hudson Bay. Ottawa: Department of Energy, Mines and Resources. pp. 318-41.
MURTY, T. s. 1972. Circulation in James Bay. Canada, Department of the Environment, Marine Sciences Branch, Manuscript Report Series no. 24. pp. 143-93.
and BARBER, F. G. 1973. An assessment of ice transport in the Hudson Bay region. Proceedings of Second International Conference on Port and Ocean Engineering under Arctic Conditions. Reykjavk University of Finland, Department of Engineering and Science. pp. 441-50.
NEU, H. J. A. 1975. Run-off regulation for hydropower and its effects on the ocean environ- ment. Canadian Journal p f Civil Engineering, 2 583-91.
PECK, 0. s. 1976. James Bay Data Report 1973. Burlington, Ontario: Canada Centre for Inland Waters.
PRINSENBERG, s. J. 1977. Offshore oceanography of James Bay. James Bay Environment, 1976 Symposium, Proceedings. Montreal: Soci6ttC d'Energie de la Baie James. pp. 141-74.
PULLEN, T. w. 1973. James Bay Data Report 1972. Burlington, Ontario: Canada Centre for
53-65.
pp. 49-52.
Inland Waters. S.E.B.J. 1974. Complexe La Grande 1974; Description technique. Montreal: Soci6t6 d'Ener-
gie de la Baie James. SERVICE DE L'HYDROM~TRIE. 1964-1973. Annuaire Hydraulique. Qu6bec: Ministhre des Ri-
chesses naturelles. SUTCLIFFE, W. H., JR. 1972. Some relations of land drainage, nutrients, partidate material
and fish catch in two eastern Canadian bays. Journal of the Fisheries Research Board of Canada, 29: 357-62.
1973. Correlations between seasonal river discharge and local landings of American lobster (Homarus americanus) and Atlantic halibut (Hippoglossus hippoglossus) in the Gulf of St. Lawrence. Journal of the Fisheries Research Board of Canada, 30: 856-9.
, LOUCKS, R. H. and DRINI(WATER, K. P. 1976. Coastal circulation and physical oceanography of the Scotian Shelf and the Gulf of Maine. Journal of the Fisheries Research Board of Canada, 33: 98-115.
u. s. NAW. 1968. Oceanographic Atlas of the North Atlantic Ocean, Section 3: Ice. Wash- ington, D.C.: Naval Oceanographic Office (Defense Department Publication no. 700).
W.S.C. (Water Survey of Canada). 1964-73. Surface water data: Ontario. Canada, Depart- ment of the Environment, Inland Waters Directorate.