an nac transcription factor orchestrates multiple … nac transcription factor orchestrates multiple...
TRANSCRIPT

An NAC transcription factor orchestrates multiple featuresof cell wall development in Medicago truncatula
Qiao Zhao1, Lina Gallego-Giraldo1, Huanzhong Wang1, Yining Zeng2,3, Shi-You Ding2,3, Fang Chen1,3 and Richard A. Dixon1,3,*
1Plant Biology Division, Samuel Roberts Noble Foundation, 2510 Sam Noble Parkway, Ardmore, OK 73401, USA,2Chemical & Biosciences Center, National Renewable Energy Laboratory, 1617 Cole Blvd. Golden, CO 80401, USA, and3Bioenergy Sciences Center (BESC), Oak Ridge, TN, USA
Received 11 February 2010; revised 23 March 2010; accepted 31 March 2010; published online 5 May 2010.*For correspondence (fax +1 580 224 6692; e-mail [email protected]).
SUMMARY
To identify genes controlling secondary cell wall biosynthesis in the model legume Medicago truncatula, we
screened a Tnt1 retrotransposon insertion mutant population for plants with altered patterns of lignin
autofluorescence. From more than 9000 R1 plants screened, four independent lines were identified with a total
lack of lignin in the interfascicular region. The mutants also showed loss of lignin in phloem fibers, reduced
lignin in vascular elements, failure in anther dehiscence and absence of phenolic autofluorescence in stomatal
guard cell walls. Microarray and PCR analyses confirmed that the mutations were caused by the insertion of
Tnt1 in a gene annotated as encoding a NAM (no apical meristem)-like protein (here designated Medicago
truncatula NAC SECONDARY WALL THICKENING PROMOTING FACTOR 1, MtNST1). MtNST1 is the only family
member in Medicago, but has three homologs (AtNST1–AtNST3) in Arabidopsis thaliana, which function in
different combinations to control cell wall composition in stems and anthers. Loss of MtNST1 function resulted
in reduced lignin content, associated with reduced expression of most lignin biosynthetic genes, and a smaller
reduction in cell wall polysaccharide content, associated with reduced expression of putative cellulose and
hemicellulose biosynthetic genes. Acid pre-treatment and cellulase digestion released significantly more
sugars from cell walls of nst1 mutants compared with the wild type. We discuss the implications of these
findings for the development of alfalfa (Medicago sativa) as a dedicated bioenergy crop.
Keywords: NAC transcription factor, lignification, cell wall development, stomatal guard cell, anther
dehiscence, bioenergy.
INTRODUCTION
Plant secondary cell walls constitute the most abundant
biomass on earth, and can potentially be utilized for biofuel
production via sugar release and fermentation (Somerville,
2007; Carroll and Somerville, 2009). Secondary walls are
deposited inside the primary walls after the cells cease
expansion (Turner et al., 2001). The ability to produce sec-
ondary walls has enabled vascular plants to form strong,
thick-walled cells for water transport and mechanical sup-
port. Secondary wall thickening plays important roles in
various biological processes, such as the formation of tra-
cheary elements and fibers, anther dehiscence, and the
shattering of seed pods.
Secondary cell walls are composed mostly of cellulose,
lignin and hemicellulose. In recent years, the application of
genetic and genomic strategies has led to significant
progress in identifying and characterizing the genes
involved in the biosynthesis of these cell wall components
(Boerjan et al., 2003; Tanaka et al., 2003; Liepman et al.,
2005; Somerville, 2006). Although secondary cell wall com-
ponents are synthesized at different subcellular locations,
the expression of the genes involved is highly coordinated,
both temporally and spatially.
Recently, NAC (NAM, ATAF and CUC2) and MYB family
transcription factors have been shown to play key roles in
regulating secondary wall biosynthesis in Arabidopsis
thaliana (Mitsuda et al., 2007; Zhong et al., 2007, 2008;
Mitsuda and Ohme-Takagi, 2008; Zhou et al., 2009). Two
Arabidopsis NAC genes, NAC SECONDARY WALL THICKEN-
ING PROMOTING FACTOR 1 (NST1) and NST2, were shown
to function together in the promotion of secondary wall
thickening in the anther endothecium, a process that is
necessary for anther dehiscence (Mitsuda et al., 2005). In
addition, the simultaneous knock-out of NST1 and another
NST gene, NST3, resulted in the loss of secondary wall
100 ª 2010 The AuthorsJournal compilation ª 2010 Blackwell Publishing Ltd
The Plant Journal (2010) 63, 100–114 doi: 10.1111/j.1365-313X.2010.04223.x
deposition in Arabidopsis stems, whereas single knock-outs
in NST1 or NST3 show no phenotype (Mitsuda et al., 2007;
Mitsuda and Ohme-Takagi, 2008). It was proposed that NST
genes are master switches, capable of turning on the entire
biosynthetic pathways for cellulose, xylan and lignin by
initiating a transcriptional signaling network to direct down-
stream targets, including MYB transcription factors (Zhong
et al., 2008).
Barrel medic (Medicago truncatula) has been developed
as a model legume with extensive genomic and genetic
resources (Town, 2006; Benedito et al., 2008; Young and
Udvardi, 2009). It is very closely related to alfalfa (Medicago
sativa), the world’s major forage legume, and potentially a
dedicated bioenergy crop (Yang et al., 2009). Previous
studies on engineering cell walls to improve biomass
processing in alfalfa have directly targeted the enzymes of
the lignin biosynthetic pathway (Reddy et al., 2005; Chen
et al., 2006; Shadle et al., 2007). Here, we describe a
non-biased, forward genetic approach to discover genes
determining levels and spatial patterns of lignification in
M. truncatula. Retrotransposon insertions in the MtNST1
gene result not only in the loss of lignification in the
interfascicular region of the stem, and in the prevention of
anther dehiscence, but also in alterations in the cell walls of
stomatal guard cells. We describe the metabolic and tran-
scriptional changes associated with the loss of MtNST1
function, and the impacts of NST1 downregulation on cell
wall recalcitrance to saccharification. We also discuss the
implications of these studies for the development of alfalfa
as a dual forage/bioenergy crop.
RESULTS
Isolation and characterization of M. truncatula nst1
mutants
To identify mutants with defects in secondary cell wall for-
mation, an R1 population of tobacco Tnt1 retrotransposon
insertion-mutagenized M. truncatula (Tadege et al., 2005,
2008) was screened by UV microscopy of cross sections of
the sixth stem internodes, where lignification is well devel-
oped in wild-type plants. Approximately 3400 independent
R1 lines (around 9000 plants) were analyzed, and several
lines with significantly altered extents and/or patterns of
lignin autofluorescence were observed (Figure S1). One of
these lines showed a dramatic loss of lignin in interfascicular
fibers (Figure S1b). To better characterize developmental
patterns of lignification in this mutant (line NF3056), we
compared autofluorescence in cross sections from the sec-
ond to fifth internodes (from top to bottom) of NF3056 and
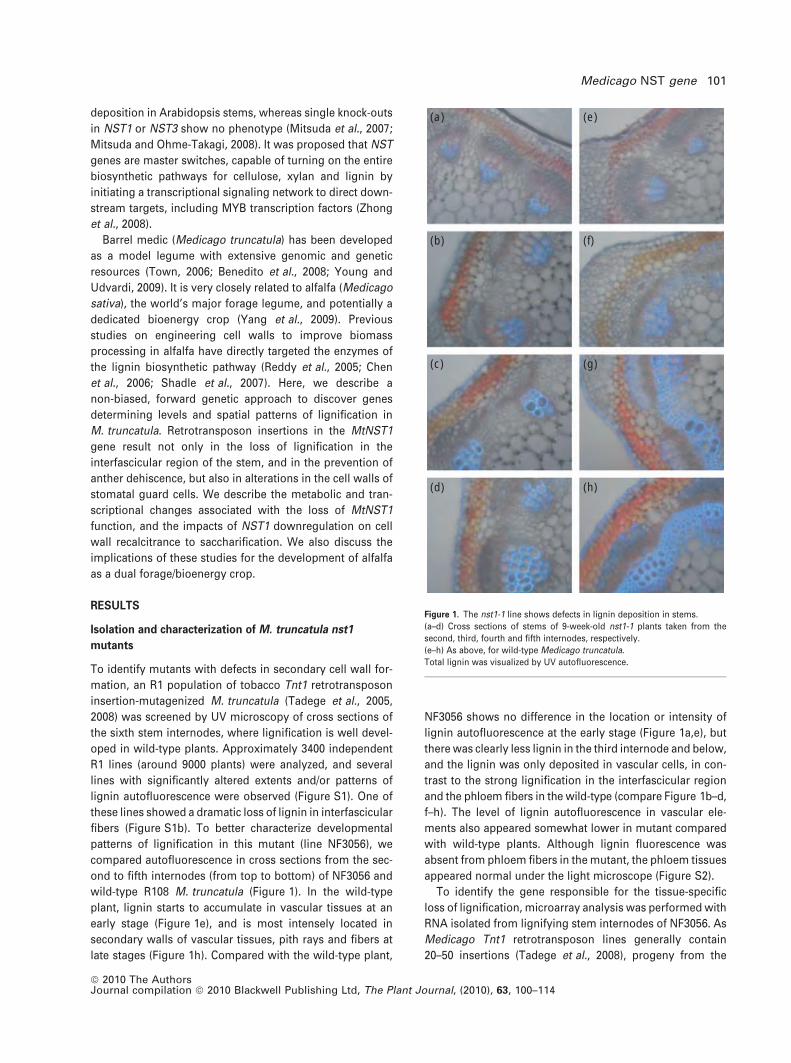
wild-type R108 M. truncatula (Figure 1). In the wild-type
plant, lignin starts to accumulate in vascular tissues at an
early stage (Figure 1e), and is most intensely located in
secondary walls of vascular tissues, pith rays and fibers at
late stages (Figure 1h). Compared with the wild-type plant,
NF3056 shows no difference in the location or intensity of
lignin autofluorescence at the early stage (Figure 1a,e), but
there was clearly less lignin in the third internode and below,
and the lignin was only deposited in vascular cells, in con-
trast to the strong lignification in the interfascicular region
and the phloem fibers in the wild-type (compare Figure 1b–d,
f–h). The level of lignin autofluorescence in vascular ele-
ments also appeared somewhat lower in mutant compared
with wild-type plants. Although lignin fluorescence was
absent from phloem fibers in the mutant, the phloem tissues
appeared normal under the light microscope (Figure S2).
To identify the gene responsible for the tissue-specific
loss of lignification, microarray analysis was performed with
RNA isolated from lignifying stem internodes of NF3056. As
Medicago Tnt1 retrotransposon lines generally contain
20–50 insertions (Tadege et al., 2008), progeny from the
(a)
(b)
(c)
(d)
(e)
(f)
(g)
(h)
Figure 1. The nst1-1 line shows defects in lignin deposition in stems.
(a–d) Cross sections of stems of 9-week-old nst1-1 plants taken from the
second, third, fourth and fifth internodes, respectively.
(e–h) As above, for wild-type Medicago truncatula.
Total lignin was visualized by UV autofluorescence.
Medicago NST gene 101
ª 2010 The AuthorsJournal compilation ª 2010 Blackwell Publishing Ltd, The Plant Journal, (2010), 63, 100–114

same parent plant segregating with the wild-type lignifica-
tion phenotype were used as controls. Total RNA samples
from triplicate biological replicates of the mutants and
controls were subjected to Affymetrix microarray analysis.
In total, 152 probe sets were downregulated in the mutant
line by at least twofold (Table S1). To identify the gene with
the Tnt1 retrotransposon insertion, PCR was performed with
a Tnt1 primer and primers designed from the probe set
sequences: this was done sequentially in order of the extent
of downregulation of the 152 probe sets. PCR amplification
using primers complementary to the three most downreg-
ulated genes in Table S1, each of which is annotated as
encoding a gene involved in cell wall biosynthesis, did not
lead to amplification of a PCR product, whereas the fourth
candidate (Mtr.33913.1.S1_at, expression level decreased by
22-fold) was confirmed to contain a Tnt1 retrotransposon
insert. The probe set Mtr.33913.1.S1_at is annotated as
representing a NAM (no apical meristem)-like protein.
Using the Mtr.33913.1.S1_at probe sequence, a cDNA
BLAST search was performed against the M. truncatula
genome from the Dana-Faber Cancer Institute (DFCI)
bioinformatics web site (http://compbio.dfci.harvard.edu/tgi/
cgi-bin/tgi/gimain.pl?gudb=medicago). The first hit with the
lowest e-value was TC141793, which contains a 1113-bp
cDNA sequence, including the entire Mtr.33913.1.S1_at
probe sequence. Using the TC141793 sequence, a nucleotide
BLAST search was then performed against the NCBI data-
base, and the first hit was Arabidopsis NST1 (At2g46770), a
recently discovered NAC transcription factor responsible for
secondary wall thickening (Mitsuda et al., 2005; Zhong et al.,
2007). As TC141793 does not contain the full-length cDNA,
3¢-RACE was performed to complete the cDNA sequence.
Because NF3056 phenocopies the Arabidopsis nst1:nst3
double mutant, and TC141793 shares sequence similarity
with Arabidopsis NST1, we named the full-length sequence
MtNST1 (GenBank accession number GU144511), and the
NF3056 mutant nst1-1.
Protein sequence alignment was performed using the
deduced amino acid sequence of MtNST1, and Arabidopsis
NST1, NST2 and NST3. Because Arabidopsis NST1 and
NST2 are more similar to each other than either is to NST3,
we first aligned MtNST1 with AtNST1 and NST2 (Figure 2a),
and then aligned the Medicago sequence separately with
AtNST3 (Figure S3). MtNST1 shares high sequence similar-
ity with all three AtNST proteins at the conserved N-terminal
NAC domain. The level of conservation is comparable with
that between AtNST proteins. However, the C-terminal
domain of MtNST1 is quite distinct, indicating that MtNST1
nst1-2 (NF2911) nst1-4 (NF3687)
1 182 367 126343
nst1-1 (NF3056)
170 586
nst1-3 (NF4041)
437
NST1
Actin
(c)
(a)
(b)
1 2 3 4
Figure 2. Characterization of MtNST1.
(a) Amino acid sequence alignments of Arabidopsis AtNST1, AtNST2 and AtNST3 with the deduced Medicago truncatula MtNST1. Black shading indicates identical
amino acids.
(b) Schematic diagram of the structure of the MtNST1 gene and the positions of Tnt1 retrotransposon insertions in the nst1-1 (NF3056), nst1-2 (NF2911), nst1-3
(NF4041) and nst1-4 (NF3687) lines. Numbers indicate nucleotide positions from the site of initiation of translation. Boxes represent exons.
(c) RT-PCR analysis of MtNST1 transcripts in wild-type and Tnt1 insertion lines. Actin was used as a loading control. Lanes 1 and 3 are wild type; lanes 2 and 4 are
nst1-1 and nst1-2, respectively.
102 Qiao Zhao et al.
ª 2010 The AuthorsJournal compilation ª 2010 Blackwell Publishing Ltd, The Plant Journal, (2010), 63, 100–114

might have different functional characteristics. The overall
sequence similarity between MtNST1 and AtNST proteins is
only around 50%, even though the NAC domain is highly
conserved.
Because of the problem of remobilization of Tnt1 ele-
ments during tissue culture (Tadege et al., 2005), we did not
attempt to directly complement nst1–1 with the MtNST1
open reading frame. Instead, to confirm that the tissue-
specific loss-of-lignification phenotype was indeed the
result of insertional mutagenesis of MtNST1, we obtained
three further independent alleles. The first (NF2911) was
obtained by forward genetic screening as above, on the
basis of the loss of interfascicular fluorescence, and micro-
array analysis confirmed the downregulation of many, but
not all, of the genes shown to be downregulated in Mtnst1,
including the NST1 gene itself (Table S1). PCR analysis then
confirmed the insertion of a Tnt1 transposon in MtNST1. We
then used MtNST1 gene-specific primers for the reverse
genetic screening of DNA pools from the complete Tnt1
mutant population. Two additional independent lines
(NF4041 and NF3687) were positive for the presence of
Tnt1 insertions in MtNST1, and homozygous lines of both
showed the altered lignification phenotype (Figure S4). Tnt1
flanking sequence analyses indicated that Tnt1 is inserted in
the NST1 gene in the first exon, at 43 (nst1-1, NF3056) or
170 bp (nst1-2, NF2911), or in the second exon at 586 (nst1-3,
NF4041) or 437 bp (nst1-4, NF3687) (Figure 2b). RT-PCR
analysis confirmed that no MtNST1 transcript was present in
any of the four mutant lines (Figure 2c and S4e).
As a final validation that the loss of lignin phenotype is
caused by a loss of function of MtNST1, we obtained another
line, by forward genetic screening, harboring a point muta-
tion rather than a transposon insertion in MtNST1 (H. Wang,
R.A. Dixon and F. Chen, unpublished data). Plants heterozy-
gous for both the point mutation allele and the Tnt1 insertion
allele at the MtNST1 locus showed loss of interfascicular
lignification, further confirming NST1 as the gene control-
ling the lignification phenotype.
Cell wall composition of Mtnst1 mutant stems
The total lignin content of stem internodes 5–8, as deter-
mined by the acetyl bromide method (Fukushima and
Hatfield, 2004), was reduced by around 50% in the Mtnst1
mutant compared with wild-type plants (Figure 3a). Thio-
acidolysis (Lapierre et al., 1985) revealed a reduction in
G lignin levels in stems of Mtnst1 mutants, but a propor-
tionately larger decrease in S lignin, such that the S/G ratio
was dramatically reduced in the mutants (Figure S5).
The same cell wall samples used for lignin analysis were
analyzed for total sugar content by phenol-sulfuric assay
(Dubois et al., 1956). Total sugar levels were somewhat
reduced in nst1 mutants compared with wild-type plants
(Figure 3b). Analysis of monosaccharide composition indi-
cated that glucose, xylose, galactose and arabinose were the
major sugar components of the M. truncatula cell wall, with
galactose levels being significantly higher than in Arabid-
opsis (Zhong et al., 2008) (Figure 3c). In comparison with the
wild type, cell walls from nst1 mutants had slightly
decreased levels of glucose and xylose, whereas there was
no significant change in galactose or arabinose levels
(Figure 3c). In contrast, Arabidopsis plants with a loss of
NST function through expression of a chimeric NST repres-
sor exhibit significantly reduced levels of xylose, and nearly
double the levels of galactose and arabinose, compared with
controls (Iwase et al., 2009). The change in overall mono-
saccharide composition in the Mtnst1 mutants is likely to
stem from a reduced deposition of cellulose and hemicel-
lulose in the defective secondary walls of the interfascicular
fiber cells.
Levels of wall-bound phenolic compounds were deter-
mined by HPLC analysis of alkaline hydrolysates of cell wall
material. The stem cell walls contained low levels of alkali-
releasable vanillin, p-coumaric and ferulic acids. Apart from
500600700800
0100200300400
Sug
ar c
onte
nt(m
g g–
1 C
WR
)
WT nst1-1
100
120
140(a)
(b)
(c)
0
20
40
60
80
AcB
r lig
nin
cont
ent
(mg
g–1 )
WT nst1-1
700800900
0100200300400500600
Arabinose
Galactose
Xylose
Glucose
Mon
osac
char
ide
cont
ent
(mg
g–1
CW
R)
WT WT WT nst1-1 nst1-1 nst1-1
Figure 3. Cell wall composition of wild type and nst1-1.
(a) Acetyl bromide lignin content of the stems (internodes 5–8); n = 10.
(b) Total sugar content of cell walls from stems of the wild type and nst1-1;
n = 6.
(c) Monosaccharide composition of stems (internodes 5–8) from the wild type
and nst1-1 (biological triplicates).
Data are means of duplicate assays; CWR, cell wall residue; the bars are
means and SDs for 10 (a) or six (b) biological replicates.
Medicago NST gene 103
ª 2010 The AuthorsJournal compilation ª 2010 Blackwell Publishing Ltd, The Plant Journal, (2010), 63, 100–114

a small reduction in vanillin, the loss of function of Mtnst1
had little effect on wall-bound phenolic levels (Figure S6).
Soluble phenolic compounds in M. truncatula nst1 mutants
HPLC analysis was used to compare the profiles of soluble
phenolic compounds in wild-type and mutant plants. The
major soluble phenolics in Medicago stems are a series of
glycosides of the flavones apigenin and luteolin (Kowalska
et al., 2007). Pairwise comparisons of the nst1-1 and nst1-2
lines with corresponding controls indicated no clear quan-
titative or qualitative differences in soluble phenolic profiles
(Figure S7).
Growth characteristics of M. truncatula nst1 mutants
At first sight, the overall growth phenotypes of the four
independent nst1 mutant lines appeared similar to those of
wild-type plants, although the branches were less able to
support themselves against gravity, presumably because of
the defect in secondary wall formation (Figure S8a). Vege-
tative growth was not strongly affected in the Mt-nst1
mutant lines, but stem length was reduced by around 25%,
and the average leaf area increased by around 14%
(Figure S8b; Table 1). The reduction in stem length was
mainly the result of a reduction of internode length in the
three most mature internodes at the 12-internode stage
(Figure S9). Flowering time and stem diameter were not
affected in the mutant lines (Table 1).
Stomatal phenotype of Mtnst1 mutants
Examination of leaf epidermal cells revealed a significant
loss of fluorescence signal in stomatal guard cells of
homozygous mutant leaves, compared with the wild type
(Figures 4a,b and S10). This was observed in all four inde-
pendent nst1 alleles. Furthermore, after a light induction
period, the guard cells of the nst1 mutant exhibited a striking
reduction in stomatal aperture, of around 80% compared
with controls (Figure 4c,d; Table 2). This was associated
with a reduction in transpiration rate in the nst1 mutants,
accompanied by a small but significant increase in the
photosynthetic rate (Table 2).
The autofluorescence of stomatal guard cells has been
proposed to result from the presence of wall-associated
pectin-linked ferulic acid (Jones et al., 2005). To determine
whether NST1 knock-out lines exhibited reduced wall-bound
ferulic acid levels in leaf tissues, we first measured the total
wall-bound phenolic levels in leaf panels (minus veins).
Levels of coumaric, caffeic and ferulic acids were similar in
extracts from the wild type and mutant lines. However,
although the data suggested small increases in wall-bound
coumaric and caffeic acid levels, and a small (less than 10%)
reduction in wall-bound ferulic acid levels, these apparent
changes were not statistically significant (data not shown).
To better address changes in phenolic compounds in the
guard cells of Mtnst1 mutants, we used Coherent anti-Stokes
Raman spectroscopy (CARS) (Zeng et al., 2010) to directly
visualize ferulate signals in the walls. Previous Raman
spectroscopy studies have demonstrated the capability of
detecting ferulate by using specific Raman bands (Ram
et al., 2003; Helene et al., 2008). The sharp Raman band at
1600 cm)1 corresponds to the stretch vibration of the
aromatic ring structure in ferulate. Similar to ordinary
spontaneous Raman scattering, CARS offers chemical con-
trast based on the intrinsic Raman vibrational frequencies of
the molecules of interest in the sample. However, because of
the coherent nature, CARS offers orders of magnitude
higher sensitivity than spontaneous Raman. The stomatal
guard cells, and the central cavity between the cells of the
complex, showed a bright CARS signal caused by the
presence of ferulate in the epidermal peels of leaves of
wild-type plants (Figure 4e,f). In contrast, this signal was
largely absent on analysis of mutant plants (Figure 4g,h).
Anther dehiscence in Mtnst1 mutants
Arabidopsis NST1 and NST2 together regulate secondary
wall thickening in the anther endothecium, and nst1:nst2
double mutants show a defect in anther dehiscence
Table 1 Growth parameters of indepen-dent nst1 insertion mutants
LineStemheight (cm)
Floweringnode
Meaninternodelength (cm)
Leaf area(mm2)
Stemdiameter(mm)
Wt1 70.4 � 0.5 11.5 � 0.6 5.9 � 0.5 5.0 � 0.2 1.6 � 0.2nst1-1 60.8 � 0.6 11.0 � 0.3 5.1 � 0.2 6.4 � 0.3 1.6 � 0.1Wt2 67.7 � 0.7 10.8 � 0.6 5.7 � 0.5 9.1 � 0.5 2.0 � 0.2nst1-2 65.0 � 0.6 12.0 � 0.8 5.4 � 0.4 11.0 � 0.8 1.9 � 0.3Wt3 70.3 � 0.4 11.5 � 0.6 5.9 � 0.3 6.2 � 0.4 1.6 � 0.1nst1-3 61.5 � 0.4 11.0 � 0.7 5.1 � 0.3 7.3 � 0.8 1.8 � 0.2aAverage
Wt 69.5 � 0.3 11.2 � 0.5 5.8 � 0.2 6.9 � 0.6 1.73 � 0.1nst1 62.4 � 0.4 11.3 � 0.6 5.2 � 0.3 8.1 � 0.7 1.76 � 0.2
Results are the means of six stems per line � SE. For each mutant line analyzed, a wild-type (Wt)was grown in parallel.aAverage of the combined data for Wt1, 2 and 3 and nst1-1, -2 and -3.
104 Qiao Zhao et al.
ª 2010 The AuthorsJournal compilation ª 2010 Blackwell Publishing Ltd, The Plant Journal, (2010), 63, 100–114

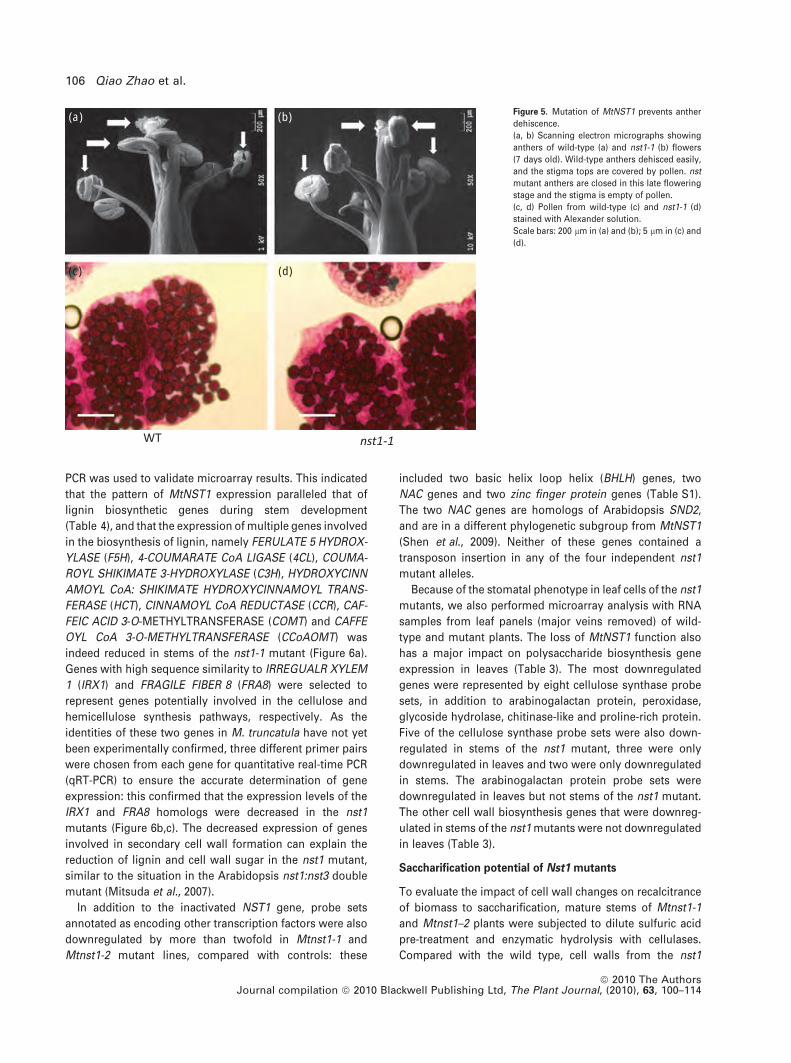
(Mitsuda et al., 2005). Flowers of all four independent Mtnst1
mutants had indehiscent anthers, whereas the pollen grains
are released normally from wild-type anthers (Figures 5a,b
and S11). To examine pollen viability in the nst1 flowers,
Alexander’s staining method was used (Alexander, 1969).
Light microscopy showed that the pollen grains from
Mtnst1-1 take up the stain, and are therefore viable; they
also exhibit normal shape and size (Figure 5c,d). M. trunca-
tula is a self-pollinating species: as a result of the impairment
of anther dehiscence, mature plants of the nst1 mutants
generally failed to develop seed pods, although a few
very small pods were occasionally observed on old plants.
Potential downstream target genes for MtNST1 action
Because of the existence of multiple Tnt1 insertions in the
Medicago mutant lines, the initial microarray analysis by
which the NST1 gene was identified does not provide a
definitive indication of co-regulated or potential down-
stream target genes for NST1 action. We therefore per-
formed a parallel gene expression analysis using RNA from
stems of an independent allele. Of the 152 probe sets that
were downregulated by more than twofold in the nst1-1
mutant compared with its null segregant control, 94 were
also downregulated by more than twofold in the nst1-2
mutant, compared with its null segregant control. Eighteen
probe sets were also upregulated by more than twofold in
both mutant lines (Table S1). In view of the lack of overlap in
additional Tnt1 flanking sequences recovered from the two
lines (data not shown), these genes represent probable tar-
gets for control via NST1. This is further supported by the
observation that the same set of genes with increased or
reduced expression in both the nst1-1 and nst1-2 lines was
also regulated similarly in the independent nst1 point-
mutation line.
Of the common downregulated genes in stems, 12 were
involved in lignin biosynthesis, 17 were putatively involved
in cellulose or hemicellulose biosynthesis, and 14 were
tentatively involved in other aspects of cell wall formation,
or with the cytoskeleton (Table 3). Quantitative real-time
(a) (b)
(c) (d)
(e) (f)
(g) (h)
Figure 4. Stomatal phenotypes of nst1 mutants.
(a, b) Representative picture of leaf epidermal cells in (a) control and (b) the
Mtnst1 mutant. The light-blue autofluorescence signal (typical signals marked
by white arrows) comes from stomatal guard cells.
(c, d) Picture showing differences in stomatal aperture after 2 h of light
induction in (c) control and (d) the Mtnst1 mutant.
(e–h) Coherent anti-Stokes Raman spectroscopy (CARS) microscopy of
epidermal strips from (e, f) the wild type and (g, h) Mtnst1 mutant plants.
The bright signals in the stomatal complexes of wild-type plants are the
Raman bands at 1600 cm)1 originating from ferulate.
Table 2 Stomatal aperture, transpiration rate and photosyntheticrate of independent nst1 insertion mutants
Line
Photosyntheticrate (lmolCO2 m)2 sec)1)
Transpirationrate (mmolH2O m)2 sec)1)
Stomatalaperture
Wt1 13.1 � 0.2 4.5 � 0.1 1.5 � 0.3nst1-1 14.2 � 0.3 3.9 � 0.2 3.6 � 0.3Wt2 14.2 � 0.1 4.1 � 0.2 1.7 � 0.2nst1-2 15.8 � 0.2 3.5 � 0.2 4.6 � 0.3Wt3 14.2 � 0.3 4.3 � 0.1 1.8 � 0.2nst1-3 15.3 � 0.1 3.6 � 0.1 5.2 � 0.3aAverage
Wt 13.8 � 0.2 4.3 � 0.1 1.6 � 0.2nst1/nst1–nst3 15.1 � 0.2 3.6 � 0.2 4.5 � 0.3
Photosynthetic and transpiration rates are the means of six values(three replicates taken on two different days) � SE. The stomatalaperture data (ratio between lengths and widths) are the means of 75stomatal guard cells distributed in three different areas of the filmstrips � SE. For each mutant line analyzed, a wild-type (Wt) wasgrown in parallel.aAverage of the combined data for Wt1, 2 and 3 and nst1-1, -2 and -3.
Medicago NST gene 105
ª 2010 The AuthorsJournal compilation ª 2010 Blackwell Publishing Ltd, The Plant Journal, (2010), 63, 100–114
PCR was used to validate microarray results. This indicated
that the pattern of MtNST1 expression paralleled that of
lignin biosynthetic genes during stem development
(Table 4), and that the expression of multiple genes involved
in the biosynthesis of lignin, namely FERULATE 5 HYDROX-
YLASE (F5H), 4-COUMARATE CoA LIGASE (4CL), COUMA-
ROYL SHIKIMATE 3-HYDROXYLASE (C3H), HYDROXYCINN
AMOYL CoA: SHIKIMATE HYDROXYCINNAMOYL TRANS-
FERASE (HCT), CINNAMOYL CoA REDUCTASE (CCR), CAF-
FEIC ACID 3-O-METHYLTRANSFERASE (COMT) and CAFFE
OYL CoA 3-O-METHYLTRANSFERASE (CCoAOMT) was
indeed reduced in stems of the nst1-1 mutant (Figure 6a).
Genes with high sequence similarity to IRREGUALR XYLEM
1 (IRX1) and FRAGILE FIBER 8 (FRA8) were selected to
represent genes potentially involved in the cellulose and
hemicellulose synthesis pathways, respectively. As the
identities of these two genes in M. truncatula have not yet
been experimentally confirmed, three different primer pairs
were chosen from each gene for quantitative real-time PCR
(qRT-PCR) to ensure the accurate determination of gene
expression: this confirmed that the expression levels of the
IRX1 and FRA8 homologs were decreased in the nst1
mutants (Figure 6b,c). The decreased expression of genes
involved in secondary cell wall formation can explain the
reduction of lignin and cell wall sugar in the nst1 mutant,
similar to the situation in the Arabidopsis nst1:nst3 double
mutant (Mitsuda et al., 2007).
In addition to the inactivated NST1 gene, probe sets
annotated as encoding other transcription factors were also
downregulated by more than twofold in Mtnst1-1 and
Mtnst1-2 mutant lines, compared with controls: these
included two basic helix loop helix (BHLH) genes, two
NAC genes and two zinc finger protein genes (Table S1).
The two NAC genes are homologs of Arabidopsis SND2,
and are in a different phylogenetic subgroup from MtNST1
(Shen et al., 2009). Neither of these genes contained a
transposon insertion in any of the four independent nst1
mutant alleles.
Because of the stomatal phenotype in leaf cells of the nst1
mutants, we also performed microarray analysis with RNA
samples from leaf panels (major veins removed) of wild-
type and mutant plants. The loss of MtNST1 function also
has a major impact on polysaccharide biosynthesis gene
expression in leaves (Table 3). The most downregulated
genes were represented by eight cellulose synthase probe
sets, in addition to arabinogalactan protein, peroxidase,
glycoside hydrolase, chitinase-like and proline-rich protein.
Five of the cellulose synthase probe sets were also down-
regulated in stems of the nst1 mutant, three were only
downregulated in leaves and two were only downregulated
in stems. The arabinogalactan protein probe sets were
downregulated in leaves but not stems of the nst1 mutant.
The other cell wall biosynthesis genes that were downreg-
ulated in stems of the nst1 mutants were not downregulated
in leaves (Table 3).
Saccharification potential of Nst1 mutants
To evaluate the impact of cell wall changes on recalcitrance
of biomass to saccharification, mature stems of Mtnst1-1
and Mtnst1–2 plants were subjected to dilute sulfuric acid
pre-treatment and enzymatic hydrolysis with cellulases.
Compared with the wild type, cell walls from the nst1
(c) (d)
(a) (b) Figure 5. Mutation of MtNST1 prevents anther
dehiscence.
(a, b) Scanning electron micrographs showing
anthers of wild-type (a) and nst1-1 (b) flowers
(7 days old). Wild-type anthers dehisced easily,
and the stigma tops are covered by pollen. nst
mutant anthers are closed in this late flowering
stage and the stigma is empty of pollen.
(c, d) Pollen from wild-type (c) and nst1-1 (d)
stained with Alexander solution.
Scale bars: 200 lm in (a) and (b); 5 lm in (c) and
(d).
106 Qiao Zhao et al.
ª 2010 The AuthorsJournal compilation ª 2010 Blackwell Publishing Ltd, The Plant Journal, (2010), 63, 100–114

Table 3 Cell wall-related genes downregulated by more than twofold in stems and leaves of two independent Medicago truncatula nst1 mutants
Probe set Annotation
Transcript level relative to control
Stem Leaf
nst1-1 nst1-2 nst1-1 nst1-2
Lignin biosynthesisMtr.42553.1.S1_s_at CYP84A1, FAH1 | FAH1 (FERULATE-5-HYDROXYLASE 1); F5H 0.02 0.04 – –Mtr.20710.1.S1_at Cytochrome P450 CYP84A1, FAH1 | FAH1 (FERULATE-5-HYDROXYLASE 1) 0.03 0.05 – –Msa.1740.1.S1_at FAH1 (FERULATE-5-HYDROXYLASE 1) 0.08 0.35 – –Mtr.10628.1.S1_at CYP84A1, FAH1 | FAH1 (FERULATE-5-HYDROXYLASE 1) 0.09 0.31 – –Mtr.39737.1.S1_at LAC17 | LAC17 (laccase 17); copper ion binding 0.18 0.02 – –Mtr.13653.1.S1_at LAC17 (laccase 17); copper ion binding 0.19 0.04 – –Mtr.51876.1.S1_at Peroxidase 64 (PER64) (P64) (PRXR4) e)138 0.28 0.27 – –Mtr.4733.1.S1_s_at Peroxidase 64 (PER64) (P64) (PRXR4) 4e)27 0.28 0.20 – –Mtr.4733.1.S1_at Peroxidase 64 (PER64) (P64) (PRXR4) 4e)27 0.29 0.19 – –Mtr.42734.1.S1_at LAC12 | LAC12 (laccase 12); copper ion binding 0.47 0.19 – –Mtr.4126.1.S1_at LAC17 | LAC17 (laccase 17); copper ion binding 0.48 0.28 – –Mtr.43288.1.S1_at IRX12, LAC4 | IRX12/LAC4 (laccase 4); copper ion binding 0.28 0.23 – –Mtr.14592.1.S1_at Peroxidase – – 0.22 0.24Mtr.40132.1.S1_at Peroxidase – – 0.47 0.42
Cellulose biosynthesisMtr.33788.1.S1_at IRX7, FRA8 | FRA8 (FRAGILE FIBER 8) 0.28 0.41 – –Mtr.50224.1.S1_s_at IRX3 (IRREGULAR XYLEM 3) cellulose synthase 0.36 0.30 0.41 0.46Mtr.40320.1.S1_at IRX7, FRA8 | FRA8 (FRAGILE FIBER 8) 0.38 0.42 – –Mtr.33547.1.S1_at CESA8, IRX1, ATCESA8, LEW2 | CESA8 (CELLULOSE SYNTHASE) 0.42 0.34 – –Mtr.5242.1.S1_at CESA8, IRX1, ATCESA8, LEW2 | CESA8 (CELLULOSE SYNTHASE 8); 4e)65 0.42 0.37 0.32 0.35Mtr.13202.1.S1_at CESA8, IRX1, ATCESA8, LEW2 | CESA8 (CELLULOSE SYNTHASE 8) 0.43 0.36 0.29 0.32Mtr.10615.1.S1_at ATCESA7, CELLULOSE SYNTHASE CATALYTIC SUBUNIT 7, CESA7, IRREGULAR
XYLEM 30.47 0.39 0.44 0.46
Mtr.11798.1.S1_at CESA8, IRX1, ATCESA8, LEW2 | CESA8 (CELLULOSE SYNTHASE 8) 0.48 0.41 0.37 0.37Mtr.37806.1.S1_at CESA4, IRX5, NWS2 | CESA4 (CELLULOSE SYNTHASE A4) – – 0.31 0.35Mtr.5274.1.S1_s_at CESA4, IRX5, NWS2 | CESA4 (CELLULOSE SYNTHASE A4) – – 0.20 0.19Mtr.51462.1.S1_s_at CESA4, IRX5, NWS2 | CESA4 (CELLULOSE SYNTHASE A4) – – 0.24 0.24
Hemicellulose/pectin biosynthesisMtr.39454.1.S1_at ATFXG1 | ATFXG1 (ALPHA-FUCOSIDASE 1) able to release the t–fucosyl residue
from the side chain of xyloglucan0.03 0.09 – –
Mtr.25494.1.S1_at ATGOLS1 | ATGOLS1 (ARABIDOPSIS THALIANA GALACTINOL SYNTHASE 1);transferase, transferring hexosyl groups
0.07 0.39 – –
Mtr.41429.1.S1_at GATL1, PARVUS, GLZ1 | GATL1/GLZ1/PARVUS GALACTURONOSYL TRANSFER-ASE-LIKE 1); polygalacturonate 4-alpha-galacturonosyltransferase/transferase e)169
0.35 0.35 – –
Mtr.41311.1.S1_at GAUT12, LGT6, IRX8 | GAUT12/IRX8/LGT6GALACTURONOSYLTRANSFERASE 12; polygalacturonate 4-alpha-galacturonosyltransferase 3e)163
0.38 0.31 – –
Mtr.30695.1.S1_at GAUT12, LTG6, IRX8 | GAUT12/IRX8/LGT6 GALACTURONOSYLTRANSFERASE 12;polygalacturonate 4-alpha- galacturonosyltransferase
0.39 0.31 – –
Mtr.24892.1.S1_at ATBXL2, BXL2 | BXL2 (BETA-XYLOSIDASE 2); hydrolase involved in secondary wallhemicellulose metabolism
0.43 0.28 – –
Mtr.32451.1.S1_s_at ATBXL2, BXL2 | BXL2 (BETA-XYLOSIDASE 2); hydrolase 0.45 0.28 – –Mtr.38262.1.S1_at IRX14 | IRX14 (IRREGULAR XYLEM 14); glycosyl transferase that contributes to xylan
biosynthesis0.46 0.37 – –
Mtr.5557.1.S1_at Glycosyl hydrolase family 3 protein 1e)68 same family as bxl2 and bxl3 0.49 0.47 – –Other cell wall related
Mtr.10992.1.S1_at Arabinogalactan protein like – – 0.11 0.10Mtr.15775.1.S1_at Glycoside hydrolase – – 0.39 0.36Mtr.24717.1.S1_s_at Arabinogalactan protein-like – – 0.32 0.33
CytoskeletonMtr.35578.1.S1_at ATMAP70-2, F5A9.19, F5A9_19, MICROTUBULE-ASSOCIATED PROTEIN 70-2 0.39 0.35 – –Mtr.44524.1.S1-at ARPC2B | ARPC2B (actin-related protein C2B), structural molecule; similar to
ARPC2A/DIS2 (DISTORTED TRICHOMES 2)0.41 0.35 – –
Mtr.39566.1.S1_at Kinesin light chain-related 0.43 0.41 – –Mtr.39117.1.S1_at Kinesin light chain-related 0.43 0.39 – –Mtr.18524.1.S1_at KATC, ATK3 | ATK3 (ARABIDOPSIS THALIANA KINESIN 3); microtubule motor 0.46 0.36 – –
Medicago NST gene 107
ª 2010 The AuthorsJournal compilation ª 2010 Blackwell Publishing Ltd, The Plant Journal, (2010), 63, 100–114

mutants released more glucose and less xylose during
sulfuric acid pre-treatment (Figures 7a and S12). Without
pre-treatment, the cellulase mixture could release 64% of the
structural sugars from the nst1-1 mutant, significantly
higher than in the wild type (46%). Following acid
pre-treatment, enzymatic hydrolysis could release 90% of
the total sugars (723 mg sugar per gram of cell wall residue)
from nst1-1 compared with 67% (572 mg sugar per gram cell
wall residue) from the wild type (Figure 7b). Similar results
were obtained with a second allele (nst1-2) (Figure S12).
DISCUSSION
Loss of function of a single NAC gene impacts lignification
in Medicago
We have identified an NAC family transcription factor,
MtNST1, from UV microscopy-based screening for second-
ary cell wall formation defects in an M. truncatula mutant
collection generated by tobacco Tnt1 retrotransposon
insertion mutagenesis. Four independent nst1 mutants all
show secondary cell wall formation defects in stems, anther
dehiscence defects, and reduced ferulic acid fluorescence in
stomatal guard cell walls. The nst1 mutants phenocopy the
recently reported Arabidopsis nst1:nst3 double mutant and
nst1:nst2 double mutant, as regards the stem and anther
phenotypes, respectively (Mitsuda et al., 2007; Zhong et al.,
2007), but the guard cell phenotype has not been reported
previously.
Unlike Arabidopsis, which contains three partially redun-
dant NST genes, M. truncatula only appears to possess one
NST gene. M. truncatula NST1 shares high sequence sim-
ilarity with its Arabidopsis counterparts, but only in the
conserved N-terminal NAC domain. A recently published
phylogenetic analysis of 1232 NAC proteins from 11 different
plants places the proteins into eight subfamilies, which are
then divided into different clades based on motif patterns in
the highly diverse C-terminal regions (Shen et al., 2009).
MtNST1 and the three Arabidopsis NST proteins all fall into
the NAC-c subfamily, subgroup c-3. Interestingly, Medicago
is the only organism with a single representative NAC
protein in the C-3 subfamily.
The M. truncatula nst1 mutants have severe secondary
wall biosynthesis defects, whereas none of the single
Arabidopsis NST gene knock-outs shows such phenotypes.
Redundancy appears to be a common theme for other
genes involved in cell wall component biosynthesis. For
example, 10 CesA (cellulose synthase) genes are present in
Arabidopsis, and poplar has 18 (Djerbi et al., 2005; Keegstra
and Walton, 2006). At least nine cinnamyl alcohol dehy-
drogenase (CAD) enzymes catalyzing reduction of various
phenylpropenyl aldehyde derivatives in lignin biosynthesis
have been functionally characterized in Arabidopsis (Kim
et al., 2004). Arabidopsis CAD4 and CAD5 are functionally
redundant, and only a double knock-out shows striking
lignin reduction (Sibout et al., 2005). A cad1 mutant from
M. truncatula shows severe lignin reduction when the
single gene is disrupted, indicating that, like MtNST1,
CAD1 also does not have a second functionally redundant
gene family member in Medicago (Q. Zhao, F. Chen and
R.A. Dixon, unpublished data). Overall, however, phenyl-
propanoid pathway gene families are as complex, or more
complex, in Medicago than in Arabidopsis: for example,
Arabidopsis possesses a single functional chalcone syn-
thase (CHS) gene, whereas the Medicago CHS gene family
contains at least 23 members.
MtNST1 orchestrates cell wall synthesis in multiple cell
types
Based on the microarray analysis of gene expression pat-
terns at different developmental stages of stems, MtNST1 is
expressed at a very low level in early stages, when most cells
are still dividing and expanding. The expression level
increases as cells mature, in parallel with the expression of
lignin biosynthetic genes.
Knock-out of MtNST1 appears to block the development
of secondary cell walls in the interfasicular region of the
stem, and in the phloem fibers, and may also lead to a
reduction of total lignin in xylem vessel cell walls. However,
the loss of fluorescence and ferulate-related CARS signal
from the guard cell walls in all of the nst1 mutants suggests
that NST1 may also control modification of primary cell
walls in guard cells. Substitution of the arabinan portion of
pectin with ferulic acid is essential for providing the neces-
sary physical properties to guard cell walls, to allow for the
expansion and contraction necessary for stomatal opening
and closing (Jones et al., 2003), and the removal of ferulates
Table 4 Quantitative real-time PCR analy-sis of NST1 and lignin pathway genetranscripts in Medicago truncatula steminternodes at different developmentalstages (from 50-day-old plants)
Probe set Annotation
Relativetranscript levelInternode 2 Internode 3 Internode 5
Mtr.33913.1.S1_at NST1 41 � 0.9 131 � 28 477 � 68Mtr.40238.1.S1_at HCT 3315 � 187 5108 � 971 15 782 � 1155Mtr.13904.1.S1_at 4CL 19 � 2 33 � 7 580 � 101Mtr.8589.1.S1_at CAD 1437 � 317 2601 � 498 8704 � 302Mtr.43183.1.S1_at C3H 3603 � 355 5274 � 579 8792 � 285
Transcript level is expressed relative to actin.
108 Qiao Zhao et al.
ª 2010 The AuthorsJournal compilation ª 2010 Blackwell Publishing Ltd, The Plant Journal, (2010), 63, 100–114

from guard cell walls by incubation of epidermal strips with
feruloyl esterase results in an inability of guard cells to open
properly (Jones et al., 2005). This is exactly mirrored by the
phenotype of the nst1 mutants, in which guard cell aperture
is dramatically reduced.
The CARS analysis provides spatial and semi-quantitative
information on ferualte levels in the stomatal complex.
Direct measurement of pectin-linked ferulate levels in guard
cells of nst1 mutants, compared with wild-type M. trunca-
tula will probably require laser capture microdissection,
a technique that we have recently used for analysis of
cell type-specific deposition of lignin in transgenic alfalfa
(Nakashima et al., 2008).
The lack of significant reduction in the total leaf wall-
bound ferulate pool in the nst1 mutants, despite the total
loss of guard cell wall fluorescence, can be readily
explained by the low frequency of guard cells in the
samples. This would also explain our inability to detect
changes in pectin-related cell wall biosynthetic gene tran-
scripts in microarray analysis of transcripts from whole leaf
panels. It is possible that the loss of function of MtNST1 also
leads to a loss of wall-bound ferulate in the interfascicular
region of the stem: this would not be observed because of
the massive autofluorescence from lignin in wild-type
plants.
We cannot rule out the possibility that the reduction in the
stomatal aperture response in nst1 mutants might also
result from disruptions to other cell wall components, such
as cellulose, as suggested by the downregulation of a
Arabinose Galactose
150
200
250(a)
(b)
Xylose Glucose
0
50
100
WT nst1-1
Mon
osac
char
ide
rele
ased
(m
g g–1
CW
R)
Manose Galactose
GlucoseXylose
Mon
osac
char
ide
rele
ased
(mg
g–1 C
WR
)WT nst1-1 WT nst1-1
No pretreatment With pretreatment
700
600
500
400
300
200
100
0
Figure 7. Sugar release from cell walls of wild-type Medicago truncatula and
the nst1-1 mutant by chemical and enzymatic saccharification.
(a) Saccharification efficiencies after dilute acid pre-treatment.
(b) Enzymatic saccharification efficiencies with and without acid pre-treat-
ment.
0.8
1
1.2
0WT
Nor
mal
ized
rel
ativ
e tr
ansc
ript l
evel
WT
F5H
HCT
CCR
C3H
4CL
CCOMT
C4H
COMT
nst1-1 nst1-2
0.1
0.2
0.3
0.4
0.5
0.6
0.7(a)
(b)
(c)
1
0
0.2
0.4
0.6
Nor
mal
ized
rel
ativ
e tr
ansc
ript l
evel
2
3
4
IRX1-1 IRX1-2 IRX1-3
0.2
0.04
0.08
0.12
0.16 1
2
3
4
0FRA8-1 FRA8-2 FRA8-3
Nor
mal
ized
rel
ativ
e tr
ansc
ript l
evel
Figure 6. Levels of cell wall biosynthetic gene transcripts in the wild type and
nst1-1 and nst1-2 mutants, as determined by quantitative real-time PCR (qRT-
PCR).
(a) Expression of genes related to lignin biosynthesis. Data are means and
SDs of triplicate assays.
(b, c) Expression of putative IRX1 (b) and FRA8 (c) genes. Transcript levels
were measured with three different primer pairs. Data are means and SDs of
triplicate assays.
In (b) and (c), 3 and 4 are data for nst1-1 and nst1-2, respectively, and 1 and 2
are the corresponding control lines.
Medicago NST gene 109
ª 2010 The AuthorsJournal compilation ª 2010 Blackwell Publishing Ltd, The Plant Journal, (2010), 63, 100–114

specific class of putative cellulose synthase genes in nst1
mutant leaves.
Potential downstream targets for NST1 action
In addition to the downregulation of over fifty genes
involved in the biosynthesis of the major components of the
secondary cell wall, genes encoding six putative transcrip-
tion factors were either down- or upregulated in stems of
two independent Mtnst-1 mutant lines. Previous work from
Arabidopsis has suggested that NST genes function as
master switches of a transcriptional network involved in the
regulation of secondary wall biosynthesis, and several
transcription factors have been shown to be regulated by
NST genes (Zhong et al., 2008; Zhou et al., 2009). Among the
six transcription factors with modified expression in the nst1
mutants, one is the homolog of AtMYB103, which was pre-
viously reported to be regulated by AtNST1 and NST3 (Zhou
et al., 2009). The other transcription factors include two NAC
genes, two Dof-type zinc finger domain-containing genes
and one homeobox gene. These could potentially control
downstream branches of the secondary wall biosynthesis
pathway in Medicago. For example, the two NAC genes
downregulated as a result of loss of MtNST1 function are
homologs of AtSND2, which is a downstream target of NST1
in Arabidopsis (Zhong et al., 2008). The zinc finger and
homeodomain genes represent novel candidates for cell
wall regulation.
The transcript levels of two putative laccases were
decreased as a result of the NST1 downregulation in stems.
An additional microarray analysis using RNA samples from
different developmental stages indicates that the two lac-
cases exhibit a similar expression pattern to that of lignin
biosynthetic genes (H. Wang, Q. Zhao, F. Chen and R.A.
Dixon, unpublished data). Despite many years of effort, no
specific laccase genes have been unequivocally demon-
strated to be involved in lignin polymerization. The finding
that the two laccases are regulated by MtNST1, and that they
have similar developmental expression patterns as lignin
genes, suggests that both laccases are potentially involved
in lignin polymerization.
MtNST1 as a target for development of alfalfa as a
bioenergy crop
Mutation of MtNST1 in M. truncatula resulted in the aboli-
tion of lignification in interfascicular and phloem fibers, and
is likely to affect other aspects of secondary cell wall syn-
thesis in these fiber cells. Cell wall xylose levels were sig-
nificantly reduced, which probably reflects changes in the
hemicellulose component of the secondary cell wall. The
overall consequence of these changes in cell wall composi-
tion is that the mutant is more amenable to chemical and
enzymatic treatment for release of sugars for ethanol
fermentation. Whereas the lower level of xylose in the
pre-treatment hydrolysate is likely to result from impaired
biosynthesis of hemicelluloses in nst1 mutants, the
increased glucose content may be caused by the decreased
crystalinity of cellulose.
Knock-out of NST1 in M. truncatula greatly improved the
enzymatic hydrolysis efficiency of cell walls with or without
acid pre-treatment. Similar to our previous report on
transgenic plants modified in the monolignol biosynthetic
pathway (Chen and Dixon, 2007), the sugar release effi-
ciency of cell walls from mutants that were not pre-treated
is close to that of the pre-treated wild type cell walls. Recent
studies indicate that biomass from NST-downregulated
Arabidopsis plants is approximately twice as efficiently
processed by enzymatic and physicochemical treatments as
is biomass from control plants (Iwase et al., 2009). The fact
that the walls from the mutants are more responsive to
chemical and enzymatic treatment suggests that milder pre-
treatment or lower enzyme loading could be used to release
sugar from these materials. Although there is a small
overall reduction in cell wall polysaccharide in the Mtnst1
mutants, this is more than compensated for as regards
saccharification yields by the reduction in lignin content.
Furthermore, the growth reductions observed in lines
harboring a complete knock-out of NST1 are significantly
less than those observed in transgenic plants, in which
saccharification efficiency is similarly improved through the
knock-down of monolignol biosynthetic enzymes (Chen and
Dixon, 2007).
Our results clearly demonstrate the potential of NST1 as a
target for genetic engineering of plant cell walls for bioen-
ergy feedstock improvement. Furthermore, NST1 downre-
gulation has the added advantage (from the transgenic
release perspective) of resulting in pollen containment, and
the consequent lack of seed production in the self-pollinat-
ing M. truncatula resulting from the impairment of anther
dehiscence; it is, however, easy to obtain pollen for crossing
during breeding through manual dehiscence of the anthers.
Full exploitation of nst1 mutants for bioenergy and/or forage
crop development might, however, require crossing into
lodging tolerant genetic backgrounds to compensate for the
weakened stems as a result of the blocked development of
the fiber cell walls.
EXPERIMENTAL PROCEDURES
Plant materials and growth conditions
A tobacco (Nicotiana tabacum) Tnt1 retrotransposon-taggedmutant collection of M. truncatula (Tadege et al., 2005, 2008) wasscreened for defects in secondary cell wall formation. Plants weregrown in MetroMix 350 soil mix at 24�C during the day and 20�Cduring the night, with a 16-h day/8-h night photoperiod, 70–80%relative humidity, and 150 lmol m)2 sec)1 light intensity. Sixthinternodes of each plant were harvested when the plants hadreached around eight internodes, and were stored at )80�C.
Four nst1 alleles were identified from forward and reverse geneticscreening of a segregating population of just over 9000 independentR1 lines.
110 Qiao Zhao et al.
ª 2010 The AuthorsJournal compilation ª 2010 Blackwell Publishing Ltd, The Plant Journal, (2010), 63, 100–114

Identification and molecular cloning of MtNST1
To identify the gene that is linked to the lack-of-lignification phe-notype, total RNA samples from fifth to eighth internodes weresubjected to Affymetrix microarray analysis, as described below.Segregating progeny without the loss-of-lignification phenotypefrom the same parent plant as the mutants were used as control.Downregulated probe sets were chosen as candidates for RT-PCRanalysis, prioritized in order of the extent of downregulation, ascompared with lines segregating with the wild-type phenotype.PCR was performed using Tnt1 (forward primer, 5¢-TCCTTGTTGGATTGGTAGCCAACTTTGTTG-3¢; reverse primer, 5¢-AGTTGGCTACCAATCCAACAAGGA-3¢) and gene specific primers to confirm thatthe insertion was linked to the phenotype.
To clone the full-length NST1 gene, BLAST analysis of theM. truncatula genome from DFCI (http://compbio.dfci.harvard.edu/tgi/cgi-bin/tgi/gimain.pl?gudb=medicago) was performed usingMtr.33913.1.S1_at as the query probe sequence: this led to a partialcDNA sequence. The sequence was completed by 3¢ RACE using theSMART RACE cDNA Amplification Kit (Clontech, http://www.clon-tech.com) using the NST1 forward primer (5¢-CCCTAGACAGCCCTTCTGGAGAGGGAAGAAGAAGCC-3¢) to complete the 3¢ end ofthe NST1 cDNA. The NST1 genomic sequence was also PCRamplified and sequenced from M. truncatula ecotype R108.
To confirm NST1 as the disrupted gene causing the lignificationphenotype, reverse genetic screening was performed to uncoveradditional alleles. Genomic DNA was extracted from individual linesand pooled together with 500 independent lines, contributing to onesuper pool. PCR screening of superpools, and subsequently thescreening of smaller pools to individual lines, was performed usingthe Tnt1 forward primer 5¢-TCCTTGTTGGATTGGTAGCCAACTTT-GTTG-3¢, the Tnt1 reverse primer 5¢-AGTTGGCTACCAATCCAACA-AGGA-3¢ and two pairs of NST1 gene-specific primers.
Sequence comparisons
MEGALIGN protein alignment software (DNASTAR, http://www.dnastar.com) was used for multiple sequence alignmentsusing the CLUSTAL algorithm.
Identification of Tnt1 insertion sites in MtNST1
The Tnt1 flanking sequences from the nst1-1, nst1-2, nst1-3 andnst1-4 alleles were PCR amplified using a combination of the NST1forward primer (5¢-ATGCCTGATAACATGAGTATATCTGTTAATG-GAC-3¢) and the Tnt1 primer above. The PCR product sequenceswere aligned with the NST1 genomic DNA sequence to determinethe retrotransposon insertion sites.
Phenotypical analysis and physiological measurements
All measurements were performed on plants of M. truncatula at thetime when the first flower appeared. Six stems were harvested foreach line. The number and lengths of internodes and total stemlength were recorded, and their means analyzed in EXCEL (Microsoft,http://www.microsoft.com). Leaf area was measured using aLI-3000A portable area meter (LI-COR, http://www.licor.com), andstem diameter was measured using an automatic calibrator (FisherScientific, http://www.fishersci.com).
Photosynthesis and transpiration rates were determined using anLI-6400 infra-red CO2 gas analyzer (LI-COR). Cylinders of pre-mixedgases were supplied by LI-COR. Measurements were made at a lightintensity of 600 lmol m)2 sec)1, a leaf temperature of 22�C and avapor pressure deficit of 0.7 kPa. A fluorescence chamber head(Li-6400-40; LI-COR) was integrated with the LI-6400 open gasexchange system to measure steady-state fluorescence (F¢s) and
maximum fluorescence during a light-saturating pulse (F¢m). Thephotochemical quantum yield of electron transport throughphotosystem II (PSII) was calculated as FPSII = (F¢m)F¢s)/F¢m (Gentyet al., 1989). All measurements were performed on two differentdays from 11:00 until 13:00 h in the glasshouse chamber.
Scanning electron microscopy
Samples were vacuum infiltrated with 3% glutaraldehyde in 1xPBSovernight at 4�C, then washed four times with fresh PBS solution.Post-fixation was in 1% osmiun tetroxide in H2O for 2 h on ice,followed by washing in fresh PBS solution. Samples were dehy-drated in an ethanol series from 50 to 100%, then placed in 100%tert-butanol and freeze dried. Dried samples were mounted onaluminum stubs, and petals of individual flowers were removedmanually. The samples were then sputter-coated with gold palla-dium. Flower structures were examined under a Zeiss DSM-960ASEM at an accelerating voltage of 5 kV. Digital photographs werecollected and assembled using PHOTOSHOP (Adobe, http://www.adobe.com).
Analysis of stomata
Epidermal cells strips were peeled with nail varnish from matureleaves of 8-week-old plants. The thin film was peeled off from theleaf surface, mounted on a glass slide and observed under themicroscope. For measurement of stomatal opening, the plants werekept at 20�C in the dark for 1 h, and then transferred to light for 2 h.Epidermal cell film strips were taken under both conditions, andobserved directly under the microscope. Strips harvested during thedark phase were kept in 10 mM KCl, and those harvested in the lightwere kept in 75 mM KCl. Stomatal aperture was defined as the ratiobetween the length and the width of guard cells (in lm). A ratio of 1indicates the maximum opening potential of the stomatal pore.Length analysis was performed using IMAGEJ (http://rsbweb.nih.gov/ij).
For CARS microscopy, we used a mode-locked Nd:VAN laser(High Q Laser, Inc., http://www.highqlaser.at) to generate 7-ps,76-MHz pulse trains of both 1064- and 532-nm laser beams. The1064-nm beam was used directly as the Stokes beam. The 532-nmbeam pumped an optical parametric oscillator (OPO) (LevanteEmerald; APE-Berlin, http://www.ape-berlin.de) to generate theCARS pump beam. The pump beam was tuned to 910 nm toeffectively detect the 1600-cm)1 Raman band. Collinear andtemporally overlapped pump and Stokes beams were focusedonto the sample by an Olympus UPlanSapo 60· water immersionobjective (http://www.olympus-global.com). Epidermal layers ofthe leaves were carefully peeled off and spread out between twocoverslips. The CARS images of ferulate in this epidermal layerwere obtained at 1600 cm)1 on an Olympus IX 81 microscope. Thefocused beams were raster scanned over the sample. The anti-Stokes light was collected from the Epi-direction and filtered by aclean-up filter 800/40 (Thorlabs, http://www.thorlabs.de). Eachtime, an off-resonance image at 1550 cm)1 was also acquiredand subtracted from the 1600 cm)1 image to remove the non-resonance background.
Fluorescence microscopy
The second to fifth internodes, counting from the top of stems, ofwild-type M. truncatula and nst1 mutants were cross-sectioned to100 lm using a Leica RM 2255 Microtome (http://www.leica.com).For UV-fluorescence microscopy, the UV intensity was kept con-stant between samples. Sections were observed under the NikonMicrophot-FX system with a Nikon DXM 1200 color camera (http://www.nikon.com).
Medicago NST gene 111
ª 2010 The AuthorsJournal compilation ª 2010 Blackwell Publishing Ltd, The Plant Journal, (2010), 63, 100–114

Pollen staining
To determine pollen viability, flowers were picked at similar stagesfrom wild-type and nst1 mutant M. truncatula. Entire flowers wereincubated in Carnoy’s fixative for 1 h at room temperature, and thentransferred to Alexander solution (Alexander, 1969) for 4 h at roomtemperature. The flowers were then de-stained in 10% glycerol for30 min prior to observation.
Microarray analysis
Total RNA was isolated with Tri-reagent according to the manu-facturer’s protocol (Invitrogen, http://www.invitrogen.com). RNAwas prepared from stem or leaf tissue from 2-month-old plants.Veins were removed from leaf tissue prior to RNA isolation. RNAwas cleaned and concentrated using the RNeasy MinElute CleanupKit (Qiagen, http://www.qiagen.com) and 10 lg of purified RNA wasused for microarray analysis of three biological replicates. In bothstem and leaf microarrays, RNA was isolated from two independentmutant alleles (nst1-1 and nst1-2). Probe labeling, hybridization andscanning for microarray analysis were conducted according to themanufacturer’s instructions (Affymetrix, http://www.affyme-trix.com). Data normalization was conducted using robust multi-chip average (RMA) (Irizarry et al., 2003). The presence/absence callfor each probe set was obtained from dCHIP (Li and Wong, 2001).Genes with significantly different expression levels between thewild-type control and mutants were selected using associativeanalysis, as described by Dozmorov and Centola (Dozmorov andCentola, 2003). The type-I family-wise error rate was reduced byusing a Bonferroni corrected P-value threshold of 0.05/N, where Nrepresents the number of genes present on the chip. The false dis-covery rate was monitored and controlled by Q value (false dis-covery rate), calculated using Extraction of Differential GeneExpression (EDGE, http://www.biostat.washington.edu/software/jstorey/edge) (Storey and Tibshirani, 2003; Leek et al., 2006).
Real-time PCR
cDNA samples were used for qRT-PCR, with technical duplicates.The 10-ll reaction included 2 ll of primers (0.5 lM of each primer),5 ll Power Sybr (Applied Biosystems, http://www.appliedbiosys-tems.com), 2 ll of 1:20 diluted cDNA from the reverse transcriptionstep and 1 ll of water. qRT-PCR data were analyzed using SDS 2.2.1(Applied Biosystems). The PCR efficiency was estimated using LIN-
REGPCR (Ramakers et al., 2003), and the transcript levels weredetermined by relative quantification (Pfaffl, 2001) using theM. truncatula actin gene as a reference.
Determination of lignin content and composition
The lignin content of stem material (internodes 5–8) was deter-mined by the acetyl bromide method using �15 mg of extractive-free material (Hatfield et al., 1999). The same molar extinctioncoefficient of 17.2 (as determined for lignin from wild-type alfalfa)was used for samples of all the transgenic lines.
Lignin composition was determined by thioacidolysis (Lapierreet al., 1985, 1995). Approximately 15–20 mg of extractive-freesamples was reacted with 15 ml of 0.2 M BF3 etherate in an 8.75:1dioxane/ethanethiol mixture. Lignin-derived monomers were iden-tified by gas chromatography mass spectrometry (GC/MS), andquantified by GC as their trimethylsilyl derivatives. GC/MS wasperformed on a Hewlett-Packard 5890 series-II gas chromatographwith a 5971 series mass selective detector (column:HP-1;60 m · 0.25 mm; 0.25-lm film thickness; http://www.hp.com), andmass spectra were recorded in electron impact mode (70 eV) with a60–650 m/z scanning range.
Profiling of soluble and wall-bound phenolics
Glasshouse-grown stem samples were collected from two inde-pendent mutant alleles (nst1-1 and nst1-2). The top second to ninthstem internodes were harvested from three individual mutants andcorresponding heterozygous control plants, and ground underliquid nitrogen. For soluble phenolics, freeze-dried samples (100 mg)were incubated with 2 ml of chloroform/methanol (2:1, v/v) at roomtemperature overnight with gentle shaking. The samples wereincubated on the shaker for another 4 h at room temperature. Aftercentrifugation at 12 000 g for 10 min, the supernatant (methanol/water fraction) was taken for HPLC profiling of soluble phenolics.
For analysis of wall-bound phenolics, the cell wall residues werefurther extracted with 100% methanol, 50% methanol and water(three times each), and then freeze dried. Freeze-dried cell wallresidue (60 mg) was hydrolyzed with aqueous 2 N NaOH (1.8 ml) at37�C for 5 h in the dark. The mixtures were acidified to pH 3 with 1:1(v/v) HCL (600 ll). After extraction with ethyl acetate (1.6 ml · 3),the combined organic phases were dried under a stream of N2 andre-suspended in 300 ll 70% methanol for HPLC analysis.
Compounds were identified by comparing the UV spectra andretention times with those of authentic standards, and quantified bymeans of standard curves. HPLC was carried out on a BeckmanSystem Gold HPLC system, consisting of a programmable solventmodule 126, a System Gold 508 autosampler and a System Gold 168diode array detector (http://beckman-coulter.com). A PhenomenexLuna 5l C18 reverse phase column (5-lm particle, 250 · 4.6 mm)was used (http://www.phenomenex.com): solvent A, 0.1% phos-phoric acid in water; solvent B, acetonitrile. The gradient for solublephenolics was: 8% B for 1 min; 8% B to 35% B in 45 min; at 46 min, Bfrom 35% to 100% in 1 min. The gradient for wall-bound phenolicswas: 8% B for 1 min; 10% B to 27% B in 50 min; at 51 min, B from27% to 100% in 1 min.
Analysis of cell wall sugar levels and composition
The determination of carbohydrates was conducted according tothe Laboratory Analytical Procedure of the National RenewableEnergy Laboratory (LAP-019). Biomass (�300 mg) was first hydro-lyzed in 72% sulfuric acid at 30�C, then in dilute acid (4%) at 130�C for1 h. The solubilized sugars were analyzed spectrophotometricallyusing the phenol-sulfuric acid assay (Dubois et al., 1956). Mono-saccharide compositions were determined by HPLC (Agilent 1200Series LC System with 1200 Series Refractive Index Detector; Agi-lent, http://www.chem.agilent.com). An Aminex HPX-87P columnwas used at 70�C, and the sugars were eluted with Milli-Q filteredwater at a flow rate of 0.6 ml min)1. The detector temperature was50�C. Peaks were identified and quantified by comparison withauthentic standards.
Chemical pre-treatment and enzymatic saccharification
Dried stem material at a solid loading of 2% (w/w) was mixed withdilute sulfuric acid (final concentration 1.5%, w/w) and pre-treated inan autoclave at 130�C for 2 h. After pre-treatment, the hydrolysateswere separated and collected by filtration from residual biomass,and the biomass residues were washed with water. For enzymatichydrolysis, Celluclast 1.5 L (cellulase from Trichoderma reesei) andNovozyme 188 (cellobiase from Aspergillus niger) (Sigma-Aldrich,http://www.sigmaaldrich.com) were mixed (equal volumes) andused at a loading of 31.5 filter paper units per g cell wall residue.Enzymatic saccharification of lignocellulosic material was per-formed according to the Laboratory Analytical Procedure of theNational Renewable Energy Laboratory (LAP-009). About 0.125 mgof cell wall residues were hydrolyzed with a cellulase/cellobiasemix in a total volume of 10 ml by adding appropriate quantities of
112 Qiao Zhao et al.
ª 2010 The AuthorsJournal compilation ª 2010 Blackwell Publishing Ltd, The Plant Journal, (2010), 63, 100–114

enzyme mixture and sodium citrate buffer (0.1 M, pH 4.8) for 72 h.Enzyme blanks and Whatman #1 filter paper were digested along-side the samples (http://www.whatman.com). Hydrolysis of filterpaper was always more than 95%. The total sugar and sugar com-position in hydrolysates from chemical pre-treatment and enzy-matic hydrolysis were determined using the phenol-sufuric acidassay and HPLC, as described above.
ACKNOWLEDGEMENTS
We thank Lisa Jackson, Gail Shadle, and Liying Qi for assistancewith mutant screening and lignin analyses, Drs Jiangqi Wen andXiaofei Cheng for forward and reverse genetic screening, DrYuhong Tang for microarray analysis, and Drs Jin Nakashima,Elison Blancaflor and Li Quan for help with pollen staining andlight microscopy, Dr Scott Russell (University of Oklahoma) forassistance with SEM analysis, and Drs Rujin Chen, CatalinaPislariu and Jianghua Chen for their critical reading of themanuscript. The M. truncatula plants utilized in this researchproject, which are jointly owned by the Centre National de laRecherche Scientifique, Gif-sur-Yvette, France, and the SamuelRoberts Noble Foundation, Ardmore, OK, USA, were createdthrough research funded, in part, by grant 703285 from theNational Science Foundation. This work was supported by grantsto RAD from the USDA-DOE Feedstock Genomics program (awardnumber DE-FG02-06ER64303) and the State Regents of Oklahoma(Oklahoma Bioenergy Center), the US Department of EnergyBioenergy Research Centers, through the Office of Biological andEnvironmental Research in the DOE Office of Science, and by theSamuel Roberts Noble Foundation.
SUPPORTING INFORMATION
Additional Supporting Information may be found in the onlineversion of this article:Figure S1. Cell wall phenotypes of Tnt1 mutants.Figure S2. Cross sections of the sixth internodes of wild-type andnst1-1 Medicago truncatula, showing the phloem tissues.Figure S3. Protein sequence alignments of MtNST1 with Arabidop-sis NST3.Figure S4. Lignin deposition defects in additional independent nst1mutants.Figure S5. Thioacidolysis yields of individual lignin monomers fromstems of wild-type and nst1 mutant Medicago truncatula.Figure S6. Wall-bound phenolic content of wild-type and nst1mutant Medicago truncatula.Figure S7. HPLC profiles of soluble phenolic compounds in wild-type and nst1 mutant Medicago truncatula.Figure S8. Stem phenotypes of wild-type and nst1 mutant Medicagotruncatula.Figure S9. Stem growth of control and Medicago nst1 mutant lines.Figure S10. Guard cell phenotypes of homozygous and heterozy-gous nst-1 mutant alleles.Figure S11. High magnification SEM pictures of wild-type and nst1mutant flower parts.Figure S12. Sugar release from cell walls of wild-type Medicagotruncatula and the nst1-2 mutant by chemical and enzymaticsaccharification.Table S1. Genes that are up- and downregulated by more thantwofold in two independent nst1 mutants, compared with the wildtype.Please note: As a service to our authors and readers, this journalprovides supporting information supplied by the authors. Suchmaterials are peer-reviewed and may be re-organized for onlinedelivery, but are not copy-edited or typeset. Technical support
issues arising from supporting information (other than missingfiles) should be addressed to the authors.
REFERENCES
Alexander, M.P. (1969) Differential staining of aborted and nonaborted pollen.
Stain Technol. 44, 117–122.
Benedito, V.A., Torres-Jerez, I., Murray, J.D. et al. (2008) A gene expression
atlas of the model legume Medicago truncatula. Plant J. 55, 504–513.
Boerjan, W., Ralph, J. and Baucher, M. (2003) Lignin biosynthesis. Annu. Rev.
Plant Biol. 54, 519–546.
Carroll, A. and Somerville, C. (2009) Cellulosic biofuels. Annu. Rev. Plant Biol.
60, 165–182.
Chen, F. and Dixon, R.A. (2007) Lignin modification improves fermentable
sugar yields for biofuel production. Nat. Biotechnol. 25, 759–761.
Chen, F., Reddy, M.S.S., Temple, S., Jackson, L., Shadle, G. and Dixon, R.A.
(2006) Multi-site genetic modulation of monolignol biosynthesis suggests
new routes for formation of syringyl lignin and wall-bound ferulic acid in
alfalfa (Medicago sativa L.). Plant J. 48, 113–124.
Djerbi, S., Lindskog, M., Arvestad, L., Sterky, F. and Teeri, T.T. (2005) The
genome sequence of black cottonwood (Populus trichocarpa) reveals 18
conserved cellulose synthase (CesA) genes. Planta, 221, 739–746.
Dozmorov, I. and Centola, M. (2003) An associative analysis of gene expres-
sion array data. Bioinformatics, 19, 204–211.
Dubois, M., Gilles, K.A., Hamilton, J.K., Rebers, P.A. and Smith, F. (1956)
Colorimetric method for determination of sugars and related substances.
Anal. Chem. 28, 350–356.
Fukushima, R.S. and Hatfield, R.D. (2004) Comparison of the acetyl bromide
spectrophotometric method with other analytical lignin methods for
determining lignin concentration in forage samples. J. Agric. Food. Chem.
52, 3713–3720.
Genty, B., Briantais, J.M. and Baker, N.R. (1989) The relationship between the
quantum yield of photosynthetic electron transport and quenching of
chlorophyll fluorescence. Biochim. Biophys. Acta, 990, 87–92.
Hatfield, R.D., Ralph, J. and Grabber, J.H. (1999) Cell wall structural founda-
tions: molecular basis for improving forage digestibilities. Crop Sci. 39,
27–37.
Helene, B., Olivier, R., Christelle, R., Michel, P., Claude, D. and Christophe, B.
(2008) Analytical methodologies for quantification of ferulic acid and its
oligomers. J. Sci. Food Agric. 88, 1494–1511.
Irizarry, R.A., Bolstad, B.M., Collin, F., Cope, L.M., Hobbs, B. and Speed, T.P.
(2003) Summaries of Affymetrix GeneChip probe level data. Nucleic Acids
Res. 31, e15.
Iwase, A., Hideno, A., Watanabe, K., Mitsuda, N. and Ohme-Takagi, M. (2009)
A chimeric NST repressor has the potential to improve glucose productivity
from plant cell walls. J. Biotech. 42, 279–284.
Jones, L., Milne, J.L., Ashford, D.A. and McQueen-Mason, S.J. (2003) Cell wall
arabinan is essential for guard cell function. Proc. Natl Acad. Sci. USA, 100,
11783–11788.
Jones, L., Milne, J.L., Ashford, D.A., McCann, M.C. and McQueen-Mason, S.J.
(2005) A conserved functional role of pectic polymers in stomatal guard
cells from a range of plant species. Planta, 221, 255–264.
Keegstra, K. and Walton, J. (2006) Plant science. Beta-glucans – brewer’s
bane, dietician’s delight. Science, 311, 1872–1873.
Kim, S.J., Kim, M.R., Bedgar, D.L., Moinuddin, S.G., Cardenas, C.L., Davin,
L.B., Kang, C. and Lewis, N.G. (2004) Functional reclassification of the
putative cinnamyl alcohol dehydrogenase multigene family in Arabidop-
sis. Proc. Natl Acad. Sci. USA, 101, 1455–1460.
Kowalska, I., Stochmal, A., Kapusta, I., Janda, B., Pizza, C., Piacente, S. and
Oleszek, W. (2007) Flavonoids from barrel medic (Medicago truncatula)
aerial parts. J. Agric. Food. Chem. 55, 2645–2652.
Lapierre, C., Monties, B. and Rolando, C. (1985) Thioacidolysis of lignin:
comparison with acidolysis. J. Wood Chem. Technol. 5, 277–292.
Leek, J.T., Monsen, E., Dabney, A.R. and Storey, J.D. (2006) EDGE: extraction
and analysis of differential gene expression. Bioinformatics, 22, 507–508.
Li, C. and Wong, W.H. (2001) Model-based analysis of oligonucleotide arrays:
expression index computation and outlier detection. Proc. Natl Acad. Sci.
USA, 98, 31–36.
Liepman, A.H., Wilkerson, C.G. and Keegstra, K. (2005) Expression of cellulose
synthase-like (Csl) genes in insect cells reveals that CslA family members
encode mannan synthases. Proc. Natl Acad. Sci. USA, 102, 2221–2226.
Medicago NST gene 113
ª 2010 The AuthorsJournal compilation ª 2010 Blackwell Publishing Ltd, The Plant Journal, (2010), 63, 100–114
Mitsuda, N. and Ohme-Takagi, M. (2008) NAC transcription factors NST1 and
NST3 regulate pod shattering in a partially redundant manner by pro-
moting secondary wall formation after the establishment of tissue identity.
Plant J. 56, 768–778.
Mitsuda, N., Seki, M., Shinozaki, K.M. and Ohme-Takagi, M. (2005) The NAC
transcription factors NST1 and NST2 of Arabidopsis regulate secondary
wall thickenings and are required for anther dehiscence. Plant Cell, 17,
2993–3006.
Mitsuda, N., Iwase, A., Yamamoto, H., Yoshida, M., Seki, M., Shinozaki, K.
and Ohme-Takagi, M. (2007) NAC transcription factors, NST1 and NST3,
are key regulators of the formation of secondary walls in woody tissues of
Arabidopsis. Plant Cell, 19, 270–280.
Nakashima, J., Chen, F., Jackson, L., Shadle, G. and Dixon, R.A. (2008) Multi-
site genetic modification of monolignol biosynthesis in alfalfa (Medicago
sativa): effects on lignin composition in specific cell types. New Phytol. 179,
738–750.
Pfaffl, M.W. (2001) A new mathematical model for relative quantification in
real-time RT-PCR. Nucleic Acids Res. 29, e45.
Ram, M.S., Dowell, F.E. and Seitz, L.M. (2003) FT-Raman spectra of unsoaked
and NaOH-soaked wheat kernels, bran, and ferulic acid. Cereal Chem. 80,
188–192.
Ramakers, C., Ruijter, J.M., Deprez, R.H. and Moorman, A.F. (2003)
Assumption-free analysis of quantitative real-time polymerase chain
reaction (PCR) data. Neurosci. Lett. 339, 62–66.
Reddy, M.S.S., Chen, F., Shadle, G.L., Jackson, L., Aljoe, H. and Dixon, R.A.
(2005) Targeted down-regulation of cytochrome P450 enzymes for forage
quality improvement in alfalfa (Medicago sativa L.). Proc. Natl Acad. Sci.
USA, 102, 16573–16578.
Shadle, G., Chen, F., Reddy, M.S.S., Jackson, L., Nakashima, J. and Dixon,
R.A. (2007) Down-regulation of hydroxycinnamoyl CoA: shikimate
hydroxycinnamoyl transferase in transgenic alfalfa affects lignification,
development and forage quality. Phytochemistry, 68, 1521–1529.
Shen, H., Yin, Y., Chen, F., Xu, Y. and Dixon, R.A. (2009) A bioinformatic
analysis of NAC genes for plant cell wall development in relation to lig-
nocellulosic bioenergy production. Bioenergy Res. 2, 217–232.
Sibout, R., Eudes, A., Mouille, G., Pollet, B., Lapierre, C., Jouanin, L. and
Seguin, A. (2005) CINNAMYL ALCOHOL DEHYDROGENASE-C and -D are
the primary genes involved in lignin biosynthesis in the floral stem of
Arabidopsis. Plant Cell, 17, 2059–2076.
Somerville, C. (2006) Cellulose synthesis in higher plants. Annu. Rev. Cell Dev.
Biol. 22, 53–78.
Somerville, C. (2007) Biofuels. Curr. Biol. 17, R115–R119.
Storey, J.D. and Tibshirani, R. (2003) Statistical significance for genomewide
studies. Proc. Natl Acad. Sci. USA, 100, 9440–9445.
Tadege, M., Ratet, P. and Mysore, K.S. (2005) Insertional mutagenesis: a
Swiss Army knife for functional genomics of Medicago truncatula. Trends
Plant Sci. 10, 229–235.
Tadege, M., Wen, J., He, J. et al. (2008) Large-scale insertional mutagenesis
using the Tnt1 retrotransposon in the model legume Medicago truncatula.
Plant J. 54, 335–347.
Tanaka, K., Murata, K., Yamazaki, M., Onosato, K., Miya, O.A. and Hirochika,
H. (2003) Three distinct rice cellulose synthase catalytic subunit genes
required for cellulose synthesis in the secondary wall. Plant Physiol. 133,
73–83.
Town, C.D. (2006) Annotating the genome of Medicago truncatula. Curr. Opin.
Plant Biol. 9, 122–127.
Turner, S.R., Taylor, N. and Jones, L. (2001) Mutations of the secondary cell
wall. Plant Mol. Biol. 47, 209–219.
Yang, S.H., Xu, W.W., Tesfaye, M., Lamb, J.F.S., Jung, H.G., Samac, D.A.,
Vance, C.P. and Gronwald, J.W. (2009) Alfalfa biomass germplasms: SFP
detection and transcriptome analysis. In XVII Plant and Animal Genome
Conference San Diego, Abstract W167.
Young, N.D. and Udvardi, M. (2009) Translating Medicago truncatula
genomics to crop legumes. Curr. Opin. Plant Biol. 12, 193–201.
Zeng, Y., Saar, B.G., Friedrich, M.G., Chen, F., Liu, Y.-S., Dixon, R.A., Himmel,
M.E., Xie, X.S. and Shi-You Ding, S.-Y. (2010) Imaging lignin-down-regu-
lated alfalfa using Coherent Anti-Stoke Raman Scattering Microscopy.
Bioenergy Res. 3, in press.
Zhong, R., Richardson, E.A. and Ye, Z.H. (2007) Two NAC domain tran-
scription factors, SND1 and NST1, function redundantly in regulation of
secondary wall synthesis in fibers of Arabidopsis. Planta, 225, 1603–
1611.
Zhong, R., Lee, C., Zhou, J., McCarthy, R.L. and Ye, Z.H. (2008) A battery of
transcription factors involved in the regulation of secondary cell wall bio-
synthesis in Arabidopsis. Plant Cell, 20, 2763–2782.
Zhou, J., Lee, C., Zhong, R. and Ye, Z.H. (2009) MYB58 and MYB63 are tran-
scriptional activators of the lignin biosynthetic pathway during secondary
cell wall formation in Arabidopsis. Plant Cell, 21, 248–266.
114 Qiao Zhao et al.
ª 2010 The AuthorsJournal compilation ª 2010 Blackwell Publishing Ltd, The Plant Journal, (2010), 63, 100–114