an investment analysis case study - new york university
TRANSCRIPT
1
An Investment Analysis Case Study This case is a group project that is due on March 31, before class at 10.30.
Stating the obvious: Each group will turn in one report (sounds obvious, but might as
well make it explicit) electronically (as a pdf file). While you should include your cash
flows tables in your report, you don’t have to attach your excel spreadsheets.
Cover page: Each report should have a cover page that contains the following – the
names of the group members in alphabetical order and the following summary
information on the analysis:
Decision on Investment: Invest or Do not invest
Cost of capital: % value
Return on capital: % value
NPV – 10-year life: $ value
NPV- Longer life: $ value
Report format: Please try to keep your report brief. In the report, be clear about:
a. Any assumptions you made to get to your conclusion
b. Your final recommendation
Exhibits: Please make sure that you include the following in your exhibits
a. The table of earnings/cash flows by year
b. Your computation of cost of equity/capital/discount rate
Time: To keep time straight, you can assume the following:
• Next year: Year 1
• Most recent year: Just ended
• Right now: Time 0. Any “up front” expenditure is incurred immediately.

2
Google Disrupts the Auto Market: The Google Car? The Setting
Google Inc. has had a very good run, both in terms of earnings and stock prices,
over the last decade. Based largely on the success of its advertising business, the
company has reported double digit growth in revenues and earnings over the last few
years (see exhibit 1) and its stock price has reflected this success (see exhibit 2). It has a
substantial cash balance and a strong balance sheet (see exhibit 3). However, Sundar
Pichai, CEO of Google, is concerned that the halcyon days of online advertising growth
are coming to an end and is under pressure from financial markets to come up a new
revenue stream.
The Proposal
Google is considering entering the automobile market with an innovatively designed
electric car, called the GCar, aimed at the premium end of the automobile market, and
with significant automated driving features. You have been asked to collect the data to
make the assessment and have come back with the following information:
1. R&D Expenses: Google has already spent (and expensed) $ 5 billion on research on
the automotive technology and development of the commercial design, mostly
through its Waymo division. None of that money can be recouped at this stage, if
Google decides not to go ahead with the GCar.
2. Introductory Costs; If Google decides to go ahead with the GCar investment, it will
have to spend $22 billion up front (right now) to lock in suppliers, distributors and
retailers, and to invest in infrastructure. The cost is depreciable over the next 10
years, down to a salvage value of $ 2 billion, and Google expects to use straight-line
depreciation.
3. Market Potential and Share: In the premium auto market (including all cars priced at
or above $60,000) there were 5 million automobiles sold globally in the most recent
year and the market is expected to grow approximately 4% a year for the next decade.
Google expects to gain a 2% market share next year if the GCar is introduced and
increase that market share by 2% a year (4% in the second year, 6% in the third year,
8% in the fourth year and 10% in year 5) to reach a target market share of 10% of the
3
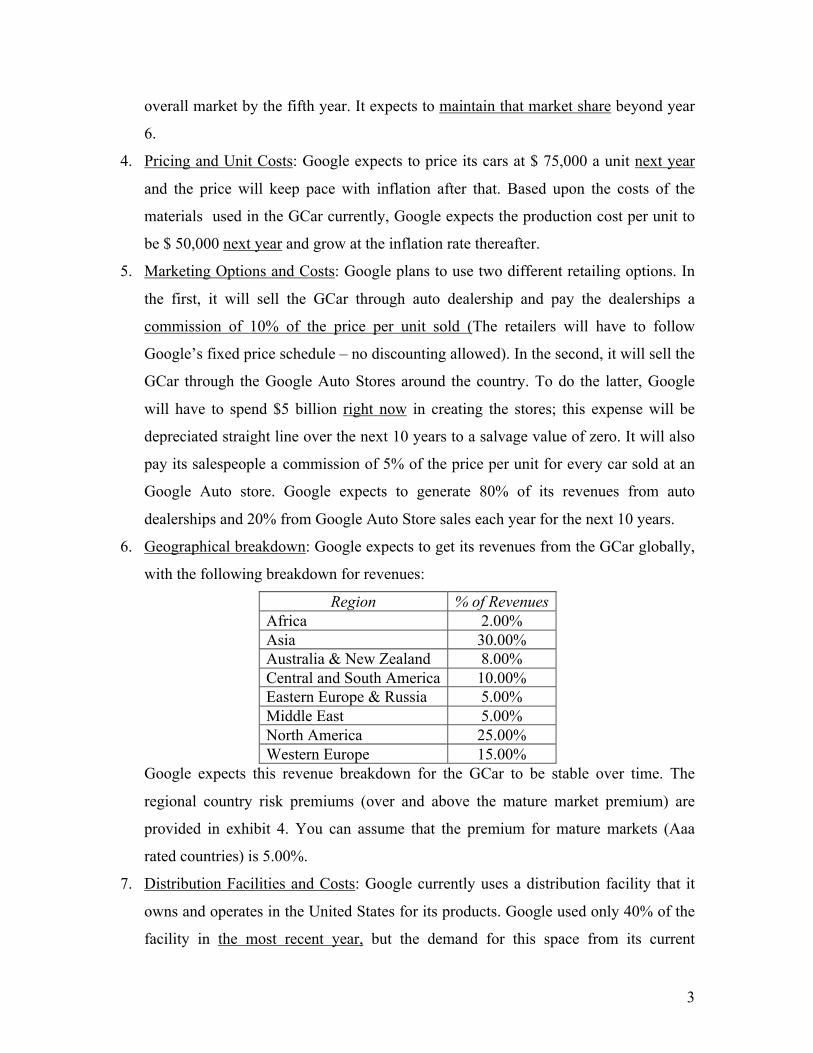
overall market by the fifth year. It expects to maintain that market share beyond year
6.
4. Pricing and Unit Costs: Google expects to price its cars at $ 75,000 a unit next year
and the price will keep pace with inflation after that. Based upon the costs of the
materials used in the GCar currently, Google expects the production cost per unit to
be $ 50,000 next year and grow at the inflation rate thereafter.
5. Marketing Options and Costs: Google plans to use two different retailing options. In
the first, it will sell the GCar through auto dealership and pay the dealerships a
commission of 10% of the price per unit sold (The retailers will have to follow
Google’s fixed price schedule – no discounting allowed). In the second, it will sell the
GCar through the Google Auto Stores around the country. To do the latter, Google
will have to spend $5 billion right now in creating the stores; this expense will be
depreciated straight line over the next 10 years to a salvage value of zero. It will also
pay its salespeople a commission of 5% of the price per unit for every car sold at an
Google Auto store. Google expects to generate 80% of its revenues from auto
dealerships and 20% from Google Auto Store sales each year for the next 10 years.
6. Geographical breakdown: Google expects to get its revenues from the GCar globally,
with the following breakdown for revenues:
Region % of Revenues Africa 2.00% Asia 30.00% Australia & New Zealand 8.00% Central and South America 10.00% Eastern Europe & Russia 5.00% Middle East 5.00% North America 25.00% Western Europe 15.00%
Google expects this revenue breakdown for the GCar to be stable over time. The
regional country risk premiums (over and above the mature market premium) are
provided in exhibit 4. You can assume that the premium for mature markets (Aaa
rated countries) is 5.00%.
7. Distribution Facilities and Costs: Google currently uses a distribution facility that it
owns and operates in the United States for its products. Google used only 40% of the
facility in the most recent year, but the demand for this space from its current

4
products (not including the GCar) is expected to grow 12% a year for the next 10
years. If Google goes ahead with the GCar, it will use the excess capacity to store
GCar supplies, with every 10,000 GCars using 1% of the capacity. (Thus, in a given
year, if 200,000 GCars are produced, it will take up 20% of the total capacity of the
battery factory). If the capacity limit is reached, Google will have to invest a
substantial amount to create a new facility of equivalent capacity. The current
estimate of the cost of building a new distribution facility is $ 5 billion, but this cost
will grow at the inflation rate.
8. G&A expenses: Google will allocate 10% of its existing general and administrative
costs to the new division. These costs total $ 10 billion for the entire firm in the most
recent year and are expected to grow 5% a year for the next 10 years, with or without
the GCar investment. In addition, it is expected that Google will have an increase of $
0.5 billion in general and administrative costs next year when the GCar is introduced,
and this amount will grow with the new division’s dollar revenues after that. The
latter cost is directly related to the new GCar division.
9. Advertising Expenses: Google spent $ 8 billion on advertising in the most recent year.
If Google does not invest in the GCar, it expects this cost to increase 5% a year for
the next 10 years. If the GCar is introduced, the total advertising expenses each year,
from years 1 to 10, are expected to be 15% higher than they would have been without
the GCar division.
10. Working Capital: The GCar will create working capital needs, which you have
estimated as follows:
• The sale of GCars to retailers will create accounts receivable amounting to 5%
of revenues each year.
• Inventory (of both the input material and finished GCars) will be
approximately 10% of the variable production cost (not including
depreciation, marketing costs, allocations or advertising expenses).
• Accounts payable will be 6% of the variable production cost (not including
depreciation, marketing costs, allocations or advertising expenses).

5
All of these working capital investments will have to be made at the beginning of
each year in which goods are sold. Thus, the working capital investment for the
first year will have to be made at the beginning of the first year.
11. Side benefits for device sales: If Google goes ahead with the GCar, it will see
revenues for its products (software and devices) increase by $0.5 billion next year (as
they are integrated into the GCar), and grow at the inflation rate after that. The after-
tax operating margin (after tax operating income/ revenues) is 40% for all Google
software and devices.
12. Risk Measures: The beta for Google is 0.87, calculated using weekly returns over the
last 2 years and against the S&P 500 Index and 0.85 against the MSCI Global
Index(see exhibit 5). Google currently gets about 90% of its revenues from
advertising, 8% from its cloud businesses and 2% from software/devices. The details
of the beta calculation are included in Exhibit 5, as well as bottom-up beta estimates
for each of Google’s existing businesses. The current stock price for the firm is $
2,000/share and there are 650 million shares outstanding.
13. Debt Choices: Google expects to finance the GCar division using the same mix of
debt and equity (in market value terms) as it is using currently in the rest of its
business. Google currently has $5 billion in book (and market) value of interest
bearing debt (with a weighted average maturity of 5 years), and it reports the
following lease commitments for next five years:
Year Lease commitment
1 $ 2,198 million
2 $ 2,170 million
3 $ 1,995 million
4 $ 1,738 million
5 $ 1,389 million
Beyond $ 5,601 million
The lease payment for the most recent year is $2,004 million. Google was rated Aa2
by Moody’s and the default spread for companies with that rating is 0.60%.
14. Taxes: Google’s effective tax rate is 16.2%, but its marginal tax rate is 25%.

6
15. Macro data: The current long-term US Treasury bond rate is 1.5%, and the expected
inflation rate is 1.0%.
16. Other information: You have collected information on other automobile companies in
Exhibit 6. The data includes the regression betas of these companies and relevant
information on both market values of debt, equity and cash. You can assume a 25%
marginal tax rate for these firms, as well. (You can also assume that the debt includes
the present value of operating leases).

7
Questions on the Project
1. Accounting Return Analysis
• Estimate the operating income from the proposed GCar investment to Google
over the next 10 years.
• Estimate the after-tax return on capital for the investment over the 10-year
period.
• Based upon the after-tax return on capital, would you accept or reject this
project?
This will require you to make some assumptions about allocation and expensing. Make
your assumptions as consistent as you can and estimate the return on capital.
2. Cash Flow Analysis
• Estimate the after-tax incremental cash flows from the proposed GCar
investment to Google over the next 10 years.
• If the project is terminated at the end of the 10th year, and both working
capital and investment in other assets can be sold for book value at the end of
that year, estimate the net present value of this project to Google. Develop a
net present value profile and estimate the internal rate of return for this
project.
• If the GCar division is expected to have a life much longer than 10 years,
estimate the net present value of this project, making reasonable assumptions
about investments needed and cash flows. Develop a net present value profile
and estimate the internal rate of return for this project.
3. Sensitivity Analysis
• Estimate the sensitivity of your numbers to changes in two of the key
assumptions underlying the analysis (You get to pick what you think are the
two key assumptions).
Based upon your analysis, and any other considerations you might have, tell me whether
you would accept this project or reject it. Explain, briefly, your decision.

8
Exhibit 1: Google's Income Statements (in $ millions)

9
Exhibit 2: Google - Stock Prices

10
Exhibit 3: Google's Balance Sheets

11
Exhibit 4: Country Risk Premiums by region (over and above the mature market premium)
Region Country Risk Premium (GDP Weighted Average)
Africa 4.92% Asia 1.03% Australia & New Zealand 0.00% Central and South America 3.99% Eastern Europe & Russia 2.08% Middle East 1.53% North America 0.00% Western Europe 0.84%

12
Exhibit 5: Google's Beta
Regression against S&P 500
Regression against MSCI (World Equities)
Business % of Google’s Revenues Unlevered Beta
Online Advertising 90% 0.90
Cloud 8% 0.75
Software and devices 2% 1.50

13
Exhibit 6: Automobile Companies
The data includes all publicly traded automobile companies listed globally, with a market capitalization exceeding $1 billion. Click
on this link to get the data in an excel spreadsheet.
Company Name Market Capitalization (in
millions US $) Cash & Marketable Securities
(in millions US $) Total Debt (including leases) (in
millions US $) 2 Year Beta
[Latest] Tesla, Inc. (NasdaqGS:TSLA) $ 626,976.30 $19,384.00 $13,337.00 1.90
Toyota Motor Corporation (TSE:7203) $ 205,924.40 $84,158.30 $232,298.70 1.04
Volkswagen AG (XTRA:VOW3) $ 123,308.30 $58,506.40 $257,853.20 1.47
Daimler AG (XTRA:DAI) $ 90,942.00 $31,203.70 $178,400.00 1.75
BYD Company Limited (SEHK:1211) $ 82,242.20 $1,944.60 $8,884.40 1.10
General Motors Company (NYSE:GM) $ 75,892.90 $23,938.00 $111,072.00 1.70
NIO Limited (NYSE:NIO) $ 64,896.50 $6,490.90 $1,444.60 1.95
Bayerische Motoren Werke Aktiengesellschaft (XTRA:BMW)
$ 59,446.20 $23,432.40 $131,608.70 1.27
Honda Motor Co., Ltd. (TSE:7267) $ 48,992.60 $31,251.90 $77,335.20 1.15
Ford Motor Company (NYSE:F) $ 48,420.70 $30,752.00 $162,998.00 1.53
Hyundai Motor Company (KOSE:A005380) $ 43,992.70 $25,838.10 $78,733.90 1.50
SAIC Motor Corporation Limited (SHSE:600104)
$ 37,194.20 $27,620.70 $21,286.00 0.94
Great Wall Motor Company Limited (SEHK:2333)
$ 36,932.00 $2,694.40 $2,590.30 1.14
Ferrari N.V. (NYSE:RACE) $ 35,370.00 $1,668.90 $3,333.00 1.23
Geely Automobile Holdings Limited (SEHK:175)
$ 31,195.60 $2,855.80 $605.50 1.09
Maruti Suzuki India Limited (NSEI:MARUTI) $ 29,613.20 $377.30 $30.70 0.97

14
Kia Corporation (KOSE:A000270) $ 28,050.90 $13,728.20 $10,113.50 1.29
Porsche Automobil Holding SE (XTRA:PAH3) $ 27,338.60 $621.20 $43.40 1.54
Nissan Motor Co., Ltd. (TSE:7201) $ 21,475.40 $20,907.70 $74,247.90 1.00
Suzuki Motor Corporation (TSE:7269) $ 20,995.70 $10,011.90 $7,609.00 1.42
Tata Motors Limited (BSE:500570) $ 16,458.90 $5,829.10 $15,799.10 1.88
PT Astra International Tbk (IDX:ASII) $ 15,798.70 $3,475.40 $5,706.60 1.08
Bajaj Auto Limited (NSEI:BAJAJ-AUTO) $ 15,429.50 $1,367.60 $0.00 0.93
Guangzhou Automobile Group Co., Ltd. (SEHK:2238)
$ 14,640.70 $3,650.50 $2,109.20 0.81
Subaru Corporation (TSE:7270) $ 14,359.10 $10,711.20 $3,239.00 1.22
Renault SA (ENXTPA:RNO) $ 12,824.00 $27,061.80 $79,381.00 1.77
Mahindra & Mahindra Limited (NSEI:M&M) $ 12,481.30 $4,105.00 $12,960.50 1.30
Chongqing Changan Automobile Company Limited (SZSE:200625)
$ 12,458.70 $3,231.00 $285.00 1.04
Eicher Motors Limited (BSE:505200) $ 9,748.40 $935.70 $34.90 0.84
Hero MotoCorp Limited (BSE:500182) $ 9,380.00 $1,258.70 $74.00 0.73
Ford Otomotiv Sanayi A.S. (IBSE:FROTO) $ 8,384.70 $1,093.90 $1,088.30 1.11
FAW Jiefang Group Co., Ltd (SZSE:000800) $ 8,295.60 $5,080.10 $0.00 0.83
Dongfeng Motor Group Company Limited (SEHK:489)
$ 7,895.90 $8,994.20 $8,673.50 1.06
Yamaha Motor Co., Ltd. (TSE:7272) $ 7,845.60 $2,639.10 $4,524.30 1.40
Isuzu Motors Limited (TSE:7202) $ 7,707.20 $3,213.60 $2,987.60 1.55
Thor Industries, Inc. (NYSE:THO) $ 6,745.30 $337.40 $1,637.00 1.77
Yadea Group Holdings Ltd. (SEHK:1585) $ 6,181.70 $1,041.10 $6.63 0.92
Harley-Davidson, Inc. (NYSE:HOG) $ 5,535.90 $666.20 $9,037.10 1.51
Mazda Motor Corporation (TSE:7261) $ 5,164.20 $7,230.90 $8,903.90 1.26

15
BAIC BluePark New Energy Technology Co., Ltd. (SHSE:600733)
$ 4,919.60 $967.40 $3,542.60 0.94
Brilliance China Automotive Holdings Limited (SEHK:1114)
$ 4,526.00 $1,002.90 $1,046.90 0.99
Chongqing Sokon Industry Group Stock Co.,Ltd. (SHSE:601127)
$ 4,420.50 $488.80 $809.50 0.77
Mitsubishi Motors Corporation (TSE:7211) $ 4,300.10 $4,869.40 $4,928.20 1.24
TVS Motor Company Limited (BSE:532343) $ 4,037.80 $259.30 $1,668.50 1.49
Beiqi Foton Motor Co., Ltd. (SHSE:600166) $ 3,644.60 $491.10 $1,250.60 0.76
Trigano S.A. (ENXTPA:TRI) $ 3,578.50 $394.90 $251.50 1.02
Aston Martin Lagonda Global Holdings plc (LSE:AML)
$ 3,180.90 $688.10 $1,621.70 2.45
BAIC Motor Corporation Limited (SEHK:1958)
$ 2,851.40 $7,321.50 $3,605.90 1.17
Yulon Nissan Motor Co., Ltd (TSEC:2227) $ 2,771.00 $290.70 $98.60 0.99
Niu Technologies (NasdaqGM:NIU) $ 2,714.00 $191.60 $26.50 1.23
Tofas Türk Otomobil Fabrikasi A.S. (IBSE:TOASO)
$ 2,533.60 $572.40 $900.80 1.10
Anhui Jianghuai Automobile Group Corp.,Ltd. (SHSE:600418)
$ 2,519.70 $1,210.60 $1,653.70 1.04
Winnebago Industries, Inc. (NYSE:WGO) $ 2,422.60 $272.90 $543.00 1.90
China Automotive Engineering Research Institute Co., Ltd.
$ 2,351.60 $202.30 $2.40 0.91
Jiangling Motors Corporation, Ltd. (SZSE:000550)
$ 2,170.40 $1,524.90 $194.50 1.21
DongFeng Automobile Co. LTD (SHSE:600006)
$ 2,111.40 $569.40 $0.00 0.92
Zhejiang Qianjiang Motorcycle Co., Ltd. (SZSE:000913)
$ 1,929.20 $261.30 $0.00 0.87
PIERER Mobility AG (WBAG:PMAG) $ 1,830.00 $157.60 $708.30 0.89
CETC Energy Joint-Stock Co., Ltd. (SHSE:600877)
$ 1,621.60 $14.00 $0.60 1.85

16
Yulon Motor Company Ltd. (TSEC:2201) $ 1,483.90 $1,110.30 $6,971.20 0.94
Piaggio & C. SpA (BIT:PIA) $ 1,346.30 $284.70 $802.30 0.93
Lifan Technology (group) Co.,Ltd (SHSE:601777)
$ 1,159.50 $61.90 $1,391.80 1.43
Loncin Motor Co., Ltd. (SHSE:603766) $ 1,111.00 $345.60 $167.10 0.78

1