an investigation of software vulnerabilities in open
TRANSCRIPT

An investigation of software vulnerabilities in open source software projects using data from
publicly-available online sources
S. M. Monzur Murshed
A thesis submitted to the Faculty of Graduate and Postdoctoral Affairs in partial fulfillment of the requirements for the degree of
Master of Applied Sciencein
Technology Innovation Management
Carleton UniversityOttawa, Ontario
Copyright © 2017 S. M. Monzur Murshed
An investigation of software vulnerabilities in open source software projects using data from publicly-available sources Copyright © 2017 S. M. Monzur Murshed_______________________________________________________________________________________________________________________________________________
AbstractSoftware vulnerabilities is an active area of research, but little is known about how
publicly-observable properties of open source software projects and developer
communities relate to the time taken to discover and fix vulnerabilities in the projects’
software. This thesis examines that relationship using data harvested from online sources
about a sample of 60 open source content management system (CMS) projects and 1268
vulnerabilities affecting the software produced by those projects. Combining project
release histories with metrics from two online databases provided reliable proxy dates for
vulnerability introduction and fix, but not discovery. Higher commit density (a proxy for
project activity) was associated with shorter time of exposure. The lifecycle model, data
collection workflow, and software scripts will enable researchers to replicate and extend
this analysis, and the evidence-based recommendations provided here will enable
improvements to the coverage, quality, access, and integration of online sources for
project and vulnerability metrics.
______________________________________________________________________ii

An investigation of software vulnerabilities in open source software projects using data from publicly-available sources Copyright © 2017 S. M. Monzur Murshed_______________________________________________________________________________________________________________________________________________
AcknowledgementsI would like to acknowledge my thesis supervisor, Professor Steven Muegge, for
his patient and tireless guidance.
I would like to thank my daughter, Muntaha, and my wife, Gulshan, for their
tolerance.
______________________________________________________________________iii

An investigation of software vulnerabilities in open source software projects using data from publicly-available sources Copyright © 2017 S. M. Monzur Murshed_______________________________________________________________________________________________________________________________________________
Table of contentsAbstract................................................................................................................................iiAcknowledgements............................................................................................................iiiTable of contents.................................................................................................................ivList of figures......................................................................................................................viList of tables......................................................................................................................viiGlossary of terms................................................................................................................ix
1 Introduction.......................................................................................................................11.1 Objective....................................................................................................................21.2 Deliverables...............................................................................................................21.3 Relevance...................................................................................................................21.4 Contribution...............................................................................................................41.5 Overview of method..................................................................................................51.6 Organization of the document....................................................................................5
2 Literature review...............................................................................................................72.1 Software vulnerabilities.............................................................................................82.2 Open source software...............................................................................................172.3 Vulnerability databases and standards.....................................................................212.4 Summary and synthesis of key findings from the literature....................................24
3 Publicly-available data sets.............................................................................................273.1 CVE Details.............................................................................................................273.2 Black Duck Open Hub.............................................................................................36
4 Conceptual framework....................................................................................................414.1 Software vulnerability ability lifecycle....................................................................414.2 Application case: The Apache HTTP Server Project..............................................44
5 Hypotheses......................................................................................................................485.1 Contributors (H1).....................................................................................................495.2 Commit activity (H2)...............................................................................................505.3 Comments (H3)........................................................................................................515.4 Code churn (H4)......................................................................................................52
6 Research design and method...........................................................................................536.1 Identify assertions from the literature......................................................................546.2 Investigate data sets.................................................................................................546.3 Develop conceptual framework...............................................................................546.4 Develop hypotheses.................................................................................................556.5 Select samples..........................................................................................................556.6 Inspect small sample................................................................................................576.7 Specify variables and measures for full sample.......................................................57
______________________________________________________________________iv

An investigation of software vulnerabilities in open source software projects using data from publicly-available sources Copyright © 2017 S. M. Monzur Murshed_______________________________________________________________________________________________________________________________________________
6.8 Collect data for full sample......................................................................................606.9 Statistical analysis of full sample.............................................................................61
7 Results.............................................................................................................................637.1 Sample of open source software projects.................................................................637.2 Manual inspection of small sample..........................................................................677.3 Statistical analysis of full sample.............................................................................70
7.3.1 Project metrics..................................................................................................707.3.2 Univariate displays............................................................................................777.3.3 Bivariate displays..............................................................................................797.3.4 Summary statistics and correlation...................................................................827.3.5 Regression results (models 1 and 2).................................................................837.3.6 Regression diagnostics (model 1).....................................................................857.3.7 Time-averaging.................................................................................................877.3.8 Transformations................................................................................................897.3.9 Effect size........................................................................................................100
8 Discussion.....................................................................................................................1048.1 Answers to the research questions.........................................................................1048.2 Lessons learned from writing this thesis................................................................1088.3 Contribution to research.........................................................................................1108.4 Contribution to practice.........................................................................................1118.5 Limitations.............................................................................................................1128.6 Future research.......................................................................................................113
9 Conclusion....................................................................................................................116
10 References...................................................................................................................11710.1 Websites...............................................................................................................127
11 Appendix A: Data collection workflow......................................................................12911.1 Step 0: Set-up.......................................................................................................13111.2 Step 1: Get project data from CVE Details..........................................................13111.3 Step 2: Parse HTLM files....................................................................................13111.4 Step 3: Manual operation.....................................................................................13111.5 Step 4: Join project files.......................................................................................13211.6 Step 5: Get project data from Open Hub.............................................................13211.7 Step 6: Parse and join XML files.........................................................................13311.8 Step 7: Merge to one data frame..........................................................................133
12 Appendix B: Data collection scripts...........................................................................13412.1 Step 1: drupal_download.R..................................................................................13412.2 Step 2: drupal_HTMLtoCSV.R...........................................................................13512.3 Step 4: drupal_HTMLtoCSV.R...........................................................................13612.4 Step 5: drupal_activity_facts.py...........................................................................137
______________________________________________________________________v

An investigation of software vulnerabilities in open source software projects using data from publicly-available sources Copyright © 2017 S. M. Monzur Murshed_______________________________________________________________________________________________________________________________________________
List of figuresFigure 1: Data aggregation by CVE Details......................................................................28
Figure 2: Sample response to an Open Hub API call (excerpt).........................................38
Figure 3: Vulnerability lifecycle model.............................................................................42
Figure 4: Timeline of vulnerabilities fixed in Apache HTTP Server 2.4.x.......................46
Figure 5: Hypotheses.........................................................................................................48
Figure 6: Project metrics of Plone (very large project)......................................................73
Figure 7: Project metrics of Drupal (large project)............................................................74
Figure 8: Project metrics of MediaWiki (medium project)...............................................75
Figure 9: Project metrics of Serendipity (small project)....................................................76
Figure 10: Histograms and boxplots..................................................................................78
Figure 11: Scatterplot matrix (all variables)......................................................................80
Figure 12: Residual plots for model 1................................................................................86
Figure 13: Parallel boxplots for transforms on model 4....................................................93
Figure 14: Influence plots of model 11 and 11* (with 100 observations removed)..........97
Figure 15: Influence plots of model 23 and 23* (with 100 observations removed)..........98
Figure 16: Influence plots of model 27 and 27* (with 100 observations removed)..........99
Figure 17: Data collection workflow...............................................................................130
______________________________________________________________________vi
An investigation of software vulnerabilities in open source software projects using data from publicly-available sources Copyright © 2017 S. M. Monzur Murshed_______________________________________________________________________________________________________________________________________________
List of tablesTable 1: Highlights of the scholarly and practitioner literature...........................................7
Table 2: Definitions of "software vulnerability" in the literature........................................9
Table 3: Definitional forms in the literature......................................................................10
Table 4: Vulnerability lifecycle models in the literature...................................................11
Table 5: Online vulnerability databases.............................................................................22
Table 6: Properties of Open Hub ActivityFact..................................................................39
Table 7: Properties of Open Hub SizeFact........................................................................39
Table 8: Vulnerabilities fixed in Apache HTTP Server release 2.4.x...............................45
Table 9: Nine steps of the research method.......................................................................53
Table 10: Variables, measures, and sources for full sample analysis................................58
Table 11: Nine steps of full sample data analysis..............................................................62
Table 12: Summary of project sample (n=60; part 1 of 3)................................................64
Table 13: Summary of project sample (n=60; part 2 of 3)................................................65
Table 14: Summary of project sample (n=60; part 3 of 3)................................................66
Table 15: Summary of small sample of vulnerabilities.....................................................67
Table 16: Project metrics: mean, quartiles, and range.......................................................71
Table 17: Projects sorted by size of code base (kLOC).....................................................72
Table 18: Summary statistics and correlation coefficients................................................82
Table 19: Regression results (no time-averaging).............................................................83
Table 20: Regression results (all explanatory variables; time-averaging).........................88
Table 21: Regression results (significant variables only; time averaging)........................89
Table 22: Regression results (log transform of response variable)....................................92
Table 23: Regression results (Box-Cox power transform of response variable)...............92
Table 24: Regression results (spread-level power transform of response variable)..........92
Table 25: Regression results (log transform of response variable; sig. variables only)....94
Table 26: Regression results (log transform of all variables)............................................95
Table 27: Regression results (log transform of significant variables only).......................95
Table 28: Regression results of Model 11* (with unusual observations removed)...........97
Table 29: Regression results of Model 23* (with unusual observations removed)...........98
Table 30: Regression results of Model 27* (with unusual observations removed)...........99
______________________________________________________________________vii

An investigation of software vulnerabilities in open source software projects using data from publicly-available sources Copyright © 2017 S. M. Monzur Murshed_______________________________________________________________________________________________________________________________________________
Table 31: Effect size of model 7 (linear model, 6-month time-averaging).....................101
Table 32: Effect size of model 23 (log response, 6-month time-averaging)...................102
______________________________________________________________________viii

An investigation of software vulnerabilities in open source software projects using data from publicly-available sources Copyright © 2017 S. M. Monzur Murshed_______________________________________________________________________________________________________________________________________________
Glossary of termsAPI: Application programming interface, a set of clearly defined
methods of communication between software components.
CPE: Common Platform Enumeration, a structured naming scheme and standard dictionary for information technology systems, software, and packages.
CVE: Common Vulnerabilities and Exposures, a dictionary of publicly known information security vulnerabilities and exposures, maintain
CVRF: Common Vulnerability Reporting Framework, an XML-based language that enables different stakeholders across different organizations to share critical security-related information in a single format. Maintained by the Industry Consortium for Advancement of Security on the Internet (ICASI).
CVSS: Common Vulnerability Scoring System, an open framework for communicating the characteristics and severity of software vulnerabilities.
CWE: Common Weakness Enumeration, a standard dictionary of software weakness types.
Exploit: Software code and/or sets of instructions to utilize a specific software vulnerability to cause harm. Exploits are often packaged and distributed as modules for the Metasploit framework of penetration testing software.
Free software: Software compliant with the Free Software Definition (FSD) to provide users with four essential freedoms: (0) the freedom to run the program for any purpose, (1) the freedom the study how the program works and change it, (2) the freedom redistribute copies to others, and (3) the freedom to distribute modified versions to others.
______________________________________________________________________ix

An investigation of software vulnerabilities in open source software projects using data from publicly-available sources Copyright © 2017 S. M. Monzur Murshed_______________________________________________________________________________________________________________________________________________
HTML: HyperText Markup Language, the standard markup language for creating web pages and web applications, and a cornerstone technology of the World Wide Web.
HTTP: Hypertext Transfer Protocol, the protocol for data communication on the World Wide Web.
kLOC Thousands of lines of code, a unit for comparing the size of a software project’s source code base.
Open source software: Software compliant with the Open Source Definition (OSD), including access to the software source code, allowing modifications and derived works, and redistribution of modifications and derived works.
REST: Representational state transfer, an approach to providing interoperability between web services; employed by many APIs.
Software vulnerability: A vulnerability in software. See “vulnerability.”
URL: Universal Resource Locator, a formal term for a web address, including web pages accessed through HTTP.
Vulnerability: A weakness that could be exploited to cause harm (Pfleeger et al. 2015; see also section 2.1).
XML: Extensible Markup Language, markup language for encoding documents in a format that is both human-readable and machine-readable, commonly used for data structures of web services.
______________________________________________________________________x
An investigation of software vulnerabilities in open source software projects using data from publicly-available sources Copyright © 2017 S. M. Monzur Murshed_______________________________________________________________________________________________________________________________________________
1 IntroductionSoftware vulnerabilities in open source software are receiving increasing
attention, not just from security researchers and information technology professionals, but
more recently from managers and entrepreneurs, and from the general public. The
“Heartbleed” vulnerability in the Open SSL cryptographic software library disclosed in
April 2014 (Bever, 2014; Perlroth, 2014a), the “Shellshock” family of vulnerabilities in
the Unix Bash shell disclosed in September 2014 (Perlroth, 2014b), and the “POODLE”
family of attacks on Version 3 of the Secure Socket Layer (SSL) protocol disclosed in
October 2014 (Zetter, 2014; Möller et al. 2014) had extensive coverage in the popular
press. The impacts are real: the Canada Revenue Agency shut down its websites for five
days in April 2014 during the busiest month of the Canadian tax season following a
confirmed breach using the Heartbleed vulnerability (CBC, 2014, 2015) Real-world
vulnerability exploits feature with increasing prominence in the latest industry reports,
including the Verizon Data Breach Investigation Report (DBIR; Verizon, 2016) and the
Symantec Internet Security Threat Report (ISTR; Symantec, 2016).
Researchers are actively investigating the technical aspects of software
vulnerabilities, and are collaborating with open source software organizations and
government groups on applied research (e.g., Wheeler & Khakimov, 2015). Nonetheless,
the time taken to find and fix vulnerabilities in open source software projects has received
comparably little attention. This apparent gap in the extant research is the motivation for
this thesis.
_______________________________________________________________________________________________________________________________________________
1
Chapter 1: Introduction 2_______________________________________________________________________________________________________________________________________________
1.1 ObjectiveExamine, using publicly available data, the relationship between the project and
community attributes of open source software projects and the time to discover and fix
security vulnerabilities in the projects’ software.
More specifically, this research addresses three guiding research questions:
(1) How do the observable properties of an open source software project relate to the
time taken to discover and fix software vulnerabilities?
(2) To what extent is the data required to answer question 1 available through publicly-
available online sources?
(3) How can existing publicly-available databases be improved?
1.2 Deliverables
There are four deliverables:
(1) a conceptual framework and a set of hypotheses developed from assertions in the
scholarly and practitioner literature (chapters 4 and 5)
(2) results of hypotheses tests (chapter 7)
(3) a documented workflow and set of extensible software scripts to automate data
collection from publicly-available online sources (Appendix A and Appendix B)
(4) a set of recommendations to improve existing databases of open source projects and
software vulnerabilities (section 8.1)
1.3 Relevance
This research is relevant to at least three groups of stakeholders: (1) producers of
open source software, (2) users and consumers of open source software, and
_______________________________________________________________________________________________________________________________________________
Copyright © 2017 S. M. Monzur Murshed
Chapter 1: Introduction 3_______________________________________________________________________________________________________________________________________________
(3) researchers in the domains of cybersecurity, open source software, strategy,
management, and entrepreneurship.
The first stakeholder group is producers of open source software, including
individual software developers and the management teams of firms sponsoring open
source development. Software vulnerabilities require enormous amounts of effort, time,
and money to find, publish, and fix (Shahazad et al., 2012). Actionable knowledge about
finding and fixing vulnerabilities could free up the time and attention of experienced
developers to work on other aspects of open source software projects, reduce the time and
effort for core developers to review and approve outside contributions, and simplify the
“on-boarding” of casual contributors becoming more active and productive within
projects. In particular, the results here suggest that project leaders should seek to increase
developer activity within the project, and that projects should provide accurate, complete,
and accessible information about vulnerabilities fixed in each software release.
The second stakeholder group is users and consumers of open source software. A
better understanding of how observable properties of open source software projects are
related to software vulnerabilities could inform decisions by both individuals and
organizations of which open source projects to use, consume, and potentially contribute
back to (Williams & Dabirsiaghi, 2012; Constantin, 2014; Wheeler & Khakimov, 2015).
In particular, the results here suggest that users and consumers should favour projects
with more active developer communities.
The third group stakeholder group is researchers. Wheeler & Khakimov (2015)
write: “Measuring the security of software is a notoriously difficult and an essentially _______________________________________________________________________________________________________________________________________________
Copyright © 2017 S. M. Monzur Murshed

Chapter 1: Introduction 4_______________________________________________________________________________________________________________________________________________
unsolved problem. Ideally we would identify metrics that directly determine whether or
not an open source software project is producing secure software. However, since perfect
metrics are not available, we are instead interested in metrics that provide some evidence
that a project’s product is more or less likely to be secure” (p. 2-1). In particular, the
results here suggest that higher commit density is associated with shorter vulnerability
exposure time – a desired property of secure software.
1.4 Contribution
This thesis makes three contributions to scholarship (developed in section 8.3):
1. Results of statistical hypothesis tests showing that higher commit density (a
measure of developer activity) is associated with shorter vulnerability exposure time.
2. A software vulnerability lifecycle model that operationalizes events (and thus the
time intervals between events) using release dates of affected and unaffected versions of
the software. The author is aware of several alternative approaches in the scholarly
literature, but no prior studies using this particular approach of software release date.
3. A workflow and set of software scripts for automated data collection of software
vulnerability metrics and open source project metrics for use and extension by others.
In addition, this thesis makes at least two contributions to practice (developed in
section 8.4):
1. Recommendations for improving publicly-available data sources (section 8.1).
2. Evidence of an association between higher commit density and shorter exposure
time is of practical importance to producers of open source software, consumers of open
source software, and security professionals.
_______________________________________________________________________________________________________________________________________________
Copyright © 2017 S. M. Monzur Murshed

Chapter 1: Introduction 5_______________________________________________________________________________________________________________________________________________
1.5 Overview of method
This is a quantitative hypothesis-testing research design. Each hypothesis
formalizes an assertion from the scholarly or practitioner literature, specified using a
conceptual framework of the software vulnerability lifecycle. The unit of analysis is a
vulnerability in the software produced by an open source software project. The sample is
1286 vulnerabilities affecting the software produced by 60 open source CMS (content
management system) projects. Automated data collection techniques (e.g., Munzert et al.
2015) harvest data from two online sources – Black Duck Open Hub (https://openhub.net)
for properties of open source software projects, and CVE Details
(https://www.cvedetails.com) for properties of software vulnerabilities. The analytic
approach is linear regression using the R language for statistical computing (R Core
Team, 2016) and the techniques recommended by Fox (2016) and Fox & Weisberg
(2011).
1.6 Organization of the document
This thesis is organized as ten chapters, each structured into sections and
subsections, followed by two appendices. Chapter 2, “Literature review,” surveys the
salient scholarly and practitioner literature on software vulnerabilities, open source
software, and vulnerability databases and standards. Chapter 3, “Publicly-available data
sets,” examines the content of the two online databases used in this research: (i) CVE
Details, a searchable repository of software vulnerability reports, and (ii) Black Duck
Open Hub, an aggregator of open source project metrics. Chapter 4, “Conceptual
frameworks,” develops a life-cycle model of a software vulnerability and applies the
_______________________________________________________________________________________________________________________________________________
Copyright © 2017 S. M. Monzur Murshed

Chapter 1: Introduction 6_______________________________________________________________________________________________________________________________________________
model to examine publicly-available information on the Apache HTTP server project.
Chapter 5, “Hypotheses,” develops a set of hypotheses to be tested. Chapter 6, “Research
design and method,” describes the steps followed for data collection and analysis to test
the hypotheses. Chapter 7, “Results,” presents the outcomes of the research, including a
manual investigation of a small sample of vulnerabilities and the regression analysis and
hypothesis tests of the full sample. Chapter 8, “Discussion,” discusses the results of the
research, including answers to the research questions, lessons learned by the author from
writing this thesis, the contribution to research, the contribution to management practice,
limitations of the research design, and opportunities for further research. Chapter 9,
“Conclusion,” concludes the thesis, and Chapter 10 is a list of references.
Two appendices follow the body of the thesis. Appendix A, “Data collection
workflow,” describes the steps to reproduce the data set by rerunning the existing scrips,
explains the operation of each script, and explains to how to modify or extend the scripts
for future work. Appendix B, “Data collection scripts,” provides the source code for the
scripts that were documented in Appendix A.
_______________________________________________________________________________________________________________________________________________
Copyright © 2017 S. M. Monzur Murshed

An investigation of software vulnerabilities in open source software projects using data from publicly-available sources Copyright © 2017 S. M. Monzur Murshed_______________________________________________________________________________________________________________________________________________
2 Literature review
This chapter reviews the salient findings from the scholarly and practitioner
literature in three streams: (1) software vulnerabilities, (2) open source software, and
(3) vulnerability databases and standards. Table 1 is a summary of the highlights of the
three streams and citations to key sources for each stream. The following three sections
review each stream, and the final fourth section is a summary and synthesis of the key
lessons from the literature, across all three streams, that are most relevant to this research.
Table 1: Highlights of the scholarly and practitioner literature
Stream Key highlights of the stream Citations to key sources
Software vulnerabilities
• Definitions of software vulnerabilities• Various life-cycle models; emphasis on disclosurepolicies and decisions by a software vendor(unclear to what extent results would generalize to community-developed open source software)• Factors associated with fewer and less severe software vulnerabilities include lower complexity, secure architectural designs, secure coding practices, access to source code, more co-developers and beta-testers, lower code churn, and more and better testing and testing tools
Arbaugh (2000)Marconato (2013)Shahazad et. al. (2012)Feng et al. (2016)
Open source software
• Various assertions are embedded in the open sourcepractitioner writing, but few of these practitionerassertions have been tested empirically• Typical characteristics of an open source softwaredevelopment process include meritocracy, accessibility, transparency, community roles, a committer selection process, release management, project governance,and coding guidelines for committers and contributors
Raymond (1999)Fogel (2006; 2016)Meneely & Williams (2009; 2010)Free Software Foundation (2014)Wheeler & Khakimov (2015)Muegge (2011)
Software vulnerability databases and standards
• The Common Vulnerabilities and Exposures (CVE) system is a standard way to identify and describe software vulnerabilities; each receives a unique CVE ID.• There are more than 100 vulnerability databases andsecurity advisories, most derived from CVE IDs• Known limitations in the CVE data• Various related vulnerability standards for description, classification, assessing severity, and remediation
Joh (2011)Frei (2009)
Common Vulnerabilities and Exposures (CVE)
National Vulnerability Database (NVD)
_______________________________________________________________________________________________________________________________________________
7

Chapter 2: Literature review 8_______________________________________________________________________________________________________________________________________________
2.1 Software vulnerabilities
There is no general consensus among researchers about the precise definition of
“software vulnerability” (Krsul, 1998; Ozment, 2007; Frei, 2009; Joh, 2011). Table 2 is a
summary of seventeen definitions found in the literature, and Table 3 (on the following
page) sorts these definitions into broad themes according to form.
This thesis adopts the definition recommended by Pfleeger et al. (2015) – a
software vulnerability is a weakness that could be exploited to cause harm, where harm is
defined as a negative consequence realized when a vulnerability is exploited.
_______________________________________________________________________________________________________________________________________________
Copyright © 2017 S. M. Monzur Murshed

Chapter 2: Literature review 9_______________________________________________________________________________________________________________________________________________
Table 2: Definitions of "software vulnerability" in the literature
Definition Source Also cited by:
1 A weakness in automated systems security procedures, administrative controls, internal controls, etc., that could be exploited by a threat to gain unauthorized access to information or to disrupt critical processing
Longly & Shain(1987)
Shrivastava et al. (2015, p. 199)
2 Weaknesses that allow a threat to compromise the security (confidentiality, integrity, or availability) of an asset
Mayerfeld(1988)
Joh (2011, p. 9)
3 The ability of an agent to cause an attack event Snow (1988) Joh (2011, p. 9)
4 Achievable bad events, which implies that the protections against them are nonexistent, insufficient, or insufficiently protected
Lewis(1988)
Joh (2011, p. 9)
5 A defect which enables an attacker to bypass security measures Schultz et al.(1990)
Shrivastava et al. (2015, p. 199)
6 A vulnerable system is an authorized state from which an unauthorized state can be reached using authorized state transitions; a vulnerability is a characterization of a vulnerable state which distinguishes it from all non-vulnerable states
Cheswick & Bellovin (1994)
Joh (2011, p. 9)
7 A weakness in a system that can be exploited to violate the system’s intended behavior
De Ru & Eloff(1996)
Roumani (2012, p. 3)
8 An instance of an error in the specification, development, or configuration of software such that its execution can violate the security policy
Krsul(1998, p. 10)
9 Technological flaw in an information technology product that has security or survivability implications
Arbaugh et al., 2000: p. 54
10 An instance of a mistake in the specification, development, or configuration of software such that its execution can violate the [explicit or implicit] security policy
Ozment (2007, p. 7)
11 A bug, flaw, behavior, output, outcome or event within an application, system, device, or service that could lead to an implicit or explicit failure of confidentiality, integrity, or availability
Schiffman (2007)
Roumani (2012, p. 3)
12 Security flaws, defects, or mistakes in software that can be directly used by a hacker to gain access to a system or network
Wang et al., (2009)
Joh (2011, p. 9)
13 “Weakness in an information system, system security procedures, internal controls, or implementation that could be exploited or triggered by a threat source”
CNSS 4009 (2010, p. 81)
NISTIR 7298 (2013, p. 212)
14 Weakness in the security system which might be exploited by malicious users causing loss or harm
Pfleeger et al. (2015)
Joh (2011, p. 9; previous edition)
15 A mistake in software that can be directly used by a hacker to gain access to a system or network
MITRE(2016b)
Various related standards
16 A hole or a weakness in the application, which can be a design flaw or an implementation bug, that allows an attacker to cause harm to the stakeholders of an application. Stakeholders include the application owner, application users, and other entities that rely on the application.
OWASP(2016)
17 A weakness in a product that could allow an attacker to compromise the integrity, availability, or confidentiality of that product.
Microsoft(no date)
_______________________________________________________________________________________________________________________________________________
Copyright © 2017 S. M. Monzur Murshed

Chapter 2: Literature review 10_______________________________________________________________________________________________________________________________________________
Table 3: Definitional forms in the literature
Form Count “A vulnerability is a ...” Sources
weakness 7 weakness Longly & Shain (1987) Mayerfeld (1988)De Ru & Eloff (1996) Pfleeger et al. (2015)NIST (2006) Microsoft (no date)
hole or weakness OWASP (2016)
mistake 6 mistake Ozment (2007)MITRE (2016b)
flaw, defect, or mistake Wang et al. (2009)
error Krsul (1998)
flaw Arbaugh et al. (2000)
defect Schultz et al. (1990)
various 1 bug, flaw, behavior, output, outcome or event Schiffman (2007)
1 characterization of an unauthorized state Cheswick & Bellovin (1994)
1 achievable bad events Lewis (1988)
1 ability Snow (1988)
17
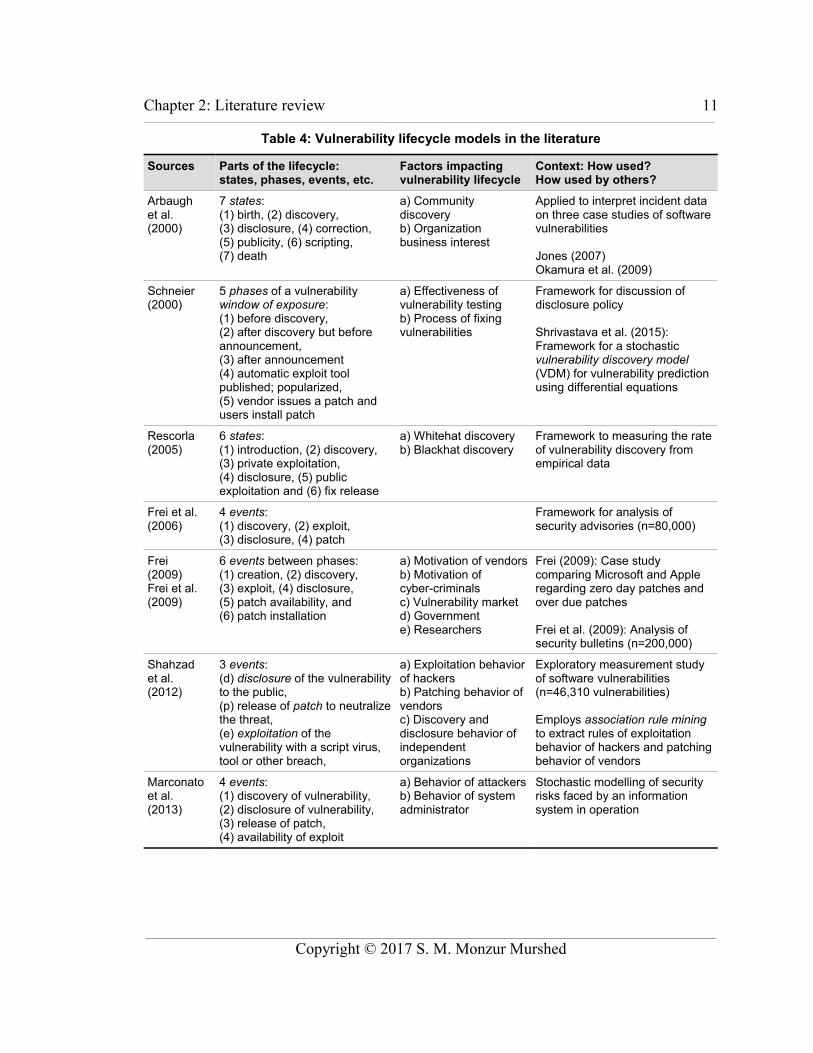
Table 4 is a summary of seven software vulnerability lifecycle models found in
the literature. The various models differ in composition (events, phases, or states), the
number of components, the labels used, and the purpose for which the model was
developed. None are perfectly suited for this research; section 4.1 revisits these ideas to
develop a vulnerability lifecycle model for the purposes of this research.
_______________________________________________________________________________________________________________________________________________
Copyright © 2017 S. M. Monzur Murshed
Chapter 2: Literature review 11_______________________________________________________________________________________________________________________________________________
Table 4: Vulnerability lifecycle models in the literature
Sources Parts of the lifecycle: states, phases, events, etc.
Factors impacting vulnerability lifecycle
Context: How used?How used by others?
Arbaughet al. (2000)
7 states: (1) birth, (2) discovery, (3) disclosure, (4) correction, (5) publicity, (6) scripting, (7) death
a) Community discoveryb) Organization business interest
Applied to interpret incident data on three case studies of software vulnerabilities
Jones (2007)Okamura et al. (2009)
Schneier (2000)
5 phases of a vulnerability window of exposure:(1) before discovery, (2) after discovery but before announcement, (3) after announcement(4) automatic exploit tool published; popularized, (5) vendor issues a patch and users install patch
a) Effectiveness of vulnerability testingb) Process of fixing vulnerabilities
Framework for discussion of disclosure policy
Shrivastava et al. (2015): Framework for a stochastic vulnerability discovery model (VDM) for vulnerability prediction using differential equations
Rescorla(2005)
6 states: (1) introduction, (2) discovery, (3) private exploitation, (4) disclosure, (5) public exploitation and (6) fix release
a) Whitehat discoveryb) Blackhat discovery
Framework to measuring the rate of vulnerability discovery from empirical data
Frei et al. (2006)
4 events:(1) discovery, (2) exploit,(3) disclosure, (4) patch
Framework for analysis of security advisories (n=80,000)
Frei(2009)Frei et al. (2009)
6 events between phases: (1) creation, (2) discovery, (3) exploit, (4) disclosure, (5) patch availability, and (6) patch installation
a) Motivation of vendors b) Motivation of cyber-criminals c) Vulnerability market d) Governmente) Researchers
Frei (2009): Case study comparing Microsoft and Apple regarding zero day patches and over due patches
Frei et al. (2009): Analysis of security bulletins (n=200,000)
Shahzadet al. (2012)
3 events: (d) disclosure of the vulnerability to the public, (p) release of patch to neutralize the threat, (e) exploitation of the vulnerability with a script virus, tool or other breach,
a) Exploitation behavior of hackers b) Patching behavior of vendors c) Discovery and disclosure behavior of independent organizations
Exploratory measurement study of software vulnerabilities (n=46,310 vulnerabilities)
Employs association rule mining to extract rules of exploitation behavior of hackers and patching behavior of vendors
Marconato et al. (2013)
4 events: (1) discovery of vulnerability, (2) disclosure of vulnerability, (3) release of patch, (4) availability of exploit
a) Behavior of attackersb) Behavior of system administrator
Stochastic modelling of security risks faced by an information system in operation
_______________________________________________________________________________________________________________________________________________
Copyright © 2017 S. M. Monzur Murshed

Chapter 2: Literature review 12_______________________________________________________________________________________________________________________________________________
These prior studies of vulnerability lifecycle events have examined a variety of
topics. Arbaugh et al. (2000) examined the sequencing of events in three case studies,
reporting that birth, discovery, and disclosure always occurred in order, but after
disclosure the vulnerability can be further disclosed, made public, scripted or corrected in
any order: “Automating a vulnerability, not just disclosing it, serves as the catalyst for
widespread intrusions” (p. 57). Schneier (2000) was concerned with disclosure policy,
arguing that neither full disclosure nor secrecy can “solve” computer security. Rescorla
(2005) examined trends over time, concluding that available data does not show a clear
improvement in software quality despite increased effort to find and patch security holes.
Frei et al. (2006), Frei (2009), and Frei et al. (2009) examine the impact of various
vendor behaviours. Anablagan (2009) examined the application of statistical prediction
models from reliability engineering. Marconato et al. (2013) examined time intervals
between discovery and disclosure dates, and between exploit availability and disclosure
dates, specifying both intervals as beta distributions, and estimating model parameters.
None of the prior vulnerability lifecycle studies summarized in Table 4 specifically
examined the determinates of the time taken to discover and fix vulnerabilities.
Other prior research has identified various factors that may be related to software
vulnerabilities.
Software begins with architecture, and Feng et al. (2016) argues that architectural
flaws may be one of the significant underlying causes causes of the difficulty of fixing
security issues. Although rigorous research in this area is limited, the authors present
some empirical results suggesting that architectural flaws are strongly correlated with _______________________________________________________________________________________________________________________________________________
Copyright © 2017 S. M. Monzur Murshed

Chapter 2: Literature review 13_______________________________________________________________________________________________________________________________________________
high rates of security bugs.
Software is implemented in source code, and Wheeler (2015) writes about secure
coding practices – design and implementation guidelines for coding secure programs.
Similarly, McGraw (2006) calls for “building security in” at the design stage, and
Foreman (2009) argues for managing potential vulnerabilities to IT systems rather than
reactively cleaning up after a violation. A new software patch could contain a new
vulnerability (Beattie et al., 2006; US-CERT, 2009), and new releases of software that fix
vulnerabilities in older versions could introduce new vulnerabilities (Rescorla, 2005).
There is a literature on software testing to discover vulnerabilities sooner.
Merkow & Raghavan (2012) advocate for early consideration of test cases and testing
methods during architecture and coding. Kaner (1999) writes: “Testing and fixing can be
done at any stage in the cycle. However, the cost of finding and fixing errors increases
dramatically as development progress.”
Researchers have examined the behaviours of the software vendor. There is an
extensive literature on disclosure policies (Schneier, 2000) – how organizations and
individuals developing software can and/or should respond to learning about a
vulnerability in their software. Arbaugh et al. (2000, p. 54) writes: “The many levels of
disclosure comprise a vast continuum of who was informed and what aspects of the
vulnerability the disclosure revealed.” Nizovtsev & Thursby (2007), Cavusoglu et al.
(2007), and Arora et al. (2008) employ game-theoretic models to explore disclosure
trade-offs across a range of circumstances. Frei et al. (2006) and Mitra & Ransbotham
(2015) are large-sample empirical studies of vendor behavior. Ransbotham et al. (2012) _______________________________________________________________________________________________________________________________________________
Copyright © 2017 S. M. Monzur Murshed

Chapter 2: Literature review 14_______________________________________________________________________________________________________________________________________________
examines the efficiency of the reward structures for security vulnerability reporting.
Others have investigated vendor patch policies to disseminate fixes for vulnerabilities
(Okamur et al. 2009; Frei, 2009). Ioannidis et al. (2012) examines vendor patch policies
by developing a mathematical model of costly deployment of software patches and
computing the optimal frequencies under varying conditions. August & Tunca (2011)
examine vendor liability, specifically the comparative effectiveness of three different
policies: (1) making the vendor liable for damages, (2) making the vendor liable for
patching costs, and (3) government imposed security standards.
There is a body of research around vulnerability prediction models that attempts
to predict which parts of code are most likely to contain vulnerabilities and thus focus
attention on the areas of highest risk (Shin et al. 2011). Much of this research focuses on
technical aspects of the code – either component-level attributes such as source lines of
code, alert density from static analysis tools, and code churn information (Gegick et al.
2008), or file headers and function call relationships between components (Neuhasue et
al. 2007). Walden et al. (2009) examined vulnerability prediction at the project level
using a security resource indicator (SRI) computed as the sum of four binary values:
(i) existence of a security URL, (ii) existence of a security e-mail address, (iii) existence
of a vulnerability list, and (iv) existence of secure development guidelines; the authors
examined 14 open source PHP web applications, and also examined the relationship
between three complexity metrics and vulnerabilities.
In one of the largest studies in this stream, Shin et al. (2011) examined whether
software metrics for complexity, code churn, and developer activity – captured by the _______________________________________________________________________________________________________________________________________________
Copyright © 2017 S. M. Monzur Murshed
Chapter 2: Literature review 15_______________________________________________________________________________________________________________________________________________
acronym “CCD” – can discriminate between vulnerable and neutral files and predict
vulnerabilities. The study reports that CCD metrics can discriminate between vulnerable
and neutral files and can predict vulnerabilities with >85% probability of detection but
with less than 3% precision. Even with high numbers of false positives, the authors argue
that CCD metrics can reduce the vulnerability inspection effort compared to a random
selection of files. Shin & Williams (2008a) and (2008b) report early results of this
approach with smaller sets of metrics and data sets.
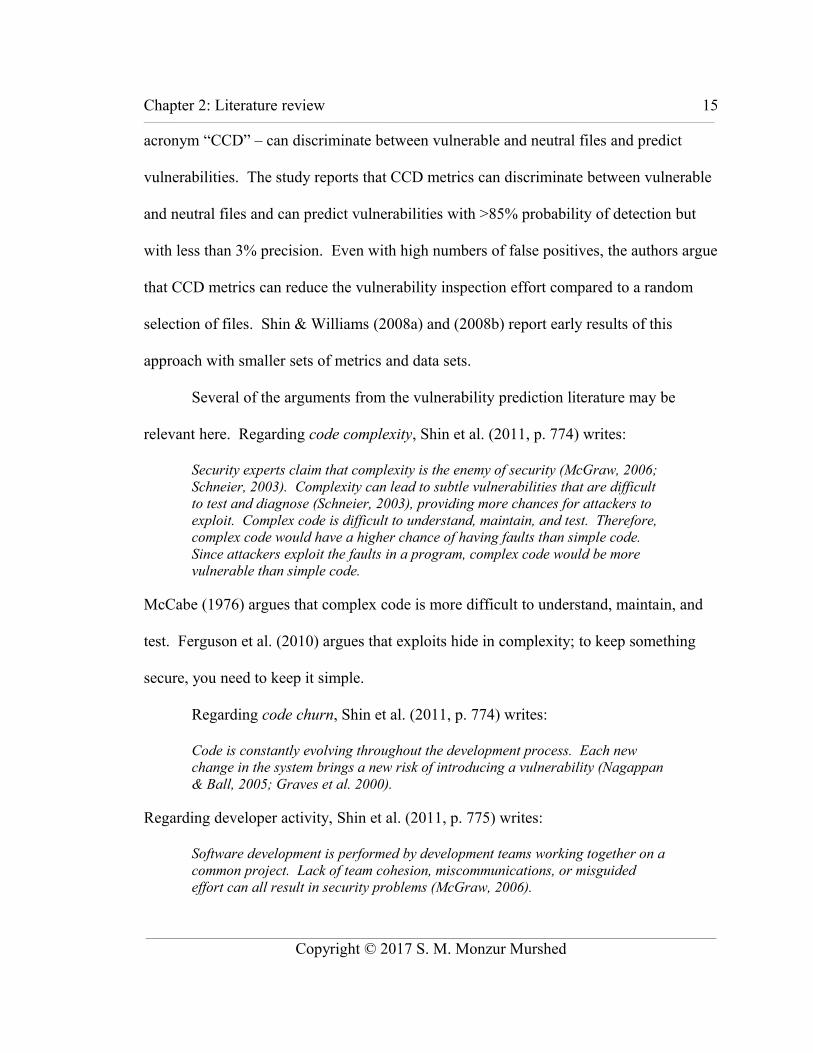
Several of the arguments from the vulnerability prediction literature may be
relevant here. Regarding code complexity, Shin et al. (2011, p. 774) writes:
Security experts claim that complexity is the enemy of security (McGraw, 2006; Schneier, 2003). Complexity can lead to subtle vulnerabilities that are difficult to test and diagnose (Schneier, 2003), providing more chances for attackers to exploit. Complex code is difficult to understand, maintain, and test. Therefore, complex code would have a higher chance of having faults than simple code. Since attackers exploit the faults in a program, complex code would be more vulnerable than simple code.
McCabe (1976) argues that complex code is more difficult to understand, maintain, and
test. Ferguson et al. (2010) argues that exploits hide in complexity; to keep something
secure, you need to keep it simple.
Regarding code churn, Shin et al. (2011, p. 774) writes:
Code is constantly evolving throughout the development process. Each new change in the system brings a new risk of introducing a vulnerability (Nagappan & Ball, 2005; Graves et al. 2000).
Regarding developer activity, Shin et al. (2011, p. 775) writes:
Software development is performed by development teams working together on a common project. Lack of team cohesion, miscommunications, or misguided effort can all result in security problems (McGraw, 2006).
_______________________________________________________________________________________________________________________________________________
Copyright © 2017 S. M. Monzur Murshed
Chapter 2: Literature review 16_______________________________________________________________________________________________________________________________________________
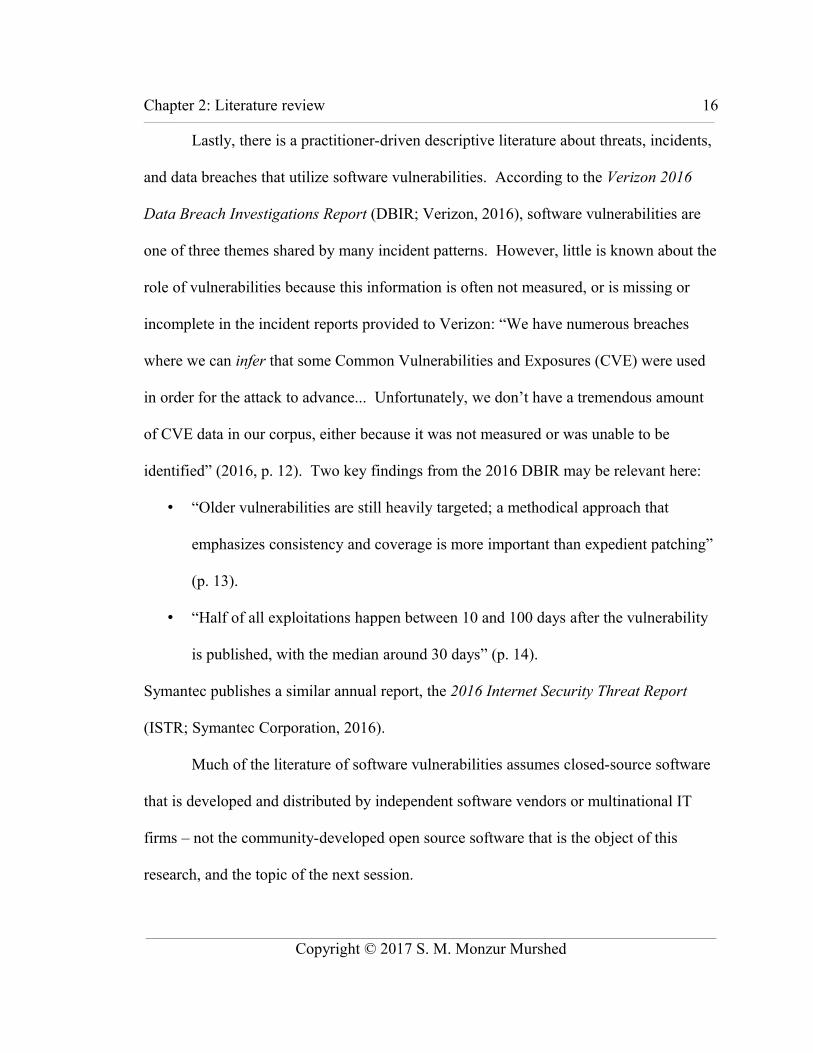
Lastly, there is a practitioner-driven descriptive literature about threats, incidents,
and data breaches that utilize software vulnerabilities. According to the Verizon 2016
Data Breach Investigations Report (DBIR; Verizon, 2016), software vulnerabilities are
one of three themes shared by many incident patterns. However, little is known about the
role of vulnerabilities because this information is often not measured, or is missing or
incomplete in the incident reports provided to Verizon: “We have numerous breaches
where we can infer that some Common Vulnerabilities and Exposures (CVE) were used
in order for the attack to advance... Unfortunately, we don’t have a tremendous amount
of CVE data in our corpus, either because it was not measured or was unable to be
identified” (2016, p. 12). Two key findings from the 2016 DBIR may be relevant here:
• “Older vulnerabilities are still heavily targeted; a methodical approach that
emphasizes consistency and coverage is more important than expedient patching”
(p. 13).
• “Half of all exploitations happen between 10 and 100 days after the vulnerability
is published, with the median around 30 days” (p. 14).
Symantec publishes a similar annual report, the 2016 Internet Security Threat Report
(ISTR; Symantec Corporation, 2016).
Much of the literature of software vulnerabilities assumes closed-source software
that is developed and distributed by independent software vendors or multinational IT
firms – not the community-developed open source software that is the object of this
research, and the topic of the next session.
_______________________________________________________________________________________________________________________________________________
Copyright © 2017 S. M. Monzur Murshed

Chapter 2: Literature review 17_______________________________________________________________________________________________________________________________________________
2.2 Open source softwareOpen source software refers to software distributed under open source licenses
that allow users to use, modify, and redistribute the software, in compliance with the
Open Source Definition (OSD) maintained by the Open Source Initiative (OSI). This is
closely related to the four freedoms of the Free Software Definition (FSD) maintained by
the Free Software Foundation (FSF): (0) the freedom to run the program for any purpose,
(1) the freedom the study how the program works and change it, (2) the freedom
redistribute copies to others, and (3) the freedom to distribute modified versions to others
(Stallman, 1996). Some researchers employ hybrid labels that include both ideas of open
and free, such as FOSS (Free and open source software), FLOSS (Free and libre open
source software) or F/LOSS (Free/libre open source software). This research employs
the simpler label of “open source software” and examines projects that comply with the
OSD, while recognizing that all of the projects examined here are also free software in
compliance with the FSD. The is similar to the approach taken by Wheeler & Khakimov
(2015) regarding the larger problem of securing open source software more generally.
Advocates of free and open source software argue that the four freedoms are a
precondition for secure computing: (i) vulnerabilities are more easily discovered;
(ii) vulnerabilities that are discovered can be studied and exposed, (iii) fixes can be
developed, and (iv) fixes can be distributed to others. Vulnerabilities include both “bugs”
introduced by mistake and also deliberate additions of malicious features either by the
vendor or by others. A statement from the Free Software Foundation explains this
position (Free Software Foundation, 2014):
_______________________________________________________________________________________________________________________________________________
Copyright © 2017 S. M. Monzur Murshed

Chapter 2: Literature review 18_______________________________________________________________________________________________________________________________________________
Software freedom is a precondition for secure computing; it guarantees everyone the ability to examine the code to detect vulnerabilities, and to create new and safe versions if a vulnerability is discovered. Your software freedom does not guarantee bug-free code, and neither does proprietary software: bugs happen no matter how the software is licensed. But when a bug is discovered in free software, everyone has the permission, rights, and source code to expose and fix the problem. That fix can then be immediately freely distributed to everyone who needs it. Thus, these freedoms are crucial for ethical, secure computing.
Proprietary, (aka nonfree) software relies on an unjust development model that denies users the basic freedom to control their computers. When software's code is kept hidden, it is vulnerable not only to bugs that go undetected, but to the easier deliberate addition and maintenance of malicious features...
Free software cannot guarantee your security, and in certain situations may appear less secure on specific vectors than some proprietary programs. As was widely agreed in the aftermath of the OpenSSL "Heartbleed" bug, the solution is not to trade one security bug for the very deep insecurity inherently created by proprietary software – the solution is to put energy and resources into auditing and improving free programs.
John Sullivan, the Executive Director of the Free Software Foundation, writes about the
impact and importance of the option to modify software (Sullivan, 2014, p. 2):
The mere existence of the option for people to inspect, modify, and share the software they use has an important effect which, if it became the norm, would cause a dramatic change in the behavior of software companies, and the character of software....
We do need everyone to have the right to modify software; we need everyone to have that potential. The fact that any given person around the world could step up and make a modification to a program to make it act differently – such as removing a back door installed by some company – is a powerful check against unethical control of individuals through software.
Fogel (2006) writes about the practice of developing open source software,
including starting a project, choosing a license, technical infrastructure (for
communication, version control, and bug tracking), social and political infrastructure
(“governance” by meritocracy, election of new committers by the existing committers),
commercial relationships, communications, release management, and “managing”
_______________________________________________________________________________________________________________________________________________
Copyright © 2017 S. M. Monzur Murshed

Chapter 2: Literature review 19_______________________________________________________________________________________________________________________________________________
volunteers. A second edition (Fogel, 2016), published online and maintained as a living
document, demonstrates how the technical infrastructure is very different today from
2006, while the organizing principles have persisted with little change.
Raymond (1999) introduced many open source concepts that remain prominent:
• “Every good work of software starts by scratching a developer's personal itch” (rule
1).
• “Good programmers know what to write. Great ones know what to rewrite (and
reuse)” (rule 2)
• “Treating your users as co-developers is your least-hassle route to rapid code
improvement and effective debugging” (rule 6).
• “Release early. Release often” (rule 7).
• Linus's Law: “Given a large enough beta-tester and co-developer base, almost every
problem will be characterized quickly and the fix obvious to someone. Or, less
formally, 'Given enough eyeballs, all bugs are shallow” (rule 8).
The last assertion implies that projects with a larger developer community and a larger
engaged user community (especially active beta testers) may be able to respond to
vulnerabilities and issue fixes more quickly.
There is also a growing body of scholarly work about vulnerabilities in open
source software. Meneely & Williams (2009, 2010) and Datta et al. (2014) empirically
examine Raymond’s assertion of Linus’s Law. Meneely et al. (2013) and Bosu et al.
(2014) examine introduction of vulnerabilities in open source projects. Meneely et al.
(2014) examines the association between code review metrics and vulnerabilities. _______________________________________________________________________________________________________________________________________________
Copyright © 2017 S. M. Monzur Murshed

Chapter 2: Literature review 20_______________________________________________________________________________________________________________________________________________
Ransbotham (2010) examines exploitation of vulnerabilities in open source projects.
Bhattacharya et al. (2013) examines bug reports and fixes in open source mobile apps.
Likewise, there is a growing practitioner literature about vulnerabilities in open
source software. According to Constantin (2014), developers mistakenly assume that
libraries from long-running open-source projects are well-written and bug-free. In fact,
third-party code may contain vulnerabilities, and these vulnerabilities have propagated
into thousands of products:
The reality is that many open source projects, even the ones producing code that’s critical to the Internet infrastructure, are often poorly funded, understaffed and have nowhere close to enough resources to pay for professional code audits or the manpower to engage in massive rewrites of old code.
Constantin speculates that vulnerabilities are more likely to occur and remain
undiscovered in old code or code of low maturity, in projects with less rigorous testing or
fewer testing tools, and too few developers.
According to some practitioner arguments, open source projects may be capable
of responding to discoveries more quickly and more effectively than vendors of closed
source software. Jim Zemlin, Executive Director of the Linux Foundation, offered the
following remarks at the 2015 Linux Collaboration Summit (Kerner, 20015):
"In open source, we put our laundry out to air in the front yard."
"In these cases [of damaging security issues found recently in open source code] the eyeballs weren't really looking." Modern software security is hard because modern software is very complex, Zemlin said. But open source can provide a unique response to growing software complexity and the associated risk of security vulnerabilities. "We all have access and can all work together," Zemlin said. "Open source by its nature lets us have a collective response to a collective problem."
However, in an empirical comparison of 17 open source and closed source software
_______________________________________________________________________________________________________________________________________________
Copyright © 2017 S. M. Monzur Murshed

Chapter 2: Literature review 21_______________________________________________________________________________________________________________________________________________
packages, Schryen (2011) writes: “The analysis illustrates there is no empirical evidence
that the particular type of software development is the primary driver of security. Rather,
the particular policies of vendors determine the patching behavior” (p. 130). Comparing
open and closed development practices may be asking the wrong question (Schryen &
Rich, 2010): “Open source and closed source software development do not significantly
differ in terms of vulnerability disclosure and vendors’ patching behavior, a phenomenon
that has been widely assumed, but hardly investigated” (Schryen, 2011, p. 131).
2.3 Vulnerability databases and standards
Hundreds of databases track security-related issues for different software
applications (Massacci & Nguyen, 2010). Some are managed by governments, others by
private security companies, or open security communities, or individuals. According to
Joh (2011), the MITRE Corporation CVE format (explained below) is the de facto
standard way of labelling and describing software vulnerabilities.
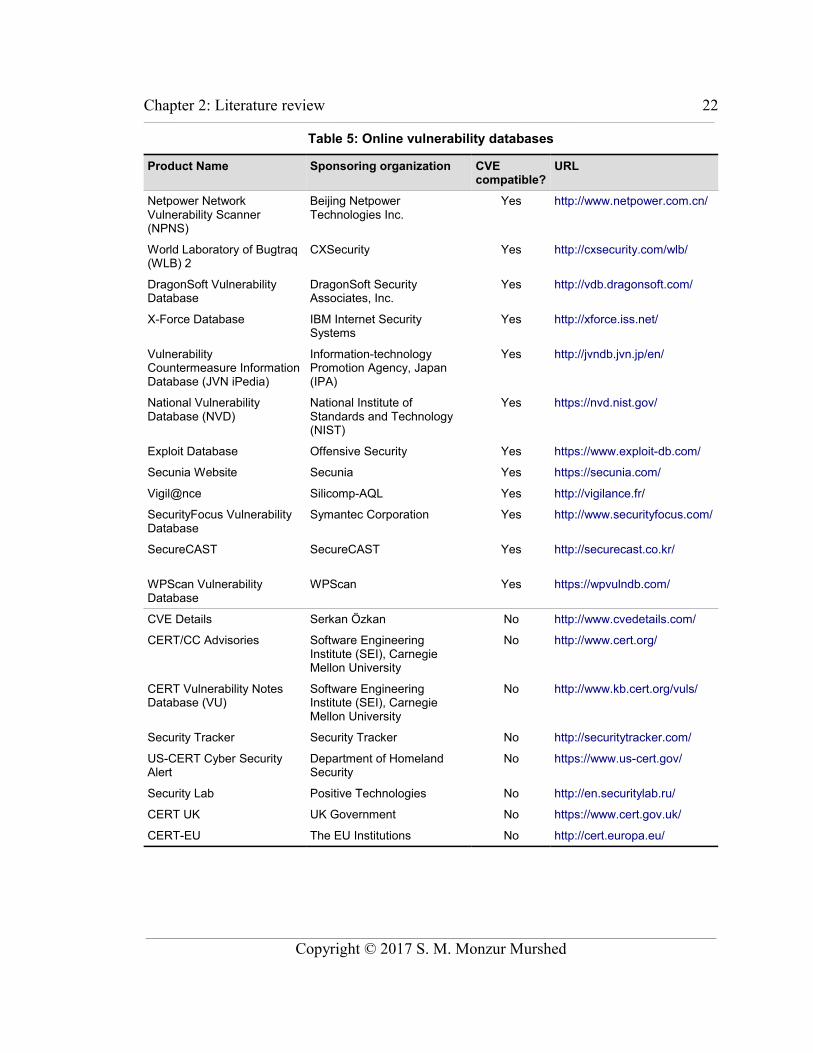
Table 5 is a summary of online vulnerability databases, the sponsoring
organization, whether or not the database is formally certified as CVE compatible by
MITRE Corporation, and a URL for the website. As of December 1 2016, there were
148 products and services of 81 organizations certified as CVE compatible. However,
many of the databases in Table 5 not formally certified as CVE compatible do also report
CVE records and utilize the CVE dictionary.
_______________________________________________________________________________________________________________________________________________
Copyright © 2017 S. M. Monzur Murshed
Chapter 2: Literature review 22_______________________________________________________________________________________________________________________________________________
Table 5: Online vulnerability databases
Product Name Sponsoring organization CVEcompatible?
URL
Netpower Network Vulnerability Scanner (NPNS)
Beijing Netpower Technologies Inc.
Yes http://www.netpower.com.cn/
World Laboratory of Bugtraq (WLB) 2
CXSecurity Yes http://cxsecurity.com/wlb/
DragonSoft Vulnerability Database
DragonSoft Security Associates, Inc.
Yes http://vdb.dragonsoft.com/
X-Force Database IBM Internet Security Systems
Yes http://xforce.iss.net/
Vulnerability Countermeasure Information Database (JVN iPedia)
Information-technology Promotion Agency, Japan (IPA)
Yes http://jvndb.jvn.jp/en/
National Vulnerability Database (NVD)
National Institute of Standards and Technology (NIST)
Yes https://nvd.nist.gov/
Exploit Database Offensive Security Yes https://www.exploit-db.com/
Secunia Website Secunia Yes https://secunia.com/
Vigil@nce Silicomp-AQL Yes http://vigilance.fr/
SecurityFocus Vulnerability Database
Symantec Corporation Yes http://www.securityfocus.com/
SecureCAST SecureCAST Yes http://securecast.co.kr/
WPScan Vulnerability Database
WPScan Yes https://wpvulndb.com/
CVE Details Serkan Özkan No http://www.cvedetails.com/
CERT/CC Advisories Software Engineering Institute (SEI), Carnegie Mellon University
No http://www.cert.org/
CERT Vulnerability Notes Database (VU)
Software Engineering Institute (SEI), Carnegie Mellon University
No http://www.kb.cert.org/vuls/
Security Tracker Security Tracker No http://securitytracker.com/
US-CERT Cyber Security Alert
Department of Homeland Security
No https://www.us-cert.gov/
Security Lab Positive Technologies No http://en.securitylab.ru/
CERT UK UK Government No https://www.cert.gov.uk/
CERT-EU The EU Institutions No http://cert.europa.eu/
_______________________________________________________________________________________________________________________________________________
Copyright © 2017 S. M. Monzur Murshed
Chapter 2: Literature review 23_______________________________________________________________________________________________________________________________________________
MITRE Corporation (2016c) describes CVEs as follows:
Common Vulnerabilities and Exposures (CVE) is a dictionary of common names (i.e., CVE Identifiers) for publicly known cybersecurity vulnerabilities. CVE's common identifiers make it easier to share data across separate network security databases and tools, and provide a baseline for evaluating the coverage of an organization’s security tools. If a report from one of your security tools incorporates CVE Identifiers, you may then quickly and accurately access fix information in one or more separate CVE-compatible databases to remediate the problem.
CVE was launched in 1999. It is the “common enumeration” used by the U.S. National
Vulnerability Database (NVD) and most other vulnerability databases (Joh, 2011).
Previously, security tools had each used their own databases and naming conventions. A
CVE record includes a unique identifier (CVE ID), a description, references, and the date
that the entry was created.
MITRE Corporation is the primary CVE Numbering Authority (CNA) that assigns
CVEs to new vulnerabilities (MITRE, 2016b). As of June 2016, MITRE had approved
25 other CNAs (MITRE, 2016d): 4 third-party coordinators (CERT/CC, Distributed
Weakness Filing Project, ICS-CERT, and JPCERT/CC), and 22 software vendors
including proprietary vendors (Adobe, Apple, BlackBerry, Cisco, EMC, Google, Hewlett
Packard Enterprise, HP Inc., IBM, Intel, Juniper, Micro Focus, Microsoft, Oracle, SGI,
and Symantec), open source foundations (including the Apache Software Foundation,
Debian GNU/Linux, FreeBSD, Mozilla, Red Hat, and Ubuntu), and sponsors of open
source (Google for Chromium and the Android Open Source Project).
Other related standards include the Common Weakness Enumeration (CWE) for
vulnerability type, the Common Platform Enumeration (CPE) for naming affected
products, and the Common Vulnerability Scoring System (CVSS) for severity._______________________________________________________________________________________________________________________________________________
Copyright © 2017 S. M. Monzur Murshed

Chapter 2: Literature review 24_______________________________________________________________________________________________________________________________________________
2.4 Summary and synthesis of key findings from the literature
Seven insights from across the scholarly and practitioner literature are particularly
relevant for this thesis. First, a software vulnerability can be defined as a weakness that
could be exploited to cause harm (Pfleeger et al. 2015). The Common Vulnerabilities
and Exposure (CVE) system is the reference standard for identifying and uniquely
labelling publicly-known software vulnerabilities. Each vulnerability is assigned a
unique identifier called a CVE ID, and each CVE ID receives a corresponding record in
the National Vulnerability Database (NVD) – a publicly-accessible repository of
standards-based vulnerability management data maintained by the U.S. National Institute
of Standards and Technology (NIST). There are many vulnerability databases and
security advisories, most of which employ CVE IDs and other NVD standards.
Second, vulnerabilities vary widely in severity: a severe vulnerability can be
exploited for much harm, but low-severity vulnerabilities may result in little or no harm.
Third, there are multiple levels of security analysis, with multiple variables at
each level. A software system may be hierarchical, with an architecture of nested
software components, each of which may contain other software components, and each
component may contain vulnerabilities. Actions taken at a component-level to introduce
fewer vulnerabilities, to reduce the severity of vulnerabilities that are introduced, or to
reduce the time taken to discover and fix vulnerabilities could all improve component-
level security, but a severe vulnerability in a different component could compromise
system-level security of the larger software system.
Fourth, the themes emphasized within extant research on software vulnerabilities
_______________________________________________________________________________________________________________________________________________
Copyright © 2017 S. M. Monzur Murshed

Chapter 2: Literature review 25_______________________________________________________________________________________________________________________________________________
include factors impacting vulnerability introduction and severity, policies for disclosing
vulnerabilities, and the exploitation of vulnerabilities. The time to discover and fix
vulnerabilities has received less attention.
Fifth, sources in the scholarly and practitioner literature assert various factors
associated with software that is “more secure” (variously defined, mainly in the sense of
introducing fewer and less severe vulnerabilities):
• Access to source code (Raymond, 1999)
• Software freedom (FSF, 2014; Sullivan, 2014): the capabilities to use, examine,
and modify software, and to distribute modified versions
• Simplicity (Ferguson et al. 2010); low complexity (Schneier, 2003; Shin et al.
2011); code that is easy to understand (McCabe, 1976)
• “Many eyeballs” (Raymond, 1999) in various forms: more committers, more
users that are co-developers, more beta-testers, and more users stressing the
software in different ways (Meneely & Williams, 2009, 2010; Datta et al. 2014;
Meneely et al. 2014)
• Secure architectural designs with “architectural integrity” (Feng et al. 2016)
• Use and enforcement of secure software coding practices (McGraw, 2006;
Merkow & Raghavan, 2012; Pfleeger et al. 2015; Wheeler & Khakimov, 2015)
• Use of more and better testing tools (Hewlett Packard, 2013; Constantin, 2014)
and audit services (Perlroth, 2014a)
• Committers that value security (Walden et al. 2009)
Sixth, sources in the scholarly and practitioner literature likewise assert various _______________________________________________________________________________________________________________________________________________
Copyright © 2017 S. M. Monzur Murshed

Chapter 2: Literature review 26_______________________________________________________________________________________________________________________________________________
factors associated with software that is “less secure” (variously defined, mainly in the
sense of introducing more and higher severity vulnerabilities):
• No access to source code (FSF, 2014); proprietary distribution licenses that
restrict use, examination of source code, modification, and/or redistribution
• Complexity – “the enemy of security” (Schneier, 2003; q.v., McCabe, 1976;
Ferguson et al. 2010; Shin et al. 2011)
• Higher code churn (Graves et al. 2000; Nagappan & Ball, 2005; Shin et al. 2011)
• Inadequate resources (Wheeler & Khakimov, 2015)
• Poor coordination and communication between developers (Shin et al. 2011)
• Architectural flaws, especially unstable interfaces (Feng et al. 2016)
• Less experienced developers unfamiliar with secure coding (Wheeler, 2015)
Seventh, advocates of free and open source software argue that the freedoms to
use, examine, modify, and redistribute are a precondition to secure software (Free
Software Foundation, 2014; Sullivan, 2014). According to the strongest form of this
argument, software without these freedoms, including proprietary software with no
access to source code, must be regarded as insecure.
This chapter has reviewed the scholarly literature on software vulnerabilities,
open source software, and vulnerability databases and standards. The next chapter
reviews the publicly-available data sets about software vulnerabilities and open source
software projects.
_______________________________________________________________________________________________________________________________________________
Copyright © 2017 S. M. Monzur Murshed

An investigation of software vulnerabilities in open source software projects using data from publicly-available sources Copyright © 2017 S. M. Monzur Murshed_______________________________________________________________________________________________________________________________________________
3 Publicly-available data setsThis chapter examines the content of two publicly-accessible online databases:
CVE Details (https://www.cvedetails.com) and Black Duck Open Hub
(https://openhub.net). Each database is described in its own section.
3.1 CVE Details
CVE Details is a website providing an easy-to-use web interface to CVE
vulnerability data for corporate IT security professionals. According to the CVE Details
website (accessed September 30, 2016), it was created by Serkan Özkan, a security
consultant who “spent too many hours trying to find an easy to use list of security
vulnerabilities.” It emerged from beta testing in 2010 (https://archive.org, May 15 2010).
The site employs an advertising business model with revenues from advertisers seeking
to target their messages to security professionals.
The CVE Details database aggregates CVE vulnerability data from the official
daily xml feeds of the National Vulnerability Database (NVD) along with other sources
including the Offensive Security Exploit Database (https://www.exploit-db.com/), the
Rapid7 Exploit Database (https://www.rapid7.com/db/modules/), Microsoft Security
Bulletins (https://technet.microsoft.com/en-us/security/bulletins.aspx), and additional
information from product vendors and comments submitted by users (Özkan, 2012). On
August 1 2016, there were 77,635 CVE records in the database. Figure 1 illustrates the
relationship between the CVE Details database, the National Vulnerability Database, and
the CVE List at the CVE Website maintained by MITRE Corporation.
_______________________________________________________________________________________________________________________________________________
27

Chapter 3: Publicly-available data sets 28_______________________________________________________________________________________________________________________________________________
The CVE Details database is browsable or searchable by various fields, including
CVE ID, vendor, product, product version, vulnerability type, and date range. Search
results are available in two main formats, summary table reports and individual CVE
records, both also shown in Figure 1. Individual CVE records are displayed in a single
web page. Reports of multiple CVE records are displayed in summary tables with one
CVE ID per row. From a summary table report, a user can click through any CVE to
view the individual CVE record. CVE Details can also provide various additional
reports, including vulnerability trends over over time by product or by vendor.
A CVE Details summary table report includes fourteen fields for each CVE
record:
• CVE ID: the unique identification number for the vulnerability. For example, the
_______________________________________________________________________________________________________________________________________________
Copyright © 2017 S. M. Monzur Murshed
Figure 1: Data aggregation by CVE Details
Chapter 3: Publicly-available data sets 29_______________________________________________________________________________________________________________________________________________
vulnerability known as “Heartbleed” (CBC News, 2014, 2015; Perlroth, 2014a;
Kerner, 2015) has a CVE ID of “CVE-2014-0160”
(https://www.cvedetails.com/cve-details.php?t=1&cve_id=CVE-2014-0160).
• CWE ID: an identification number employing the Common Weakness
Enumeration (CWE) standard, a formal dictionary of software weakness types
maintained by MITRE Corporation (https://cwe.mitre.org/). The Heartbleed
vulnerability has a CWE ID of 119, corresponding to “Improper restriction of
operations within the bounds of a memory buffer”
(https://cwe.mitre.org/data/definitions/119.html).
• # of Exploits: the number of known published exploits utilizing the vulnerability.
The Heartbleed vulnerability has four published exploits. Although not shown in
the summary table, from clicking through to the CVE record, the four exploits are
exploit-db 32745 (https://www.exploit-db.com/exploits/32745/) and exploit-db
32764 (https://www.exploit-db.com/exploits/32764/) in the Offensive Security
Exploit Database, and two Metasploit modules in the Rapid7 Exploit Database
(https://www.rapid7.com/db/modules/auxiliary/scanner/ssl/openssl_heartbleed;
https://www.rapid7.com/db/modules/auxiliary/server/openssl_heartbeat_client_m
emory).
• Vulnerability Type(s): tags for thirteen categories of vulnerability, assigned by
CVE Details using a combination of keyword matching algorithms and CWE IDs.
The thirteen types are (1) denial of service (DoS), (2) code execution,
(3) overflow, (4) cross-site scripting (XSS), (5) directory traversal, (6) bypass _______________________________________________________________________________________________________________________________________________
Copyright © 2017 S. M. Monzur Murshed

Chapter 3: Publicly-available data sets 30_______________________________________________________________________________________________________________________________________________
something, (7) gain information, (8) gain privileges, (9) SQL injection, (10) file
inclusion, (11) memory corruption, (12) cross-site request forgery (CSRF), and
(13) http response splitting. CVE Details does not explicitly define these type
categories or details of its keyword matching algorithms, however all thirteen
labels are familiar concepts commonly found in the penetration testing
practitioner literature (e.g., Kim, 2014) and in sources on IT security (e.g.,
Pfleeger et al. 2015). The CVE Details website (accessed August 1 2016) advises
that vulnerability type should be used as additional information and warns that it
“may not be reliable.” The Heartbleed vulnerability is tagged with the “overflow”
and “gain information” vulnerability types.
• Publish Date: A date, not explicitly defined by CVE Details, that appears to
match the “Date Entry Created” field of the CVE record in the MITRE
Corporation CVE List, and the “Original release date” field of the CVE record in
the National Vulnerability Database. The Heartbleed vulnerability has a Publish
Date of “2014-04-07”.
• Update Date: A date, not explicitly defined by CVE Details, that appears to
match the “Last revised” field of the CVE record in the National Vulnerability
Database. The Heartbleed vulnerability has an Update Date of “2016-11-30”.
• CVSS Score: A severity metric employing the Common Vulnerability Scoring
System (CVSS), an open industry standard maintained for communicating the
characteristics and severity of software vulnerabilities maintained by the Forum of
Incident Response and Security Teams (FIRST; https://www.first.org/cvss). This _______________________________________________________________________________________________________________________________________________
Copyright © 2017 S. M. Monzur Murshed

Chapter 3: Publicly-available data sets 31_______________________________________________________________________________________________________________________________________________
field reports the CVSS “base score”, an aggregation of six lower-level CVSS
metrics (also reported by CVE Details, see below) intended to approximate the
ease of exploit and the impact of exploit. Base score can range from 0 to 10, with
10 being the most severe. All seven CVSS metrics in CVE Details are aggregated
from the National Vulnerability Database. The Heartbleed vulnerability has a
CVSS Score of 5.
• Gained Access Level: The level of access that can be obtained by exploiting the
vulnerability. The source for this metric is not stated at the CVE Details website;
it may be user-submitted content, or it may be an automated outcome from
keyword matching algorithms. The Heartbleed vulnerability has a Gained Access
Level of “None.”
• Access Vector: A CVSS metric of how a vulnerability may be exploited; can be
local (L), adjacent network (A), or network (N). The Heartbleed vulnerability has
an Access Vector of “Network Exploitable” (N).
• Access Complexity: A CVSS metric of how easy or difficult it is to exploit the
discovered vulnerability; may be high (H), medium (M), or low (L). The
Heartbleed vulnerability has an Access Complexity of “Low” (L; “Specialized
access conditions or extenuating circumstances do not exist;. Very little
knowledge or skill is required to exploit.”).
• Authentication: A CVSS metric of the number of times that an attacker must
authenticate to a target to exploit it; may be multiple (M), single (S) or not
required (N). The Heartbleed vulnerability has an Authentication of “Not _______________________________________________________________________________________________________________________________________________
Copyright © 2017 S. M. Monzur Murshed

Chapter 3: Publicly-available data sets 32_______________________________________________________________________________________________________________________________________________
Required” (N; “Authentication is not required to exploit the vulnerability.”).
• Confidentiality Impact, Integrity Impact, and Availability Impact: A set of
three CVSS metrics of the impact of the vulnerability on the confidentially of data
processed by the system, the integrity of the exploited system, and the availability
of the target system, respectively; may be none (N), partial (P), or complete (C).
The Heartbleed vulnerability has impacts of “Partial” (P; “There is considerable
informational disclosure.”), “None” (N; “There is no impact to the integrity of the
system.”), and “None” (N; “There is no impact to the availability of the system.”),
respectively.
The terms “product” and “vendor” refer to the corresponding fields in the Common
Platform Enumeration (CPE) dictionary (https://nvd.nist.gov/cpe.cfm), another related
security standard maintained by the NIST National Vulnerability Database. The CPE
dictionary is a structured naming scheme for information technology systems, software,
and packages, where product refers to the IT artifact, and vendor refers to the
organization producing the IT artifact. For some community-developed open source
software projects, these fields may be the same. The Heartbleed vulnerability affects the
OpenSSL software (product = “Openssl” in CPE and CVE Details), an open source
software project maintained by the OpenSSL Foundation (vendor = “Openssl” in CPE
and CVE Details). For other open source projects, these fields may be different. For
example, the Apache HTTP Server (product = “Http Server”) examined later in section
4.2, is maintained by the Apache Software Foundation (vendor = “Apache”), which hosts
many open source software projects – 132 products in CVE Details with known _______________________________________________________________________________________________________________________________________________
Copyright © 2017 S. M. Monzur Murshed

Chapter 3: Publicly-available data sets 33_______________________________________________________________________________________________________________________________________________
vulnerabilities.
An individual CVE record in CVE Details includes five additional categories of
information not reported in summary tables:
• Related OVAL Definitions: List of definitions (i.e., formal specifications) using
the Open Vulnerability and Assessment Language (OVAL), a standard format
used to specify what should be done to verify a vulnerability or a missing patch,
maintained by the Center for Internet Security (https://oval.cisecurity.org/). The
Heartbleed vulnerability has eight OVAL Definitions, each with a hyperlink to a
corresponding database record in the IT Security Database
(http://www.itsecdb.com/), an aggregator of OVAL definitions from multiple
sources.
• Products Affected by CVE: List of products and version numbers using the
CPE dictionary, including the first version affected by the vulnerability and the
last version affected by the vulnerability. The Heartbleed vulnerability affected
eleven different version of the Open SSL project, beginning with Open SSL
version 1.0.1a and last affecting Open SSL version 1.0.2 Beta1.
• Number of Affected Versions By Product: Count of the number of product
versions affected by the vulnerability, sorted by product. The Heartbleed
vulnerability affected only one product – 11 vulnerable versions of the Open SSL
project. Other vulnerabilities may affect multiple products.
• References for CVE: Links to websites with information about the vulnerability.
May include bug reports, commits to a version control system, security _______________________________________________________________________________________________________________________________________________
Copyright © 2017 S. M. Monzur Murshed

Chapter 3: Publicly-available data sets 34_______________________________________________________________________________________________________________________________________________
advisories, exploit code, and blog posts and articles about solutions and tools.
The Heartbleed vulnerability has approximately thirty-five references – an
unusually large number because the this vulnerability received much high-profile
attention. Between three and seven references is more typical, with some
vulnerabilities having just one or even no references. Section 7.2 reports the
results of a manual inspection of the references of twelve CVEs from the thesis
data set. It reports that the references may contain voluminous information not
captured in the fields of the CVE record or other security standards; however
(1) formats vary widely between references, (2) the number of references varies
widely between CVEs, (3) the quality of the references and the completeness of
the reference inventory are unknown, and (4) judgement is needed to interpret
information in each reference. Thus, large sample data collection from CVE
references is difficult to automate, and is outside the scope of this theses.
• Metasploit Modules Related to CVE: Links to records in the Rapid7 Exploit
Database to Metasploit modules that exploit the vulnerability. The Heartbleed
vulnerability has two Metasploit exploit modules.
Although not reported in the summary table reports, these additional fields are available
by clicking through to individual CVE records.
There are multiple ways to access the summary table reports and CVE records at
CVE Details. First, one could use a web browser to visit the CVE Details website,
browse the records or query an individual CVE or search on specific properties to
produce a summary table report, and view or save the results. Second, one could write _______________________________________________________________________________________________________________________________________________
Copyright © 2017 S. M. Monzur Murshed
Chapter 3: Publicly-available data sets 35_______________________________________________________________________________________________________________________________________________
software scripts to formulate HTTP requests to the CVE Details website, and then
“screen scrape” or parse the HTML responses, also using software scripts. CVE Details
does not offer an API.
There are known limitations to the CVE Details database, many of which are
inherited directly form upstream sources. From the CVE Details website (accessed
September 30, 2016):
CVE data have inconsistencies which affect accuracy of data displayed on www.cvedetails.com. For example a single product might have been defined with several different names. If a product is defined with different names in CVE data then they will be treated as different products by www.cvedetails.com. For example vulnerabilities related to Oracle Database 10g might have been defined for products "Oracle Database", "Oracle Database10g", "Database10g", "Oracle 10g" and similar. Or a PHP vulnerability might have been defined for Fedora Linux 10, so number of vulnerabilities or statistics are only as accurate as CVE data. Please make sure that you manually verify all data before using.
Furthermore:
• Only exact versions listed as "vulnerable products" in NVD xml feeds are listed as vulnerable. Due to data inconsistencies some vulnerable versions may be missing. Vulnerable configurations listed for vulnerabilities are not always consistent with vulnerable software listed in CVE definitions.
• Vendor, product names and version numbers are not consistent in NVD feeds, for example some products are listed with several names like Adobe Reader, Adobe Acrobat Reader or IE and Internet Explorer. So some of the vulnerabilities are reported for IE while others are reported for Internet Explorer. Make sure that you manually verify that you have checked all possible names for a product.
• It's even worse for version, edition etc numbers.
The same limitations will affect all vulnerability databases based on NVD feeds.
In summary, CVE Details is the source used in this research for publicly-available
information about security vulnerabilities. It reports standard metrics from the NIST
National Vulnerability Database, the standard source for information about software
_______________________________________________________________________________________________________________________________________________
Copyright © 2017 S. M. Monzur Murshed
Chapter 3: Publicly-available data sets 36_______________________________________________________________________________________________________________________________________________
vulnerabilities (Joh, 2011), aggregated with data from other sources. Data collection of
summary reports can be conveniently automated with web scraping and text mining
techniques from Munzert et al. (2015). Known limitations in the data set are similar to
those of other vulnerability databases based on the National Vulnerability Database.
3.2 Black Duck Open Hub
Open Hub (full name Black Duck Open Hub) is a public directory of free and
open source software. Originally founded in 2004 as Ohloh.net, it was acquired in 2009
by Geeknet (the owners of SourceForge, the largest hosting repository of open source
software projects at that time; https://sourceforge.net/), then acquired again in 2010 by
Black Duck Software, who then re-branded it as Black Duck Open Hub in 2014. Black
Duck Software (https://www.blackducksoftware.com/), is the largest of three major
providers of signature-based “clean IP” products and services – the others being Palamida
(http://www.palamida.com/) and Protecode (http://www.protecode.com/; acquired by
Synopsis in 2016; https://www.synopsys.com).
According to the Open Hub website (accessed August 2016), it offers “analytics
and search services for discovering, evaluation, tracking, and comparing open source
code and projects” comprising more than 21 billion lines of source code. It aggregates
data harvested directly from various open source software forges (online collaborative
facilities for developing and hosting projects, such as SourceForge, GitHub, and Gnu.org)
and version control repositories (including Subversion, Git, CVS, Mercurial, and Bazaar).
By connecting to project source code repositories, analyzing both the code’s history and ongoing updates, and attributing those updates to specific contributors, the Black Duck Open Hub can provide reports about the
_______________________________________________________________________________________________________________________________________________
Copyright © 2017 S. M. Monzur Murshed

Chapter 3: Publicly-available data sets 37_______________________________________________________________________________________________________________________________________________
composition and activity of project code bases and aggregate this data to track the changing demographics of the FOSS world.
Additionally, Open Hub benefits from community contributions:
The Open Hub is editable by everyone, like a wiki. All are welcome to join, add new projects, and make corrections to existing project pages. This public review helps to make the Black Duck Open Hub one of the largest, most accurate, and up-to-date FOSS software directories available. We encourage contributors to join the Open Hub and claim their commits on existing projects and add projects not yet on the site. By doing so, Open Hub users can assemble a complete profile of all their FOSS code contributions.
Open Hub provides graphical data visualizations and reports about projects, people, and
organizations, and comparative tools to compare projects (activity, code base,
contributors), languages (based on commits, contributors, lines of code changes, and total
number of new projects, and repositories (based on number of registered projects). The
project records are of primary interest here.
Within a project record, Open Hub reports code (total lines of code, lines of
comments, blank lines, programming languages used, and lines of code by language over
the full history of the project), activity (commits per month, files modified, lines of code
added, lines of code removed, and a complete commit history with contributor names),
and community (number of contributors per month, top contributors, user ratings, and
most recent contributors). Each project record also includes project summary, a quick
reference dashboard with links to project resources, information about open source
licenses, and metrics on project security.
The Ohloh API is a REST-based application programming interface to the Open
Hub database. According to the Ohloh API documentation, “You can use the Ohloh API
to create your own applications and web services based on Open Hub data” (Black Duck _______________________________________________________________________________________________________________________________________________
Copyright © 2017 S. M. Monzur Murshed
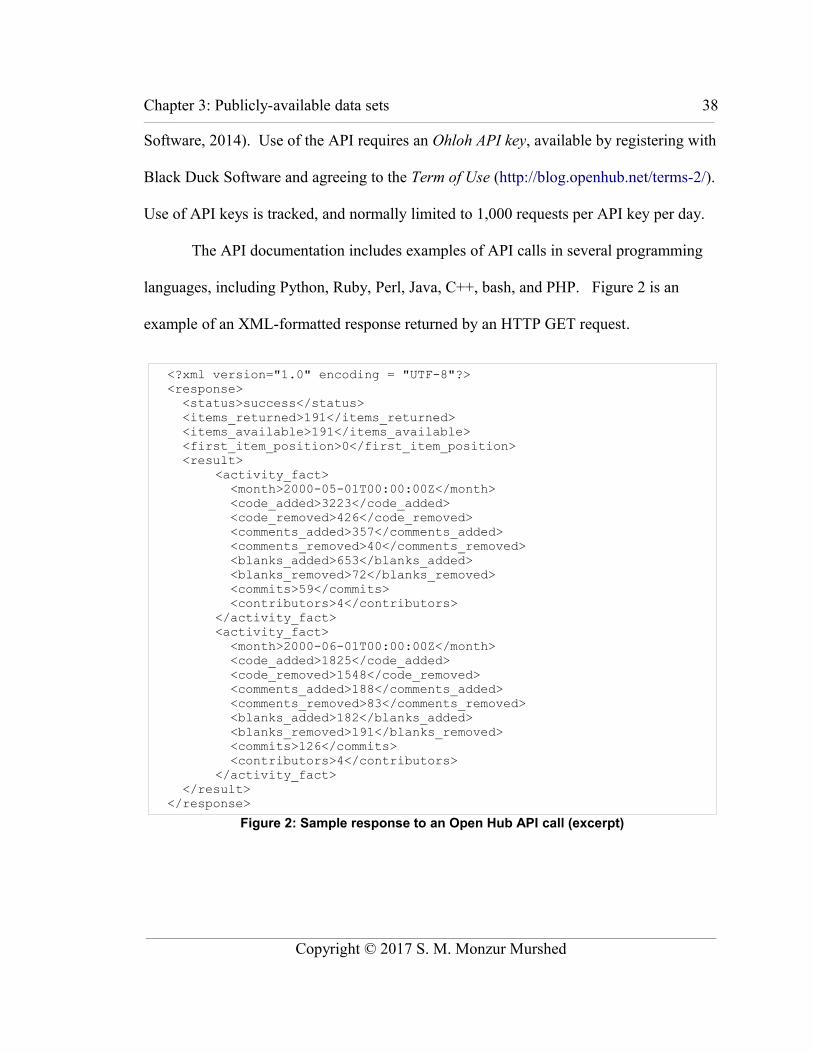
Chapter 3: Publicly-available data sets 38_______________________________________________________________________________________________________________________________________________
Software, 2014). Use of the API requires an Ohloh API key, available by registering with
Black Duck Software and agreeing to the Term of Use (http://blog.openhub.net/terms-2/).
Use of API keys is tracked, and normally limited to 1,000 requests per API key per day.
The API documentation includes examples of API calls in several programming
languages, including Python, Ruby, Perl, Java, C++, bash, and PHP. Figure 2 is an
example of an XML-formatted response returned by an HTTP GET request.
_______________________________________________________________________________________________________________________________________________
Copyright © 2017 S. M. Monzur Murshed
Figure 2: Sample response to an Open Hub API call (excerpt)
<?xml version="1.0" encoding = "UTF-8"?><response> <status>success</status> <items_returned>191</items_returned> <items_available>191</items_available> <first_item_position>0</first_item_position> <result>
<activity_fact> <month>2000-05-01T00:00:00Z</month> <code_added>3223</code_added> <code_removed>426</code_removed> <comments_added>357</comments_added> <comments_removed>40</comments_removed> <blanks_added>653</blanks_added> <blanks_removed>72</blanks_removed> <commits>59</commits> <contributors>4</contributors></activity_fact><activity_fact> <month>2000-06-01T00:00:00Z</month> <code_added>1825</code_added> <code_removed>1548</code_removed> <comments_added>188</comments_added> <comments_removed>83</comments_removed> <blanks_added>182</blanks_added> <blanks_removed>191</blanks_removed> <commits>126</commits> <contributors>4</contributors></activity_fact>
</result></response>

Chapter 3: Publicly-available data sets 39_______________________________________________________________________________________________________________________________________________
The Ohloh API provides pre-computed collections of statistics about project
source code. An ActivityFact summarizes changes to lines of code, commits, and
contributors in a single month, comprising the nine properties described in Table 6. A
SizeFact provides monthly running totals of lines of code, commits, and developer effort,
comprising the seven properties described in Table 7.
Table 6: Properties of Open Hub ActivityFact
Property Description
1 month Indicates the month covered by this ActivityFact. Only the year and month fields are significant. This ActivityFact record includes all development activity that occurred during this month.
2 code_added The total new lines of code added, excluding comments and blanks, during this month.
3 code_removed The total lines of code removed, excluding comments and blanks, during this month.
4 comments_added The total lines of new comments added during this month.
5 comments_removed The total lines of comments removed during this month.
6 blanks_added The total blank lines added during this month.
7 blanks_removed The total blank lines removed during this month.
8 commits The number of commits made during this month.
9 contributors The number of contributors who made at least one commit during this month.
Table 7: Properties of Open Hub SizeFact
Property Description
1 month Indicates the month covered by this SizeFact. Only the year and month fields are significant. This SizeFact record includes all development activity that occurred during this month.
2 code The total net lines of code, excluding comments and blanks, as of the end of this month.
3 comments The total net lines of comments as of the end of this month.
4 blanks The total net blank lines as of the end of this month.
5 comment_ratio The fraction of net lines which are comments as of the end of this month.
6 commits The cumulative total number commits to the project source control, including this month.
7 man_months The cumulative total months of effort expended by all contributors on this project, including this month. For instance, if 1 contributor has worked for 3 months and 2 developers have each worked for 5 months, man_months will be 13. This is the running total of the ActivityFact contributors property.
_______________________________________________________________________________________________________________________________________________
Copyright © 2017 S. M. Monzur Murshed
Chapter 3: Publicly-available data sets 40_______________________________________________________________________________________________________________________________________________
Of the known limitations to the Open Hub database and the API documentation,
three are most relevant to this thesis. First, Open Hub will aggregate any errors from its
data sources, which include a variety of different software repositories that may differ in
metrics collection and reporting. Second, no R API libraries or examples of R scripts are
provided in the Ohloh API documents; rather than develop new R code for accessing the
Ohloh API, this thesis instead develops a set of Python scripts adapted from the Ohloh
API code samples, which introduces a second scripting language to the data collection
process (which otherwise employs R exclusively). Third, the pre-computed ActivityFact
and SizeFact bundles are conveniently accessed and processed, but are a partial view of
the database.
In summary, Black Duck Open Hub is the source used in this research for
publicly-available information about open source software projects. It aggregates data
harvested directly from project source code repositories, and provides analytics about
code, activity, and community. Data collection of project metrics can be can
conveniently automated using the Ohloh API and scripts written Python, adapted from
the examples in the Ohloh API documentation.
This chapter has examined the content, access, and limitations of the two
publicly-accessible online databases used in this research for data collection about
software vulnerabilities and open source software projects. The next chapter develops a
conceptual framework of the software vulnerability lifecycle and both demonstrates and
validates the framework using publicly-available data on an open source software project. _______________________________________________________________________________________________________________________________________________
Copyright © 2017 S. M. Monzur Murshed

An investigation of software vulnerabilities in open source software projects using data from publicly-available sources Copyright © 2017 S. M. Monzur Murshed_______________________________________________________________________________________________________________________________________________
4 Conceptual frameworkThis chapter develops a software vulnerability lifecycle model that is employed
throughout the thesis. The chapter is structured in two sections. The first section
describes and explains the lifecycle model. The second section applies the vulnerability
lifecycle model to examine vulnerabilities in a popular open source software project – the
Apache HTTP Server project.
4.1 Software vulnerability ability lifecycle
Table 4 in section 2.1 previously summarized the various software vulnerability
lifecycle models found in the published literature. These models were developed or
adapted for a variety of purposes, including discussion of policy (Schneier, 2000;
Rescorla, 2005), interpreting case data (Arbaugh et al. 2000; Frei, 2009), developing
mathematical models (Marconato, 2013; Shrivastava et al. 2015), and analysis of security
advisories (Frei, 2006; Frei et al. 2000). Most of the models feature exploitation and
attacker behavior which is not relevant here, and most applications of the models assume
proprietary vendor-developed software rather than the community-developed open source
software of interest here. Further, most of the models begin at discovery, with the
introduction of the vulnerability to the software system as either absent from the model or
outside the scope of the research in the sense that the introduction remains unknown.
Figure 3 is a graphical representation of the simplified lifecycle model employed
here for this research. The model is comprised of three events and three time intervals. It
begins at the introduction (i.e., the birth or creation) and is silent about exploitation.
_______________________________________________________________________________________________________________________________________________
41

Chapter 4: Conceptual framework 42_______________________________________________________________________________________________________________________________________________
The three events are (1) introduction of the vulnerability, (2) discovery of the
vulnerability, and (3) dissemination of a fix to the vulnerability. Each event is specified
by the date on which the event occurred.
The introduction event is the earliest date on which a user of the software could
be affected by a new vulnerability. The vulnerability may exist previously in patches
submitted to a bug-tracker, or in source code repositories, or in “unstable” developer
builds, but is not introduced to the field until a version of the software including the
vulnerability is packaged and released for use outside the developer community.
The discovery event is the earliest date on which the developers of the software
become aware of the vulnerability and could potentially begin work on a fix. The
vulnerability may previously be known to others outside the developer community (and
perhaps exploited maliciously for harm), but is not discovered in this model until known
to developers. Discovery could occur because the vulnerability was first identified by a
_______________________________________________________________________________________________________________________________________________
Copyright © 2017 S. M. Monzur Murshed
Figure 3: Vulnerability lifecycle model

Chapter 4: Conceptual framework 43_______________________________________________________________________________________________________________________________________________
developer, or because the vulnerability was disclosed to the developers by an outside
source. Likewise, developers might or might not disclose the vulnerability publicly.
The fix event is the earliest date on which a user of software affected by a
vulnerability could update their software system to a new release that is not affected by
the vulnerability. Typically the fix to the vulnerability is disseminated in a new software
release by the developer community.
The three time intervals in Figure 3 are (1) the time to discover a vulnerability (td,
specified as the time interval between introduction and discovery), (2) the time to fix a
vulnerability (tf, specified as the time interval between discovery and fix), and (3) the
time of exposure (te, specified as the time interval between introduction and fix; also the
sum of td and tf). Each time interval is the time between two events.
The vulnerability lifecycle model in Figure 3 provides a conceptual framework
for clear thinking about software vulnerabilities and secure software. According to the
model, the following actions will result in improved software with fewer vulnerabilities:
(1) introduce fewer vulnerabilities, (2) discover vulnerabilities more quickly by
shortening the time to discover (td), (3) fix vulnerabilities more quickly by shortening the
time to fix (tf). Actions (1) and (2) both shorten the total time of exposure (te). Likewise,
the following actions will result in improved software with less-severe vulnerabilities:
(4) introduce vulnerabilities of lower severity, and (5) prioritize fixing of higher severity
vulnerabilities first. Different activities may impact different actions.
The next section demonstrates the use of the vulnerability lifecycle model to
examine software vulnerabilities in the open source Apache HTTP Server project. _______________________________________________________________________________________________________________________________________________
Copyright © 2017 S. M. Monzur Murshed
Chapter 4: Conceptual framework 44_______________________________________________________________________________________________________________________________________________
4.2 Application case: The Apache HTTP Server Project
The Apache HTTP Server project has a strong reputation in the open source
community for attention to security. The security reports at the project website
systematically report the vulnerabilities fixed in each release. For example, the security
report for release 2.4 (the current major release as of July 2015) stated the following:
This page lists all security vulnerabilities fixed in released versions of Apache httpd 2.4. Each vulnerability is given a security impact rating by the Apache security team – please note that this rating may well vary from platform to platform. We also list the versions of Apache httpd the flaw is known to affect, and where a flaw has not been verified list the version with a question mark.
Please note that if a vulnerability is shown below as being fixed in a "-dev" release then this means that a fix has been applied to the development source tree and will be part of an upcoming full release.
This page is created from a database of vulnerabilities originally populated by Apache Week. Please send comments or corrections for these vulnerabilities to the Security Team.
The initial GA release, Apache httpd 2.4.1, includes fixes for all vulnerabilities which have been resolved in Apache httpd 2.2.22 and all older releases. Consult the Apache httpd 2.2 vulnerabilities list for more information.
The description of each vulnerability includes the release in which the vulnerability was
fixed, the CVE ID, an impact rating (low, moderate, or important) assigned by the
Apache security team, a description written by the security team, an acknowledgements
of the contributor who reported the issue, the date that the vulnerability was reported to
the security team, the date that the issue was made public, the date that an update was
released, and a list of the release numbers of the versions affected by the vulnerability.
Table 8 compiles the vulnerability information for the 23 vulnerabilities fixed in
the ten releases 2.4 up to release 2.4.16 (July 15 2015). Figure 4 is a visual timeline.
_______________________________________________________________________________________________________________________________________________
Copyright © 2017 S. M. Monzur Murshed

Copyright © 2017 S. M. Monzur Murshed Chapter 4: Conceptual framework_______________________________________________________________________________________________________________________________________________________________________________________________________________________
Table 8: Vulnerabilities fixed in Apache HTTP Server release 2.4.x
CVE ID
Dates Affected
Reported to security team Issue public
Update released
2.4.1
2.4.2
2.4.3
2.4.4
2.4.6
2.4.7
2.4.9
2.4.10
2.4.12
2.4.16
1 CVE-2012-0883 2012-02-14 2012-03-02 2012-04-17 ●2 CVE-2012-2687 2012-05-31 2012-06-13 2012-08-21 ● ●3 CVE-2012-3502 2012-08-16 2012-08-21 ● ●4 CVE-2012-4558 2012-10-07 2013-02-18 2013-02-25 ● ● ●5 CVE-2012-3499 2012-07-11 2013-02-18 2013-02-25 ● ● ●6 CVE-2013-2249 2013-05-29 2013-07-22 2013-07-22 ● ● ● ●7 CVE-2013-1896 2013-03-07 2013-05-23 2013-07-22 ● ● ● ●8 CVE-2013-6438 2013-12-10 2014-03-17 2014-03-17 ● ● ● ● ● ●9 CVE-2014-0098 2014-02-25 2014-03-17 2014-03-17 ● ● ● ● ● ●
10 CVE-2013-4352 2013-09-14 2014-07-14 2013-11-26 ●11 CVE-2014-0226 2014-05-30 2014-07-14 2014-07-14 ● ● ● ● ● ● ●12 CVE-2014-0118 2014-02-19 2014-07-14 2014-07-14 ● ● ● ● ● ● ●13 CVE-2014-0117 2014-04-07 2014-07-15 2014-07-15 ● ● ●14 CVE-2014-3523 2014-07-01 2014-07-15 2014-07-15 ● ● ● ● ● ● ●15 CVE-2014-0231 2014-06-16 2014-07-14 2014-07-14 ● ● ● ● ● ● ●16 CVE-2013-5704 2013-09-06 2013-10-19 2015-01-30 ● ● ● ● ● ● ● ●17 CVE-2014-3581 2014-09-08 2015-01-30 ● ● ● ● ● ● ● ●18 CVE-2014-3583 2014-09-17 2014-11-12 2015-01-30 ●19 CVE-2014-8109 2014-11-09 2015-01-30 ● ● ● ● ● ● ● ●20 CVE-2015-3185 2013-08-05 2015-06-09 2015-07-15 ● ● ● ● ● ● ● ● ●21 CVE-2015-3183 2015-04-04 2015-06-09 2015-07-15 ● ● ● ● ● ● ● ● ●22 CVE-2015-0253 2015-02-03 2015-03-05 2015-07-15 ●23 CVE-2015-0228 2015-01-28 2015-02-04 2015-07-15 ● ● ● ● ●
18 17 15 13 14 13 11 7 4 0
_______________________________________________________________________________________________________________________________________________________________________________________________________________________
45

Chapter 4: Conceptual framework 46_______________________________________________________________________________________________________________________________________________
_______________________________________________________________________________________________________________________________________________
Copyright © 2017 S. M. Monzur Murshed
Figure 4: Timeline of vulnerabilities fixed in Apache HTTP Server 2.4.x

Chapter 4: Conceptual framework 47_______________________________________________________________________________________________________________________________________________
Some observations from this exercise:
1) Vulnerabilities introduced in one release are fixed in later a release.
2) Vulnerabilities are discovered and reported by individual people; the Apache project
acknowledges these contributions and identifies the contributor by name.
3) Newly-discovered vulnerabilities often affect previous releases. For example, CVE-
2015-3183, fixed in release 2.4.16 (July 15 2015, same as the “update released” date),
was publicly disclosed on June 9 2015 (the “Issue public” date) after being reported to
the project two months earlier on April 4 2015 (the “Reported to security team” date), but
affected releases back to 2.4.1 (released February 17 2012) and perhaps earlier.
4) Public disclosure typically happens after the vulnerability was reported to the project.
Public disclosure is sometimes delayed until the release when the vulnerability is fixed.
5) In this project, older releases contain more known vulnerabilities.
6) Newer releases can be affected by vulnerabilities not affecting older releases.
These results suggest that release dates, if the project release history and the
releases affected by a vulnerability are known, could proxy for the introduction and fix
events. An additional data source, such as the Apache “Reported to security team” field,
would be needed to specify the discovery event.
This chapter has developed a conceptual framework for software vulnerabilities.
The next chapter develops a set of testable hypothesis, bringing together assertions from
the scholarly and practitioner literature reviewed in chapter 2, the constructs from the
conceptual frameworks developed in chapter 3, and the information available in the
publicly-available data sets reviewed in the chapter 4._______________________________________________________________________________________________________________________________________________
Copyright © 2017 S. M. Monzur Murshed
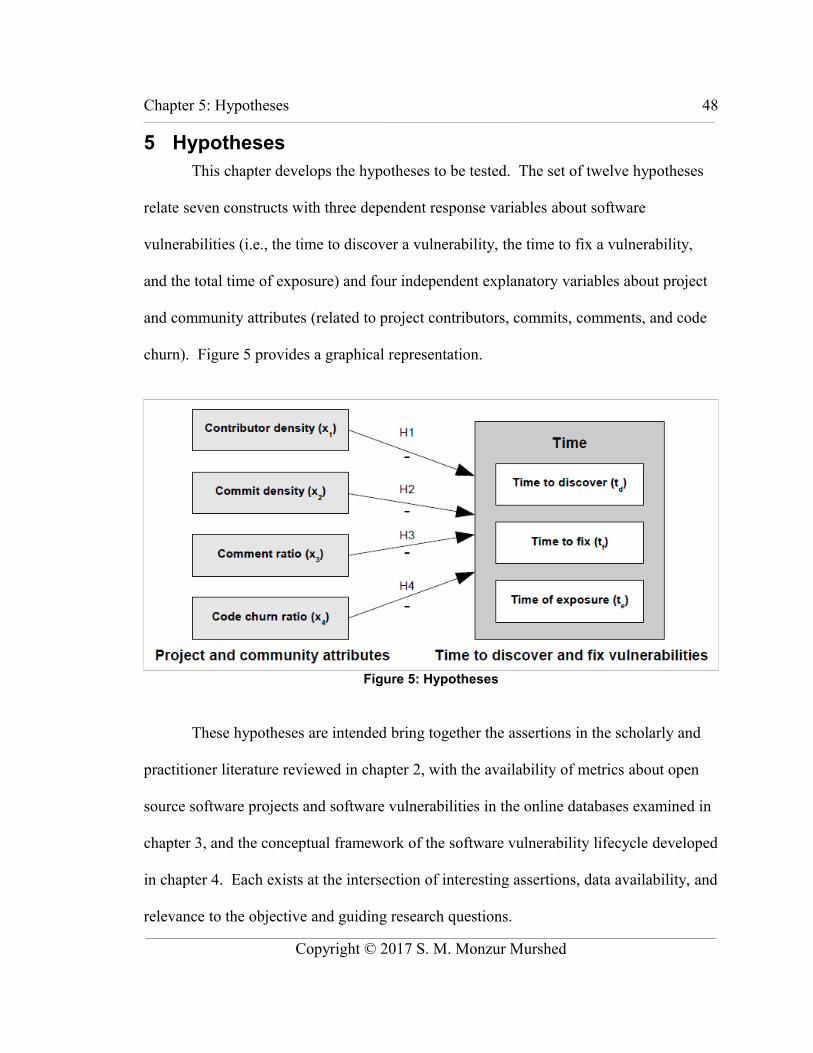
Chapter 5: Hypotheses 48_______________________________________________________________________________________________________________________________________________
5 HypothesesThis chapter develops the hypotheses to be tested. The set of twelve hypotheses
relate seven constructs with three dependent response variables about software
vulnerabilities (i.e., the time to discover a vulnerability, the time to fix a vulnerability,
and the total time of exposure) and four independent explanatory variables about project
and community attributes (related to project contributors, commits, comments, and code
churn). Figure 5 provides a graphical representation.
These hypotheses are intended bring together the assertions in the scholarly and
practitioner literature reviewed in chapter 2, with the availability of metrics about open
source software projects and software vulnerabilities in the online databases examined in
chapter 3, and the conceptual framework of the software vulnerability lifecycle developed
in chapter 4. Each exists at the intersection of interesting assertions, data availability, and
relevance to the objective and guiding research questions._______________________________________________________________________________________________________________________________________________
Copyright © 2017 S. M. Monzur Murshed
Figure 5: Hypotheses

Chapter 5: Hypotheses 49_______________________________________________________________________________________________________________________________________________
5.1 Contributors (H1)
The potential for contribution is a defining feature of open source software. In a
statement responding to the 2014 GNU Bash “Shellshock” vulnerability, the Free
Software Foundation (2014) explained its position as follows:
When a bug is discovered in free software, everyone has permission, rights, and source code to expose and fix the problem. That fix can then be immediately freely distributed to everyone who needs it. Thus, these freedoms are crucial for ethical, secure computing.
A large and active development community is widely perceived as a measure of success
for an open source software project (Fogel, 2006; Wheeler & Khakimov, 2015) – a much
sought-after outcome of doing things right (West & O’Mahony, 2008; Muegge, 2011;
Schweik, 2013). Projects with large and active communities of contributors not only
benefit from the option of inspection, modification, and sharing (Sullivan, 2014), they
experience the direct results of contributors – including finding and reporting previously
undiscovered vulnerabilities. Raymond (1999) writes:
More users find more bugs because adding more users adds more different ways of stressing the program. This effect is amplified when the users are co-developers. Each one approaches the task of bug characterization with a slightly different perceptual set and analytical toolkit, a different angle on the problem…
Conversely, Constantin (2014) speculates that vulnerabilities are more likely to occur and
remain undiscovered in projects with too few developers.
These arguments lead to the following hypothesis:
H1a: Higher contributor density is associated with shorter vulnerability discovery
time.
H1a speaks of “contributor density” rather than number of contributors because
_______________________________________________________________________________________________________________________________________________
Copyright © 2017 S. M. Monzur Murshed

Chapter 5: Hypotheses 50_______________________________________________________________________________________________________________________________________________
open source projects vary widely in size of the source code base, commonly measured in
thousands of lines of code (kLOC). The notion of contributor density takes these
differences into account in the simplest way, by dividing the number of contributors by
the size of the code base.
Once a vulnerability has been discovered and is known to contributors, Linus’s
Law comes into play (Raymond, 1999): “Given a large enough beta-tester and co-
developer base, almost every problem will be characterized quickly and the fix obvious to
someone. Or, less formally, 'Given enough eyeballs, all bugs are shallow.” Thus:
H1b: Higher contributor density is associated with shorter vulnerability fixing time.
The arguments for H1a and H1b also lead to the following hypothesis:
H1c: Higher contributor density is associated with shorter exposure time.
5.2 Commit activity (H2)
A commit to an open source project is a change to the source code. Thus commits
is a measure of project activity – how much work is happening. A commit indicates that
a contributor has engaged with the source code, and each engagement is another
opportunity to discover vulnerabilities. Conversely, Wheeler & Khakimov (2015)
associate low project activity with “projects at risk” needing more outside investment.
Perlroth (2014) speculates that the Heartbleed vulnerability remained undiscovered for so
long because of low project activity. Stated formally:
H2a: Higher commit density is associated with shorter vulnerability discovery time.
H2a speaks of “density” rather than a simple count for the same reasons as H1a –
to take into account the differences between large and small projects in a simple way.
_______________________________________________________________________________________________________________________________________________
Copyright © 2017 S. M. Monzur Murshed

Chapter 5: Hypotheses 51_______________________________________________________________________________________________________________________________________________
High commit activity implies that contributors are actively engaged with the
source code. After a vulnerability is discovered, an engaged community can rapidly
respond. In the words of Jim Zemlin, Executive Director of the Linux Foundation
(Kerner, 2015): “We all have access and can all work together.... Open source by its
nature lets us have a collective response to a collective problem.” High commit activity
is an indication that a collective response can and is happening. Stated formally:
H2b: Higher commit density is associated with shorter vulnerability fixing time.
The arguments for H2a and H2b also lead to the following hypothesis:
H2c: Higher commit density is associated with shorter vulnerability exposure time.
5.3 Comments (H3)
Complex code is more difficult to understand, maintain, and test (McCabe, 1976;
McGraw, 2006; Shin et al. 2011). According to Schneier (2003), complexity is the
enemy of security. Comments are a way to tame complexity – to make code easier to
understand. Conversely, software with few comments may be harder to review, and thus
vulnerabilities may be easier to miss (Wheeler & Khakimov, 2015). Comment ratio is
the proportion of comments in the source code base. Thus:
H3a: Higher comment ratio is associated with shorter vulnerability discovery time.
Once a vulnerability has been discovered, well-commented code will be easier
update; learning can happen more quickly. Stated formally:
H3b: Higher comment ratio is associated with shorter vulnerabilities fixing time.
The arguments for H3a and H3b also lead to the following hypothesis:
H3c: Higher comment ratio is associated with shorter exposure time.
_______________________________________________________________________________________________________________________________________________
Copyright © 2017 S. M. Monzur Murshed

Chapter 5: Hypotheses 52_______________________________________________________________________________________________________________________________________________
5.4 Code churn (H4)
Shin et al. (2011, p. 774) writes: “Code is constantly evolving throughout the
development process. Each new change in the system brings a new risk of introducing a
vulnerability.” Previous studies of vulnerability prediction have associated high code
churn metrics with introduction of new vulnerabilities (Gegick et al. 2008; Meneely et al.
2013). However, the interest here is not vulnerability introduction but rather the time to
discover and fix vulnerabilities already affecting the software. Code churn ratio –
defined here as the proportion of the code base that has changed – is a measure of turn-
over in the code base. As argued previously, engagement with the source code creates
opportunities to discover vulnerabilities. Stated formally:
H4a: Higher code churn ratio is associated with shorter vulnerability discovery
time.
Very low levels of code churn ratio imply low project activity. Some turn-over is
expected in an active project that is more likely to fix vulnerabilities promptly after they
are discovered. Stated formally:
H4b: Higher code churn ratio is associated with shorter vulnerability fix time.
The arguments for H4a and H4b also lead to the following hypothesis:
H4c: More code churn density is associated with shorter exposure time.
The chapter has developed a set of twelve testable hypotheses in four groups,
relating four explanatory variables about open source software projects to three response
variables about the time to discover and fix vulnerabilities. The next chapter specifies the
research design and method used to test these hypotheses.
_______________________________________________________________________________________________________________________________________________
Copyright © 2017 S. M. Monzur Murshed

An investigation of software vulnerabilities in open source software projects using data from publicly-available sources Copyright © 2017 S. M. Monzur Murshed_______________________________________________________________________________________________________________________________________________
6 Research design and methodThis chapter presents the research design and detailed method to answer the
research questions posed in chapter 1. Table 9 summarizes nine-step research method,
the activity undertaken at each step, and the outcomes of each activity. The remainder of
this chapter is structured in nine sections, one for each step of the research method
summarized in Table 9.
Table 9: Nine steps of the research method
Step Activity undertaken Outcomes of activity
1. Identify assertions
Examine the scholarly and practitioner literature to identify assertions about security vulnerabilities in open source software
• Set of assertions(section 2.4)
2. Investigate data sets
Examine the content of two websites: Black Duck Open Hub and CVE Details
• List of available metrics(chapter 3)
3. Develop conceptual framework
Develop a vulnerability lifecycle model • Vulnerability life-cycle model(chapter 4)
4. Develop hypotheses
Develop a set of hypotheses at the intersection of (i) assertions in the research literature and practitioner literature, (ii) data available from publicly-available sources, and (iii) events in the conceptual framework
• Set of hypotheses(chapter 5)
5. Select samples Establish processes to select projects for the research samples
• Rules for sample selection (section 6.5)
• Sample of open source software projects (section 7.1)
6. Inspect small sample of CVEs
Manually examine the database records of a small sample of CVEs.
• Insights into data availability and data quality(section 7.2)
7. Specify variables and measures for full sample
Identify operational variables, measures for each variable, sources for each measure, and tests of each hypothesis
• Specification of dependent and independent variables and tests of hypotheses(section 6.7)
8. Collect data for full sample
Develop software scripts to harvest data from publicly-available websites. Run the scripts.
• Workflow and scripts(Appendix A and B)
• R data frame (CSV file)
9. Analyze full sample
Compute summary statistics. Inspect variables. Compute regressions. Interpret results.
• Results of regression analysis and hypothesis tests(section 7.3)
_______________________________________________________________________________________________________________________________________________
53
Chapter 6: Research design and method 54_______________________________________________________________________________________________________________________________________________
The research design is quantitative hypothesis testing of associations between
variables. The unit of analysis is a vulnerability in the software produced by an open
source software project, operationalized as a CVE ID. The data set is constructed from
publicly-available online sources using automated data collection techniques (Munzert et
al. 2015). The analytic approach is linear regression analysis using the R language for
statistical computing (R Core Team, 2016) and the techniques recommended by Fox
(2016) and Fox & Weisberg (2011).
6.1 Identify assertions from the literature
The assertions found in the academic research literature and the practitioner
literature were previously reported in section 2.4.
6.2 Investigate data sets
The various metrics reported by CVE Details and Black Duck Open Hub were
previously reported in sections 3.1 and 3.2, respectively.
6.3 Develop conceptual framework
The software vulnerability lifecycle model was previously presented in section
4.1, and application of the lifecycle model was demonstrated in section 4.2 by
characterizing a limited set of 23 software vulnerabilities fixed during release 2.4 of the
Apache HTTP Server project.
The software vulnerability lifecycle model is comprised of three events and three
time intervals. The three events are (1) introduction of the vulnerability, (2) discovery of
the vulnerability, and (3) dissemination of a fix to the vulnerability. Each event is
specified by the date on which the event occurred. The three time intervals are (1) the
_______________________________________________________________________________________________________________________________________________
Copyright © 2017 S. M. Monzur Murshed
Chapter 6: Research design and method 55_______________________________________________________________________________________________________________________________________________
time to discover a vulnerability (td, specified as the time interval between introduction
and discovery), (2) the time to fix a vulnerability (tf, specified as the time interval
between discovery and fix), and (3) the time of exposure (te, specified as the time interval
between introduction and fix; also the sum of td and tf). Each time interval is the time
between two events.
6.4 Develop hypotheses
The hypotheses were previously developed in chapter 5. Each hypothesis is
intended to formalize an assertion from the literature (identified in step 1, sections 2.4
and 6.1), specified using a conceptual framework of the software vulnerability lifecycle
(developed in step 3, sections 4.1 and 6.3), for which data is available (confirmed in step
2, sections 3.1, 3.2 and 6.2).
6.5 Select samples
This thesis employs three nested research samples: (1) the project sample of open
source software projects, (2) a small sample of 10 software vulnerabilities within the
project sample, used for manual inspection in step 6, and (3) the full sample of all
vulnerabilities within the project sample, used for statistical analysis and hypothesis
testing in step 8.
The project sample was selected using a three-step process. First, we limited our
scope to open source content management system (CMS) projects. This category has
several attractive features: it encompasses a large number of open source projects that
vary widely in their properties (e.g., in January 2016, there were more than one hundred
open source CMS projects with Wikipedia articles), it features prominently in
_______________________________________________________________________________________________________________________________________________
Copyright © 2017 S. M. Monzur Murshed

Chapter 6: Research design and method 56_______________________________________________________________________________________________________________________________________________
publications by security researchers (e.g., Walden, 2009, 2010; Vasek et al. 2016) and in
industry reports of threats and breaches such as the Verizon 2016 Data Breach
Investigations Report (Verizon, 2016) and the Symantec 2016 Internet Security Threat
Report (Symantec Corporation, 2016), it is central to the enterprise systems of many
organizations, and there are various inventories and lists of projects available online.
Second, we compiled a list of 290 candidate projects from sources about open
source CMS projects including Open Source CMS (http://www.opensourcecms.com/),
Securify Graphs (http://www.securifylabs.com/securifygraphs/), Bitnami
(https://bitnami.com/), and the Wikipedia list of content management systems
(https://en.wikipedia.org/wiki/List_of_content_management_systems).
Third, we considered data availability using three criteria: (i) affected by at least
one CVE in CVE Details, (ii) project history available from Open Hub, and
(iii) information on release history and dates of relevant releases is readily available
online. The third criterion is needed to assign a proxy date for the introduction event and
fix event for a CVE. After eliminating those projects that were unhelpful for testing our
hypotheses, sixty projects remained. The project sample is reported in section 7.1.
Next, we selected a small sample of vulnerabilities within the project sample for
manual inspection of the CVE records. We began by compiling a list of CVEs affecting
the projects in the project sample, then selected ten CVEs at random from the list. The
small sample is reported in section 7.2.
The full sample is the complete inventory of vulnerabilities affecting the projects
in the project sample._______________________________________________________________________________________________________________________________________________
Copyright © 2017 S. M. Monzur Murshed

Chapter 6: Research design and method 57_______________________________________________________________________________________________________________________________________________
6.6 Inspect small sample
For each of the ten vulnerabilities in the small sample, we manually examined the
content of each CVE record, seeking insights to help specify variables and measures in
step 7 and to inform the automated data collection of the full sample in step 8. There
were four guiding questions: (1) Can “Publish Date” or “Update Date” from the CVE
Details summary table reports be used as proxies for the events in the vulnerability life
cycle model? (2) Can the versions numbers reported in the “Products Affected by CVE”
category of the CVE Details individual CVE records be used as proxies for the events in
the vulnerability life cycle model? (3) What can be learned from the linked documents
reported in the “References for CVE” category of the CVE Details individual CVE
records? (4) Can information from the references identify the events in the vulnerability
lifecycle model?
Results of manually inspecting the small sample of vulnerabilities are reported in
section 7.2. Insights from these results are enfolded into steps 7, 8, and 9 of the method.
6.7 Specify variables and measures for full sample
Table 10 is a summary of the variables, measures, and sources.
_______________________________________________________________________________________________________________________________________________
Copyright © 2017 S. M. Monzur Murshed

Chapter 6: Research design and method 58_______________________________________________________________________________________________________________________________________________
Table 10: Variables, measures, and sources for full sample analysis
Type Variable Definition Measure Source
Explanatory variables
Contributor density(x1)
The ratio of the number of contributors to the size of the code base (thousand lines of code); a measure of community participation
# of contributors
kilo lines of code (kLOC)
Open Hub
Commit density(x2)
The ratio of the number of monthly commits to the size of the code base (thousand lines of code); a measure of developer activity
# of contributors
kLOC
Comment ratio(x3)
The ratio of comments to lines of code; an approach to managing complexity
# of comment LOC
LOC
Code churn ratio(x4)
The ratio of the number of lines of code modified to the size of the code base; a measure of code base churn
# of modified LOC
kLOC
Response variables
Time to discover(td)
The time (number of days) between the introduction event and the discovery event of a CVE ID
N/a
CVE Details
Time to fix(tf)
The time (number of days) between the discovery event and the fix event of a CVE ID
N/a
Time of exposure(te)
The time (number of days) between the introduction event and the fix event of a CVE ID
(Release date of first unaffected version) – (Release date of first affected version)
Comment ratio (x3), measuring one approach to managing complexity, is obtained
directly from Open Hub – the ratio of comment lines to total lines of code in the month of
the focal event. The other three explanatory variables are computed as quotients of two
metrics obtained from Open Hub, the denominator for each being the size of the code
base (in kLOC). Contributor density (x1), a measure of community participation, is the
ratio of the number of contributors in the month of the focal event to the size of the code
base in the month of the focal event. Commit density (x2), a measure of developer
activity, is the ratio of the number of commits in the month of the focal event to the size
of the code base in the month of the focal event. Code churn ratio (x4) is the ratio of the
_______________________________________________________________________________________________________________________________________________
Copyright © 2017 S. M. Monzur Murshed
Chapter 6: Research design and method 59_______________________________________________________________________________________________________________________________________________
number of lines of code modified in the month of the focal event to the size of the code
base in the month of the focal event.
The focal event is the terminal event for response variable of interest (q.v., Figure
3 of the vulnerability life cycle model in section 4.1). For time to discover (td), the focal
event is the discovery event; thus the explanatory variables are computed using project
metrics from the month in which the vulnerability was discovered. For time to fix (tf) and
time of exposure (te), the focal event is the fix event; thus the explanatory variables are
computed using project metrics from the month in which the vulnerability was fixed.
The outcome of step 6, manual inspection of a small sample of vulnerabilities,
demonstrated a significant limitation in the publicly-available data sets: the lack of a
strong proxy for the discovery event, the second of the three events in the vulnerability
life-cycle framework previously developed in section 4.1. Two of the three intended
response variables, time to discover (td) and time to fix (tf), require an estimate of the
discovery event. Thus, Table 10 shows that only the third response variable, time of
exposure (te), is sufficiently specified for data analysis in step 9. The value assigned to
time of exposure (te) is the number of days between the release of the first affected
version (a proxy for the introduction event) and the release of the first unaffected version
after introduction of the vulnerability (a proxy for the fix event). The focal event is thus
the fix event (i.e., the month of release of the first unaffected version after introduction of
the vulnerability), and the explanatory variables for a particular vulnerability are assigned
using project metrics for the month of the fix event.
_______________________________________________________________________________________________________________________________________________
Copyright © 2017 S. M. Monzur Murshed

Chapter 6: Research design and method 60_______________________________________________________________________________________________________________________________________________
6.8 Collect data for full sample
Appendix A specifies the data collection workflow, documents the operation of
each script, and provides instructions for modifying the workflow and scripts for future
work. Appendix B provides source code for the various R and Python scripts.
A brief summary is provided here:
1. An R script forms HTTP requests to CVE Details for summary table reports for
each project, for each year, for all years of the project. CVE Details returns an
HTML file for each request. The script outputs these files to a local directory.
2. A second R script parses the HTML files, creates an R data frame, and outputs a
comma-separated values (CSV) file for each project.
3. The researcher manually inputs two data fields for each CVE record: (1) the
release date of the first affected version (as a proxy for the introduction event),
and (2) the release date of the first unaffected version after the introduction of the
vulnerability (as a proxy for the fix event). These dates are discovered from
online sources about the project release history.
4. A third R script joins the files for each project into a single R data frame, and
outputs a CSV file.
5. A Python script forms HTTP GET requests using the Open Hub API for the
ActivityFact and SizeFact records for each project. Open Hub returns XML
responses for each request. The script outputs the ActivityFact.xml and
SizeFact.xml files for each project to a local directory.
6. A fourth R script parses the XML files for each project and outputs a single CSV
_______________________________________________________________________________________________________________________________________________
Copyright © 2017 S. M. Monzur Murshed

Chapter 6: Research design and method 61_______________________________________________________________________________________________________________________________________________
file for all projects. This file contains a complete project history, by month, for all
projects in the project sample.
7. A fifth R script “merges” the file of vulnerability data and the file of project data.
The explanatory variables are computed from project metrics in the month of the
fix event. The script also computes time-averaged explanatory variables based on
3 months, 6 months, and 12 months of project metrics to smooth out month-to-
month variation in the project metrics. The script outputs a CSV file
conveniently formatted for regression analysis.
Developing and testing the workflow and scripts for automated data collection
was a significant effort for the author (see also section 8.2). Nonetheless, the most time-
intensive data collection task was the manual work to identify and record the release
dates of the first affected version and the first fixed version (step 3 of the data collection
workflow in Appendix A). Insights from this experience informed the answers provided
in section 8.1 to the second and third research questions.
6.9 Statistical analysis of full sample
Table 11 summarizes the nine steps of the full sample data analysis, following the
approach and techniques recommended by Fox (2016) and Fox & Weisberg (2011).
Section 7.3 reports the results of this analysis.
_______________________________________________________________________________________________________________________________________________
Copyright © 2017 S. M. Monzur Murshed

Chapter 6: Research design and method 62_______________________________________________________________________________________________________________________________________________
Table 11: Nine steps of full sample data analysis
Step Description Outcomes
i. Examine univariate data
Inspect the data set. Plot histograms with boxplots of each variable.
• Histograms• Boxplots
ii. Examine bivariate relationships
Examine the relationships between variables. Plot a scatterplot matrix with scatterplots of each variable pair.
• Scatterplot matrix
iii. Compute summary statistics
Produce a table reporting the minimum value, maximum value, range, mean, median, and standard deviation of each variable and the correlation matrix.
• Table of summary statistics
iv. Identify and assess violations
Identify and address violations of the regression assumptions. Comment on multicollinearity and outliers. Comment on whether action is required to address any violations. Comment on any evidence of a linear relationship (or nonlinear relationship) between the dependent and independent variables.
• Possible violations
v. Regression analysis
Regress the response variables on the explanatory variables.
• Regression results: regression coefficients, R2, and p-values
vi. Hypothesis tests
Report the results of the hypothesis tests. A hypothesis is supported if and only if (i) the p-value is below a critical threshold and (ii) the regression coefficient of the independent variable has the predicted sign.
• Results of hypothesis tests.
vii. Post-regression diagnostics
Plot and examine residuals and unusual data. • Residual plots• Influence plots
viii. Explore robustness
Explore the robustness of the regression model and the hypothesis tests to modelling assumptions.
• Results of alternative models
ix. Examine effect size
Report the effect size and practical significance of the regression results.
• Effect size plots
The chapter has specified the research design and method of this thesis. The next
chapter presents the results.
_______________________________________________________________________________________________________________________________________________
Copyright © 2017 S. M. Monzur Murshed

An investigation of software vulnerabilities in open source software projects using data from publicly-available sources Copyright © 2017 S. M. Monzur Murshed_______________________________________________________________________________________________________________________________________________
7 ResultsThis chapter presents the results in three sections: description of the sample of
open source software projects, manual inspection of a small sample of vulnerabilities, and
statistical analysis of the full sample of software vulnerabilities.
7.1 Sample of open source software projects
Table 12, Table 13, and Table 14 provide a summary of the sixty projects in the
project sample, with their CPE product names (the label used as a unique identifier in
CVE records), a brief description (using “tagline” words from the project website), the
URL for the project website, the year that the project started, the size of the code base (in
kLOC – thousands of lines of source code), the open source license(s) used, and the
number of CVEs affecting the project’s software reported by CVE Details. The method
for selecting the project sample was previously explained in section 6.5.
_______________________________________________________________________________________________________________________________________________
63

Copyright © 2017 S. M. Monzur Murshed Chapter 7: Results_______________________________________________________________________________________________________________________________________________________________________________________________________________________
Table 12: Summary of project sample (n=60; part 1 of 3)
Project CPE product name(CVE record)
Description Website Year started
Code base (kLOC)
Licenses # of CVEs
ActionApps actionapps Collaborative web publishing tool http://actionapps.org/ 2000 202 GPL 1
Anchor CMS anchorcms Super-simple, lightweight blog system https://anchorcms.com/ 2011 16 GPL v3 3
b2evolution b2evolution Complete engine for website http://b2evolution.net/ 2003 686 GPL v2+ 12
BEdita bedita Semantic content management framework http://www.bedita.com/ 2006 61 LGPL 2
BigTree CMS bigtreecms Extensible CMS built on PHP and MySQL https://bigtreecms.org/ 2012 251 GPL v3 4
bitweaver bitweaver Web application framework http://www.bitweaver.org/ 2005 442 LGPL 21
CMSMadeSimple cmsmadesimplecms Power for professionals simplicity for users https://www.cmsmadesimple.org/ 2004 230 GPL v2+ 31
concrete5 concrete5 Provides version management for pages https://www.concrete5.org/ 2008 279 MIT 6
Croogo croogo Open source CMS built for everyone https://croogo.org/ 2009 52 MIT 2
DokuWiki dokuwiki Highly versatile wiki, no database required https://www.dokuwiki.org/ 2005 206 GPL v2 29
dotclear dotclear Blogging platform in PHP https://dotclear.org/ 2011 394 GPL v2 20
Drupal drupal Platform to publish, manage a website https://www.drupal.org/ 2000 704 GPL v2+ 162
e107 e107 Bootstrap http://e107.org/ 2004 525 GPL 60
Share.ez.no ezpublish Enterprise content management system http://share.ez.no/ 2002 2785 GPL 19
Gallery gallery Web based photo album organizer http://galleryproject.org/ 2002 311 GPL v2+ 58
Geeklog geeklog Spam protected CMS or blog engine https://www.geeklog.net/ 2001 649 GPL v2+ 27
Habari habari Blogging platform for blog or web journal http://habariproject.org/ 2006 48 Apache 2 2
impresscms impresscms Tools for building, maintaining website http://www.impresscms.org/ 2007 245 GPL v2+ 9
IMPRESSPAGES impresspages MVC engine based on PHP components https://www.impresspages.org/ 2007 138 MIT 1
Jaws jaws Framework to hack own modules http://jaws-project.com/ 2005 675 GPL v2+ 9
_______________________________________________________________________________________________________________________________________________________________________________________________________________________
64
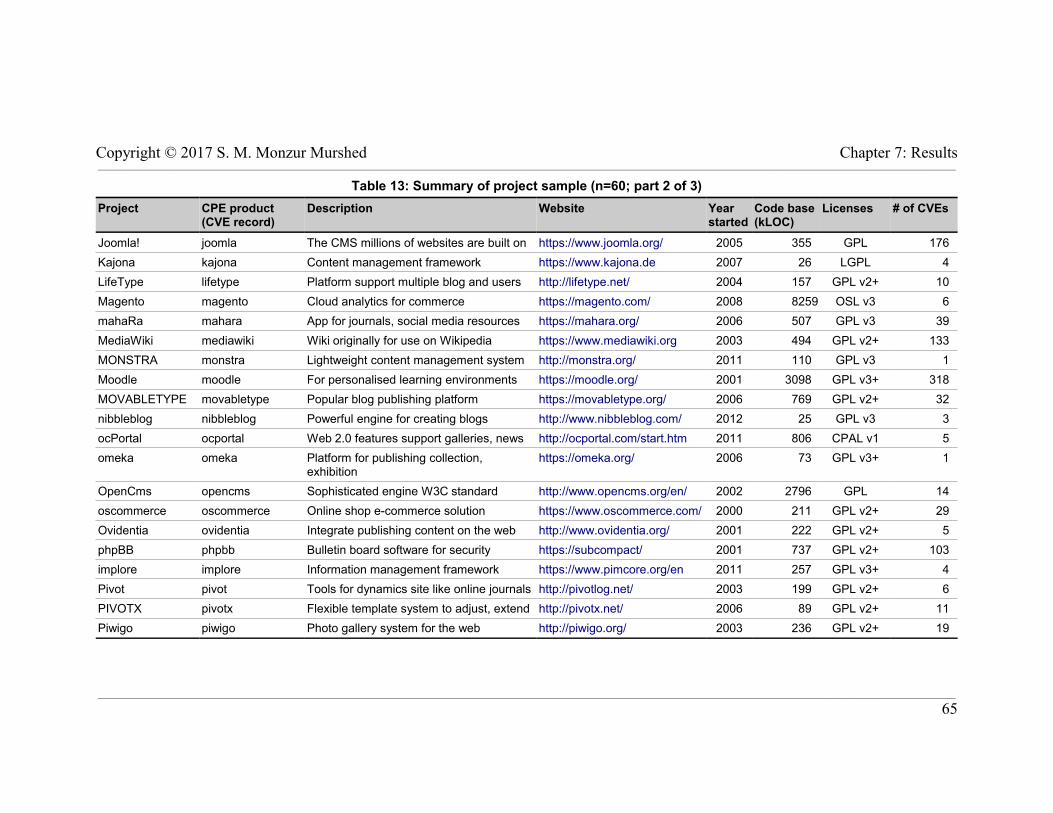
Copyright © 2017 S. M. Monzur Murshed Chapter 7: Results_______________________________________________________________________________________________________________________________________________________________________________________________________________________
Table 13: Summary of project sample (n=60; part 2 of 3)
Project CPE product(CVE record)
Description Website Year started
Code base (kLOC)
Licenses # of CVEs
Joomla! joomla The CMS millions of websites are built on https://www.joomla.org/ 2005 355 GPL 176
Kajona kajona Content management framework https://www.kajona.de 2007 26 LGPL 4
LifeType lifetype Platform support multiple blog and users http://lifetype.net/ 2004 157 GPL v2+ 10
Magento magento Cloud analytics for commerce https://magento.com/ 2008 8259 OSL v3 6
mahaRa mahara App for journals, social media resources https://mahara.org/ 2006 507 GPL v3 39
MediaWiki mediawiki Wiki originally for use on Wikipedia https://www.mediawiki.org 2003 494 GPL v2+ 133
MONSTRA monstra Lightweight content management system http://monstra.org/ 2011 110 GPL v3 1
Moodle moodle For personalised learning environments https://moodle.org/ 2001 3098 GPL v3+ 318
MOVABLETYPE movabletype Popular blog publishing platform https://movabletype.org/ 2006 769 GPL v2+ 32
nibbleblog nibbleblog Powerful engine for creating blogs http://www.nibbleblog.com/ 2012 25 GPL v3 3
ocPortal ocportal Web 2.0 features support galleries, news http://ocportal.com/start.htm 2011 806 CPAL v1 5
omeka omeka Platform for publishing collection, exhibition
https://omeka.org/ 2006 73 GPL v3+ 1
OpenCms opencms Sophisticated engine W3C standard http://www.opencms.org/en/ 2002 2796 GPL 14
oscommerce oscommerce Online shop e-commerce solution https://www.oscommerce.com/ 2000 211 GPL v2+ 29
Ovidentia ovidentia Integrate publishing content on the web http://www.ovidentia.org/ 2001 222 GPL v2+ 5
phpBB phpbb Bulletin board software for security https://subcompact/ 2001 737 GPL v2+ 103
implore implore Information management framework https://www.pimcore.org/en 2011 257 GPL v3+ 4
Pivot pivot Tools for dynamics site like online journals http://pivotlog.net/ 2003 199 GPL v2+ 6
PIVOTX pivotx Flexible template system to adjust, extend http://pivotx.net/ 2006 89 GPL v2+ 11
Piwigo piwigo Photo gallery system for the web http://piwigo.org/ 2003 236 GPL v2+ 19
_______________________________________________________________________________________________________________________________________________________________________________________________________________________
65

Copyright © 2017 S. M. Monzur Murshed Chapter 7: Results_______________________________________________________________________________________________________________________________________________________________________________________________________________________
Table 14: Summary of project sample (n=60; part 3 of 3)
Project CPE product(CVE record)
Description Website Year started
Code base (kLOC)
Licenses # of CVEs
Plone plone Enterprise CMS https://plone.org/ 2002 1248 GPL v2 55
PmWiki pmwiki System collaborative creation, maintenance http://www.pmwiki.org/ 2004 GPL 7
PrestaShop prestashop Professional e-commerce shopping cart https://www.prestashop.com/ 2011 364 OSL v3 10
PunBB punbb Lightweight PHP-powered http://punbb.informer.com/ 2008 44 GPL v2+ 41
Serendipity serendipity PHP-powered weblog engine https://www.s9y.org/ 2003 231 BSD 40
SilverStripe silverstripe Application framework https://www.silverstripe.org/ 2007 728 BSD 34
SPIP spip Web site publishing, collaborative editing http://www.spip.net/ 2002 144 GPL v3+ 24
Textpattern textpattern Built-in-tags, code to control presentation http://textpattern.com/ 2004 117 GPL 9
TomatoCart tomatocart PHP/Mysql shopping cart http://www.tomatocart.com/ 2012 407 GPL v3 5
TWiki twiki Enterprise wiki and web application platform http://twiki.org/ 2002 2070 GPL 25
TYPO3 typo3 Scaleable web application framework https://typo3.org/ 2003 3810 GPL v2+ 96
UseBB usebb PHP based bulletin board package http://www.usebb.net/ 2004 56 GPL 9
Vanilla vanilla forums Discussion forum https://vanillaforums.com/en/ 2005 314 GPL v2+ 8
webEdition webedition Web application framework http://www.webedition.org/ 2008 197 No declared 2
WebGUI webgui Web application framework https://www.webgui.org/ 2001 789 GPL v2+ 14
WOLFCMS wolfcms Tools necessary for file management https://www.wolfcms.org/ 2009 38 GPL v3 2
WordPress wordpress Software to create a beautiful website. https://wordpress.org/ 2003 423 GPL v2+ 255
XOOPS CMS xoops Extensible, object-oriented, dynamic CMS. http://www.xoops.org/ 2005 8494 GPL v2+ 38
ZenPHOTO zenphoto The simpler media website CMS http://www.zenphoto.org/ 2011 170 GPL v2+ 19
Zikula zikula PHP application framework http://zikula.org/ 2010 304 GPL v3+ 1
_______________________________________________________________________________________________________________________________________________________________________________________________________________________
66
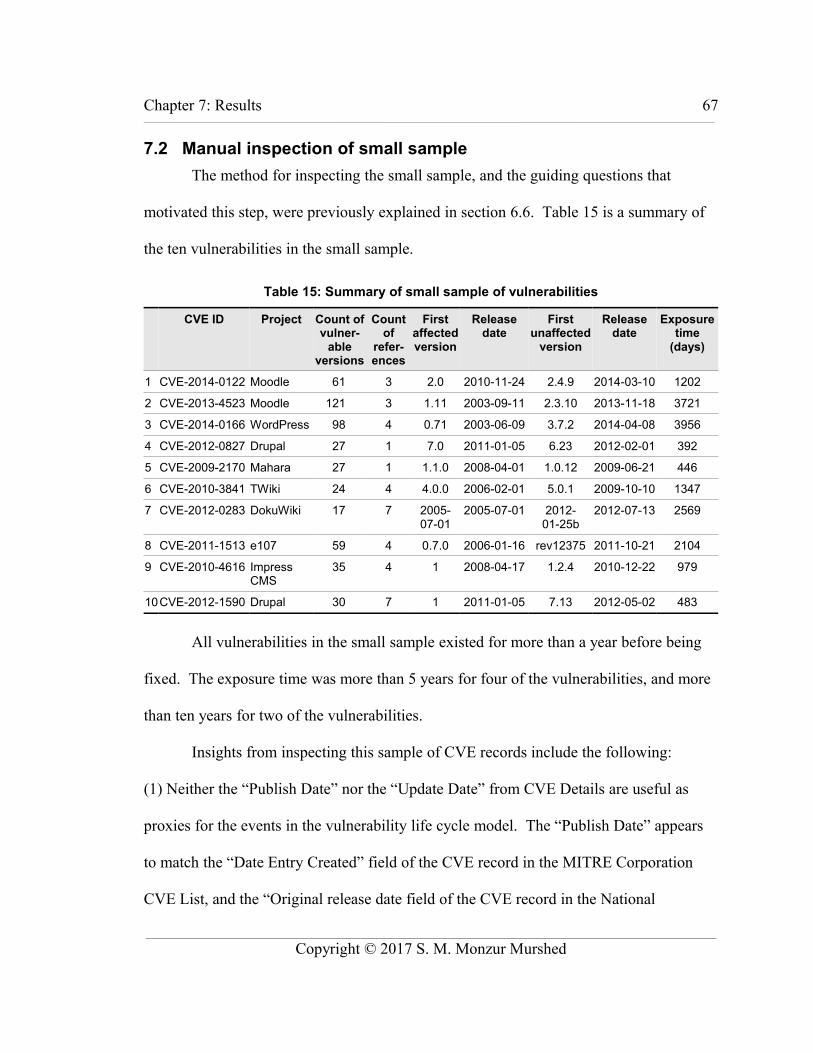
Chapter 7: Results 67_______________________________________________________________________________________________________________________________________________
7.2 Manual inspection of small sample
The method for inspecting the small sample, and the guiding questions that
motivated this step, were previously explained in section 6.6. Table 15 is a summary of
the ten vulnerabilities in the small sample.
Table 15: Summary of small sample of vulnerabilities
CVE ID Project Count of vulner-
able versions
Count of
refer-ences
First affected version
Releasedate
First unaffected
version
Release date
Exposuretime
(days)
1 CVE-2014-0122 Moodle 61 3 2.0 2010-11-24 2.4.9 2014-03-10 1202
2 CVE-2013-4523 Moodle 121 3 1.11 2003-09-11 2.3.10 2013-11-18 3721
3 CVE-2014-0166 WordPress 98 4 0.71 2003-06-09 3.7.2 2014-04-08 3956
4 CVE-2012-0827 Drupal 27 1 7.0 2011-01-05 6.23 2012-02-01 392
5 CVE-2009-2170 Mahara 27 1 1.1.0 2008-04-01 1.0.12 2009-06-21 446
6 CVE-2010-3841 TWiki 24 4 4.0.0 2006-02-01 5.0.1 2009-10-10 1347
7 CVE-2012-0283 DokuWiki 17 7 2005-07-01
2005-07-01 2012-01-25b
2012-07-13 2569
8 CVE-2011-1513 e107 59 4 0.7.0 2006-01-16 rev12375 2011-10-21 2104
9 CVE-2010-4616 Impress CMS
35 4 1 2008-04-17 1.2.4 2010-12-22 979
10 CVE-2012-1590 Drupal 30 7 1 2011-01-05 7.13 2012-05-02 483
All vulnerabilities in the small sample existed for more than a year before being
fixed. The exposure time was more than 5 years for four of the vulnerabilities, and more
than ten years for two of the vulnerabilities.
Insights from inspecting this sample of CVE records include the following:
(1) Neither the “Publish Date” nor the “Update Date” from CVE Details are useful as
proxies for the events in the vulnerability life cycle model. The “Publish Date” appears
to match the “Date Entry Created” field of the CVE record in the MITRE Corporation
CVE List, and the “Original release date field of the CVE record in the National
_______________________________________________________________________________________________________________________________________________
Copyright © 2017 S. M. Monzur Murshed

Chapter 7: Results 68_______________________________________________________________________________________________________________________________________________
Vulnerability Database. According to the CVE FAQ (MITRE, 2016a):
The "Date Entry Created" date in a CVE Identifier (CVE ID) indicates when the CVE ID was issued to a CVE Numbering Authority (CNA) or published on the CVE List. This date does not indicate when the vulnerability was discovered, shared with the affected vendor, publicly disclosed, or updated in CVE. That information may or may not be included in the description or references of a CVE ID, or in the enhanced information for the CVE ID that is provided in the U.S. National Vulnerability Database (NVD).
Likewise, “Update Date” appears to match the “Last revised” field of the CVE record in
the National Vulnerability Database, which is updated when new information is posted to
the CVE record. For some CVEs in the small sample, this date was close to the fix event,
but for other CVEs, it was months or years later. This is unfortunate, because these two
dates are easily harvested from CVE Details summary table reports.
(2a) The release date of the first affected version is an effective proxy for the introduction
event. Using online sources, it was possible to identify the release dates for the versions
of the software reported as affected by CVE Details, and to select the oldest date as the
introduction event.
(2b) The release date of the first unaffected version after introduction of the vulnerability
is a useful proxy for the fix event. Using online sources, it was possible to identify the
first version of the software released after the introduction but not on the list of affected
versions, and to identify the release date of that version.
(3) The number of linked records in the “References for CVE” field varied between 1 and
7. All of the CVE records examined included a security advisory, typically issued on the
same day that the fix was available; the format varied widely, from formal records to blog
posts. Other references variously included posts to the [oss-security] mailing list
_______________________________________________________________________________________________________________________________________________
Copyright © 2017 S. M. Monzur Murshed

Chapter 7: Results 69_______________________________________________________________________________________________________________________________________________
requesting assignment of a CVE, posts to project mailing lists discussing the
vulnerability, posts to other public discussion about the vulnerability, bug reports,
commit logs for the commitment of a patch to the project source code that addresses the
vulnerability, and blog posts. The formats and content of project records varied widely
between different projects.
(4) For some CVEs, the references were informative about the events in the vulnerability
lifecycle model. For example, the first public announcement about the vulnerability was
typically the same date that a fix was available and included instructions about how to
patch or otherwise mitigate the vulnerability. For some CVEs with particularly
voluminous and rich references, there was information about how and when the
vulnerability was reported, and how the developers responded. For other CVEs with few
references, the additional information was sparse.
Unfortunately, there was no reliable proxy for the discovery event that could be
consistently harvested from the CVE Details records. There were reliable proxies for the
introduction event and the fix event using the list of affected versions and using other
online sources to identify release dates of the project’s software. With proxies for the
introduction event and the fix event, it is possible to test hypotheses about the total
exposure time, but with no proxy for the discovery event, it is not possible to test the
hypotheses about time to discover or time to fix. The automated data collection
techniques of Munzert et al. (2015) can be applied to identify the CVEs affecting a
project and the affected versions, but a manual operation will be required to identify the
version release dates and the corresponding proxies for the introduction and fix events. _______________________________________________________________________________________________________________________________________________
Copyright © 2017 S. M. Monzur Murshed
Chapter 7: Results 70_______________________________________________________________________________________________________________________________________________
7.3 Statistical analysis of full sample
The method for statistical analysis of the full sample of vulnerabilities was
previously explained in section 6.9. Following the advice of Fox (2016, p. 28): “Careful
data analysis should begin with inspection of the data” – for this thesis, inspection of the
data includes summary statistics, plots, and close examination of project metrics,
followed by univariate examination of the explanatory and response variables, then
bivariate examination of combinations of variables. Next, we present in detail linear
regression analysis of the response variable on the unmodified explanatory variables, and
report the results of the hypothesis tests. Following the advice of Fox (2016) and
employing the techniques of Fox & Weisberg (2011), we then present regression
diagnostics of the model 1 results, including inspection of residuals. Finally, we explore
a series of alternative models, including smoothing the explanatory variables with time-
averaging, and various logarithmic and power transforms of the explanatory and response
variables, to investigate the robustness of the hypothesis tests to various modelling
assumptions. Finally, we examine effect size and practical significance of the
associations.
7.3.1 Project metrics
Table 16 is a summary report of the open source project metrics used to compute
the explanatory variables (Table 10 in section 6.7) for each of the 1286 vulnerabilities in
the full sample, in the month that the vulnerability was fixed. The number of contributors
in the month of the fix ranges between 1 and 77, with a median of 10, a sample mean of
19, and an interquartile range of 29. The number of code commits to the project source
_______________________________________________________________________________________________________________________________________________
Copyright © 2017 S. M. Monzur Murshed

Chapter 7: Results 71_______________________________________________________________________________________________________________________________________________
code in the month of the fix ranges between 3 and 4686, with a median of 420, a sample
mean of 828, and an interquartile range of 871. Project source code ranges in size from
four kLOC to more than four thousand kLOC, with a median of 309 kLOC, a sample
mean of 730 kLOC, and an interquartile range of 840 kLOC. All of these project metrics
are right-skewed in distribution, with a small number of relatively large values resulting
in a sample mean that is approximately twice the median. The metrics for lines of code
added and lines of code removed are even more right-skewed by large outliers, resulting
in sample means beyond the third quartile of the distributions. This insight is important
because regression results can be sensitive to outliers (Fox, 2016).
Table 16: Project metrics: mean, quartiles, and range
Metrics Minimum value
First quartile
Second quartile
(median)
Sample mean
Third quartile
Maximum value
Inter-quartile range
Range
Contributors/month
1 4 10 19 33 77 29 76
Commits/month
3 183 420 828 1054 4686 871 4683
Comment ratio 0.07 0.16 0.24 0.23 0.30 0.42 0.23 0.35
Code added/month
0 3820 14300 80240 40740 1608000 36920 1608000
Code removed/ month
0 2397 9933 64490 28630 1120000 26233 1120000
Size of code base(thousand lines of code, kLOC)
4.39 142.10 309.10 730.10 982.40 4441.00 840.3 4441
Table 17 sorts the sixty projects of the project sample in descending order by size
of their source code base. Projects vary widely in size: the source code base of the largest
project, XOOPS, is more than five hundred times the size of the source code base of the
smallest project, Anchor CMS._______________________________________________________________________________________________________________________________________________
Copyright © 2017 S. M. Monzur Murshed

Chapter 7: Results 72_______________________________________________________________________________________________________________________________________________
To examine how project metrics vary in time within a project, we selected four
projects for closer inspection. We deliberately chose projects of different code base
sizes: Plone (Figure 6; a very large project with more than one million lines of code),
Drupal (Figure 7; a large project with between 500k and on million lines of code),
MediaWiki (Figure 8; a medium project with between 250k and 500k lines of code), and
Serendipity (Figure 9; a small project with less than 250k lines of code). _______________________________________________________________________________________________________________________________________________
Copyright © 2017 S. M. Monzur Murshed
Table 17: Projects sorted by size of code base (kLOC)Project name KLOC Project name KLOC
xoops 8494 concrete5 279magento 8259 pimcore 257typo3 3810 bigtreecms 251moodle 3098 piwigo 236opencms 2796 serendipity 231ezpublish 2785 cmsmadesimplecm 230twiki 2070 ovidentia 222plone 1248 oscommerce 211impresscms 1030 actionapps 202ocportal 806 pivot 199webgui 789 webedition 197movabletype 769 zenphoto 170phpbb 737 lifetype 157silverstripe 720 spip 144drupal 704 impresspages 138b2evolution 686 textpattern 117jaws 675 monstra 110geeklog 649 dokuwiki 103e107 525 pivotx 88.9mahara 507 omeka 73mediawiki 493 bedita 61bitweaver 441 usebb 56wordpress 423 croogo 52tomatocart 407 habari 48.2dotclear 394 punbb 44prestashop 364 wolfcms 38joomla 356 kajona 26vanilla forums 314 nibbleblog 25gallery 311 anchorcms 16zikula 304 pmwiki

Chapter 7: Results 73_______________________________________________________________________________________________________________________________________________
_______________________________________________________________________________________________________________________________________________
Copyright © 2017 S. M. Monzur Murshed
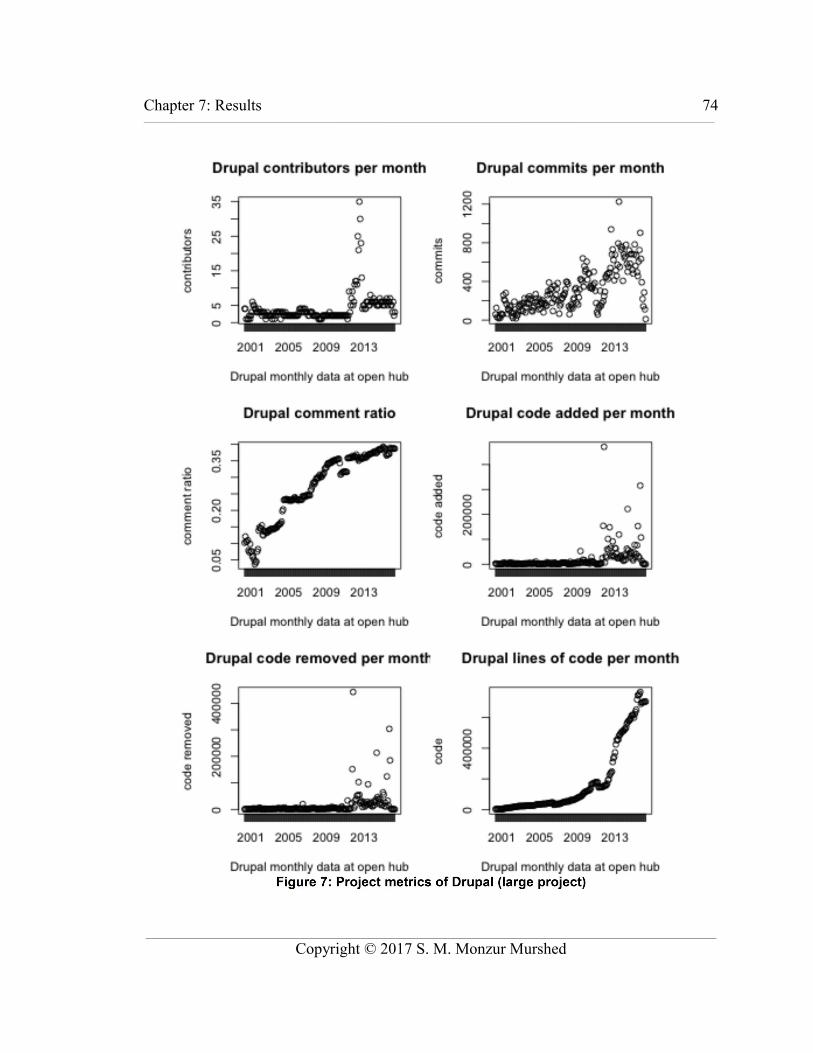
Chapter 7: Results 74_______________________________________________________________________________________________________________________________________________
_______________________________________________________________________________________________________________________________________________
Copyright © 2017 S. M. Monzur Murshed

Chapter 7: Results 75_______________________________________________________________________________________________________________________________________________
_______________________________________________________________________________________________________________________________________________
Copyright © 2017 S. M. Monzur Murshed
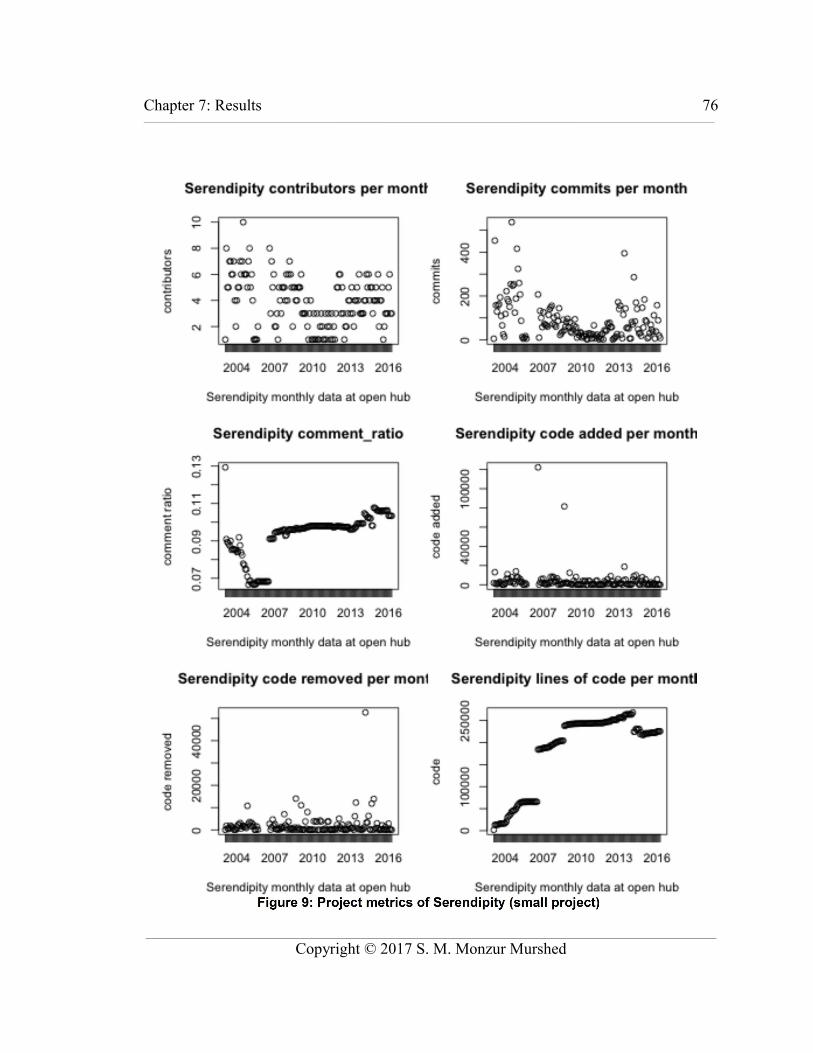
Chapter 7: Results 76_______________________________________________________________________________________________________________________________________________
_______________________________________________________________________________________________________________________________________________
Copyright © 2017 S. M. Monzur Murshed

Chapter 7: Results 77_______________________________________________________________________________________________________________________________________________
The plots of project metrics over time are insightful in at least four ways. First,
all four projects grow over time in the number of contributors, the number of commits,
and the size of the co debase. Second, there is significant month-to-month variation with
occasional high spikes, especially in the code added and code removed metrics, but also
in the number of contributors and the number of commits. For example, Plone presents a
dramatic one-month spike in 2012, with code added and removed both exceeding twenty
times the typical monthly value – perhaps an error, or perhaps a one-time re-factoring.
Third, there can be abrupt discontinuities, such as removal of half the MediaWiki code
base is 2013 – perhaps an outcome of a clean-up operation – or the sudden changes in
size of the Serendipity code base, both up and down, occurring in months with unusually
large additions or removal of code, evident on other plots. Fourth, month-to-month
variations are particularly evident in the smallest project, Serendipity, where the number
of contributors in a month may varies between approximately one and eight over the
history of the project. Overall, inspection thus far suggests that time is important – for
example, the Drupal project in 2014 is larger, more active, and more commented that the
Drupal project in 2009. Thus we need to measure the explanatory variables at a point in
time relevant to the event of interest. Also, some averaging over time may reduce the
noise of month-to-month variations in the project metrics, and may help address outliers.
7.3.2 Univariate displays
Figure 10 plots histograms and boxplots for the four explanatory variables
(contributor density, commit density, comment ratio, and code churn ratio) and the
response variable (time of exposure).
_______________________________________________________________________________________________________________________________________________
Copyright © 2017 S. M. Monzur Murshed

Chapter 7: Results 78_______________________________________________________________________________________________________________________________________________
_______________________________________________________________________________________________________________________________________________
Copyright © 2017 S. M. Monzur Murshed
Chapter 7: Results 79_______________________________________________________________________________________________________________________________________________
Recall that the four explanatory variables are ratios of project metrics (Table 10,
addressing the previous observation that projects vary widely in the size of their source
code base), in the month of the vulnerability fix event (addressing the previous
observation in subsection 7.3.2 that project metrics change significantly over time).
Most variables (except for comment ratio) are right-skewed in distribution, with
a relatively large number of smaller values and a long right tail. According to Fox (2016,
p. 59), there are at least three reasons to consider transforming skewed distributions to
make them more symmetric: (1) highly skewed distributions are difficult to examine and
interpret because most observations are confined to a small part of the range of the data,
(2) outlying values in the direction of the skew are brought in toward the main body of
the data, and unusual values in the opposite direction of the skew can be revealed, and
(3) least-squares regression summarizes distributions using means but means are not
good summaries of the centre of skewed distributions. Subsection 7.3.8 examines
transforms to address skewness.
7.3.3 Bivariate displays
Figure 11 is a scatterplot matrix of the bivariate scatterplots for all pairs of
variables. Fox (2016) recommends manual inspection of the scatterplot matrix as an
informative graphical analog to inspecting the correlation matrix.
_______________________________________________________________________________________________________________________________________________
Copyright © 2017 S. M. Monzur Murshed

Chapter 7: Results 80_______________________________________________________________________________________________________________________________________________
_______________________________________________________________________________________________________________________________________________
Copyright © 2017 S. M. Monzur Murshed
Chapter 7: Results 81_______________________________________________________________________________________________________________________________________________
Fox & Weisberg (2011) explain the two colours of smoothing lines on the scatter
plots. First, the green straight line is fit by ordinary least squares (OLS) regression.
Second, the solid red curved line is fit using the lowess method (locally weighted
scatterplot smoother; Fox, 2016, p. 23) – a form of local linear regression fit to data in the
neighbourhood of the focal point, with weights declining as the x values get farther from
the x value of the focal point. The two red dotted lines show the fraction of the data
included in the local regression fit.
The main diagonal of the scatter plot matrix displays a nonparametric density
estimation of each variable, with a naive kernel and a rug-plot at the bottom showing the
location of data values (Fox, 2016, p. 35). This is similar to the traditional histograms in
Figure 10, except with averaging and smoothing. Right-skew is evident for exposure
time, contributor density, commit density, and code churn ratio.
The top row of the scatterplot matrix displays the bivariate relationships of
exposure time with each explanatory variable. The over-all trends appear to be
approximately consistent with the hypotheses at low and medium values of the
explanatory variables. This thesis explores linear relationships in subsection 7.3.5, then
explores transforms to improve linearity and correct skewness in subsection 7.3.8.
At high values of the explanatory variables, the over-all trend is less clear. The
local smoothing line for code churn ratio diverges sharply up at high values – possibly
from influential outliers that may be addressed by a transform to correct skewness and
improve linearity (explored in subsection 7.3.8), or it could suggest a possible curvilinear
or polynomial relationship, such as is typical with some economic models of decreasing _______________________________________________________________________________________________________________________________________________
Copyright © 2017 S. M. Monzur Murshed

Chapter 7: Results 82_______________________________________________________________________________________________________________________________________________
returns. In a curvilinear model, either low levels or high levels of code churn could be
associated high high exposure times – the former because of low activity (vulnerabilities
not found and fixed) and the latter because of high activity (too much change for finding
and fixing vulnerabilities). Further exploration of curvilinear relationships with quadratic
or polynomial models is an opportunity for future research.
7.3.4 Summary statistics and correlation
Table 18 presents descriptive statistics and correlation coefficients.
Table 18: Summary statistics and correlation coefficients
Variable Min. First quartile
Second quartile
(median)
Mean Third quartile
Max. 1 2 3 4
1 Contributor.density 0.000 0.017 0.032 0.047 0.064 0.350
2 Commit.density 0.006 0.686 1.244 2.076 2.567 24.360 0.44
3 Comment.ratio 0.067 0.160 0.243 0.232 0.301 0.420 -0.09 -0.06
4 Code.churn.ratio 0.000 31.23 79.37 169.1 182.5 1995 0.11 0.28 0.16
5 Exposure.time 1.000 158.5 558.0 893.0 1202 4357 -0.09 -0.19 -0.08 -0.13
Fox (2016, p. 59) warns that the mean of a skewed distribution is not a good
summary of the centre. Four of the five variables are right-skewed, thus the median is
preferred here as the measure of central tendency. Likewise, the Internationale range (the
difference between the third quartile and the first quartile) is preferred here as the
measure of variation of the untransformed variables.
The values of the correlation matrix are commonly interpreted as evidence of
whether or not simple linear associations exist between pairs of variables, and the
direction of association (Fox, 2016). All four explanatory variables are negatively
correlated with exposure time (consistent with the hypotheses). Contributor density
_______________________________________________________________________________________________________________________________________________
Copyright © 2017 S. M. Monzur Murshed
Chapter 7: Results 83_______________________________________________________________________________________________________________________________________________
appears to be correlated with commit density (r=0.44) – a possible indication of
multicollinearity that could negatively impact the stability of regression results.
Likewise, comment ratio appears to be correlated with code churn ratio (r=0.28). We
address the possibility of multicollinearity in subsection 7.3.6, and explore the effect of
removing variables in subsequent analysis.
7.3.5 Regression results (models 1 and 2)
Table 19 presents the results of linearly regressing the response variable of
exposure time (te) on the four explanatory variables (model 1), contributor density (x1),
commit density (x2), comment ratio (x3), and code churn ratio (x4).
Table 19: Regression results (no time-averaging)
Variable Model 1 (all variables)(n=1268)
Model 2 (most significant variables only)(n-1270)
Intercept 1324.3 *** 1322.1 ***
Contributor.density -314.76
Commit.density -69.184 *** -80.820 ***
Comment.ratio -961.10 ** -1106.5 ***
Code.churn.ratio -0.2687 *
R2 0.05 0.04
* p <0.05; ** < 0.01; *** p < 0.001
We test each hypothesis in the standard way for linear regression (Fox, 2016; q.v.,
Eisenhardt & Tabrizi, 1995) by inspecting the p-values and sign of the regression
coefficients. For each hypothesis, H1c through H4c, we reject the null hypothesis if and
only if two conditions are met: (1) the p-value of the regression coefficient is below a
critical threshold (p<0.05, indicated by one asterisk in the table of regression results,
_______________________________________________________________________________________________________________________________________________
Copyright © 2017 S. M. Monzur Murshed

Chapter 7: Results 84_______________________________________________________________________________________________________________________________________________
although p<0.01 with at least two asterisks is preferred) and (2) the regression coefficient
is of the predicted sign (negative). We interpret rejection of the null hypothesis as
support for the alternative hypothesis – that is, support for the hypothesis that we are
testing for.
In model 1, hypothesis H1c that higher contributor density is associated with
shorter exposure time is not supported; the p-value is above the critical threshold thus the
regression coefficient is not statistically significant. Hypothesis H2c, that more commit
density is associated with lower vulnerability exposure time, is strongly supported; the p-
value of the commit density coefficient is well below the critical threshold (p<0.001) and
the coefficient has predicted sign (negative). Hypothesis H3c that higher comment ratio
is associated with lower exposure time is also supported with a low p-value (p<0.01).
Hypothesis H4c, that higher code churn ratio is associated with lower exposure time, is
weakly supported with a p-value slightly below the standard critical threshold (p<0.5).
Model 2, also shown in Table 19, regresses the response variable of exposure time
(te) on two explanatory variables – commit density (x2) and comment ratio (x3). There
are two motivations for running model 2 with fewer explanatory variables. First,
following standard procedures for hypothesis testing with regression analysis (Fox,
2016), we re-run the regression after removing the explanatory variables that were not
statistically significant. Second, removing contributor density addresses possible
multicollinearity between contributor density and commit density, and removing code
churn ratio addresses possible multicollinearity between comment ratio and code churn
ratio. Both H2c and H3c are supported in model 2 (p<001)._______________________________________________________________________________________________________________________________________________
Copyright © 2017 S. M. Monzur Murshed

Chapter 7: Results 85_______________________________________________________________________________________________________________________________________________
7.3.6 Regression diagnostics (model 1)
According to Fox (2016, p. 266), regression diagnostics “are often the difference
between a crude, mechanical data analysis and a careful nuanced analysis that accurately
describes the data and therefore supports meaningful interpretation of them.” Previous
subsections have identified several ways in which the simple linear regression of model 1
and 2 may be inadequate, including month-to-month variability in project metrics
(subsection 7.3.1), right-skewness of the response variable and some explanatory
variables (subsections 7.3.2 and 7.3.3), and mixed evidence about linearity of
associations (subsection 7.3.3). Prior to addressing these deficiencies with time
averaging of project metrics in subsection 7.3.7 and a series of transformations in
subsection 7.3.8, this subsection examines the residuals of model 1 for further insights.
Figure 12 displays a set of residual plots for model 1. The bottom diagnostic
graph is a plot of residuals versus the fitted values – “the most common diagnostic graph
in linear regression” (Fox & Weisberg, 2011, p. 288). The top four diagnostic graphs
plot residuals versus each of the predictors. Fox & Weisberg (2011, p. 288) write:
If a linear model is correctly specified, then the Pearson residuals are independent of the fitted values and the predictors, and these graphs should be null plots, with no systematic features – in the sense that the conditional distribution of the residuals (on the vertical axis of the graph) should not change with the fitted values or with a predictor (on the horizontal axis). The presence of systematic features generally implies failure of one or more assumptions of the model. Of interest in these plots are nonlinear trends, trends in variation across the graph, and isolated points.
_______________________________________________________________________________________________________________________________________________
Copyright © 2017 S. M. Monzur Murshed

Chapter 7: Results 86_______________________________________________________________________________________________________________________________________________
_______________________________________________________________________________________________________________________________________________
Copyright © 2017 S. M. Monzur Murshed

Chapter 7: Results 87_______________________________________________________________________________________________________________________________________________
There are several insights from inspecting Figure 12. First, with the exception of
comment ratio, the x axis is unbalanced for all variables. This will be addressed in
subsection 7.3.8 with transformations to correct for right-skew. Second, the plot of
residuals versus fitted values has a curved trend (concave up), suggesting that the model
is not adequate to describe the data; this was expected from prior observations about
bivariate associations. Third, there appears to be non-constant error, growing larger with
larger fitted values, and with smaller values of contributor density, commit density, and
code churn ratio, which are expected to be associated with larger fitted values; non-
constant error is also addressable with transformations (Fox, 2016) in subsection 7.3.8.
Fourth, there are isolated points, including fitted values with negative time, that may
result from month-to-month variation in project metrics, and may be addressed by time
averaging. Subsequent subsections will address these inadequacies.
7.3.7 Time-averaging
Next, we examine the effect of smoothing the explanatory variables with time-
averaging over three months, six months, and twelve months. Previously in subsection
7.3.1, we had observed large month-to-month variation in some project metrics, which
could result in noise and spurious influential outliers in the explanatory variables.
In our base model examined in the previous subsection, the explanatory variables
were assigned in the month of the fix event. With a time-averaging window of width w,
the explanatory variable is the average over w consecutive months, with the last month of
the sequence being the month of the fix event. Larger windows will be more effective at
reducing noise, but will be less sensitive to real short-term changes. Also, the number of
_______________________________________________________________________________________________________________________________________________
Copyright © 2017 S. M. Monzur Murshed
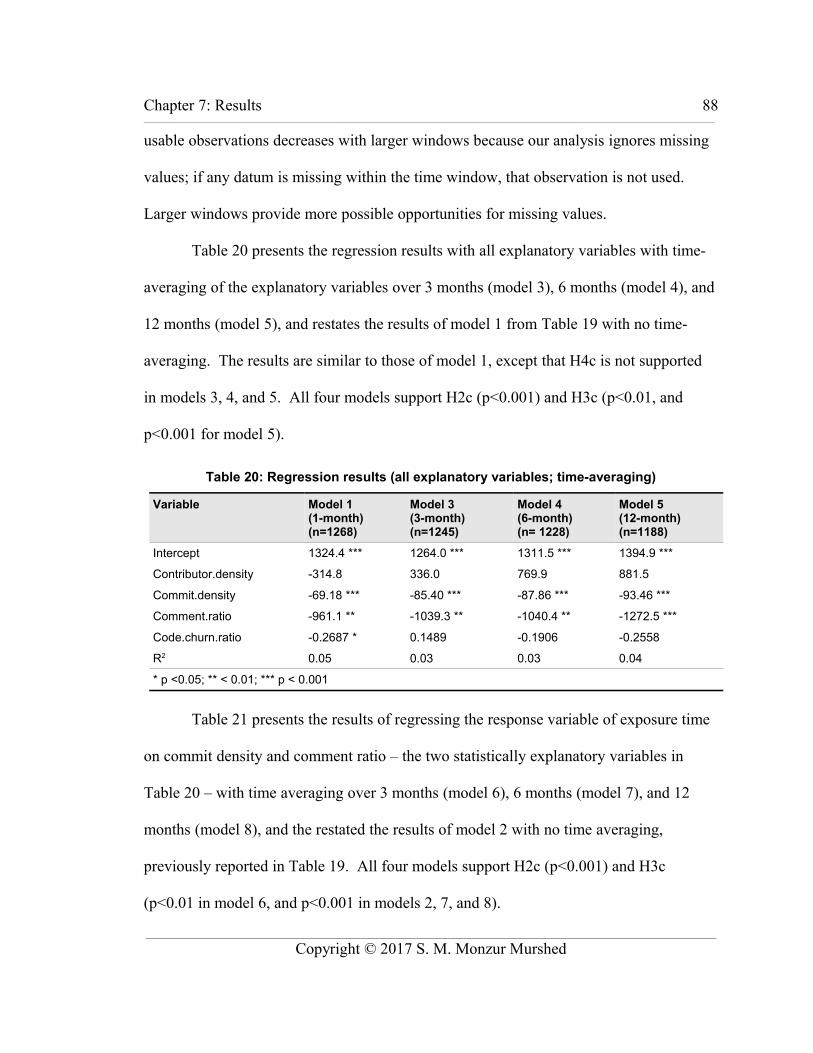
Chapter 7: Results 88_______________________________________________________________________________________________________________________________________________
usable observations decreases with larger windows because our analysis ignores missing
values; if any datum is missing within the time window, that observation is not used.
Larger windows provide more possible opportunities for missing values.
Table 20 presents the regression results with all explanatory variables with time-
averaging of the explanatory variables over 3 months (model 3), 6 months (model 4), and
12 months (model 5), and restates the results of model 1 from Table 19 with no time-
averaging. The results are similar to those of model 1, except that H4c is not supported
in models 3, 4, and 5. All four models support H2c (p<0.001) and H3c (p<0.01, and
p<0.001 for model 5).
Table 20: Regression results (all explanatory variables; time-averaging)
Variable Model 1 (1-month)(n=1268)
Model 3 (3-month)(n=1245)
Model 4 (6-month)(n= 1228)
Model 5(12-month)(n=1188)
Intercept 1324.4 *** 1264.0 *** 1311.5 *** 1394.9 ***
Contributor.density -314.8 336.0 769.9 881.5
Commit.density -69.18 *** -85.40 *** -87.86 *** -93.46 ***
Comment.ratio -961.1 ** -1039.3 ** -1040.4 ** -1272.5 ***
Code.churn.ratio -0.2687 * 0.1489 -0.1906 -0.2558
R2 0.05 0.03 0.03 0.04
* p <0.05; ** < 0.01; *** p < 0.001
Table 21 presents the results of regressing the response variable of exposure time
on commit density and comment ratio – the two statistically explanatory variables in
Table 20 – with time averaging over 3 months (model 6), 6 months (model 7), and 12
months (model 8), and the restated the results of model 2 with no time averaging,
previously reported in Table 19. All four models support H2c (p<0.001) and H3c
(p<0.01 in model 6, and p<0.001 in models 2, 7, and 8).
_______________________________________________________________________________________________________________________________________________
Copyright © 2017 S. M. Monzur Murshed

Chapter 7: Results 89_______________________________________________________________________________________________________________________________________________
Table 21: Regression results (significant variables only; time averaging)
Variable Model 2 (Monthly)(n=1270)
Model 6 (Quarterly)(n=1247)
Model 7 (6 Months)(n=1230)
Model 8(12 Months)(n=1190)
Intercept 1322.1 *** 1284.0 *** 1333.2 *** 1411.5 ***
Commit.density -80.82 *** -78.51 *** -84.73 *** -90.14 ***
Comment.ratio -1106.5 *** -1002.0 ** -1155.6 *** -1382.6 ***
R2 0.04 0.03 0.03 0.03
* p <0.05; ** < 0.01; *** p < 0.001
Overall, the results of hypothesis tests are robust to time averaging of the
explanatory variables. The 6-month window appears to be effective by providing some
smoothing while retaining most observations.
7.3.8 Transformations
Next, we examine a series of transformations on the response variable and the
explanatory variables, individually and in combination. According to Fox (2016, ch. 4),
transformations can often facilitate the examination and statistical modelling of data, in
particular, by correcting skewness of variables and improving linearity of associations.
This analysis serves two purposes. First it is a way of exploring the robustness of the
hypothesis tests to various modelling assumptions; robust results would be relatively
insensitive to changes in modelling decisions. Second, it may produce better estimates of
associations between variables by addressing the issues identified in subsection 7.3.6.
We begin with the response variable of exposure time. Subsections 7.3.2, 7.3.3,
7.3.4 previously reported that the distribution is right-skewed (see also Figure 10 and
Figure 11), and thus difficult to examine and interpret (because most observations are
confined to a small part of the range of the data). This can be problematic for linear
_______________________________________________________________________________________________________________________________________________
Copyright © 2017 S. M. Monzur Murshed
Chapter 7: Results 90_______________________________________________________________________________________________________________________________________________
regression, which will be sensitive to outlying values in the right tail, and employs mean
values as the centres of distributions. Right skew can be corrected by transformations
descending what Tukey (1977) called the ladder of powers (Fox, 2016, ch. 4), first to
logarithms, or further to 1/x, 1/x2, and to lower powers (i.e., higher roots). A second
issue is improving linearity between the explanatory variables and exposure time.
Subsections 7.3.3 and 7.3.6 previously reported mixed evidence on linearity – some
suggestion of linearity in the bivariate plots of Figure 11, but also concerns with the
linear residuals in Figure 12. The bulging rule of Mosteller & Tukey (1977), as
described by Fox (2016, pp. 64-69), suggests that simple monotone nonlinearity of a
“bulge down and to the left” – such as observed in the scatterplot of exposure time and
contributor density and the scatterplot of exposure time and commit density, can often be
improved by transformations descending the ladder of powers for either X or Y, or both.
Likewise, a bulge down, possibly suggested by the scatterplots of exposure time and
comment ratio and code churn ratio, could be improved by transformations descending
the ladder of powers for Y (with no transformation of X). Fortunately, these rules-of-
thumb all indicate the same transformation – a logarithm or root of the response variable
(exposure time). Fox & Wiesberg (2011, p. 127) write: “The single most important
transformation of a strictly positive variable is the logarithmic transformation” – our
starting point. We also examine the response variable transformations identified by two
other approaches, described below.
Fox & Wiesberg (2011, pp. 303-306) describe a set of R implementations of the
Box-Cox approach (Box & Cox, 1964) to selecting a transformation of the response _______________________________________________________________________________________________________________________________________________
Copyright © 2017 S. M. Monzur Murshed

Chapter 7: Results 91_______________________________________________________________________________________________________________________________________________
variable in regression. The Box-Cox approach identifies the power transformation with
the maximum likelihood to produce residuals that are as close to normally distributed as
possible. For model 4, for example, the Box-Cox approach recommends a power
transform with a lambda of 1.9, i.e., X -> ((X1.9-1)/1.9), where X is exposure time.
Alternatively, Fox & Wiesberg (2011, pp. 315-317) describe an R implementation
of the spread-level plot approach (Tukey, 1977) to suggest a spread-stabilizing power
transformation of the response variable based on comparing the absolute Studentized
residuals to the log of the fitted values. For model 4, for example, the spread-level plot
approach recommends a power transform with a lambda of -0.245, i.e., X -> ((X-0.245-1)/
(-0.245)), where X is exposure time.
The following tables present the regression results implementing three different
transformations of exposure time – a base-10 logarithm (Table 22) suggested by the Fox
(2016) rules-of-thumb and the Mosteller & Tukey (1977) bulging rule, a Box-Cox power
transformation (Table 23) using the approach of Box & Cox (1964), and a spread-level
power transformation (Table 24) using the approach of Tukey (1977). Figure 13 presents
parallel boxplots comparing the three transformations – an approach recommended by
Fox & Wiesberg (2011) to compare transforms with respect the impact on skewness.
_______________________________________________________________________________________________________________________________________________
Copyright © 2017 S. M. Monzur Murshed

Chapter 7: Results 92_______________________________________________________________________________________________________________________________________________
Table 22: Regression results (log transform of response variable)
Variable Model 9 (Monthly)(n=1268)
Model 10 (Quarterly)(n=1245)
Model 11 (6 Months)(n=1228)
Model 12(12 Months)(n=1188)
Intercept 2.789 *** 2.773 *** 2.805 2.848 ***
Contributor.density -1.05186 * -1.25478 ** -1.16831 * -1.00706 *
Commit.density -0.05467 *** -0.05916 *** -0.06086 *** -0.07511 ***
Comment.ratio 0.11758 0.08451 0.03292 -0.06497
Code.churn.ratio -0.00009031 0.00011163 0.00001654 0.00003607
R2 0.07 0.05 0.05 0.05
* p <0.05; ** < 0.01; *** p < 0.001
Table 23: Regression results (Box-Cox power transform of response variable)
Variable Model 13 (Monthly)(n=1268)
Model 14 (Quarterly)(n=1245)
Model 15 (6 Months)(n=1228)
Model 16(12 Months)(n=1188)
Intercept 3.5175 *** 3.49210 *** 3.53404 *** 3.59415 ***
Contributor.density -1.28633 * -1.33496 * -1.15272. -0.95091
Commit.density -0.06915 *** -0.07849 *** -0.08123 *** -0.09652 ***
Comment.ratio -0.01942 -0.07049 -0.12091 -0.26310
Code.churn.ratio -0.00016814 0.0001141 -0.00004983 -0.00005417
R2 0.06 0.05 0.04 0.05
* p <0.05; ** < 0.01; *** p < 0.001
Table 24: Regression results (spread-level power transform of response variable)
Variable Model 17 (Monthly)(n=1268)
Model 18 (Quarterly)(n=1245)
Model 19 (6 Months)(n=1228)
Model 20(12 Months)(n=1188)
Intercept 0.60241 *** 0.05438 *** 0.21904 *** 0.15270 ***
Contributor.density 0.12653 * 0.17114 *** 0.23332 ** 0.20748 **
Commit.density 0.0066139 *** 0.0054494 *** 0.0090305 *** 0.0109404 ***
Comment.ratio -0.019258 -0.023667 -0.0214619 -0.0095947
Code.churn.ratio 0.000008480 -0.00002185 -0.00001499 -0.00002527
R2 0.07 0.06 0.05 0.06
* p <0.05; ** < 0.01; *** p < 0.001
_______________________________________________________________________________________________________________________________________________
Copyright © 2017 S. M. Monzur Murshed
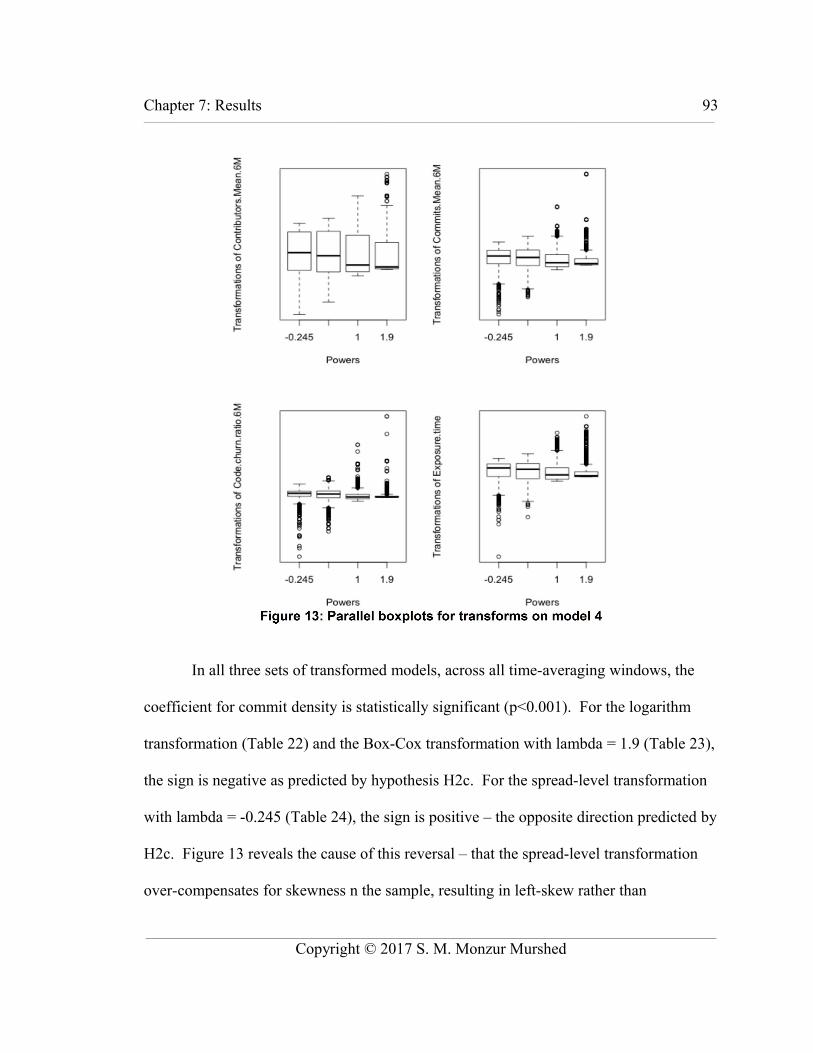
Chapter 7: Results 93_______________________________________________________________________________________________________________________________________________
In all three sets of transformed models, across all time-averaging windows, the
coefficient for commit density is statistically significant (p<0.001). For the logarithm
transformation (Table 22) and the Box-Cox transformation with lambda = 1.9 (Table 23),
the sign is negative as predicted by hypothesis H2c. For the spread-level transformation
with lambda = -0.245 (Table 24), the sign is positive – the opposite direction predicted by
H2c. Figure 13 reveals the cause of this reversal – that the spread-level transformation
over-compensates for skewness n the sample, resulting in left-skew rather than
_______________________________________________________________________________________________________________________________________________
Copyright © 2017 S. M. Monzur Murshed

Chapter 7: Results 94_______________________________________________________________________________________________________________________________________________
symmetry. We interpret this is a strong support for hypothesis H2c, that more commit
density is associated with shorter vulnerability exposure time, which appears to be robust
to variations in modelling assumptions.
The coefficient for contributor density is statistically significant and with the
predicted sign in the logarithmic transformation for all four time windows (p<0.05 or
p<0.01) and two of the time windows for the Box-Cox transformation (p<0.05). It is
statistically significant (p<0.05 or p<0.01) but of the opposite sign for the spread level
transformation (which over-compensates for skewness). We interpret this cautiously as
some (weak) support for H1c.
Of the three transformations plotted in Figure 13, the log transformation of the
response variable provides the best skewness correction, and is selected for further
analysis. Table 25 presents the results of regressing the base 10 logarithm of exposure
time on contributor density and commit density – the two statistically significant
explanatory variables in Table 22. H3c is strongly supported (p<0.001); H1c is also
supported (p<0.05 or p<0.01).
Table 25: Regression results (log transform of response variable; sig. variables only)
Variable Model 21 (Monthly)(n=1270)
Model 22 (Quarterly)(n=1247)
Model 23 (6 Months)(n=1230)
Model 24(12 Months)(n=1190)
Intercept 2.8084 *** 2.8072 *** 2.8156 *** 2.8367 ***
Contributor.density -1.0603 * -1.2442 ** -1.1741 * -0.99526 *
Commit.density -0.05780 *** -0.056553 *** -0.06061 *** -0.07429 ***
R2 0.07 0.05 0.05 0.05
* p <0.05; ** < 0.01; *** p < 0.001
_______________________________________________________________________________________________________________________________________________
Copyright © 2017 S. M. Monzur Murshed

Chapter 7: Results 95_______________________________________________________________________________________________________________________________________________
Next, we consider the explanatory variables. The Fox (2016) rules of thumb
previously suggested transformations to descend the ladder of powers to correct the right-
skew variables (that is, contributor density, commit density, and code churn ratio) and to
improve the linearity of associations “bulging” to the bottom-left (that is, contributor
density and commit density). Table 26 (all variables) and Table 27 (significant variables
only) present the regression results with base 10 logarithm transformations on the
response variable of exposure time and the explanatory variables of contributor density,
commit density, and code churn ratio, and the untransformed comment ration.
Table 26: Regression results (log transform of all variables)
Variable Model 25 (Monthly)(n=1268)
Model 26 (Quarterly)(n=1245)
Model 27 (6 Months)(n=1228)
Model 28(12 Months)(n=1188)
Intercept 2.4391 *** 2.0400 *** 2.1850 *** 2.2934 ***
log10(Contributor.density) -0.06113 -0.12778 * -0.10918 -0.05632
log10(Commit.density) -0.22143 *** -0.26908 *** -0.26345 *** -0.29416 ***
Comment.ratio 0.22033 0.05677 0.05533 0.05632
log10(Code.churn.ratio) 0.03895 0.21006 *** 0.15199 *** 0.14010 **
R2 0.04 0.05 0.04 0.04
* p <0.05; ** < 0.01; *** p < 0.001
Table 27: Regression results (log transform of significant variables only)
Variable Model 29 (Monthly)(n=1270)
Model 30 (Quarterly)(n=1247)
Model 31 (6 Months)(n=1230)
Model 32(12 Months)(n=1190)
Intercept 2.5710 *** 2.2412 *** 2.3577 *** 2.3903 ***
log10(Commit.density) -0.25773 *** -0.34225 *** -0.32732 *** -0.32834 ***
log10(Code.churn.ratio) 0.04641 0.21506 *** 0.15677 *** 0.14237 **
R2 0.04 0.05 0.04 0.04
* p <0.05; ** < 0.01; *** p < 0.001
_______________________________________________________________________________________________________________________________________________
Copyright © 2017 S. M. Monzur Murshed
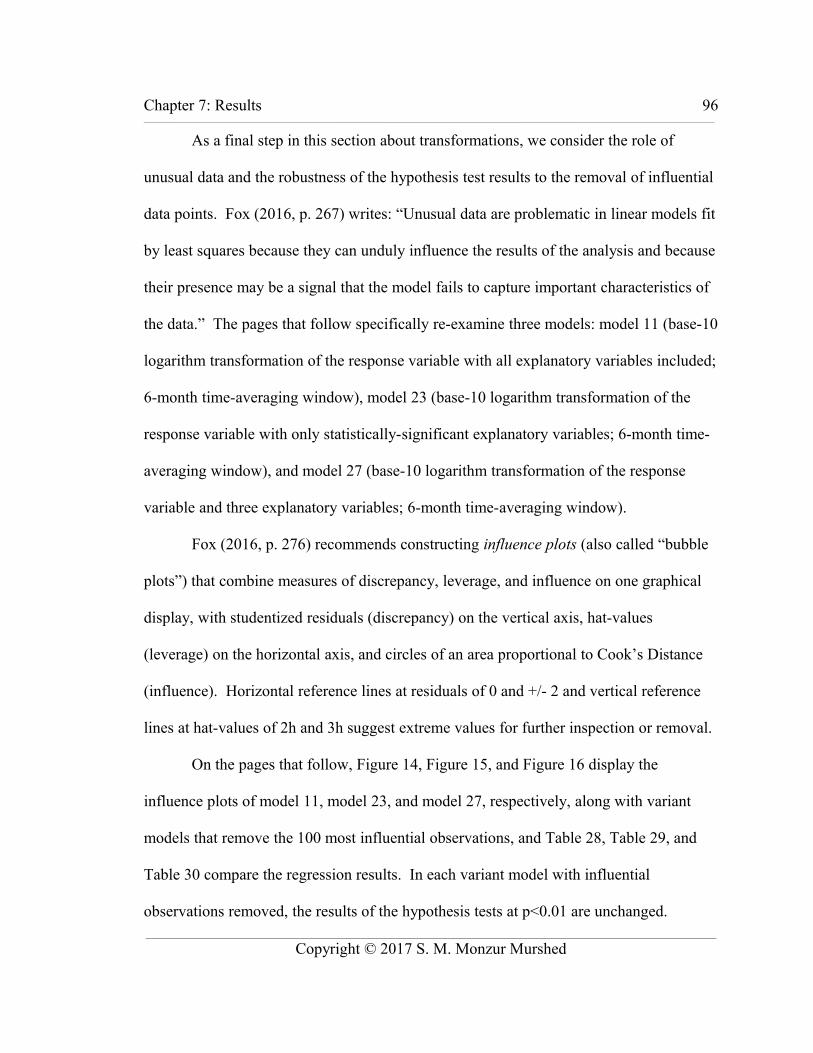
Chapter 7: Results 96_______________________________________________________________________________________________________________________________________________
As a final step in this section about transformations, we consider the role of
unusual data and the robustness of the hypothesis test results to the removal of influential
data points. Fox (2016, p. 267) writes: “Unusual data are problematic in linear models fit
by least squares because they can unduly influence the results of the analysis and because
their presence may be a signal that the model fails to capture important characteristics of
the data.” The pages that follow specifically re-examine three models: model 11 (base-10
logarithm transformation of the response variable with all explanatory variables included;
6-month time-averaging window), model 23 (base-10 logarithm transformation of the
response variable with only statistically-significant explanatory variables; 6-month time-
averaging window), and model 27 (base-10 logarithm transformation of the response
variable and three explanatory variables; 6-month time-averaging window).
Fox (2016, p. 276) recommends constructing influence plots (also called “bubble
plots”) that combine measures of discrepancy, leverage, and influence on one graphical
display, with studentized residuals (discrepancy) on the vertical axis, hat-values
(leverage) on the horizontal axis, and circles of an area proportional to Cook’s Distance
(influence). Horizontal reference lines at residuals of 0 and +/- 2 and vertical reference
lines at hat-values of 2h and 3h suggest extreme values for further inspection or removal.
On the pages that follow, Figure 14, Figure 15, and Figure 16 display the
influence plots of model 11, model 23, and model 27, respectively, along with variant
models that remove the 100 most influential observations, and Table 28, Table 29, and
Table 30 compare the regression results. In each variant model with influential
observations removed, the results of the hypothesis tests at p<0.01 are unchanged. _______________________________________________________________________________________________________________________________________________
Copyright © 2017 S. M. Monzur Murshed

Chapter 7: Results 97_______________________________________________________________________________________________________________________________________________
Table 28: Regression results of Model 11* (with unusual observations removed)
Variable Model 11 (6 Months; n=1228)
Model 11*(6 Months; n=1089)
Intercept 2.805 *** 2.866 ***
Contributor.density -1.16831 * -0.09875
Commit.density -0.06086 *** -0.07685 ***
Comment.ratio 0.03292 -0.03956
Code.churn.ratio 0.00001654 0.15586
R2 0.05 0.05
* p <0.05; ** < 0.01; *** p < 0.001
_______________________________________________________________________________________________________________________________________________
Copyright © 2017 S. M. Monzur Murshed

Chapter 7: Results 98_______________________________________________________________________________________________________________________________________________
Table 29: Regression results of Model 23* (with unusual observations removed)
Variable Model 23 (6 Months; n=1230)
Model 23*(6 Months; n=1031)
Intercept 2.8156 *** 2.91105***
Contributor.density -1.1741 * -0.20152
Commit.density -0.06061 *** -0.10045 ***
R2 0.05 0.08
* p <0.05; ** < 0.01; *** p < 0.001
_______________________________________________________________________________________________________________________________________________
Copyright © 2017 S. M. Monzur Murshed

Chapter 7: Results 99_______________________________________________________________________________________________________________________________________________
Table 30: Regression results of Model 27* (with unusual observations removed)
Variable Model 27 (6 Months; n=1228)
Model 27(6 Months; n=984)
Intercept 2.1850 *** 2.84100 ***
log10(Contributor.density) -0.10918 -0.11365 *
log10(Commit.density) -0.26345 *** -0.29687 ***
Comment.ratio 0.05533 -0.43002 *
log10(Code.churn.ratio) 0.15199 *** 0.11581 **
R2 0.04 0.06
* p <0.05; ** < 0.01; *** p < 0.001
_______________________________________________________________________________________________________________________________________________
Copyright © 2017 S. M. Monzur Murshed

Chapter 7: Results 100_______________________________________________________________________________________________________________________________________________
7.3.9 Effect size
Finally, we examine the effect size and practical significance of the associations
found between exposure time (the response variable) and project properties (the
explanatory variables). Our approach is to vary the explanatory variables over a practical
and realistic range, and report the predicted values of the response variable.
We begin with model 7, a linear model with two explanatory variables, estimated
using a 6-month time-averaging window:
[Model 7] te = 1333.20 - (84.73) x2 - (1155.62) x3
where x2 is commit density, and x3 is comment ratio
Table 31 reports the results of varying each explanatory variable over the interquartile
range of the data set (previously reported in Table 18), holding the other explanatory
variable constant at the median value, and the results of varying both explanatory
variables together over the interquartile range.
_______________________________________________________________________________________________________________________________________________
Copyright © 2017 S. M. Monzur Murshed

Chapter 7: Results 101_______________________________________________________________________________________________________________________________________________
Table 31: Effect size of model 7 (linear model, 6-month time-averaging)
Explanatory variables Response variable
Commit density(x2)
Comment ratio(x3)
Time of exposure
Difference between largest and smallest
Fraction of median value
Quartile Value Quartile Value Predicted Delta %
Vary commit density; comment ratio held constant at median
1st quartile 0.686 median 0.243 994.0
median 1.244 median 0.243 946.7 159.4 16.8%
3rd quartile 2.567 median 0.243 834.6
Vary comment ratio; commit density held constant at median
median 1.244 1st quartile 0.160 1042.7
median 1.244 median 0.243 946.7 163.1 17.2%
median 1.244 3rd quartile 0.301 879.7
Vary both commit density and commit density over interquartile range
1st quartile 0.686 1st quartile 0.160 1090.0
median 1.244 median 0.243 946.7 322.5 34.1%
3rd quartile 2.567 3rd quartile 0.301 767.6
Increasing commit density from the first quartile value (0.686) to the third quartile
value (2.567) while holding comment ratio at the median value (0.243) reduces the
predicted exposure time by 159 days from 994 days to 835 days – a difference of 17% of
the median. Increasing comment ratio from the first quartile value (0.160) to the third
quartile value (0.301) while holding commit density at the median value (1.244) reduces
the predicted exposure time by 163 days from 1043 days to 880 days – a difference of
17% of the median. Varying both variables together reduces the predicted exposure time
by 323 days – a difference of 34% of the median value.
For comparison, Table 18 previously reported summary statistics of exposure
time for the full sample: a median exposure of 558 days, a mean exposure of 893 days.
Thus, using model 7, the predicted exposure time for median values of the explanatory
variables (947 days) is 70% higher than the median exposure time of the sample, and 6%
_______________________________________________________________________________________________________________________________________________
Copyright © 2017 S. M. Monzur Murshed

Chapter 7: Results 102_______________________________________________________________________________________________________________________________________________
higher than the mean – of a distribution shown to be right-skewed.
Similarly, we repeat this approach with model 23, a logarithmic model with two
explanatory variables, estimated using a 6-month time-averaging window:
[Model 23] log10 (te) = 2.8156 - (1.1741) x1 - (0.06061) x2
te = 10 (2.8156 - (1.1741) x1 - (0.06061) x2 )
where x1 is contributor density and x2 is commit density
Table 32 reports the results of varying each explanatory variable over the interquartile
range of the data set (previously reported in Table 18), holding the other explanatory
variable constant at the median value, and the results of varying both explanatory
variables together over the interquartile range.
Table 32: Effect size of model 23 (log response, 6-month time-averaging)
Explanatory variables Response variable
Contributor density (x1)
Commit density(x2)
Time of exposure
Difference between largest and smallest
Fraction of median value
Quartile Value Quartile Value Predicted Delta %
Vary contributor density; commit density held constant at median
1st quartile 0.017 median 1.244 525.1
median 0.032 median 1.244 504.2 62.7 12.4%
3rd quartile 0.064 median 1.244 462.4
Vary commit density; contributor density held constant at median
median 0.032 1st quartile 0.686 545.1
median 0.032 median 1.244 504.2 125.8 25.0%
median 0.032 3rd quartile 2.567 419.2
Vary both contributor density and commit density over interquartile range
1st quartile 0.017 1st quartile 0.686 567.6
median 0.032 median 1.244 504.2 183.1 36.3%
3rd quartile 0.064 3rd quartile 2.567 384.5
_______________________________________________________________________________________________________________________________________________
Copyright © 2017 S. M. Monzur Murshed
Chapter 7: Results 103_______________________________________________________________________________________________________________________________________________
Increasing contributor density from the first quartile value (0.017) to the third
quartile value (0.064) while holding commit density at the median value (1.244) reduces
the predicted exposure time by 63 days from 525 days to 462 days – a difference of 12%
of the median. Increasing commit density from the first quartile value (0.686) to the third
quartile value (2.567) while holding contributor density at the median value (0.032)
reduces the predicted exposure time by 126 days from 545 days to 419 days – a
difference of 25% of the median. Varying both variables together reduces the predicted
exposure time by 183 days – a difference of 36% of the median value.
The predicted exposure time of model 23 for median values of the explanatory
variables (504 days) is 10% lower than the median exposure time of the sample (558
days), and 44% higher than the mean (893 days).
In summary, varying the explanatory variables over a practical and realistic range
is associated with reduction in predicted exposure time on the order of months (10.8
months for model 7, and 6.1 months for model 23) – a difference of practical significance
to practitioners.
The chapter has presented of the results of the thesis. The next chapter discusses
these results.
_______________________________________________________________________________________________________________________________________________
Copyright © 2017 S. M. Monzur Murshed
An investigation of software vulnerabilities in open source software projects using data from publicly-available sources Copyright © 2017 S. M. Monzur Murshed_______________________________________________________________________________________________________________________________________________
8 DiscussionThis chapter discusses the results that were reported in the previous chapter.
Section 8.1 presents the answers to the three guiding research questions. Section 8.2
reflects on the lesson learned by the author from completing this thesis. Section 8.3
discusses the contribution to research. Section 8.4 discusses the contribution to practice.
Section 8.5 addresses the limitations of this research. Section 8.6 proposes opportunities
for future research.
8.1 Answers to the research questions
The first of three guiding research questions from section 1.1 was the following:
(1) How do the observable properties of an open source software project relate to the
time taken to discover and fix software vulnerabilities?
First, more developer activity (in the form of commit density – the number of
source code commits per month relative to the size of the software code base) is
associated with shorter exposure time (between the introduction of a vulnerability and the
release of a fix). This finding was robust to all modelling assumptions, statistically
significant in all tests, and of a sufficiently large effect size to be significant in practice.
Second, there is some evidence – suggestive but not conclusive – that three other
factors may be associated with exposure time: (1) contributor density (the number of
contributors in a month relative to the size of the code base) as a measure of community
participation, (2) comment ratio (the proportion of comments in the source code base) as
an approach to tame complexity and ease understanding, and (3) code churn ratio (the
_______________________________________________________________________________________________________________________________________________
104

Chapter 8: Discussion 105_______________________________________________________________________________________________________________________________________________
proportion of source code that changes in a month) as a measure of churn. However,
these findings were not robust to changes in modelling assumptions.
Third, the project properties examined here can explain a relatively small
proportion of the variance in exposure time (R2 equal to or less than 7% in all models).
Further work is needed to identify and understand the main drivers of exposure time by
considering other explanatory variables in addition to the four examined here (discussed
in more detail in section 8.6). Although low R2 values are problematic for making
precise predictions due to the high levels of unexplained “noise” in the response
variables, Frost (2014) defends their value: “Even when R-squared is low, low p-values
still indicate a real relationship between the significant predictors and the response
variable” – a potentially insightful result for an exploratory study in a new domain.
Due to limitations in data availability, we were unable to distinguish between the
time to discover a vulnerability and the time to fix a vulnerability; we could examine only
the time of exposure – the combined time to discover and fix a vulnerability.
The second guiding research question was the following:
(2) To what extent is the data required to answer question 1 available through publicly-
available online sources?
Some of the data required was easily available from online databases with
automated data collection procedures, some was available with difficulty through manual
inspection of websites and documents, and some was not available.
Data readily harvested from online databases included the commit history of open
source software projects (including monthly metrics on code, commits, and contributors), _______________________________________________________________________________________________________________________________________________
Copyright © 2017 S. M. Monzur Murshed
Chapter 8: Discussion 106_______________________________________________________________________________________________________________________________________________
CVE records of vulnerabilities (including CVE IDs affecting a project, CVSS metrics,
products and product version affected, and references), and additional information about
CVEs (including exploits, OVAL definitions, and user-supplied information).
Data available with manual effort included project release history (needed to
estimate the introduction event and the fix event using records on affected versions).
Data not readily available included the date of the vulnerability discovery, which
limited the analysis performed here to only four of the twelve hypotheses developed in
chapter 5 – a significant limitation further discussed in sections 8.5 and 8.6.
The third and final guiding research question was the following:
(3) How can existing publicly-available databases be improved?
Online databases, such as CVE Details and Black Duck Open Hub, were designed
to deliver value to practitioners; these same systems could be readily extended to service
the needs of researchers by making improvements in four areas: (1) coverage, (2) quality,
(3) access, and (4) integration.
Coverage about vulnerabilities should include an accurate timeline of events in
the vulnerability lifecycle (section 4.1) – about the introduction, discovery, and fix of the
vulnerability. The timeline of events should be easily harvested by software scripts, and
each event should be linked to supporting evidence – for example, the security bulletin
associated with public disclosure. The required information may already exist in the
“references” links of some CVEs, but these URLs and online documents are not easily
accessed and parsed. Coverage about affected products and versions, and coverage of
open source projects, should both include timelines of release history. Coverage of open _______________________________________________________________________________________________________________________________________________
Copyright © 2017 S. M. Monzur Murshed
Chapter 8: Discussion 107_______________________________________________________________________________________________________________________________________________
source software projects should include security vulnerabilities in those projects.
Quality improvements are about accuracy of the data. There are known
inconsistencies in CVE data (described in section 3.1) including projects and products
with multiple names (confounding search results), and omissions from the list of affected
versions. Correcting these errors upstream at the CVE List or the National Vulnerability
Database would benefit all consumers; alternatively, these errors could be corrected by a
downstream aggregator such as CVE Details. Correcting errors in old records is valuable
to researchers seeking historical data sets.
Access improvements refers to the ease of data collection. CVE Details should
document and expose an API. Open Hub should expand the existing Ohloh API and
improve the Ohloh API documentation – for example, by providing samples of code in R.
Integration improvements refers to the interoperability of online sources. Both
Open Hub and CVE Details could be improved by either linking to or aggregating
content from the other: for example, clicking through a CVE record to information about
an open source software project, or clicking through a project record for information
about CVEs. In 2016, Open Hub added a new “Project Security” dashboard alongside
the code, activity, and community dashboards of each open source project (Degen-
Portnoy, 2016; Wilcox, 2016). Currently the security dashboard has limited
functionality, including some visualizations of vulnerability counts and severity scores,
and links to individual CVE records at the National Vulnerability Database. With some
enhancements, including security extensions to the Ohloh API, Open Hub could become
the single source for data about open source projects and vulnerabilities in those projects._______________________________________________________________________________________________________________________________________________
Copyright © 2017 S. M. Monzur Murshed

Chapter 8: Discussion 108_______________________________________________________________________________________________________________________________________________
Finally, open source projects vary widely with respect to vulnerability policy and
reporting of security information on project websites. The Apache HTTP Server project,
examined in section 4.2, provides detailed security pages with vulnerability timelines that
are more detailed and rigorously referenced than the corresponding CVE records. Other
open source projects could provide more value to their communities by offering security
pages comparable to those of the Apache HTTP Server project.
8.2 Lessons learned from writing this thesis
This thesis is the culmination of my graduate studies in Technology Innovation
Management (TIM). From the beginning of my studies in the TIM program, I have
focused on open source software and software vulnerabilities. All of my course
assignments have focused on one or both of these two domains. Though my background
is in mechanical engineering, not information technology, this consistency has helped me
to identify a clear and relevant research question and to develop a systematic research
method to answer the question. From my initial research question about understanding
the relationships between project attributes, community attributes, and software
vulnerabilities in open source software projects, I realized that I also had much to say
about the limitations of today’s online databases, and that I could now offer some of my
own recommendations to help make this better.
The early days had a lot of reading. I investigated definitions of ideas like
“software vulnerability”, and learned how researchers define their ideas in a precise and
formal way. I learned about standards, like the Common Weakness Enumeration, to help
different researchers measure things in a consistent way. I learned about prominent data
_______________________________________________________________________________________________________________________________________________
Copyright © 2017 S. M. Monzur Murshed

Chapter 8: Discussion 109_______________________________________________________________________________________________________________________________________________
breaches and other security failures, and also about their real-life consequences. And I
learned about the opinions and viewpoints of open source software developers, and
realized how it might be possible to test some of their ideas.
To develop my hypotheses, I needed to keep learning. I learned about how open
source software development really works, today (Fogel, 2016) and in the recent past
(Fogel, 2006) – through community and meritocracy, voluntary participation and
contribution, and component reuse and integration. I learned what the research on open
source software had to say about architectures, complexity, community-building, release
management, and participation by companies. I learned about open source metrics, about
websites that collect and report metrics, and about how open source projects can differ.
And I needed to learn more about cybersecurity – about code complexity, about the
lifecycle of a software vulnerability, and about vendor responsibility.
To get the data to test my hypotheses, I needed to learn about techniques for
automated data collection (Munzert et al. 2015), application programming interfaces
(APIs), markup languages including XML and HTML, developing software scripts in R
and in Python, and using an integrated development environment (RStudio;
https://www.rstudio.com/). Applying what I learned, I figured out how to get data about
software vulnerabilities from CVE Details, how to get data about open source projects
from Black Duck Open Hub, and about how to merge these sets together into an R data
frame. I had previously used R software and regression analysis in my graduate courses,
but to really test my hypotheses, I needed to master applied regression and to learn new
things by reading books, like Fox (2016) and Fox & Weisberg (2011), about R packages, _______________________________________________________________________________________________________________________________________________
Copyright © 2017 S. M. Monzur Murshed
Chapter 8: Discussion 110_______________________________________________________________________________________________________________________________________________
scripting, residuals, regression diagnostics, transformations, and effect size.
8.3 Contribution to research
This thesis makes at least three contributions to scholarly research. A first
contribution is the results of the statistical hypothesis tests, which strongly support the
hypothesis that higher commit density – a proxy for developer activity (Shin et al. 2011)
and thus more opportunities for developer “eyeballs” to examine the source code
(Raymond, 1999) – is associated with lower vulnerability exposure time. Ceteris
paribus, open source projects with more commits per month to the source code are
expected to find and fix vulnerabilities in less time. The purported benefits of higher
levels of project activity are some of the oldest, most prominent, and frequently recurring
assertions in the scholarly and practitioner literature on open source software, and this
thesis reports empirical evidence supporting such assertions.
A second contribution is the conceptual framework for a vulnerability life cycle,
which opens up a new research program about shortening the time to find and fix
software vulnerabilities. This is complementary to the themes currently prominent in
software vulnerability research, including the factors impacting vulnerability introduction
and severity, policies for disclosing vulnerabilities, and the exploitation of vulnerabilities.
Furthermore, it capitalizes on the perceived strengths of open source software asserted by
practitioners (e.g., Free Software Foundation, 2014; Wheeler, 2015, section 2.4).
Likewise, examining factors at the project and community level is complementary to the
lower levels of analysis, such as files and code commits, that are more typical in the
vulnerability research reviewed in chapter 2. The author is aware of no prior studies that
_______________________________________________________________________________________________________________________________________________
Copyright © 2017 S. M. Monzur Murshed

Chapter 8: Discussion 111_______________________________________________________________________________________________________________________________________________
use software release dates to proxy for events in the lifecycle of a vulnerability.
A third contribution is the workflow and software scripts, which can be used and
extended by others to replicate these results, examine other variables in CVE Details and
Open Hub, expand the analysis to new variables harvested from other publicly-available
online sources, grow the sample to more projects, and test new hypotheses.
8.4 Contribution to practice
This thesis also makes at least two contributions to management practice. A first
contribution is the evidence supporting an association between higher commit density
and shorter software vulnerability exposure time. This association is of practical
importance to producers of open source software making decisions about governance and
community management, users and consumers of open source software deciding which
projects to support, and to security practitioners needing to secure and test systems that
consume open source software. It supports assertions in the practitioner literature, for
example by Perloth (2014), Sullivan (2014), Wheeler & Khakimov (2015), and Fogel
(2016), and in the scholarly research literature, for example by West & O’Mahony (2008)
and Schweik (2013), that associate high project activity with positive outcomes.
A second contribution is the recommendations for improving publicly-available
online sources provided in section 8.1. Online databases such Black Duck Open Hub,
CVE Details, and the National Vulnerability Database already provide value to their
target practitioner audiences. The recommendations provided here would increase the
value of these databases to researchers, thus benefiting practitioners both directly and
indirectly – directly through better data and more services that would also be available to
_______________________________________________________________________________________________________________________________________________
Copyright © 2017 S. M. Monzur Murshed

Chapter 8: Discussion 112_______________________________________________________________________________________________________________________________________________
practitioners, and indirectly through new knowledge and other outcomes of research.
Furthermore, we call upon all open source software projects to follow the
example of the Apache HTTP server project (examined in section 4.2) by providing
security reports at the project website that are informative, correct, and easily accessible,
including the earliest release affected, the discovery event when the developers found out
about the vulnerability, the disclosure event when the vulnerability was publicly
disclosed, and the first release in which the vulnerability was fixed.
8.5 Limitations
Like all research, this thesis has limitations. Three of the mortl significant are
described below.
First, without reliable data on vulnerability discovery events, there was no way to
statistically test some of the more interesting hypotheses about the time to discover a
vulnerability and the time to fix a vulnerability. The small sample results of section 7.2
demonstrated that the vulnerability discovery event can sometimes (but not consistently)
be pinpointed from a manual inspection of the reference documents of a CVE record, but
the human judgement required was beyond the capabilities of the automated data
collection techniques from Munzert et al. (2015) employed here to construct the full
sample data set, and thus outside the scope of this research.
Second, the quality of the qualitative results and hypothesis tests are limited by
the quality of the publicly-available data sets, which have known problems described in
chapter 3 and sections 7.2, 8.1, and 8.4. Section 8.1 and 8.4 provide the author’s
recommendations for improving the data sets.
_______________________________________________________________________________________________________________________________________________
Copyright © 2017 S. M. Monzur Murshed

Chapter 8: Discussion 113_______________________________________________________________________________________________________________________________________________
Third, statistical power is limited by sample size. With a larger data set of more
open source projects and more vulnerabilities, the same techniques may detect smaller
effect sizes. Furthermore, all projects examined here are in the same product category of
content management systems. There may be unknown or unacknowledged systemic
differences between CMS projects and other software project that limit the
generalizability of these results.
8.6 Future research
There are many opportunities for future research that builds on the results of this
thesis. Four of the most promising are described below.
First, there could be further analysis of the existing data set. Future work could
explore polynomial relationships and other model respecifications, employ more
sophisticated regression diagnostics, and do more to investigate unusual and influential
observations. There could be more work done to identify and characterize the best
transformations; for example, Fox (2016) recommends exploring logit transformations
(i.e., the natural logarithm of “odds”) and other transformation in the family of “folded
powers and roots” for proportions, which may be appropriate for the comment ratio
and/or code churn ratio explanatory variables. The purpose here was exploration and
testing hypotheses over a range of modelling assumptions, but future work could do more
to develop better estimators, perhaps using alternatives to ordinary least squares, such as
robust regression (Fox, 2016, ch. 19), or non-parametric regression (Fox, 2016, ch. 18).
Second, other researchers can reuse the data collection workflow and extend the
scripts to grow the data set and build new data sets. This thesis examined only a subset
_______________________________________________________________________________________________________________________________________________
Copyright © 2017 S. M. Monzur Murshed

Chapter 8: Discussion 114_______________________________________________________________________________________________________________________________________________
of the metrics available from Open Hub about open source software projects and
communities, focusing only on the hypotheses developed in chapter 5. Other available
metrics easily harvested from Open Hub include the age of the project (computed from
first commit and most recent commit), the cumulative man-months of effort, the
distribution licenses used, the programing languages used, and user ratings. Likewise,
this thesis examined only a subset of the vulnerability metrics available from CVE
Details, focusing only on the time to find and fix vulnerabilities. Other available metrics
easily harvested from CVE Details include weakness type (using either the CWE ID or
the CVE Details vulnerability type tags), the number of exploits, severity (using the
CVSS base score or lower-level CVSS metrics), or OVAL definitions. An exploratory
study, perhaps using data science techniques from “big data” problems and statistical
learning, could examine the full data set to induce new propositions for future
specification and testing. Many of the assertions from the scholarly and practitioner
literature reported in section 2.4 were not examined here, including architecture, use and
enforcement of secure coding practices, use testing tools, and the shared values held by
developers; each untested assertions is an opportunity for further study.
Third, more research is needed to extract and analyze additional data about
vulnerabilities. For example, a strong proxy for the discovery event would enable
researchers to distinguish between the time to discover a vulnerability and the time to fix
a vulnerability – some of the more interesting hypotheses developed in chapter 5, but
which were not testable here with the data available. Section 7.2 reported that some
information about vulnerability discover exists deep in the references of some CVE _______________________________________________________________________________________________________________________________________________
Copyright © 2017 S. M. Monzur Murshed

Chapter 8: Discussion 115_______________________________________________________________________________________________________________________________________________
records, but is not easily harvested using the techniques employed here (e.g., Munzert et
al. 2015). One promising approach is a traditional content analysis study to more fully
characterize which data are available from CVE records and how to extract them. A
second approach, building on insights from the first approach, is automated data
collection and analysis with data mining, machine learning, natural language processing,
and automated approaches to model selection using statistical learning (Hastie et al.
2009; Gareth et al. 2013). We urge researchers to share data sets with others, we urge
online sources to provide this information in an easy-to-consume way, and we urge
standards groups to incorporate more information about introduction, discovery, and
fixing of vulnerabilities into the standards for capturing and sharing security information.
Fourth, more research is needed on practical knowledge for practitioners. Future
research could more closely examine particular open source project field settings to get
closer to the phenomena of introducing, discovering, and fixing vulnerabilities, and the
actionable and prescriptive knowledge about making software more secure.
_______________________________________________________________________________________________________________________________________________
Copyright © 2017 S. M. Monzur Murshed

An investigation of software vulnerabilities in open source software projects using data from publicly-available sources Copyright © 2017 S. M. Monzur Murshed_______________________________________________________________________________________________________________________________________________
9 ConclusionUnderstanding the time taken to find and fix vulnerabilities in open source
software projects is of theoretical and practical importance, but is not well understood by
researchers or practitioners. This thesis examined, using data harvested from online
databases, the relationship between the project and community attributes of open source
software projects and the time taken to discover and fix vulnerabilities in the software.
The data set comprised 1268 vulnerabilities affecting the software produced by a sample
of 60 open source projects in the content management system (CMS) application area.
Results support an association between higher commit density (a measure of project
activity) and shorter vulnerability exposure time. This thesis reports on the extent to
which the data required to study vulnerabilities in open source software projects is
available through publicly-available sources, and provides a set of recommendations to
improve existing databases. It particular, it highlights the problems of getting good data
about vulnerability discovery – when and how the open source development community
learned about a vulnerability and could begin to work on a fix. Without a reliable proxy
for the discovery event, the techniques used here were unable to distinguish between the
time taken to discover a vulnerability and the time taken to fix a vulnerability, and could
examine only the total time of exposure between introduction and fix. The data
collection workflow and scripts will enable other researchers to replicate these results, to
repeat the analysis with an expanded or alternative data set, and to examine other
observable properties of projects and vulnerabilities.
_______________________________________________________________________________________________________________________________________________
116

An investigation of software vulnerabilities in open source software projects using data from publicly-available sources Copyright © 2017 S. M. Monzur Murshed_______________________________________________________________________________________________________________________________________________
10 ReferencesAnbalagan, P. 2011. A study of software security problem disclosure, correction and
patching processes. Unpublished doctoral dissertation, North Carolina State University, Raleigh, North Carolina, USA.
Arbaugh, A. A., Fithen, W. L., McHugh, J. 2000. Windows of vulnerability: A case study analysis. IEEE Computer, 33(12): 52-59.
Arjun, K. C. 2012. Key factors impacting on response time of software vendors in releasing patches for software vulnerabilities. Unpublished master dissertation, University of Southern Queensland, Queensland, Australia.
Arora, A., Telan, R. and Xu, H. 2008. Optimal policy for software vulnerability disclosure. Management Science, 54(4): 642-656.
August, T., & Tunca, T. I. 2011. Who should be responsible for software security? A comparative analysis of liability policies in network environments. Management Science, 57(5): 934-959.
Beattie, S., Arnold, S., Cowan, C., Wagle, P., & Wright, C. 2002. Timing the application of security patches for optimal uptime. Proceedings of The 16th USENIX Systems Administration Conference: 101 – 110.
Bever, L. 2014. Major bug called ‘Heartbleed’ exposes Internet data. The Washington Post, April 9. https://www.washingtonpost.com/news/morning-mix/wp/2014/04/09/major-bug-called-heartbleed-exposes-data-across-the-internet/
Bhattacharya, P., Ulanova, L., Neamtiu, I. & Koduru, S. C. 2013. An empirical analysis of bug reports and bug fixing in open source Android apps. Proceedings of the 17th European Conference on Software Maintenance and Reengineering: 133-143.
Black Duck Software. 2014. Ohloh API documentation. https://github.com/blackducksoftware/ohloh_api (accessed September 30 2016),
Bosu, A., Carver, J. C., Hafiz, M., Hilley, P. & Janni, D. 2014a. Identifying the characteristics of vulnerable code changes: an empirical study. Proceedings of the 22nd ACM SIGSOFT International Symposium on Foundations of Software Engineering (FSE 2014): 257-268. http://www.amiangshu.com/papers/Bosu-FSE-2014.pdf
_______________________________________________________________________________________________________________________________________________
117

Chapter 10: References 118_______________________________________________________________________________________________________________________________________________
Bosu, A., Carver, J. C., Hafiz, M., Hilley, P., & Janni, D. 2014b. When Are OSS Developers More Likely to Introduce Vulnerable Code Change? A Case Study. In Open Source Software: Mobile Open Source Technologies. Springer Berlin Heidelberg: 234-236.
Cavusoglu, H., Cavusoglu, H., & Raghunathan. 2007. Efficiency of vulnerability disclosure mechanisms to disseminate vulnerability knowledge. IEEE Transactions on Software Engineering, 33(3): 171-185.
CBC News. 2014. Heartbleed security bug: Canadian tax services back online. April 13. http://www.cbc.ca/news/business/heartbleed-security-bug-canadian-tax-services-back-online-1.2608781
CBC News. 2015. Heartbleed bug crisis hit more government computers than previously disclosed. December 9. http://www.cbc.ca/news/politics/heartbleed-bug-cyberattack-canada-government-departments-1.3355993
Cheswick, W. R., & Bellovin, S. M. 1994. Firewalls and Internet security: Repelling the wily hacker. Addison-Wesley.
Constantin, L. 2014. Think that software library is safe to use? Not so fast! IT World, December 30.http://www.itworld.com/article/2864095/think-that-software-library-is-safe-to-use-not-so-fast.html
Datta, S., Sarkar, P, Das, S., Sreshtha, S., Lade, P., and Majumder, S. 2014. How many eyeballs does a bug need? An empirical validation of Linus’ Law. Proceedings of the 15th International Conference on Agile Processes in Software Engineering and Extreme Programming (XP 2014), Rome, Italy, May 26-30, 2014: 242-250.
De Ru, W. G., & Eloff, J. H. P. 1996. Risk analysis modelling with the use of fuzzy logic, Computers & Security, 15(3): 239-48.
Degen-Portnoy, P. 2016. Open Hub in 2016. OpenHub Blog, April 15. http://blog.openhub.net/2016/04/open-hub-in-2016/
Duc, A. N., Cruzes, D. S., Ayala, C., & Conradi, R. 2011. Impact of stakeholder type and collaboration on issue resolution time in OSS projects. Open Source Systems: Grounding Research. IFIP Advances in Information and Communication Technology, 365: 1–16.
Ethiraj, S. K., Levinthal, D. 2004. Modularity and innovation in complex systems. Management Science, 50(2): 159-173.
Feng, Q., Kazman, R., Cai, Y., Mo, R., & Xiao, L. 2016. Towards an architecture-centric approach to security analysis. Proceedings of the 2016 Working IEEE/IFIP Conference on Software Architecture: 221-230.
_______________________________________________________________________________________________________________________________________________
Copyright © 2017 S. M. Monzur Murshed

Chapter 10: References 119_______________________________________________________________________________________________________________________________________________
Ferguson, N., Schneier, B., & Kohno, T. 2010. Cryptography Engineering: Design Principles and Practical Applications. Indianapolis, IN: Wiley.
Fogel, K. 2006. Producing open source software: How to run a successful free software project. Sebastopol, CA: O'Reilly.
Fogel, K. 2016. Producing open source software: How to run a successful free software project, 2nd edition (online). http://producingoss.com/ (accessed September 30 2016).
Foreman, P. 2009. Vulnerability management. Boca Ration, FL: Auerback Publications.
Fox, J., & Weisberg, H.S. 2011. An R companion to applied regression, Second edition. Thousand Oaks, CA: Sage Publications.
Fox, J. 2016. Applied regression analysis and generalized linear models, Third edition. Thousand Oaks, CA: Sage Publications.
Free Software Foundation statement on the GNU Bash “shellshock” vulnerability. September 25, 2014. https://www.fsf.org/news/free-software-foundation-statement-on-the-gnu-bash-shellshock-vulnerability
Frei, S. 2009. Security Econometrics The Dynamics of (In) Security. Unpublished doctoral dissertation, Eth zurich, ETH Zurich, Switzerland.
Frei, S., May, M., Fiedler, U., & Plattner, B. 2006. Large-scale vulnerability analysis. Proceedings of the 2006 SIGCOMM workshop on Large-scale attack defense: 131-138.
Frei, S., Schatzmann, D., Plattner, B., & Trammel, B. 2009. Modelling the security ecosystem – The dynamics of (in)security. Workshop on the Economics of Information Security (WEIS), London, UK.
Frost, J. 2012. How to interpret a regression model with low R-squared and low p values. The Minitab Blog, June 12. http://blog.minitab.com/blog/adventures-in-statistics-2/how-to-interpret-a-regression-model-with-low-r-squared-and-low-p-values
Gareth, J., Witten, D., Hastie, T., & Tibshirani, R. 2013. An introduction to statistical learning: With applications in R. New York, Springer.
Graves, T. L., Karr, A. F., Marron, J. S., & Siy, H. 2000. Predicting fault incidence using software change history. IEEE Transactions on Software Engineering, 26(7): 653-661.
_______________________________________________________________________________________________________________________________________________
Copyright © 2017 S. M. Monzur Murshed

Chapter 10: References 120_______________________________________________________________________________________________________________________________________________
Gegick, M., Williams, L., Osborne, J., & Vouk, M. 2008. Prioritizing software security fortification through code-level metrics. Proceedings of the Fourth ACM Workshop on Quality of Protection: 31-38.
Hastie, T., Tibshirani, R., & Friedman, J. 2009. The elements of statistical learning, 2nd edition. New York, Springer.
Hewlett Packard. 2013. Reducing security risks from open source software: Five steps to open source peace of mind. Technical white paper, 4AA0-8061ENW, October, Rev. 1.
Ioannidis, C., Pym, D., & Williams, J. 2012. Information security trade-offs and optimal patching policies. European Journal Of Operational Research, 216(2): 434-444.
Joh, H. 2011. Quantitative analyses of software vulnerabilities. Unpublished doctoral dissertation, Colorado State University, Fort Collins, Colorado, USA.
Jones, J. R. 2007. Estimating Software Vulnerabilities. IEEE Security & Privacy, 28-32. http://www.cs.colostate.edu/~malaiya/635/09/JonesEstimatingVulnerabilities.pdf
Kaner, C., Falk, J., & Nguyen, H. Q., 1999. Testing Computer Software. Wiley.
Kerner, S. M. 2015. Why all Linux (security) bugs aren't shallow: With Heartbleed and Shellshock, the open source community realized the Linus' law can be challenged. Esecurity Planet. February 20.http://www.esecurityplanet.com/open-source-security/why-all-linux-security-bugs-arent-shallow.html
Kim, P. 2014. The hacker playbook: Practical guide to penetration testing. North Charleston, SC: Secure Planet LLC.
Krsul, I. V. 1998. Software vulnerability analysis. Unpublished doctoral dissertation, Purdue University, West Lafayette, Indiana.
Lewis, N. 1988. Using binary schemas to model risk analysis. Proceedings of the 1988 Computer Security Risk Management Model Builders Workshop: 35-48.
Longley, D., & Shain, M. 1987. Data and computer security dictionary of standards, concepts, and teams. Stockton Press.
MacCormack, A., Verganti, R. & Iansiti, M. 2001. Developing products on “Internet Time”: The anatomy of a flexible development process. Management Science, 47: 133-150.
Marconato, G. V., Kaaniche, M. & Nicomette, V. 2013. A vulnerability life cycle-based security modeling and evaluation approach. The Computer Journal, 56(4): 422-439.
_______________________________________________________________________________________________________________________________________________
Copyright © 2017 S. M. Monzur Murshed
Chapter 10: References 121_______________________________________________________________________________________________________________________________________________
Massacci, F., & Nguyen, V. H. 2010. Which is the right source for vulnerability studies? An empirical analysis on Mozilla Firefox. MetriSec2010, September 15.https://www.researchgate.net/publication/44002373_Which_is_the_Right_Source_for_Vulnerability_Studies_An_Empirical_Analysis_on_Mozilla_Firefox
Mayerfeld, H. 1988. Definition and identification of assets as the basis for risk management. Proceedings of the 1988 Computer Security Risk Management Model Builders Workshop: 21-34.
McCabe, T.J. 1976. A complexity measure. IEEE Transactions on Software Engineering. 2(4): 308-320.
McGraw, G. 2006. Software security: Building security in. Upper Saddle River, NJ: Addison-Wesley.
Meneely, A., & Williams, L. 2009. Secure open source collaboration: An empirical study of Linus’ Law. Proceedings of the 16th ACM Conference on Computer and Communication Security: 453-462.
Meneely, A., & Williams, L. 2010. Strengthening the empirical analysis of the relationship between Linus’ Law and software security. Proceedings of the 2010 ACM-IEEE International Symposium on Empirical Software Engineering and Measurement (ESEM’10).
Meneely, A., Srinivasan, H., Musa, A., Rodriguez Tejeda, A., Mokary, M., & Spates, B. 2013. When a patch goes bad: Exploring the properties of vulnerability –contributing commits. Proceedings of the 23013 ACM/IEEE International Symposium on Empirical Software Engineering and Measurement: 65-74.
Meneely, A., Rodriguez Tejeda, A. C., Spates, B., Trudeau, S., Neuberger, D., Whitlock, K., Ketant, C., & Davis, K. 2014. An empirical investigation of socio-technical code review metrics and security vulnerabilities. Proceedings of the 6th International Workshop on Social Software Engineering: 37-44.
Merkow, M. S., & Raghavan, L. 2012. Secure and resilient software: Requirements, test cases, and testing methods. Boca Raton, FL: CRC Press.
Microsoft (no date). Definition of a security vulnerability. https://technet.microsoft.com/en-us/library/cc751383.aspx (accessed September 30 2016).
Mitra, S., & Ransbotham, S. 2015. Information disclosure and the diffusion of information security attacks. Information Systems Research, 26(3): 565-584.
_______________________________________________________________________________________________________________________________________________
Copyright © 2017 S. M. Monzur Murshed

Chapter 10: References 122_______________________________________________________________________________________________________________________________________________
MITRE Corporation. 2016a. Frequently asked questions (updated November 4 2016). Common vulnerabilities and exposures. https://cve.mitre.org/about/terminology.html (accessed December 1 2016).
MITRE Corporation. 2016b. Terminology (updated April 28 2016). Common vulnerabilities and exposures. https://cve.mitre.org/about/terminology.html (accessed September 30 2016).
MITRE Corporation. 2016c. About CVE (updated September 13 2016). Common vulnerabilities and exposures. https://cve.mitre.org/about/terminology.html (accessed December 1 2016).
MITRE Corporation. 2016d. About CVE (updated June 1 2016). CVE numbering authorities. https://cve.mitre.org/cve/cna.html (accessed June 1 2016).
Möller, B., Duong, T., Kotowicz, K. 2014. This POODLE bites: Exploiting the SSL 3.0 fallback, Security Advisory. https://www.openssl.org/~bodo/ssl-poodle.pdf
Mosteller, F., & Tukey, J. W. 1977. Data analysis and regression. Reading, MA: Addison-Wesley.
Muegge, S. 2013. Platforms, communities, and business ecosystems: Lessons learned about technology entrepreneurship in an interconnected world. Technology Innovation Management Review, February: 5-15.
Muegge, S. M. 2011. Institutions of participation: A nested case study of company participation in the Eclipse Foundation, community, and business ecosystem. Doctoral dissertation, Carleton University, Ottawa, CA.
Muegge, S., & Weiss, M. 2010. Open source software projects as opportunities for student learning and value creation. Proceedings of the International Conference on Education and New Learning Technologies (EDULEARN10), Barcelona, Spain, July 5-7.
Munzert, S., Rubba, C, MeiBner, P., & Nyhuis, D. 2015. Automated data collection with R: A practical guide to web scraping and text mining. Wiley.
Nagappan, N., & Ball, T. 2005. Use of Relative Code Churn Measures to Predict System Defect Density. Proceeding of the 27th International Conference on Software Engineering, May: 284-292.
Neuhaus, S., Zimmermann, T., Holler, C., & Zeller, A. 2007. Predicting Vulnerable Software Components. Proceedings of the 14th ACM Conference on Computer and Communications Security: 529-540.
_______________________________________________________________________________________________________________________________________________
Copyright © 2017 S. M. Monzur Murshed

Chapter 10: References 123_______________________________________________________________________________________________________________________________________________
Nizovtsev, D., & Thursby, M. 2007. To disclose or not? An analysis of software user behavior. Information Economics and Policy, 19: 43-64.
Okamura, H., Tokuzane, M., & Dohi, T. 2009. Optimal Security Patch Release Timing Under Non-Homogeneous Vulnerability-Discovery Process. Proceedings of the 20th International Symposium on Software Reliability Engineering: 120-128.
OWASP. 2016. Category: Vulnerability (updated June 6 2016). https://www.owasp.org/index.php/Category:Vulnerability (accessed September 30 2016).
Özkan, S. 2012. CVEdetails.com. BlackHat Europe 2012, Amsterdam, The Neatherlands, March 14-16. https://media.blackhat.com/bh-eu-12/Arsenal/bh-eu-12-Ozkan-cvedetails.com.pdf
Ozment, A. 2007. Improving Vulnerability Discovery Models. QoP'07: Proceeding of the 2007 ACM workshop on Quality of protection: 6-11.
Perlroth, N. 2014a, Heartbleed highlights a contradiction in the web. The New York Times, April 18.http://www.nytimes.com/2014/04/19/technology/heartbleed-highlights-a-contradiction-in-the-web.html
Perlroth, N. 2014b, Security experts expect ‘Shellshock’ software bug in Bash to be significant. The New York Times, September 25.https://www.nytimes.com/2014/09/26/technology/security-experts-expect-shellshock-software-bug-to-be-significant.html
Pfleeger, C. P., Pfleeger, S. L., & Margulies. 2015. Security in Computing, Fifth edition. Prentice-Hall.
Plate, H., Ponta, S. E., & Sabetta, A. 2015. Impact assessment for vulnerabilities in open-source software libraries, SAP Labs, France.http://arxiv.org/pdf/1504.04971v2.pdf
R Core Team. 2016. R: A language and environment for statistical computing, Version 3.3.2 (2016-10-31). Vienna, Austria: R Foundation for Statistical Computing. https://cran.r-project.org/doc/manuals/fullrefman.pdf
Ransbotham, S., Mitra, S., & Ramsey, J. 2012. Are markets for vulnerabilities effective? MIS Quarterly, 36(1): 43-64.
Raymond, E. S. 1999. The cathedral and the bazaar: Musings on Linux and Open Source by an accidental revolutionary. Cambridge, MA: O’Reilly.
Rescorla, E. 2005. Is finding security holes a good idea? IEEE Security & Privacy, 3(1): 14-19.
_______________________________________________________________________________________________________________________________________________
Copyright © 2017 S. M. Monzur Murshed
Chapter 10: References 124_______________________________________________________________________________________________________________________________________________
Rahimi, S., & Zargham, M. 2013. Vulnerability scrying method for software vulnerability discovery prediction without a vulnerability database. IEEE Transactions on Reliability, 62(2): 395-407.
Ransbotham, S. 2010. An empirical analysis of exploitation attempts based on vulnerabilities in open source software. Workshop on the economics of Information security: 1-25.
Roumani, Y. 2012. Predicting vulnerability risks using software characteristics. Unpublished doctoral dissertation, Kent State University, Kent, Ohio, United State.
Sargut, G., & McGrath, R. G. 2011. Learning to live with complexity. Harvard Business Review. September: 69-76.
Schiffman, M. 2007. A complete Guide to the Common Vulnerability Scoring System (CVSS). http://www.first.org/cvss/cvss-guide.html (accessed September 30 2016).
Schneier, B. 2000. Full disclosure and the window of exposure. Crypto-Gram, September 15. https://www.schneier.com/crypto-gram/archives/2000/0915.html
Schneier, B. 2003. Beyond fear: Thinking sensibly about security in an uncertain world. Springer-Verlag.
Schweik, C. M. 2013. Sustainability in open source software commons: Lessons learned from an empirical study of SourceForge projects. Technology Innovation Management Review, 3(1): 13-19. http://timreview.ca/article/645
Schryen, G. 2011. Is open source security a myth? Communications of the ACM, 54(5): 130-140.
Schryen, G., & Rich, E. 2010. Increasing software security through open source or closed source development? Empirics suggest that we have asked the wrong question. Proceedings of the 43rd International Conference on System Sciences.
Schmidt, A. 2012. At the boundaries of peer production: The organization of Internet security production in the cases of Estonia 2007 and Conficker. Telecommunications Policies, 36: 451-461.
Schultz, C. 2012. Information security trends and issues in the Moodle E-learning platform: An ethnographic content analysis. Journal of Information Systems Education, 23(4): 359-371.
Schultz, E.E. Jr., Brown, D.S. & Longstaff, T.A. 1990. Responding to Computer Security Incidents. Livermore, CA: Lawrence Livermore National Laboratory.
_______________________________________________________________________________________________________________________________________________
Copyright © 2017 S. M. Monzur Murshed
Chapter 10: References 125_______________________________________________________________________________________________________________________________________________
Shahazad, M., Shafiq, M. Z. & Liu, A. X. 2012. A large scale exploratory analysis of software vulnerability life cycles. Proceedings of the International Conference on Software Engineering, 34: 771-781.
Shin, Y., & Williams, L. 2008a. Is complexity really the enemy of software security? Proceedings of the Fourth ACM Workshop on Quality of Protection: 47-50.
Shin, Y., & Williams, L. 2008b. An empirical model to predict security vulnerabilities using code complexity metrics. Proceedings of the International Symposium on Empirical Software Engineering and Measurement: 315-317.
Shin, Y., Meneely, A., & Williams, L. 2011. Evaluating complexity, code churn, and developer activity metrics as indicators of software vulnerabilities. IEEE Transactions on Software Engineering, 37(6): 772-787.
Shrivastava, A. K., Sharma, R., & Kapur, P. K. 2015. Vulnerability Discovery Model for a Software System Using Stochastic Differential Equation. Proceeding of the International Conference on Futuristic trend in Computational Analysis and Knowledge Management: 199-205.
Snow, D. 1988. A general model for the risk management of ADP systems. Proceedings of the 1988 Computer Security Risk Management Model Builders Workshop: 145-162.
Stallman, R. 1996. Free software definition. In J. Gay (ed.), 2002, Free software free society: Selected essays of Richard M. Stallman. Boston, MA: Soho Books, pp. 43-45.
Sullivan, J. 2014. Free software needs your vote. Free Software Foundation Bulletin, 25(November): 1-3.
Symantec Corporation. 2016. 2016 Internet Security Threat Report, Volume 21 (April). https://www.symantec.com/security-center/threat-report
Vache, G. 2009. Environment Characterization and System Modeling Approach for the Quantitative Evaluation of Security. Proceedings of the International Conference on Computer Safety, Reliability and Security, Hamburg, Germany, Springer, Lecture Notes in Computer Science 5775, pp. 89-102.
Vache, G. 2009. Vulnerability Analysis for a Quantitative Security Evaluation. Proceeding of the International Symposium on Empirical Software Engineering and Management, 15-16 October 2009, Lake Buena Vista, Florida, pp. 526-534. IEEE Computer Society.
Vasek, M., Wadleigh, J., & Moore, T. 2016. Hacking is not random: A case-control study of webserver-compromise risk. IEEE Transactions on Dependable and Secure Computing, 13(2): 206-219.
_______________________________________________________________________________________________________________________________________________
Copyright © 2017 S. M. Monzur Murshed

Chapter 10: References 126_______________________________________________________________________________________________________________________________________________
Verizon. 2016. Verizon 2016 Data Breach Investigations Report. http://verizonenterprise.com/verizon-insights-lab/dbir/2016/
Walden, J., Doyle, M., Welch, G.A., & Whelan, M. 2009. Security of open source web applications. Proceedings of the International Workshop on Security Measurements and Metrics: 545 – 553.
Walden, J., Doyle, M., Lenhof, R., Murray, J., & Plunkett, A. 2010. Impact of plugins on the security of web applications. MetriSec2010, September 15, Bolzano-Bozen, Italy.
Wang, J. A., Guo, M., Wang, H., Xia, M., & Zhou, L. 2009. Environmental metrics for software security based on a vulnerability ontology. Proceedings of the Third IEEE International Conference on Secure Software Integration and Reliability Improvement: 159 – 168.
West, J. & O’Mahony, S. 2008. The role of participation architecture in growing sponsored open source communities. Industry and Innovation, 15(2): 145-168.
Weiss, M., & Bailetti, T. 2015. Value of open source projects: a case for open source cybersecurity, ICE/IEEE International Technology Management Conference. http://www.sce.carleton.ca/faculty/weiss/papers/2015/weiss-ice-2015.pdf
Wilcox, L. 2016. Project security. OpenHub Blog, October 4. http://blog.openhub.net/2016/10/project-security/
Williams, J., & Dabirsiaghi, A. 2012. The unfortunate reality of insecure libraries. Aspect Security.http://www.aspectsecurity.com/research-presentations/the-unfortunate-reality-of-insecure-libraries
Wheeler, D. A., & Khakimov, S. 2015. Open Source Software Projects Needing Security Investments. Institute For Defense Analyses, IDA Document D-5459, v.1.0 (June 19). https://www.coreinfrastructure.org/sites/cii/files/pages/files/pub_ida_lf_cii_070915.pdf
Zetter, K. 2014. There is a new vulnerability named POODLE, and it’s not cute. Wired, October 14. https://www.wired.com/2014/10/poodle-explained/
_______________________________________________________________________________________________________________________________________________
Copyright © 2017 S. M. Monzur Murshed

Chapter 10: References 127_______________________________________________________________________________________________________________________________________________
10.1 Websites
Apache HTTP Server Project. https://httpd.apache.org/ An open source software project within the Apache Software Foundation (ASF).
Black Duck Open Hub. https://www.openhub.net/ A database of open source software projects, maintained by Black Duck Software.
Black Duck Software. https://www.blackducksoftware.com/Maintains Black Duck Open Hub.
Center for Internet Security. https://www.cisecurity.org/ Maintains the OVAL standard.
CVE Details. https://www.cvedetails.com/ A database of software vulnerabilities that aggregates data from other sources.
CVE List. https://cve.mitre.org/cve/cve.htmlThe master copy of CVE records, maintained by MITRE Corporation.
Common Platform Enumeration (CPE). https://nvd.nist.gov/cpe.cfmThe CPE standard and official dictionary is maintained within the NIST National Vulnerability Database.
Common Vulnerabilities and Exposures (CVE). https://cve.mitre.org/ The CVE standard, maintained by MITRE Corporation.
Common Vulnerability Scoring System (CVSS). https://www.first.org/cvssThe CVSS standard for severity scoring, maintained by the Forum of Incident Response and Security Teams (FIRST).
Common Weakness Enumeration (CWE). https://cwe.mitre.org/ The CWE standard for classifying vulnerabilities, maintained by MITRE Corporation.
Forum of Incident Response and Security Teams (FIRST). https://www.first.org/ Maintains the CVSS standard.
Free Software Definition (FSD). https://www.gnu.org/philosophy/free-sw.htmlMaintained by the Free Software Foundation (FSF).
Free Software Foundation (FSF). https://fsf.org/ Maintains the Free Software Definition and certifies license compliance.
Industry Consortium for Advancement of Security on the Internet (ICASI). http://www.icasi.org/ Maintains the CVRF standard for vulnerability reports.
_______________________________________________________________________________________________________________________________________________
Copyright © 2017 S. M. Monzur Murshed

Chapter 10: References 128_______________________________________________________________________________________________________________________________________________
IT Security Database. http://www.itsecdb.com/A database of OVAL definitions for software vulnerabilities.
Metasploit. https://www.metasploit.com/ An open source software project for penetration testing, including automated exploits of known software vulnerabilities, maintained by Rapid7.
MITRE Corporation. https://www.mitre.org/ Maintains the CVE List, and the CVE, CWE, and OVAL standards.
National Institute of Standards and Technology (NIST). https://www.nist.gov/ Maintains the National Vulnerability Database.
National Vulnerability Database (NVD). https://nvd.nist.gov/ The U.S. government repository of standards based vulnerability management data (including CVE records and the CPE standard and dictionary), maintained by the U.S. National Institute of Standards and Technology (NIST).
The Exploit Database. https://www.offensive-security.com/community-projects/the-exploit-database/A database of Metasploit exploit modules, maintained by Offensive Security.
Open Hub. See Black Duck Open Hub.
Open Source Definition (OSD). https://opensource.org/osdMaintained by the Open Source Initiative (OSI).
Open Source Initiative (OSI). https://opensource.org/Maintains the Open Source Definition (OSD) and certifies license compliance.
Open Vulnerability and Assessment Language (OVAL). https://oval.mitre.org/Maintained by MITRE Corporation.
R Project for Statistical Computing. https://www.r-project.org/ Software used in this research for data collection scripts and statistical analysis.
Rapid7. https://www.rapid7.com/Maintains the Vulnerability & Exploit Database.
RStudio. https://www.rstudio.com/ An integrated development environment (IDE) for the R programming language.
SourceForge. https://sourceforge.net/A popular forge providing hosting services for open source software projects.
Vulnerability & Exploit Database. https://www.rapid7.com/db/A database of vulnerability exploits, maintained by Rapid7.
_______________________________________________________________________________________________________________________________________________
Copyright © 2017 S. M. Monzur Murshed

An investigation of software vulnerabilities in open source software projects using data from publicly-available sources Copyright © 2017 S. M. Monzur Murshed_______________________________________________________________________________________________________________________________________________
11 Appendix A: Data collection workflowThis appendix explains the data collection workflow and scripts.
The style conventions are those recommended by Fox & Weisberg (2011, pp. xxi-
xxii), which are similar to the style conventions used elsewhere in technical writing about
R, Python, and other software documents (e.g., Munzert, 2015).
• Menus, menu items, and the names of windows are set in an italic serif font.
• The names of R packages and Python modules are in boldface.
• Input and output are printed in monospaced (typewriter) fonts, as they
appear on the computer screen, with output edited for brevity and clarity. Input is
distinguished from output by the presence of prompts:
◦ R input begins with a > prompt. The > prompt at the beginning of the input
and the + prompt which begins continuation lines are proved by R, not typed
the user.
◦ Python input begins with a >>> prompt. The >>> prompt at the beginning of
the input and the ... prompt which begins continuation lines are provided by
Python, not typed by the user.
Figure 17 illustrates the eight steps of the data collection workflow.
_______________________________________________________________________________________________________________________________________________
129

Copyright © 2017 S. M. Monzur Murshed Chapter 11: Appendix A: Data collection workflow_______________________________________________________________________________________________________________________________________________________________________________________________________________________
_______________________________________________________________________________________________________________________________________________________________________________________________________________________
130
Figure 17: Data collection workflow

Appendix A: Data collection workflow 131_______________________________________________________________________________________________________________________________________________
11.1 Step 0: Set-up
• Download and install R: https://www.r-project.org/
• Install the required R packages by typing the following commands in the Rgui window:
> install.packages(“XML”) > install.packages(“car”)> install.packages(“zoo”)> install.packages(“plyr”)> install.packages(“stringr”)
• Download and install Python: https://www.python.org/downloads/ (This theses used Python 3.5.1 for Mac OS X).
11.2 Step 1: Get project data from CVE Details
This step downloads HTML files from the CVE Details website and saves them to a local
directory.
• Type the following command into the Rgui window:
> source("RunAllProjects_Download.R")
11.3 Step 2: Parse HTLM files
This step parses the HTML files from the previous step and writes a comma separated
value (CSV) file.
• Type the following command into the Rgui window:
> source("RunAllProjects_HTMLtoCSV.R")
11.4 Step 3: Manual operation
This manual step adds dates for the introduction event and the fix event.
• Open the file from step 2 using LibreOffice. (Do not use Microsoft Excel. Excel will reformat dates in ways that cause problems later when using R)
• In a web browser, navigate to the CVE Details website: www.cvedetails.com
• Go to the product search option and type a project name (e.g., “Drupal”) and _______________________________________________________________________________________________________________________________________________
Copyright © 2017 S. M. Monzur Murshed

Appendix A: Data collection workflow 132_______________________________________________________________________________________________________________________________________________
search on it
• A new window will open displaying a list of products matching the query
• Click the link of the selected project and click the link of vulnerabilities from its vulnerability statistics
• Click the link of CVE ID as listed in the project vulnerability pages
• Select the version number of the first affected version of the CVE ID from “products affected by the CVE” and copy it (CTRL-C)
• Paste (CTRL-V) the version number of the first affected version in the field of “Fst_Intro_Ver” in the same row of a CVE ID
• Find a release date for this version from various sources, such as the project website or blog, github, or Open Hub. Copy and paste or manually type the release date into the field “Introduction_Date” in the same row of the CVE ID
• Identify the version number of the first fixed version from various sources, such as the project website, or by examining the references of the CVE ID. This information is normally in the public announcement or security bulletin. Copy and paste or type the version number in the field of “1st_Fix_Ver” in the same row of the CVE ID
• Find a release date for the first fixed version from various sources, such as the project website or blog, github or Open Hub. Copy and paste or manually type the release date into the field “Fix_Date” in the same row of a the CVE ID
• Save the file as “projectnamecsv.csv” (e.g., drupalcsv.csv) in the “60CVEDetailsProject20161016” directory.
11.5 Step 4: Join project files
This step joins the project files from the previous step into one dataframe and outputs a
CSV file “Total_DV_Projects20161024.csv” in the directory “DV”.
• Type the following command into the Rgui window:
> source(“AllProjectsCVE.R”)
11.6 Step 5: Get project data from Open Hub
This step executes a set of Python scripts to download project XML files from Open Hub _______________________________________________________________________________________________________________________________________________
Copyright © 2017 S. M. Monzur Murshed
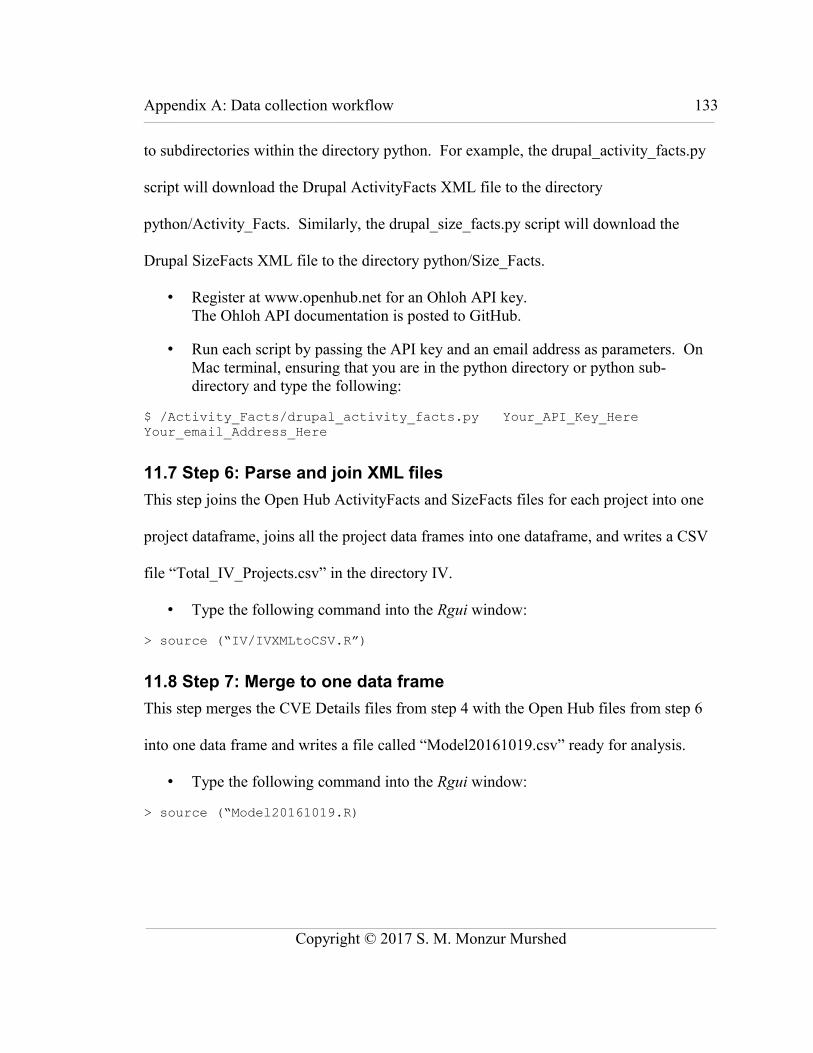
Appendix A: Data collection workflow 133_______________________________________________________________________________________________________________________________________________
to subdirectories within the directory python. For example, the drupal_activity_facts.py
script will download the Drupal ActivityFacts XML file to the directory
python/Activity_Facts. Similarly, the drupal_size_facts.py script will download the
Drupal SizeFacts XML file to the directory python/Size_Facts.
• Register at www.openhub.net for an Ohloh API key. The Ohloh API documentation is posted to GitHub.
• Run each script by passing the API key and an email address as parameters. On Mac terminal, ensuring that you are in the python directory or python sub-directory and type the following:
$ /Activity_Facts/drupal_activity_facts.py Your_API_Key_Here Your_email_Address_Here
11.7 Step 6: Parse and join XML files
This step joins the Open Hub ActivityFacts and SizeFacts files for each project into one
project dataframe, joins all the project data frames into one dataframe, and writes a CSV
file “Total_IV_Projects.csv” in the directory IV.
• Type the following command into the Rgui window:
> source (“IV/IVXMLtoCSV.R”)
11.8 Step 7: Merge to one data frame
This step merges the CVE Details files from step 4 with the Open Hub files from step 6
into one data frame and writes a file called “Model20161019.csv” ready for analysis.
• Type the following command into the Rgui window:
> source (“Model20161019.R)
_______________________________________________________________________________________________________________________________________________
Copyright © 2017 S. M. Monzur Murshed

Appendix B: Data collection scripts 134_______________________________________________________________________________________________________________________________________________
12 Appendix B: Data collection scriptsThis appendix provides the source code for some scripts that were previously
documented in Appendix A.
The scripts called in Appendix A for step 1 (RunAllProjects_Download.R),
step 2 (RunAllProjects_HTMLtoCSV.R), and step 4 (AllProjectsCVE.R) each call a
set of lower-level scripts, one script for each project in the project sample. The scripts
provided below for step 1, step 2, and step 4 are the lower-level scripts for the Drupal
project, provided as examples.
12.1 Step 1: drupal_download.R## Clear consolerm(list=ls(all=TRUE))
## This script want to download HTML files that contain DRUPAL security ## vulnerability according to the following years.years<- c("year-2002", "year-2005", "year-2006", "year-2007", "year-2008", "year-2009", "year-2010", "year-2011", “year-2012", "year-2013", "year-2014", "year-2015", "year-2016")
## The data are stored in a url link where the "year-2002" data is at ## http://www.cvedetails.com/vulnerability-list/## vendor_id-1367/product_id-2387/year-2002/Drupal-Drupal.html and so on## The urls that this thesis need are thereforeurls <- sprintf("http://www.cvedetails.com/vulnerability-list/vendor_id-1367/product_id-2387/%s.html", years)
## Function to download a file either it exist or not in the directorydownload.Drupal <- function(url, refetch = FALSE, path = ".") { dest <- file.path(path, basename(url)) download.file(url, dest) dest}## Declare Path, create directory & run all urlspath <- "Drupal"directory <- dir.create(path, showWarnings = FALSE)files <- sapply(urls, download.Drupal, path=path)
_______________________________________________________________________________________________________________________________________________
Copyright © 2017 S. M. Monzur Murshed
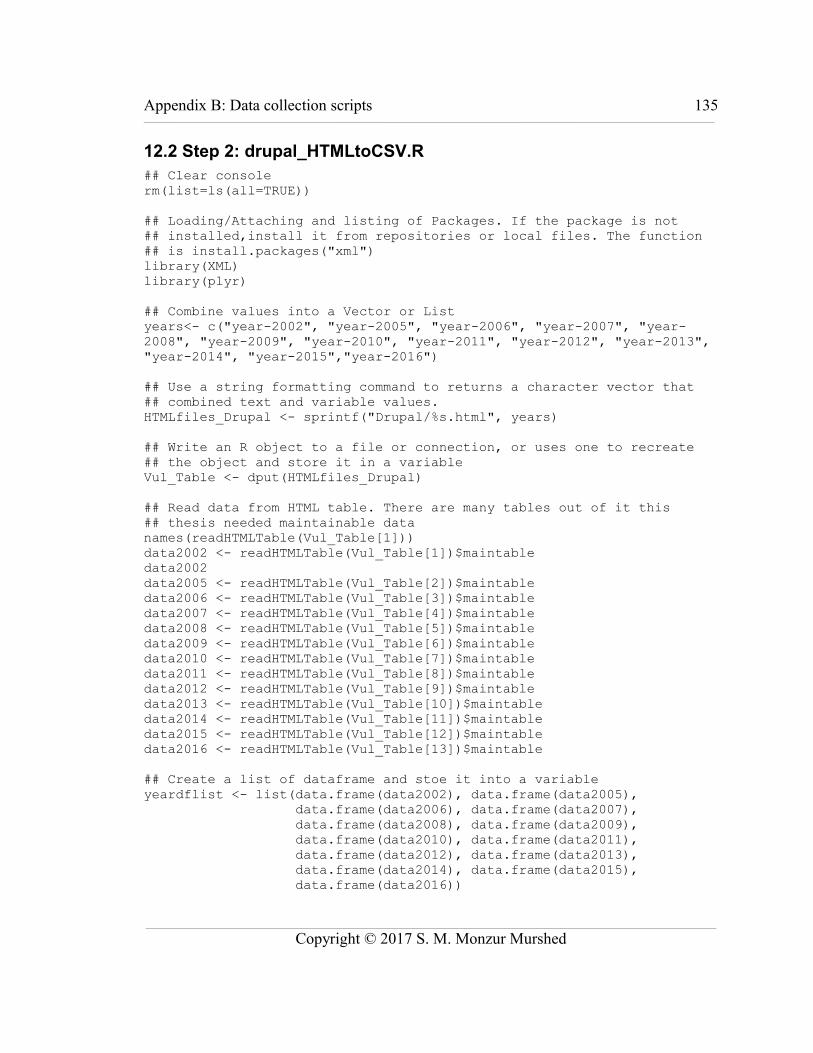
Appendix B: Data collection scripts 135_______________________________________________________________________________________________________________________________________________
12.2 Step 2: drupal_HTMLtoCSV.R## Clear consolerm(list=ls(all=TRUE))
## Loading/Attaching and listing of Packages. If the package is not ## installed,install it from repositories or local files. The function## is install.packages("xml")library(XML)library(plyr)
## Combine values into a Vector or Listyears<- c("year-2002", "year-2005", "year-2006", "year-2007", "year-2008", "year-2009", "year-2010", "year-2011", "year-2012", "year-2013", "year-2014", "year-2015","year-2016") ## Use a string formatting command to returns a character vector that ## combined text and variable values.HTMLfiles_Drupal <- sprintf("Drupal/%s.html", years)
## Write an R object to a file or connection, or uses one to recreate ## the object and store it in a variableVul_Table <- dput(HTMLfiles_Drupal)
## Read data from HTML table. There are many tables out of it this ## thesis needed maintainable datanames(readHTMLTable(Vul_Table[1]))data2002 <- readHTMLTable(Vul_Table[1])$maintabledata2002data2005 <- readHTMLTable(Vul_Table[2])$maintabledata2006 <- readHTMLTable(Vul_Table[3])$maintabledata2007 <- readHTMLTable(Vul_Table[4])$maintabledata2008 <- readHTMLTable(Vul_Table[5])$maintabledata2009 <- readHTMLTable(Vul_Table[6])$maintabledata2010 <- readHTMLTable(Vul_Table[7])$maintabledata2011 <- readHTMLTable(Vul_Table[8])$maintabledata2012 <- readHTMLTable(Vul_Table[9])$maintabledata2013 <- readHTMLTable(Vul_Table[10])$maintabledata2014 <- readHTMLTable(Vul_Table[11])$maintabledata2015 <- readHTMLTable(Vul_Table[12])$maintabledata2016 <- readHTMLTable(Vul_Table[13])$maintable
## Create a list of dataframe and stoe it into a variableyeardflist <- list(data.frame(data2002), data.frame(data2005),
data.frame(data2006), data.frame(data2007), data.frame(data2008), data.frame(data2009),
data.frame(data2010), data.frame(data2011), data.frame(data2012), data.frame(data2013), data.frame(data2014), data.frame(data2015), data.frame(data2016))
_______________________________________________________________________________________________________________________________________________
Copyright © 2017 S. M. Monzur Murshed

Appendix B: Data collection scripts 136_______________________________________________________________________________________________________________________________________________
## Join a list of dataframedata1 <- join_all(yeardflist, by=NULL, type = "full", match = "first")
## Keep the desired columnsdata1 <- data1[,c(2,6,7)]
## Rename the columnscolnames(data1) <- c("CVEID", "Publish_Date", "Update_Date")
## Omit the NA rows data2 <- na.omit(data1)
## Remove 1st rowsdata2 <- data2[-c(1),]
## Reorder the rows rownames(data2) <- 1:nrow(data2)
## Add a column of a project name in the dataframeProject_Name <- cbind("drupal")Project_Drupal <- cbind(Project_Name, data2)
## Add Blank columns for adding data at step 3 manually Project_Drupal[c("Introduction_Date", "First_Intro_Ver", "First_Fix_Ver", "Fix_Date")] <- ""head(Project_Drupal, 6)
## Write a CSV filewrite.csv(Project_Drupal, file = 'Cvedetails_Projects/drupal.csv', sep = '\t', col.names = T, row.names = T)
12.3 Step 4: drupal_HTMLtoCSV.R## Clear consolerm(list=ls(all=TRUE))
## This is assumes that these CSV files in a single directory ## "AllCVEDetailsProjects20161023" and that all of them have the lower-## case extension .csv. It is very important to include the option ## (full.names = TRUE). If it is not included then you will get the ## error something like "Error in file(file, "rt") : cannot open the ## connection In addition: Warning message: In file(file, "rt") : ## cannot open file 'FAWN_2002.csv': No such file or directoryfile_names <- list.files(path = "~/AllCVEDetailsProjects20161023", pattern = ".csv", full.names = TRUE)file_names
## Read CSV file & transform into dataframe & join all dataframe into ## one dataframe DVAll_Project_Data <- do.call("rbind", lapply(file_names, read.csv, header = TRUE, as.is = TRUE))_______________________________________________________________________________________________________________________________________________
Copyright © 2017 S. M. Monzur Murshed

Appendix B: Data collection scripts 137_______________________________________________________________________________________________________________________________________________
## Write a CSV filewrite.csv(DVAll_Project_Data, file = 'DV/Total_DV_Projects20161024.csv', sep = '\t', col.names = T, row.names = T)
## Select first 6 rows of a dataframe head (DVAll_Project_Data, 6)
12.4 Step 5: drupal_activity_facts.py#usr/bin/python indicate the path to the interpreter binary #that will be used to interpret the rest of the commands in #the file. It is usually the first line of a script.#!/usr/bin/python#Import 3 modules sys, urllib and hashlibimport sys, urllib, hashlib# Import ElementTree module for parsing and creating XML datatry:
import elementtree.ElementTree as ETexcept ImportError:
import xml.etree.ElementTree as ET# hashlib.md5() to pass the hash value from updated email address at# terminalemail = hashlib.md5()email.update(sys.argv[2])
# Connect to the www.openhub.net website and retrieve the project activity ## facts datakey = urllib.urlencode({'api_key': sys.argv[1]})url = "https://www.openhub.net/projects/drupal/analyses/latest/
activity_facts.xml?%s"%(key)f = urllib.urlopen(url)
#Parse the response into a structured XML objecttree = ET.parse(f)
#If error a message will show and exit operationelem = tree.getroot()error = elem.find("error")if error != None: print 'openhub returned:', ET.tostring(error), sys.exit()"""for node in elem.findall("result/activity_fact/"): print node.tag, node.text"""for node in elem.findall("result/activity_fact/"): print "%s:\t%s" % (node.tag, node.text)tree.write(open('Activity_Facts/PAF_drupal.xml','w'))
_______________________________________________________________________________________________________________________________________________
Copyright © 2017 S. M. Monzur Murshed