an investigation of metal concentrations in waste rock ... · pdf filebenthic...
TRANSCRIPT

An Investigation of Metal Concentrations in Waste Rock Piles, Stream Water, Benthic Macroinvertebrates, and Stream Bed Sediments to Assess Long-term Impacts of Intermittent Precipitation Events in the Lefthand Creek Watershed,
Northwestern Boulder County, CO.
By Susan Marie Bautts
B.S., University of Colorado at Boulder, 2003
A thesis submitted to the Faculty of the Graduate School of the University of Colorado
in partial fulfillment of the requirements for the degree of Master of Science Department of Civil Engineering
2006

This thesis entitled:
An Investigation of Metal Concentrations in Waste Rock Piles, Stream Water, Benthic Macroinvertebrates, and Stream Bed Sediments to Assess Long-term Impacts of Intermittent Precipitation Events in the Lefthand Creek Watershed,
Northwestern Boulder County, CO.
written by Susan Marie Bautts has been approved for the Department of Civil Engineering
____ ________ _____ Dr. Joseph N. Ryan
________________________________________Dr. Diane McKnight
___ _______ ____ Dr. JoAnn Silverstein
Date_______________
The final copy of this thesis has been examined by the signatories, and we find that both the content and the form meet acceptable presentation
standards of scholarly work in the above mentioned discipline.

Abstract
Bautts, Susan Marie (M.S., Department of Civil Engineering)
An Investigation of Metal Concentrations in Waste Rock Piles, Stream Water, Benthic Macroinvertebrates, and Stream Bed Sediments to Assess Long-term Impacts of Intermittent Precipitation Events in the Lefthand Creek Watershed, Northwestern Boulder County, CO.
Thesis directed by Professor Joseph N. Ryan
Previous studies conducted by researchers and regulators have examined
the sources of metal toxicity from inactive mine sites in the Lefthand Creek
watershed. To date, there have been no studies conducted to assess the
effects of rain storms and rapid snow melt on stream water quality. A study of
metal concentrations in waste rock piles, in the stream water, in streambed
sediments, and in benthic macroinvertebrates was conducted in areas near
metal sources in the Lefthand, James, and Little James Creeks. It was
hypothesized that correlations exist between metal concentrations in
sediments, benthic macroinvertebrates, and waste rock piles. We expected
that zinc, copper, and lead would follow the patterns of speciation observed in
other streams and soils. In stream water, we expected zinc to be mostly
dissolved, lead mostly bound to colloids, and copper in both fractions.
Prioritizations were made for remediation based on benthic macroinvertebrate
and sediment metal concentrations.
iii

Dedication
This work is dedicated to my husband, David Bautts, for his inspiration, kind
heart and unconditional support and love.

Acknowledgements
Funding for this project was provided by Region VIII of the Environmental
Protection Agency and the Colorado Department of Public Health and the
Environment. I would like to thank all those at the EPA and the University of
Colorado’s Laboratory for Environmental and Geological Studies, for their
expert advice and laboratory analysis. This project could not have been
completed without funding provided through EPA regional grants. I would like
to thank my committee members; Diane McKnight, Joe Ryan, and Joann
Silverstein for their advising and review of this document. Thanks especially
to Joe, for his encouragement and helpful reviews. Special thanks to Isabelle
Lheritier for all of her hard work and companionship in the field. It would have
taken so much longer without you. In addition, I would like to thank Dave,
Rowen and Myles Bautts, Tim Dittrich, Joe Ryan, Brianna Shanklin and Ned
Turner for the long hours of help in the field. To all my friends and family,
thank you for your support and distractions over the past year. You’ve made
it worth it.
v

TABLE OF CONTENTS
Introduction .......................................................................................................... 1
Fate and transport of metals ................................................................................ 5
Bioavailability of Metals........................................................................................ 7
Objectives ............................................................................................................ 9
Materials and Methods....................................................................................... 13
Field research area ............................................................................................ 13
Stream water, benthic macroinvertebrate, and streambed sediment sampling
sites.................................................................................................................... 19
Stream water sampling and analysis.................................................................. 23
Water quality parameters ................................................................................... 26
Water hardness and standards .......................................................................... 26
Benthic macroinvertebrate sampling and analysis ............................................. 28
Sediment sampling and analysis........................................................................ 30
Characterization of Waste Rock Piles ................................................................ 32
Water quality measurements – pH, temperature, and specific conductance...... 35
Dissolved Organic Carbon ................................................................................. 38
Hardness and standards .................................................................................... 41
Stream water iron............................................................................................... 44
Stream water zinc, copper, and lead concentrations.......................................... 47
Lefthand Creek water –zinc, copper, and lead concentrations........................... 48
James Creek water – zinc, copper, and lead concentrations ............................. 49
Little James Creek water – zinc, copper, and lead concentrations..................... 51
vi

Benthic macroinvertebrate metal concentrations ............................................... 53
Lefthand Creek benthic macroinvertebrates – zinc, copper, and lead................ 55
James Creek benthic macroinvertebrate – zinc, copper, and lead..................... 57
Little James Creek benthic macroinvertebrates – zinc, copper, and lead .......... 59
Streambed sediment investigations ................................................................... 62
Effects of mass on partial digestion efficiency.................................................... 63
Reproducibility of sediment methods using field and lab replicates ................... 65
Lefthand Creek streambed sediments – zinc, copper, and lead......................... 67
James Creek streambed sediments – zinc, copper, and lead............................ 69
Little James Creek streambed sediments – zinc, copper, and lead ................... 70
Streambed sediments – <63 um grain size percentages ................................... 72
Waste rock piles................................................................................................. 75
Waste rock pile sediment metals........................................................................ 75
Waste rock pile elutriation concentrations.......................................................... 77
Discussion.......................................................................................................... 79
Copper, zinc, and lead concentrations in stream water, benthic
macroinvertebrates, and sediments ................................................................... 81
Zinc, copper, and lead inputs from waste rock piles........................................... 88
White Raven waste rock pile .............................................................................. 94
Slide Mine waste rock pile.................................................................................. 96
Metal distribution between water, colloids, and sediments................................. 97
Colloidal metals and Kint ..................................................................................... 99
Colloidal metals and hardness ......................................................................... 100
vii

Colloidal metals and iron hydroxide surfaces ................................................... 102
Streambed sediment metal partitioning............................................................ 104
Benthic macroinvertebrates as biomonitors ..................................................... 105
Dissolved organic carbon and metal speciation ............................................... 108
Recommendations for remediation .................................................................. 112
Summary and Conclusions .............................................................................. 115
References....................................................................................................... 116
APPENDIX A.................................................................................................... 122
APPENDIX B.................................................................................................... 131
APPENDIX C ................................................................................................... 134
APPENDIX D ................................................................................................... 140
viii

LIST OF TABLES
Table 1 Lefthand Creek water, sediment, and benthic macroinvertebrate
sampling site descriptions and locations by global position system. ............. 21
Table 2 James Creek water, sediment, and benthic macroinvertebrate
sampling site descriptions and locations by global position system. ............. 22
Table 3 Little James Creek water, sediment, and benthic macroinvertebrate
sampling site descriptions and locations by global position system. ............. 23
Table 4. EPA inorganic target analyte list and contract required quantitation
limits (CRQLs) for methods 200.7 (ICP-AES for water samples), and 200.8
(ICP-MS) for water samples. ......................................................................... 25
Table 5. Colorado Department of Public Health and the Environment
hardness-based equations for chronic and acute value standards for copper,
zinc, and lead. ............................................................................................... 27
Table 6. Locations of waste rock piles in Lefthand Creek watershed........... 33
Table 7. Acute and chronic table value standards (TVS) for aquatic life for
zinc, copper, and lead in Lefthand, James, and Little James Creeks............ 44
Table 8 Field blank metal concentrations measured at site LJ7. BDL is below
detection limits. Because total lead was below detection limits, and dissolved
lead was not, we can assume that dissolved lead is close to detection limits.
...................................................................................................................... 48
Table 9 Benthic macroinvertebrate background concentrations measured at
sites void of previous mining activities. BDL – Below Detection Limits. ........ 54
ix

Table 10 Background metal concentrations were determined as areas
upstream from any previously known mining activities.................................. 63
Table 11 Laboratory method replicate metal concentrations (mg kg-1 dry
weight) in streambed sediments collected at sites LJ4, LJ5, LJ6, LJ10 and J3.
...................................................................................................................... 66
Table 12 Waste rock piles rated in decreasing order of total elutriated zinc,
copper and lead. ........................................................................................... 89
Table 13 The r2 values observed from correlation analysis which tested the
hypothesis that elutriated metals from waste rock piles correlated with
downstream benthic macroinvertebrates and sediments. r2 values for lead in
benthic macroinvertebrates a weak correlation in for both total and dissolved
portions. ........................................................................................................ 91
Table 14 Percent increases in benthic macroinvertebrate and sediment metal
concentrations from above to downstream of the White Raven Mine and
waste rock pile. A negative increase represents a decrease in concentration.
...................................................................................................................... 95
Table 15 Percent increases in benthic macroinvertebrate and sediment metal
concentrations from above to downstream of the Slide Mine site. A negative
increase represents a decrease in concentration.......................................... 96
Table 16 Intrinsic surface complexation constants (Kint ) reported by Dzombak
and Morel (1990)......................................................................................... 100
Table 17 Average observed distribution coefficients between the dissolved
phase and on the streambed....................................................................... 105
x

Table 18 Increases in concentrations of copper, zinc and lead in stream
water, benthic macroinvertebrates, and sediments from above to downstream
of the Big Five tunnel drainage. These sites were sampled on July 8, 2005,
when the drainage was not flowing into Lefthand Creek. Negative values
indicate decreases in concentrations. ......................................................... 108
xi

LIST OF FIGURES
Figure 1. Lefthand Creek Watershed map with significant features. .................... 3
Figure 2. Effect of rainfall on suspended sediment in Lefthand Creek.
Photographs of Lefthand Creek in Rowena, about 8 km downstream of the
Slide Mine, taken at 5:45, 5:52 and 5:57 pm on April 8, 2004 after a relatively
light rainfall that began at 5:10 pm. .................................................................... 11
Figure 3. A map of the Lefthand Creek watershed identifying key streams,
mines (⊗), towns (ϕ) and other features. .......................................................... 14
Figure 4. A bar graph of the average yearly streamflow in Lefthand Creek
from 1929-1980. The selected years were used based on available USGS
data. ................................................................................................................... 16
Figure 5. A bar graph of the monthly mean streamflow recorded from 1929-
1980 in Lefthand Creek. The selected years were used based on available
USGS data. ........................................................................................................ 16
Figure 6. A bar plot of the available monthly mean streamflow recorded from
August 2003 to December 2005. This stream gauge has been monitored by
Colleen Williams of the James Creek Watershed Initiative since August 2003. . 18
Figure 7. A map of the Lefthand Creek watershed indicating sampling sites
for Lefthand Creek (blue circles), James Creek (red circles), and Little James
Creek (green circles). These are sampling sites for stream water, benthic
macroinvertebrates, and sediments. .................................................................. 20
Figure 8. Lefthand Creek pH and specific conductance measured in the field
during macroinvertebrate and water sampling (June 15 – August 2, 2005). ...... 36
xii
Figure 9. James Creek pH and specific conductance measured in the field
during macroinvertebrate and water sampling. .................................................. 37
Figure 10. Little James Creek pH and specific conductance measured in the
field during macroinvertebrate and water sampling............................................ 38
Figure 11. Lefthand Creek dissolved organic carbon represented with
standard deviations determined from 5 samples taken by the TOC analyzer
software (methods analysis)............................................................................... 39
Figure 12. James Creek dissolved organic carbon represented with standard
deviations determined from 5 samples taken by the TOC analyzer software
(methods analysis). ............................................................................................ 40
Figure 13. Little James Creek dissolved organic carbon represented with
standard deviations determined from 5 samples taken by the TOC analyzer
software (methods analysis)............................................................................... 41
Figure 14. Hardness calculated from magnesium and calcium concentrations
in Lefthand Creek for samples taken from June 15-July 22, 2005. .................... 42
Figure 15. Hardness calculated from magnesium and calcium concentrations
in James Creek for samples taken from June 15-July 22, 2005......................... 43
Figure 16. Hardness calculated from magnesium and calcium concentrations
in Little James Creek for samples taken from June 22, - July 18, 2005. ............ 43
Figure 17. Total (•) and dissolved (#) iron along the length of Lefthand
Creek. The chronic aquatic life standard for iron is 1000 μg L-1, which was
not exceeded...................................................................................................... 46
xiii

Figure 18. Total (•) and dissolved (#) iron along the length of James Creek.
The chronic aquatic life standard for iron is 1000 μg/L, which was not
exceeded............................................................................................................ 46
Figure 19. Total (•) and dissolved (#) iron along the length of Little James
Creek. The chronic aquatic life standard for iron is 1000 μg L-1, which was
not exceeded...................................................................................................... 47
Figure 20. Total (•) and dissolved (#) zinc, copper, and lead concentrations
in Lefthand Creek during June 15-July 22, 2005. Closed circles represent
total metals, open circle represent dissolved metals and chronic standards
are a function of hardness and are represented by dashed lines....................... 49
Figure 21. Total (•) and dissolved (#) zinc, copper, and lead concentrations
in James Creek during July 1- August 1, 2005. Black closed circles represent
total metals, open circle represent dissolved metals, grey closed circles are
below detection limits and chronic standards are represented by dashed lines. 51
Figure 22. Total (•) and dissolved (#) zinc, copper, and lead concentrations
in Little James Creek during June 22, - July 18, 2005. Closed circles
represent total metals, open circle represent dissolved metals and chronic
standards are represented by dashed lines. ...................................................... 53
Figure 23. Zinc, copper, and lead concentrations measured in
macroinvertebrates in Lefthand Creek from June 15, - July 22, 2005. ............... 57
xiv

Figure 24. Zinc, copper, and lead concentrations measured in
macroinvertebrates in James Creek from July 1, - August 1, 2005. Missing
data points indicates levels measured below detection limits............................. 59
Figure 25. Zinc, copper, and lead concentrations measured in
macroinvertebrates in Little James Creek from June 22, - July 18, 2005.
Missing data points indicates levels measured below detection limits. Upside
down triangles represent sites with no macroinvertebrates present at the time
of sampling......................................................................................................... 62
Figure 26. Effect of amount of sediment on metal releases from the sediment
collected at site LJ13 (1.59 km) by the partial digestion method. ....................... 64
Figure 27. Effect of amount of sediment on metal releases from the sediment
collected at site LJ7 (2.89 km) by the partial digestion method. ......................... 65
Figure 28. Lefthand Creek Zn, Cu, and Pd in streambed sediments (grain
size <63 μm). Metals released via acid-extraction. Samples were collected
from October 1-October 17, 2005. ..................................................................... 68
Figure 29. Lefthand Creek (11-30 km) Cu, Zn and Pd in streambed
sediments (grain size <63 μm). Metals released via partial digestion methods.. 69
Figure 30. James Creek Zn, Cu, and Pb in sediments (grain size <63 μm).
Metals released via acid-extraction. Samples were collected between October
1, - October 17, 2005. ........................................................................................ 70
Figure 31. Little James Creek Zn, Cu, and Pb in sediments (grain size <63
μm). Metals released via partial digestion method. Samples were collected
on September 24, 2005...................................................................................... 72
xv

Figure 32. Left Hand Creek - percent of sediments that are <63μm in size. ..... 74
Figure 33. James Creek - percent of sediments that are <63 um in size. ......... 74
Figure 34. Little James Creek - percent of sediments that are <63 um in size.. 75
Figure 35. Concentrations of metals elutriated from waste rock piles along
Lefthand Creek. Data collected by Amber Roche. White bars represent zinc,
grey bars represent copper, and black bars represent lead. .............................. 76
Figure 36. Concentrations of metals in sediments at waste rock piles along
Little James Creek. Data collected by Amber Roche. ....................................... 76
Figure 37. Lefthand Creek waste rock pile total elutriated metal
concentrations. Error bars represent standard deviations of duplicate
samples.............................................................................................................. 77
Figure 38. Little James Creek waste rock pile total elutriated metal
concentrations. Error bars represent standard deviations of duplicate
samples.............................................................................................................. 78
Figure 39. Comparisons of metals in benthic macroinvertebrates and
dissolved metals in water (left column) and metals in sediments and dissolved
metals in water (right column) for zinc, copper, and lead in Lefthand Creek. ..... 83
Figure 40. Comparisons of metal concentrations in benthic
macroinvertebrates and dissolved metals in water (left column) and metal
concentrations in sediments and stream water (right column) for copper, zinc,
and lead in James Creek.................................................................................... 84
xvi

Figure 41. Comparisons of metal concentrations in macroinvertebrates and
stream water (left column) and metal concentrations in sediments and stream
water (right column) for copper, zinc, and, lead in Little James Creek. .............. 85
Figure 42. Comparisons of metals in benthic macroinvertebrates and metals
in sediments for all of Lefthand Creek (left column) and for only the California
Gulch reach of Lefthand Creek (right column).................................................... 86
Figure 43. Comparisons of metals in benthic macroinvertebrates and metals
in sediments for zinc, copper, and, lead in all of James Creek........................... 87
Figure 44. Comparisons of metals in benthic macroinvertebrates and metals
in sediments for zinc, copper, and lead in all of Little James Creek. .................. 88
Figure 45. A correlation analysis between macroinvertebrate (plots on the
left) and sediment (plots on the right) metal concentrations downstream of
waste rock piles and total elutriated metals (zinc – squares, copper –
triangles, and lead – circles). Dashed lines are the 95% confidence intervals. . 92
Figure 46. A correlation analysis between macroinvertebrate (plots on the
left) and sediment (plots on the right) metal concentrations downstream of
waste rock piles and dissolved elutriated metals (zinc – squares, copper –
triangles, and lead – circles). Dashed lines are the 95% confidence intervals. . 93
Figure 47. The colloidal fraction (fcolloid) of zinc, copper, and lead in the three
creeks of the Lefthand watershed (left column, mean and one standard
deviation shown by error bar), and the dependence of the colloidal fraction on
the pH of the water samples (right column - zinc (circles), copper (triangles),
and lead (squares)). ........................................................................................... 99
xvii

Figure 48. Colloidal fractions of zinc (circles), copper (triangles), and lead
(squares) compared to the logarithms of the intrinsic surface complexation
constants (log Kint) reported by Dzombak and Morel (1990). ........................... 100
Figure 49. Fractions of colloidal metal versus hardness in James (closed
circles), Lefthand (open circles) and Little James (closed triangles creeks. ..... 102
Figure 50. The influence of pH on colloidal fractions of iron (fcolloid) throughout
the watershed................................................................................................... 103
Figure 51. Colloidal fraction of copper, zinc, and lead as a function of
colloidal iron concentration (μmol L-1). Regression analysis determined r2
values of zero for all metals.............................................................................. 104
Figure 52. Logarithms of the distribution coefficients (Kd, L kg-1) for sediment-
water distribution of zinc, copper, and lead for all sampling sites in the
watershed as a function of pH.......................................................................... 105
Figure 53. Concentration of metals in benthic macroinvertebrates as a
function of concentration of dissolved organic carbon (DOC) for all sampling
sites.................................................................................................................. 110
Figure 54. The colloidal fraction of metals (fcolloid) as a function of DOC show
weak correlations (zinc (0.14), copper (0.06), and lead (0.065). ...................... 111
xviii

Introduction
Mining activities around the world have left countless streams, rivers
and lakes contaminated with toxic concentrations of heavy metals (Moore and
Luoma 1990; Davies et al. 1994). In Boulder County, Colorado in the mid-
1800s, a boom of settlers arrived looking to mine and mill precious metals in
Boulder County. The legacy from this era was assessed in 1993 by the
Colorado Geological Survey through the identification of 230 mine openings
and 186 tailings piles, all presently abandoned within the Lefthand Creek
watershed (Sares and Lovekin 1993). It has been determined that these
tailings piles and mines continue to provide a source of toxic metals as
intermittent streams meander through and erode tailings deposits and
transport them into main stream channels threatening human and aquatic life
(LWTF 2002).
Lefthand Creek is a key source of water for the Left Hand Water
District and its 14,000 customers in unincorporated Boulder County. It is the
concern of local citizens, government agencies, and stakeholder groups that
in the event of a catastrophic flood or precipitation event, toxic metals may
contaminate the stream water and subsequently, the water supply. Lefthand
Creek has always been the principal millstream of Boulder County (Cobb
1988). It was considered a “dead creek” by fisherman and nearby residents
until the 1930s (Cobb 1988; LWTF 2002). Around this time, it was reported
that the acid mine drainage and toxic components thereof began to attenuate.
This allowed the creek to support aquatic life once again. However, to this
1

day, there is still significant contamination in various reaches. In July, 2001,
after much deliberation between local communities and federal and local
agencies over concerns of water quality impairment due to abandoned mines,
mills and waste rock piles, the Lefthand Watershed Task Force (LWTF) was
established by Boulder County. In March, 2002, the Task Force issued a
report for the BCHD on the effects of abandoned mines on the upper
Lefthand watershed (west of Highway 36). The report indicated that the most
significant cause of water quality impairment was due to past mining activities
(LWTF 2002). The Little James Creek, a tributary of James Creek, which is a
tributary of Lefthand Creek, was subject to the first documented complaints
concerning water quality in the Lefthand Watershed in the mid-1960s. The
Boulder County Health Department (BCHD) found water samples near the
Burlington Mine (along Little James Creek) to be high in sulfate, total solids
(TS), and various heavy metals (LWTF 2002).
2

Balarat Creek
Burlington Mine
Haldi Diversion
Dew Drop
Little James Creek
Lefthand Creek
Slide Mine
JAMESTOWN
WARD
Indiana Gulch
Lick Skillet Gulch
Nugget Gulch
Lee Hill Gulch
ROWENA
un-named waste
Streamside tailings
Bueno Mtn.
Argo Mine
White Raven
Big Five Tunnel
Spring Gulch
Fairday Mine John Jay mine
Sixmile Creek
Castle
Evening Star
Emmett adit
Loder Smelter
James Creek
Peak to Peak US
Figure 1. Lefthand Creek Watershed map with significant features.
Current activities to improve water quality in the watershed are
occurring at many sites within the watershed including, the Captain Jack Mine
and Mill, the Burlington Mine, the Slide Mine, the “streamside tailings,”
Fairday Mine, and the Golden Age mine.
The Captain Jack Mine and Mill is an EPA Superfund site (includes the
Big Five Tunnel drainage, the Blackjack Mine, the Captain Jack mill, and the
White Raven Mine) located just south of the town of Ward along a segment of
Lefthand Creek referred to locally as “California Gulch.” The site was listed
on the states National Priority List (NPL) in September, 2003, and the
remedial investigation and feasibility study were completed in April, 2006.
3

The Burlington Mine is located along Little James Creek one mile north
of Jamestown. This site was listed as a Voluntary Clean-Up Program (VCUP)
site in April, 2002, and remediation of the Burlington Mine is undergoing. The
remediation and VCUP listing was instigated by Honeywell, Inc., the private
owner.
The Slide Mine encompasses a 3 hectares area located along
Lefthand Creek just upstream of the small town of Rowena (Figure 1). The
Slide Mine has recently been considered for VCUP due to occurrences of
sediment loading into Lefthand Creek during precipitation events and metals
loading.
The Bueno Mine tailings and the “streamside tailings,” located just
west of Jamestown (Figure 1), are being considered for the EPA’s Emergency
Response program. This was due in part to the remedial investigations
conducted by the US Forest Service. The Emergency Response program was
set up by the EPA to protect human and public health during an emergency
involving a threatened release of hazardous waste. Jamestown is
surrounded by steep eroding slopes and recently experienced mudslides in
the early summer of 2005. Bueno Mountain resides just above Jamestown
and the potential exists for the release of toxic metals during a rain storm or
rapid snowmelt.
The US Forest Service has completed reclamation projects at the
Fairday Mine on James Creek, west of Jamestown (Figure 1) and is about to
4

undertake a reclamation of the Golden Age Mine located northeast of
Jamestown.
The Lefthand Watershed Oversight Group (LWOG), a stakeholder
group, was formed as a final recommendation of the Lefthand Watershed
Task Force. The LWOG, along with the aid of researchers from the
University of Colorado, developed a watershed plan to characterize metal
loading in the Lefthand, James, and Little James Creek watersheds and
identified future remediation targets (Wood et al. 2004). The experiments
discussed within this report are an extension of this previous outreach by the
University of Colorado to assist the LWOG in further characterization and
prioritization of toxic metal sources. A list of metals which have exceeded
aquatic life standards in the watershed was compiled by the Lefthand
Watershed Task Force and includes aluminum, cadmium, copper, iron, lead,
manganese and zinc (LWTF 2002). Based on the frequency of aquatic life
standard exceedences and the ability to reinforce metal solubility trends, for
this study, we focused on copper, zinc and lead.
Fate and transport of metals
Metal transport from abandoned mine sites and mining waste piles is a
secondary process to the natural weathering of pyrite exposed to chemical
and biological processes (Evangelou 1995; Adriano 2001). The oxidation of
reduced sulfur in pyrite results in the release of H+ and SO42- ions into soil
solution. The acidity leaches heavy metals from waste rock and mill tailings.
5

Geochemical interactions among surface water, colloidal materials, stream
bed sediments and mineralogy are the essential components for predicting
metal solubility as well as bioavailability (Stumm and Morgan 1996). During
precipitation and snowmelt, low pH runoff from waste rock piles transports
zinc, copper and lead away from metal sources and into nearby streams. The
metals in the acidic runoff remain in solution due to a lower affinity to bind to
surfaces and thus are transported for long distances. Studies have shown
that the stream water quality downstream improves with distance in relation to
abandoned mines and metal sources (Church et al. 1997; Munk et al. 2002).
In neutral waters, metals precipitate or adsorb to mineral surfaces. Mineral
hydroxide surfaces provide adsorption sites for the metals cations. The
surfaces are either protonated, de-protonated or neutral depending upon pH
(Dzombak and Morel 1990; Drever 1997). The pH range going from 0 –
100% adsorption of metal cations to a hydrodixe surface is narrow (about 2
pH units) and varies for each metal (typically 5 -7). Numerous studies have
confirmed the selectivity of metals for adsorption to surfaces follow the
general sequence (Axtmann et al. 1990; Davis and Kent 1990; Dzombak and
Morel 1990; Kimball et al. 1995; Church et al. 1997; Wang et al. 1997; Davis
and Atkins 2001; Covelo et al. 2004):
Cr3+ > Pb2+ > Cu2+ > Zn2+ > Cd2+ > Ca2+.
This sequence has been found to vary not only with pH, but concentration of
individual metals and stream water hardness. The adsorption-desorption
mechanism of a metal cation at a surface can be represented using an
6

intrinsic constant (Kint). The intrinsic constant is a function of the
concentrations of metals near the surface and the nature of the solid surface,
not including surface charge (Singer and Stumm 1970; Dzombak and Morel
1990). Metals that are immobilized by adsorption or precipitation
mechanisms will be retained upon sediments unless all active sites are
loaded or there is a change in the chemical environment (pH, redox potential,
degradation of organics, fluid composition and temperature changes) which in
turn re-mobilizes the metals (Pagnanelli et al. 2003).
Bioavailability of Metals
Elevated metal concentrations have been found in benthic
macroinvertebrates downstream of abandoned mines in the many streams of
the Rocky Mountains and elsewhere. As a consequence of metal pollution in
rivers and streams, benthic macroinvertebrates have been known to
accumulate metals in concentrations that are indicative of their immediate
environment (Hare et al. 1991; Cain et al. 1992; Kiffney and Clements 1992;
Clements and Kiffney 1994). In addition, it has been found that benthic
macroinvertebrate metal concentrations persist great distances downstream
from metal sources (Farag et al. 1998). The metals integrated into the tissues
of benthic macroinvertebrates are an accumulation of varying in-stream water
quality conditions over time (Clements and Kiffney 1994). These
concentrations can be used indirectly to determine the degree of metal
loading by comparing benthic macroinvertebrate metal concentrations at
contaminated sites to background sites (Woodward et al. 1994; Woodward et
7

al. 1995; Farag et al. 1999). Background sites include areas of the
investigated watershed where previous mining activities did not occur and
stream conditions are relatively pristine. The metals that accumulate in the
bodies of benthic macroinvertebrates from water and sediments can also be
ingested by fish, which studies have shown to be their main source of metal
exposure (Farag et al. 1998).
Early studies in the Clark Fork River, Montana showed that with
continual downstream copper concentrations in the water decreasing,
concentrations in benthic macroinvertebrates (as well as sediments)
remained high (Woodward et al. 1994; Lanno et al. 1997; Cain et al. 2000).
Furthermore, during a spring sampling event in the upper Arkansas River in
Colorado, scientists found that copper and zinc concentrations in benthic
macroinvertebrates remained elevated above background levels 45 km
downstream of a tributary containing acidic metal-laden flow from abandoned
mine sites (Clements and Kiffney 1994). In a study conducted in 2000,
copper and lead concentrations in sediments and in the benthic
macroinvertebrate Hydropsyche californica were found to be positively
correlated in a majority of the samples taken in the Sacramento River (Cain et
al. 2000).
It has been found that the leachability of metals from benthic
macroinvertebrates varies considerably between species (Kiffney and
Clements 1992; Clements and Kiffney 1994; Cain et al. 2004; Prusha and
Clements 2004) and that care should be taken when looking at metal
8

concentrations in pooled communities. The benthic macroinvertebrates,
Archtopsyche grandis (Kiffney and Clements 1992; Clements and Kiffney
1994; Maret et al. 2003; Cain et al. 2004; Prusha and Clements 2004) and
Hydropsyche californica (Cain et al. 2000) have been used as target species
of collection for studies using benthic macroinvertebrate metal accumulation
for monitoring metals impacts from abandoned mine sites in Rocky Mountain
streams. Using a single species for monitoring metal impacts in streams
limits variability in metal accumulation due to varying feeding habits and metal
tolerance.
Objectives
One of the suggestions made by the Lefthand Watershed Task Force
was to determine the potential effects on water quality in the event of a
catastrophic storm event or rapid snowmelt. The impacts on streams in
Lefthand Creek are associated with the risk of contaminated sediment moving
downstream gradually over time or instantaneously during periods of high
discharge or flood. In order to determine the outcome of such an event, it is
important to assess the effective methods for measuring the impacts of
intermittent storms. Previous studies conducted by the Lefthand Watershed
Oversight Group and the University of Colorado incorporated tracer dilution
tests to identify metal loading to streams. A tracer study uses a highly
concentrated salt injected at a point in the stream while synoptic sampling at
various locations downstream is conducted. Knowing the initial concentration
of the tracer and by how much it is diluted at all sampling locations, the
9

streamflow can be determined. Using these precise measurements for
stream flow along with samples analyzed for metal concentrations, metal
loading can be calculated. The tracer study was not able to identify metal
loading to the stream as a result of intermittent storm events which erode and
weather waste rock piles and transport metals to the stream. The tracer tests
give only a snapshot in time of the metals transported from an upstream
source. If conducted on a sunny day, these studies miss metal inputs that
would have been present if it was raining or snowing. Anecdotal evidence of
metal loading during a precipitation event is represented in Figure 2 below.
Sediment loading, visualized by muddy brown water, from the Slide Mine
during numerous precipitation events, such as the one in Figure 2 have been
reported by residents downstream of the Slide Mine in the town of Rowena.
We make the assumption that the stream water metal concentration in the
third photograph is greater than in the first and second photo. Conducting a
tracer study during a precipitation event such as this has proved to be
impractical. Using an auto-sampler to collect data over time would be useful,
however due to maintenance and upkeep and the fact that this was an
outreach project with results needed in a timely manner, this option was ruled
out.
10

Figure 2. Effect of rainfall on suspended sediment in Lefthand Creek. Photographs of Lefthand Creek in Rowena, about 8 km downstream of the Slide Mine, taken at 5:45, 5:52 and 5:57 pm on April 8, 2004 after a relatively light rainfall that began at 5:10 pm.
The goal of this study is to assess the impacts of these intermittent
precipitation events by measuring metal concentrations, specifically copper,
zinc and lead in the benthic macroinvertebrates, streambed sediments, and
stream water in the Lefthand, Little James and James Creeks. In addition to
these stream-related concentrations, we will also use previous data from
elutriation and weak acid extraction tests conducted on numerous waste rock
pile sediments located along Lefthand and Little James Creeks to determine
origination of metals. This data was collected by Amber Roche, Alice Wood,
and Joseph Ryan of the University of Colorado as part of the current LWOG
investigation.
By completing simple regression analyses on multiple combinations of
paired data sets, we can identify correlations between water, benthic
macroinvertebrates and sediments. Results from both correlative and non-
correlative data-sets will provide insight into which datasets indicate long-term
11

accumulation of metals. In order to assess the impacts of intermittent
sources of toxic metals to streams in the Lefthand Creek watershed, metal
concentrations were measured in the stream water, benthic
macroinvertebrates, stream sediments, and waste rock piles. Our analyses
focused on zinc, copper, and lead because these metals most frequently and
consistently exceed aquatic life standards in the watershed (Lefthand
Watershed Task Force 2002; Wood et al. 2004), and because these metals
behave quite differently with respect to adsorption to minerals, organic matter,
and organisms (Adriano 2001; Prusha and Clements 2004). Typically, zinc is
mainly dissolved and lead is mainly bound to minerals, organic matter, and
organisms, while copper can be found in both dissolved and bound species.
Exposure time to toxic metals and the fate and transport of metals in streams
were key factors in creating hypotheses.
We hypothesized that benthic macroinvertebrates and sediments,
which have proved to be good monitors of metal loading over time (Hare et al.
1991; Woodward et al. 1994), will provide evidence of metal inputs in to the
streams by intermittent tributaries and snow melt. Because both benthic
macroinvertebrates and sediments are expected to be good monitors of metal
loading from intermittent sources, we expect that the metal concentrations in
the benthic macroinvertebrates and the sediments will be correlated, but that
the metal concentrations in the benthic macroinvertebrates and sediments will
not be correlated with the metal concentrations in the stream water. We
expect that zinc, copper, and lead will follow the patterns of speciation
12
observed in other streams and soils (Singer and Stumm 1970; Dzombak and
Morel 1990; Kimball et al. 1995; Farag et al. 1998; Fey et al. 1999; Schemel
et al. 2000; Munk et al. 2002). In the stream water samples, we expect that
zinc will be mostly dissolved, lead would be mostly bound to colloids, and
copper would be found in both fractions. Because of this behavior, we expect
to find more lead and less zinc accumulation in the sediments and benthic
macroinvertebrates. We expect that the amount of dissolved organic matter
in the streams will play a role in the metal distributions between water,
sediments, and benthic macroinvertebrates. Finally, based on findings
produced from testing these hypotheses, we will prioritize abandoned mine
cleanup in the Lefthand Creek watershed.
Materials and Methods
Field research area
The Lefthand Creek watershed (Figure 3) drains an area of
approximately 220 km2. Located at the northern tip of the Colorado Mineral
Belt, the watershed drains mainly Precambrian metamorphic and igneous
formations and glacial and alluvial deposits. The watershed terrain is about
one-half alpine and sub-alpine forest and one-half agricultural and urban on
the high plains east of the front range of the Rocky Mountains. Lefthand
Creek, James Creek, and Little James Creek are the primary streams in the
upper half of the Lefthand Creek watershed.
13

Figure 3. A map of the Lefthand Creek watershed identifying key streams, mines (⊗), towns
(ϕ) and other features.
Lefthand Creek originates in glacial and snow melt waters at an
elevation of approximately 4,200 m in the Indian Peaks Wilderness area near
the Continental Divide and approximately 5 km west of Highway 72 and the
town of Ward, Colorado. It is just east of the town of Ward where Lefthand
Creek flows through portions of the Ward mining district, including the Captain
Jack Mine and Mill Superfund site. This Superfund site is located on a
segment of the stream locally referred to as the California Gulch.
Downstream of California Gulch, Lefthand Creek flows past mine waste rock
piles and receives water from multiple tributaries draining mine sites off the
steep vertical grades of Lefthand Canyon. The Lefthand Creek empties out
14

onto the high plains at an elevation of approximately 1,400 m which is nearly
40 km downstream of its headwaters. Ultimately, Lefthand Creek flows into
the St. Vrain Creek, which eventually feeds the South Platte River.
Annual mean and monthly mean stream flows were recorded in Lefthand
Creek by the United States Geological Survey from 1929 to 1980. The
survey staff gage was located at 40°07'32" north latitude and 105°18'12" west
longitude. The annual mean stream flows in those years ranged from 603 L
s-1 to 1183 L s-1 (Figure 4) while the average monthly stream flow ranged from
90 L s-1 to 4700 L s-1. The peak flows occur in May and June during the
spring snowmelt which is highly characteristic of a mountain stream. During a
recent study in the Lefthand Creek watershed researchers recorded
streamflow in Lefthand Creek ranging from 45 L s-1 at Peak to Peak highway
to 2500 L s-1 at the Haldi diversion gate during the high flow season (Wood
2003). It was also estimated that James Creek adds 550 L s-1 to Lefthand
Creek and is the most significant source of inflow.
15

Lefthand Creek average yearly streamflow (1929-1980)
0
200
400
600
800
1000
1200
1400
1600
1930 1948 1949 1950 1951 1952 1953 1956 1977 1978 1979
Year
Flow
(L/s
)
Figure 4. A bar graph of the average yearly streamflow in Lefthand Creek from 1929-1980. The selected years were used based on available USGS data.
Lefthand Creek monthly mean streamflow in L/s (1929-1980)
0
500
1000
1500
2000
2500
3000
3500
4000
4500
Jan Feb Mar Apr May Jun Jul Aug Sep Oct Nov Dec
Month
Flow
(L/s
)
Figure 5. A bar graph of the monthly mean streamflow recorded from 1929-1980 in Lefthand Creek. The selected years were used based on available USGS data.
16

James Creek is a major tributary of Lefthand Creek which flows
through the Boulder County community of Jamestown and provides its sole
source of drinking water. This sub-watershed is covered entirely by alpine
and sub-alpine forest. James Creek drains an area of approximately 48 km2.
Elevations in the James Creek watershed range from approximately 3,000 m
at the headwaters in the Indian Peaks Wilderness Area to 2,000 m at the
confluence with Lefthand Creek approximately 5 km south of Jamestown. The
annual average streamflow in 2004 and 2005 in James Creek was 1070 L s-1
and 1300 L s-1 respectively. Average monthly flows between August of 2003
until December of 2005 are illustrated in Figure 6 with the maximum
discharge approximately 3000 L s-1 in the month of June. Flows were
measured at a staff gauge station in Jamestown located at 40º06’55.8” north
latitude and 105º23’18.9” west longitude by Colleen Williams of the James
Creek Watershed Initiative. The headwaters of the James Creek watershed
supply only a small fraction of the flow into James Creek. During parts of the
year a diversion of the South St. Vrain Creek contributes nearly all of the flow
of James Creek (CDWR 2002). Snowmelt in the South St. Vrain Creek
headwaters feeds high flows in James Creek. James Creek and its tributaries
drain steep graded mined areas such as the Jamestown Mining District and
the Golden Age Mining District. James Creek is the main source of drinking
water for Jamestown. The creek is diverted to a small treatment plant just
downstream of Bueno Mountain on Ward Street (County Road 102J).
17

James Creek monthly mean streamflow, L/s (August 2003 - December 2005)
0
500
1000
1500
2000
2500
3000
3500
Jan Feb Mar Apr May Jun Jul Aug Sep Oct Nov Dec
Month
Flow
(L/s
)
Figure 6. A bar plot of the available monthly mean streamflow recorded from August 2003 to December 2005. This stream gauge has been monitored by Colleen Williams of the James Creek Watershed Initiative since August 2003.
Little James Creek is a tributary of James Creek. The confluence
occurs just downstream of the Jamestown water treatment plant near the
corner of Main Street and Ward Street. Little James Creek drains a
watershed area of approximately 15 km2. Alpine and sub-alpine forests cover
the sub-watershed. Cumulative stream flow data for Little James Creek is
unavailable. However, a University of Colorado research team conducted a
lithium chloride tracer-study which was able to identify streamflow during the
Spring of 2003 and Fall of 2003 (Wood 2003). During the high flow period
(spring 2003), the flow increased from the furthest upstream site at the
headwaters to the lowest downstream site at the confluence with James
18

Creek from 110 L s-1 to 540 L s-1 respectively. Low flow data was determined
to be unreliable and was therefore not reported. Visual reports indicate that
the creek has a tendency to become dry along a large portion of the stream
from its headwaters down to the “streamside tailings” in the summer months.
The James Creek low flow tracer-study conducted by Wood found that there
was not a significant input from the Little James Creek.
Stream water, benthic macroinvertebrate, and streambed sediment
sampling sites
Field sites along Lefthand, James and Little James Creeks were
chosen based upon a University of Colorado report to the LWOG which
ranked areas as low, medium and high priority based on pH, toxic metal
concentrations and metal loading rates (Wood et al. 2004). Field sites
chosen for this study are listed in Table 1, Table 2 and Table 3 including the
sample site name, global positioning system (GPS) site identification (ID), a
brief site description, and the appropriate latitude and longitude locations.
Figure 7 shows the locations of the sampling sites for all three streams.
These sites were sampled for stream water, benthic macroinvertebrates, and
sediments.
On Lefthand Creek the Big Five Tunnel was given a high priority
ranking by Wood et al (2004). Sites ranked for medium priority ranked sites
along Lefthand Creek include the Dew Drop Mine, the White Raven Mine, the
Loder Smelter, various unnamed tributaries downstream of the Loder smelter,
Spring Gulch, and the Slide Mine.
19

Castle Gulch located along James Creek was given a medium priority ranking
while the Fairday Mine and Bueno Mine were given high rankings.
Little James Creek contained the highest number of high priority sites
including Balarat Creek, which drains the Burlington Mine, various un-named
tributaries, and waste rock piles downstream of the confluence of Balarat
Creek and Little James Creek and above Jamestown, and the “streamside
tailings.” The Argo Mine and Evening Star Mine were given a medium priority
ranking on Little James Creek.
Figure 7. A map of the Lefthand Creek watershed indicating sampling sites for Lefthand Creek (blue circles), James Creek (red circles), and Little James Creek (green circles). These are sampling sites for stream water, benthic macroinvertebrates, and sediments.
20

Table 1 Lefthand Creek water, sediment, and benthic macroinvertebrate sampling site descriptions and locations by global position system.
sample site name site ID site description
latitude longitude (º, ‘, “)
LH1 5560A-1 at the Peak-to-Peak Highway 40 04 09.27 N 105 31 00.66 W
LH2 5560A-6 upstream of unnamed tributary that drains mine across Peak-to-Peak
40 03 54.97 N 105 30 47.74 W
LH3 5560A-8 downstream of unnamed tributary that drains mine across Peak-to-Peak
40 03 53.14 N 105 30 42.66 W
LH4 5560A-13 upstream of Big Five Tunnel drainage confluence
40 03 44.21 N 105 30 34.81 W
LH5 5560A-14 downstream of Big Five Tunnel drainage confluence
40 03 42.9 N 105 30 31.54 W
LH6 5560A-17 upstream of White Raven Mine site 40 03 38.45 N 105 30 24.98 W
LH7 5560A-21 downstream of White Raven Mine site
40 03 31.86 N 105 30 21.9 2 W
LH-PU 5560A-PU Puzzler Gulch 40 03 20.28 N 105 30 06.63 W
LH-IN 5560A-IN Indiana Gulch 40 03 21.74 N 105 30 04.3 7 W
LH8 5560A-56 downstream of Indiana Gulch confluence at Sawmill Road.
40 03 20.81 N 105 30 02.4 7 W
LH9 5560A-95-1 above Lickskillet Rd and below tailings
40 04 27.77 N 105 24 47.3 3 W
LH10 5560A-96 below Lickskillet Gulch 40 04 27.69 N 105 24 43.82 W
LH11 5560A-101 150 meters upstream of Slide Mine discharge
40 04 28.60 N 105 24 02.9 8 W
LH-SL 5560A-SL1 slide Mine discharge 40 04 28.53 N 105 24 02.8 9 W
LH12 5560A-103 below Slide Mine 40 04 29.70 N 105 23 53.08 W
LH13 5560A-113 below Rowena 40 04 43.50 N 105 23 01.54 W
LH14 5560A-123 below Nugget Gulch, above “Lee Hill Gulch”
40 05 20.04 N 105 21 46.95 W
LH15 5560A-129 below “Lee Hill Gulch” 40 05 35.69 N 105 21 02.18 W
LH16 5560A-136-2 below James Creek confluence at pull-off
40 06 15.61 N 105 20 16.19 W
LH17 5560A-127 downstream of US Forest Service off-highway vehicle access
40 06 31.77 N 105 19 05.67 W
LH18 5560A-171 at Buckingham Park 40 06 40.07 N 105 18 25.34 W
LH19 5560A-184 at Haldi Head gate, Left Hand Water District intake
40 07 53.07 N 105 17 33.11 W
21

Table 2 James Creek water, sediment, and benthic macroinvertebrate sampling site descriptions and locations by global position system. sample site
name site ID site description latitude longitude (º, ‘, “)
J1 5561A-T1 reference Site above Peak-to-Peak highway
40 05 21.33 N 105 29 46.75 W
J2 5561A-T2 downstream of County Road 100 40 05 31.25 N 105 29 09.56 W
J3 5561A-T3 upstream of Forget-Me-Not Meadow and Fairday drainage
40 05 57.57 N 105 25 59.30 W
J4 5561A-T4 upstream of road crossing, downstream of tailings piles
40 06 04.78 N 105 25 47.83 W
J-FD 5561A-FD Fairday Mine drainage 40 06 40.77 N 105 25 20.26 W
J5 5561A-JOHN Downstream of John Jay mine 40 06 19.70 N 105 25 38.60 W
J6 5561A-10 200 yds downstream of Fairday drainage
40 06 38.40 N 105 25 14.35 W
J7 5561A-16 upstream of Bueno discharge 40 06 50.24 N 105 24 03.13 W
J8 5561A-28 upstream of DW intake, downstream of Bueno discharge
40 06 54.86 N 105 23 31.55 W
J9 5561A-30-582
downstream of Little James confluence in Jamestown
40 06 55.75 N 105 23 18.86 W
J10 5561A-55 upstream of Curie Springs 40 06 28.45 N 105 22 22.16 W
J-CU 5561A-CU Curie Springs 40 06 34.53 N 105 21 33.40 W
J11 5561A-52 downstream of Curie Springs 40 06 34.34 N 105 21 29.95 W
J12 5561A-53 upstream of Castle Gulch, downstream of Curie
40 06 34.34 N 105 21 29.95 W
J-CG 5561A-CG Castle Gulch 40 06 26.36 N 105 21 11.79 W
J13 5561A-61 just downstream of Castle Gulch 40 06 25.78 N 105 21 10.08 W
J14 5561A-62 upstream of confluence with Lefthand Creek
40 06 07.94 N 105 20 33.31 W
22

Table 3 Little James Creek water, sediment, and benthic macroinvertebrate sampling site descriptions and locations by global position system.
sample site name
site ID site description latitude longitude (º, ‘, “)
LJ1 5562A-0 upstream of Argo mine and tailings
40 08 12.91 N 105 24 41.57 W
LJ2 5562A-1 downstream of Evening Star 40 07 52.32 N 105 24 24.41 W
LJ3 5562A-6 upstream of small tailings pile and Argo
40 07 46.70 N 105 24 06.99 W
LJ4 5562A-8 upstream of Argo discharge, upstream of Burlington Mine
40 07 44.75 N 105 24 06.99 W
LJ5 5562A-10 downstream of Argo discharge, upstream of Burlington
40 07 42.02 N 105 24 01.91 W
LJ6 5562A-14 upstream of Balarat, downstream of Emmit
discharge
40 07 35.94 N 105 23 57.3 W
LJ7 5562A-16 upstream of Balarat 40 07 33.74 N 105 23 54.61 W
LJ8 5562A-18-1 upstream of Joe Ryan tailings 40 07 27.03 N 105 23 52.35 W
LJ9 5562A-21 downstream of Joe Ryan Tailings
40 07 24.99 N 105 23 50.84 W
LJ10 5562A-28 upstream of “streamside tailings”
40 07 11.52 N 105 23 39.14 W
LJ11 5562A-32 downstream of “streamside tailings”
40 07 04.02 N 105 23 38.08 W
LJ12 5562A-35 below waterfall GPS not taken
LJ13 5562A-38 upstream of confluence with James Creek
40 06 58.41 N 105 23 28.35 W
Stream water sampling and analysis
Stream water samples were collected from June 15 to August 2 at all
sites listed in Table 1, Table 2, and Table 3 and shown in Figure 7. Site-
specific sampling dates can be found in Appendix A. Duplicate samples were
taken at every tenth site sampled as indicated in the EPA’s sampling and
analysis plan for the Lefthand Creek watershed (Hernandez et al. 2004). Two
water samples were collected at each site to be later analyzed for total and
23

dissolved metals. De-ionized water was brought to the field and filled into a 1
L polypropylene bottle to serve as the field blank.
All field samples were collected in 1 L polypropylene bottles and
placed in a cooler on ice. In the laboratory, the samples were stored in a
refrigerator at 5ºC. Samples to be analyzed for total metals were immediately
acidified to a pH of less than 2 using a concentrated trace metal grade nitric
acid (Fisher Scientific). Samples to be analyzed for dissolved metals were
filtered with a MAGNA 0.45 μm, nylon membrane (Osmonics, Inc.) prior to
acidification. All samples were filtered using vacuum extraction and a 500 mL
polypropylene, filter apparatus (Nalgene). The difference between total and
dissolved values was used as the concentration of colloidal metals for a
sample. All samples were stored at 5ºC until further EPA metal analysis.
Water samples were sent to a laboratory certified under the EPA’s Contract
Laboratory Program (CLP), where a full suite of analytes (Table 4) were
measured using EPA method 200.7 (inductively coupled plasma-atomic
emission spectrometry, ICP-AES). If cadmium, copper or lead concentrations
were measured below detection limits (BDL) using ICP-AES, then the
laboratory re-analyzed samples using EPA method 200.8 (inductively coupled
plasma-mass spectrometry, ICP-MS). At the time of sample receipt, the
contracted lab checked the pH and modifications were only made if pH
measured below 2.
24

Table 4. EPA inorganic target analyte list and contract required quantitation limits (CRQLs) for methods 200.7 (ICP-AES for water samples), and 200.8 (ICP-MS) for water samples. Analyte ICP-AES CRQL for water (μg L-1) ICP-MS CRQL for water (μg L-1) Aluminum 200 -- Antimony 60 2 Arsenic 10 1 Barium 200 10 Beryllium 5 1 Cadmium 5 1 Calcium 5000 -- Chromium 10 2 Cobalt 50 1 Copper 25 2 Iron 100 -- Lead 10 1 Magnesium 5000 -- Manganese 15 1 Mercury 0.2 -- Nickel 40 1 Potassium 5000 -- Selenium 35 5 Silver 10 1 Sodium 5000 -- Thallium 25 1 Vanadium 50 1 Zinc 60 2
The contract requirement quantitation limits (CRQLs) reported in Table
4 are the minimum standards that EPA contracted laboratories need to
demonstrate the ability to meet prior to analyzing field samples. These values
are reported in the laboratory data if an individual sample is below the
instrumentations method detection limits (MDLs). The laboratories are
required to document methods used to generate analytical results and
determine Malls.
25
Water quality parameters
The field water quality parameters measured include pH, specific
conductance, and temperature. Specific conductance is a measure of the
dissolved ions in the water. A field pH meter (Orion 250A) and combination
electrode (Orion 91-07, low maintenance triode) was used to measure pH,
temperature and specific conductance. The meters were recalibrated every
three hours or every third site, depending upon which came first. The meter
electrodes were rinsed with de-ionized water before and after each
measurement.
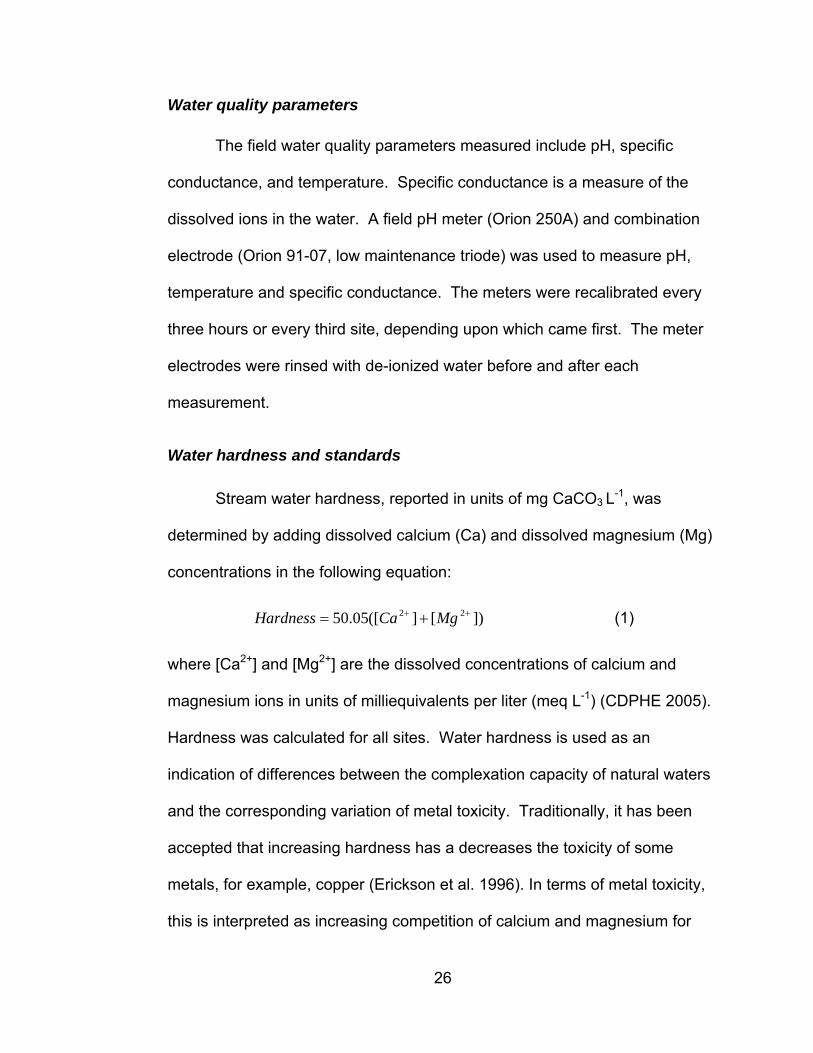
Water hardness and standards
Stream water hardness, reported in units of mg CaCO3 L-1, was
determined by adding dissolved calcium (Ca) and dissolved magnesium (Mg)
concentrations in the following equation:
])[]([05.50 22 ++ += MgCaHardness (1)
where [Ca2+] and [Mg2+] are the dissolved concentrations of calcium and
magnesium ions in units of milliequivalents per liter (meq L-1) (CDPHE 2005).
Hardness was calculated for all sites. Water hardness is used as an
indication of differences between the complexation capacity of natural waters
and the corresponding variation of metal toxicity. Traditionally, it has been
accepted that increasing hardness has a decreases the toxicity of some
metals, for example, copper (Erickson et al. 1996). In terms of metal toxicity,
this is interpreted as increasing competition of calcium and magnesium for
26

metal binding sites on the gills of invertebrates or cell membranes (Paquin et
al. 2002). Using mean hardness values, appropriate Colorado of Public
Health and the Environment (CDPHE) chronic (thirty day exposure) and acute
(one-day exposure) aquatic life table value standards (TVS) for zinc, copper,
and lead can be determined. The CDPHE requires use of the mean hardness
during low flow season where there is insufficient paired hardness and flow
data. Mean hardness values from the spring sampling event were used to
calculate appropriate TVS values. Standard deviations and relative standard
deviations were recorded for mean hardness values calculated for each
creek. Using CDPHE equations in Table 5, appropriate chronic and acute
values for zinc, copper, and lead were calculated.
Table 5. Colorado Department of Public Health and the Environment hardness-based equations for chronic and acute value standards for copper, zinc, and lead.
Metal Acute Value (μg L-1)
Zn }0617.1)][ln(8525.0{978.0 +hardnesse
Cu }7408.1)][ln(9422.0{ −hardnesse
Pb }46.1)][ln(273.1{]}145712.0)[ln(46203.1{ −− hardnessehardness
Metal Chronic Value (μg L-1)
Zn }9109.0)][ln(8525.0{986.0 +hardnesse
Cu }7428.1)][ln(8545.0{ −hardnesse
Pb }705.4)][ln(273.1{]}145712.0)[ln(46203.1{ −− hardnessehardness
27

Benthic macroinvertebrate sampling and analysis
Sampling for macroinvertebrates occurred from June 15 to August 2,
2005. Specific dates of sampling for each site along Lefthand, James, and
Little James Creeks are presented in Appendix A. Prior to the collection of
macroinvertebrates, we selected sites along Lefthand, James, and Little
James Creek for monitoring the emergence of Archtopsyche grandis.
Archtopsyche grandis was collected based on its known metal tolerance in
Rocky Mountain streams (Clements and Kiffney 1994). Once it was
determined the target species was present, collection was planned to
progress from lower elevations to higher elevations. This pattern of collection
was based on the emergence patterns of Archtopsyche grandis (LaFontaine
1981). Throughout the entire month of May, the streambeds of sites LH1,
LH7, LH13, LH19, J14, J9, LJ1, LJ10 and LJ13 (Figure 7) were searched
thoroughly for Archtopsyche grandis. We were not able to find signs of
Archtopsyche grandis at either low or high elevations during the entire month
of May; therefore, we decided that representative samples of
macroinvertebrates found at each site would be collected instead of the
individual target species.
Macroinvertebrate collection followed the methods defined in section
3.8.2 of the EPA’s rapid bioassessment protocol (Barbour et al. 1999). These
methods were originally developed for collection of macroinvertebrates for
taxonomic identification. At each field site, streambed sediments and rocks
were kicked and flipped to allow for release of benthic macroinvertebrates into
28

a rectangular kick net. A 30 m stretch of the streambed was sampled from
downstream to upstream in a zig-zag pattern. We periodically emptied the
kick nets into plastic buckets and then transferred portions of the buckets onto
white plastic trays for macroinvertebrate collection. The macroinvertebrates
were collected with plastic forceps and rinsed with deionized water to remove
attached metals and weighed with a battery-powered field balance. A total
wet weight of at least 5 g of benthic macroinvertebrates was collected at each
sampling location. Duplicate samples were collected at every tenth location.
The samples were stored in glass jars and stored on dry ice for transport to
the University of Colorado at Boulder. In the laboratory, the samples were
stored in a laboratory freezer at 5ºC until further analysis.
The digestion of macroinvertebrates followed the methods outlined in
Clements and Kiffney (1994). The samples were dried at 55ºC for 8-10 h.
The total dry weight was recorded and the samples were transferred into 50
mL polypropylene centrifuge tubes. Once in the tubes, the digestion solution
(15 mL), a 1:1 solution of a trace metal-grade concentrated (15.8 M) HNO3
(Fisherbrand) and H2O2 (30 % by volume, Fisherbrand) and deionized water
(10 mL) was added. Samples were placed in a shaking warm water bath
(Sheldon Manufacturing, model 1227) at 60 ºC and shaken at 120 rpm for 2 h.
The samples were removed from the bath and allowed to settle by gravity for
approximately 12 h. 7.5 mL of the supernatant was withdrawn using a 5 mL
Fisherbrand pipette (5 mL and 2.5 mL aliquots) and placed in acid washed
250 mL polypropylene sample bottles for shipping for analysis of metal
29

concentrations. The analytes that were measured and their methods of
analysis are similar to the methods for total and dissolved metals in the water
samples (Table 4). A blank without macroinvertebrates was carried through
the same digestion procedure.
DOC was measured because of its direct correlation with metal
bioaccumulation in the caddisfly Arctopsyche grandis in metal-polluted
streams (Prusha and Clements 2004). Water samples to be analyzed for
dissolved organic carbon (DOC) were taken at each site and stored in 1 L
amber-colored glass bottles. The samples were stored on ice and
transported to the University of Colorado where they were filtered in a 500 mL
Nalgene filter apparatus with a 0.45 μm, Magna, nylon, supported, grid
membrane using vacuum extraction. The filtrate was acidified using
phosphoric acid (85%, Fisherbrand) to a pH < 4 and stored in a laboratory
refrigerator until future analysis. DOC was measured using a total organic
carbon (TOC) analyzer (Ionic-Sievers, model 800) by the persulfate-ultraviolet
oxidation method (Clesceri et al. 1999).
Sediment sampling and analysis
In order to minimize sediment transport in the streams, which would
affect the correlation of metals in sediments to metal sources, we conducted
the sediment sampling in the fall. Mountain streams show characteristic low
flows during the fall. The low flow conditions would give us the best chance of
retaining contaminated sediments nearest to their original sources. Our aim
was to collect sediments right after a large storm event, but this event did not
30

occur and due to time constraints, sampling commenced in late September.
Stream bed sediments were collected from all locations in which water and
macroinvertebrates had been collected from September 24 to October 17,
2005. Specific dates of collection for each site can be found in Appendix E.
The sample collection and partial digestion methods used were outlined by
Church et al. (1997). These sites were chosen based on previous studies
indicating large percentages of fine particles (Wood 2003). Triplicate samples
were taken at field sites LJ1, LJ8, LJ9 and LJ11.
A volume of approximately 1 L of sediment was collected at each site.
Each sample consisted of five to ten sub-samples collected within a 15 m
area. Sediment was collected mainly in depositional areas which were
covered by flow, and only from the upper 5 cm of the stream bed. The entire
sediment sample was wet-sieved in the field through a 4.0 mm (5 mesh)
brass sieve and stored in polyethylene bottles on ice for transport. All
samples were oven-dried at 100 °C within 24 h of collection and dry-sieved
for 30 min with a sieve shaker (W.S. Tyler Company, Ro-tap) through a nest
of stainless steel sieves (2.36mm > 1.70 mm > 1 mm > 500 μm > 125 μm >
63 μm > in order to collect the <63 μm size fraction. Individual samples from
field sites LJ4, LJ5, LJ6, LJ10 and J3 were divided into three parts and
analyzed separately to assess the reproducibility of the analysis method.
Samples from field sites LJ7 and LJ13 were separated into five sub-samples
of 0.25, 0.5, 0.75, 1 and 1.25 g and analyzed to test the accuracy of the
analysis method using varying masses of sediment.
31

A partial digestion was employed to extract leachable ore-related
metals associated with mine wastes from the sediments (Church et al. 1997).
Sterilized 50 mL centrifuge tubes were filled with 1.0 g (±0.1 g) of sediment
from a single sample (with the exception of the five varying weights from LJ7
and LJ13). To each centrifuge tube, 1.5 M trace metal-grade HNO3 (20 mL;
Fisherbrand) and 30% H2O2 (0.2 mL; Fisherbrand) were added. The tubes
were capped, briefly hand-shaken to mix, placed in racks, and shaken at 120
rpm in a hot water bath (Sheldon Manufacturing, model 1227) at 55 - 60 °C.
The samples were centrifuged at 800 rpm for 10 min to segregate remaining
sediment from the digestion solution, and the supernatant was removed and
placed in sterilized 25 mL polypropylene centrifuge tubes. The partial
digestion solutions were analyzed for zinc, copper, and lead by inductively-
coupled plasma-atomic emission spectrophotometry (ICP-AES) in the
Laboratory for Environmental and Geological Studies (LEGS) at the
University of Colorado at Boulder. The metal concentrations in the solutions
were converted to mass of metals per mass of sediment using the recorded
dry weights and dilution factors.
Characterization of Waste Rock Piles
We collected samples from twelve waste rock piles in the Lefthand and
Little James Creek watersheds (Table 6). Each waste rock pile was divided
into a thirty-cell grid of approximately equal area. Equal amounts of sample
(approximately 1 kg) were taken from each cell to obtain a total composite
sample. The samples were air-dried and sieved through a 2 mm nylon mesh
32

screen. Background samples were taken in areas upstream and west of
known historical mining activity and in close proximity to the investigated
stream.
Table 6. Locations of waste rock piles in Lefthand Creek watershed.
site code site name latitude
º, ‘, “ longitude
º, ‘, “
Lefthand Creek 5560-REF Lefthand reference 40 04 09.3 N 105 31 00.7 W
5560-DD Dew Drop 40 03 52.8 N 105 30 56.0 W
5560-WR White Raven (whole pile) 40 03 34.3 N 105 23 48.7 W
5560-WR White Raven (yellow pile) 40 03 34.3 N 105 23 48.7 W
5560-CT Corning Tunnel 40 04 30.0 N 105 24 19.0 W
5560A-UWRP Upper Slide Pile 40 04 28.2 N 105 23 59.4 W
5560A-LWRP Lower Slide Pile 40 04 28.3 N 105 23 59.4 W
Little James Creek
5562-REF Little James Reference 40 08 12.2 N 105 24 41.6 W
5562-ES Evening Star 40 07 56.0 N 105 24 15.6 W
5562 - AR Argo Mine 40 07 44.75 N 105 24 07.0 W
5562-EM Emmett Mine 40 07 35.30 N 105 23 57.0 W
5562-JR JRT 40 07 27.03 N 105 23 52.4 W
5562-BU Bueno Mine 40 06 43.8 N 105 25 22.2 W
In order to characterize metal content of the waste rock samples, an
elutriation process was employed. EPA Method 1312, a synthetic leaching
procedure which includes a partial digestion, was developed by the EPA to
evaluate the degree of contamination and mobility of metals in mine waste.
The waste rock pile study used an alternate field leach method which relies
on the solubility of minerals to reduce testing time and costs (Hageman and
Briggs 2000; Hageman 2004).
33

Metals were elutriated from the waste rock samples (<2 mm grain size)
by combining 50 g of dry sediment with 1000 mL of high-purity water at pH
5.7 in a glass Erlenmeyer flask, vigorously shaken for 5 min, and allowed to
settle for 10 min. The supernatant was removed and divided into two
samples. One of the samples was acidified to a pH <1.5 with HNO3 and used
to identify total metals similarly to those methods used for water and
macroinvertebrate samples. The second sample was filtered through a 0.45
μm diameter nitro-cellulose filter. The filtered samples were also acidified to
pH <1.5 with HNO3. Metal concentrations in the samples were measured by
ICP-AES for all metals and by ICP-MS for metals measured as below
detection limits for ICP-AES. Samples were analyzed for Al, Sb, As, Ba, Be,
Cd, Ca, Cr, Co, Cu, Fe, Pb, Mg, Mn, Hg, Ni, K, Se, Ag, Na, Tl, and Zn by an
EPA laboratory.
Sediments were also collected for a partial digestion following the
Church et al. (1997) method. A 1 L sample of sediment (<2 mm grain size)
was collected, dried at 100ºC and sent to a EPA laboratory for digestion and
metals analysis. Samples were digested using EPA Method 200.2 which
uses a combination of nitric and hydrochloric acid to determine total
recoverable elements (USEPA 1991).
Tabulated results for water quality data and metal concentrations in water,
macroinvertebrates and sediments can be found in Appendices A-D.
Appendix A contains pH, specific conductance, and dissolved organic carbon
(DOC) measured at each site. Appendix B contains concentrations for total
34

and dissolved zinc, copper, and lead concentrations in water samples.
Appendix C contains zinc, copper, and lead concentrations in benthic
macroinvertebrates and Appendix D contains zinc, copper, and lead
concentrations within streambed sediments.
Water quality measurements – pH, temperature, and specific
conductance
Lefthand Creek pH values measured during the spring sampling period
ranged from 6.5 – 7.3 (Figure 8) with the minimum and maximum values
occurring at sites LH7 and LH15, respectively (Figure 7). Lefthand Creek pH
values all fell within the acceptable range according to CDPHE –Water
Quality Control Division (WQCD) standards for a Class I cold-water stream.
Site LH15 also held the highest specific conductance measurement of 115
μS cm-1 (Figure 8), while the lowest measurement of 25.2 μS cm-1 occurred at
site LH4. The average temperature in Lefthand Creek was 12.0±1.2ºC with
the uncertainty representing one standard deviation of the mean temperature.
The pH in James Creek ranged from 6.1 – 6.9. Out of fourteen field
sites along James Creek, ten of those exhibited pH values below the
acceptable range according to CDPHE standards (Figure 9). Specific
conductance increased steadily from 20.5 μS at field site J1 above the Peak
to Peak Highway to 33.6 μS cm-1 at field site J14, just above the confluence
with Little James Creek. The average stream water temperature was 13.9 ±
2.1ºC.
35

Little James Creek exhibited the lowest pH and the highest specific
conductance and temperature values of the three creeks (Figure 10).
pH
4
5
6
7
8
9
10 pH CDPHE minimum standardCDPHE maximum standard
Lefthand Creek Distance Downstream (km)
0 5 10 15 20 25 30
spec
ific
cond
ucta
nce
(uS
cm
-1)
0
20
40
60
80
100
120
140
Peak
to P
eak
Hw
yD
ew D
rop
Min
e tr
ibB
ig F
ive
Tunn
el D
isch
arge
Whi
te R
aven
Indi
ana
Gul
ch
unna
med
trib
- so
uth
unna
med
trib
- so
uth
Sprin
g G
ulch
Lick
Ski
llet G
ulch
Slid
e M
ine
Row
ena
Nug
get G
ulch
Lee
Hill
Gul
ch
Jam
es C
reek
unna
med
trib
- so
uth
off-r
oad
vehi
cle
area
Car
nage
Can
yon
Sixm
ile C
reek
Spru
ce G
ulch
Hal
di w
ater
inta
ke
Figure 8. Lefthand Creek pH and specific conductance measured in the field during macroinvertebrate and water sampling (June 15 – August 2, 2005).
The pH values ranged from 5.4 - 6.7. The maximum specific
conductance was 1620 μS cm-1 downstream of the Burlington Mine. This
value is approximately eight times greater than the specific conductance of
36

the Little James Creek water sampled at the first site (209 μS cm-1). The
average stream water temperature was 16.7 ± 2.8ºC.
pH
4
5
6
7
8
9
10 pH CDPHE minimum standardCDPHE maximum standard
Pea
k to
Pea
k H
ighw
ay
Cou
nty
Roa
d 10
0
Cou
nty
Roa
d 10
2JJo
hn J
ay m
ine
Faird
ay M
ine
Bue
no M
tn g
ully
Wat
er T
mt P
lant
Littl
e Ja
mes
Cre
ek
Jam
esto
wn
Por
phyr
y G
ulch
Cur
ie S
prin
gs
Cas
tle G
ulch
Lefh
and
Cre
ek
James Creek Distance Downstream (km)
0 2 4 6 8 10 12 14 16 18 20 22
spec
ific
cond
ucta
nce
(μS
cm
-1)
0
10
20
30
40
Figure 9. James Creek pH and specific conductance measured in the field during macroinvertebrate and water sampling.
37

pH
4
5
6
7
8
9
10 pH CDPHE minmum standard CDPHE maximum standard
Little James Creek Distance Downstream (km)
0.0 0.5 1.0 1.5 2.0 2.5 3.0
spec
ific
cond
ucta
nce
(μS
cm-1
)
0
200
400
600
800
1000
1200
1400
1600
1800
Bac
kgro
und
refe
renc
e
Even
ing
Star
un-n
amed
was
te ro
ck p
ileAr
go M
ine
"Arg
o gu
lly"
Bal
arat
road
Burli
ngto
n M
ine
Emit
Min
e ad
it dr
aina
geBa
lara
t Cre
ek
min
e w
aste
pile
Stre
amsi
de ta
ilings
Buen
o M
tn. g
ully
Yel
low
girl
- nor
thW
ater
fall
Jam
es C
reek
con
fluen
ce
Figure 10. Little James Creek pH and specific conductance measured in the field during macroinvertebrate and water sampling.
Dissolved Organic Carbon
Upstream of the confluence with James Creek, the DOC concentration
measured in Lefthand Creek was approximately 2.8 mg L-1 (Figure 11).
38

Deviations from this value occurring just downstream of the confluence with
the Big Five tunnel drainage, where the DOC concentration increased to 3.3
mg L-1. Downstream of the confluence with James Creek, the DOC drops to
about 2 mg L-1.
Lefthand Creek Distance Downstream (km)
0 5 10 15 20 25 30
Dis
solv
ed O
rgan
ic C
arbo
n (m
g/L)
0
1
2
3
4
Peak
to P
eak
Hw
yD
ew D
rop
Min
e tr
ibB
ig F
ive
Tunn
el D
isch
arge
Whi
te R
aven
Indi
ana
Gul
ch
unna
med
trib
- so
uth
unna
med
trib
- so
uth
Sprin
g G
ulch
Lick
Ski
llet G
ulch
Slid
e M
ine
Row
ena
Nug
get G
ulch
Lee
Hill
Gul
ch
Jam
es C
reek
unna
med
trib
- so
uth
off-r
oad
vehi
cle
area
Car
nage
Can
yon
Sixm
ile C
reek
Spru
ce G
ulch
Hal
di w
ater
inta
ke
Figure 11. Lefthand Creek dissolved organic carbon represented with standard deviations determined from 5 samples taken by the TOC analyzer software (methods analysis).
The DOC concentration in James Creek ranges from 1.7 to 2.8 mg L-1
(Figure 10). The high end of the DOC concentration range occurs just
downstream of the John Jay Mine and the Bueno Mountain gully while the low
end occurs downstream of the confluence with James Creek.
39

James Creek Distance Downstream (km)
0 2 4 6 8 10 12 14 16 18 20
Dis
solv
ed O
rgan
ic C
arbo
n (m
g/L)
220.0
0.5
1.0
1.5
2.0
2.5
3.0
Pea
k to
Pea
k H
ighw
ay
Cou
nty
Roa
d 10
0
Cou
nty
Roa
d 10
2JJo
hn J
ay m
ine
Faird
ay M
ine
Bue
no M
ount
ain
gully
Wat
er T
reat
men
t Pla
nt
Littl
e Ja
mes
Cre
ek
Jam
esto
wn
Porp
hyry
Gul
ch
Cur
ie S
prin
gs
Cas
tle G
ulch
Lefh
and
Cre
ek
Figure 12. James Creek dissolved organic carbon represented with standard deviations determined from 5 samples taken by the TOC analyzer software (methods analysis).
The DOC concentrations measured along Little James Creek ranged
from 1.7-4.4 mg/L (Figure 11). The higher DOC concentrations in Little
James Creek can be attributed to low flow and the prevalence of wetlands
along parts of the creek. DOC decreases in areas of the stream where pH is
low and are most likely due to the type of organic acids composing the DOC.
40

Little James Creek Distance Downstream (km)
0.0 0.5 1.0 1.5 2.0 2.5
Dis
solv
ed O
rgan
ic C
arbo
n (m
g/L)
3.00
1
2
3
4
5
Back
grou
nd re
fere
nce
Even
ing
Star
un-n
amed
was
te ro
ck p
ileAr
go M
ine
"Arg
o gu
lly"
Bal
arat
road
Burli
ngto
n M
ine
Emit
Min
e ad
it dr
aina
geB
alar
at C
reek
min
e w
aste
pile
Stre
amsi
de ta
iling
sBu
eno
Mtn
. gul
lyY
ello
wgi
rl - n
orth
Wat
erfa
ll ab
ove
conf
luen
ce
Jam
es C
reek
con
fluen
ce
Figure 13. Little James Creek dissolved organic carbon represented with standard deviations determined from 5 samples taken by the TOC analyzer software (methods analysis).
The DOC concentrations reported in this section are the averages of 5
samples recorded by the TOC analyzer. The standard deviations of individual
samples are indicated in Figure 11, Figure 12 and Figure 13 with error bars.
The relative standard deviation (RSD), for the entire data set (three creeks),
ranged from 0-2% for al metals in all 3 creeks.
Hardness and standards
In Lefthand Creek, hardness increased downstream of the Big Five
Tunnel and in the area of the Slide Mine. Hardness was diluted by about a
factor of three by the addition of the James Creek water (Figure 14). In
James Creek, hardness increased with distance (Figure 15). The James
41

Creek water was the softest of three creeks. In Little James Creek, the
hardness peaks just downstream of the flows from the Burlington and Emmit
Mines (Figure 16). The hardness downstream of Balarat Creek can be
attributed to fluorite (CaF2) which was extracted from this area during
previous mining activities.
Lefthand Creek distance downstream (km)
0 5 10 15 20 25 30
Har
dnes
s (m
g/L
Ca
CO
3)
0
10
20
30
40
Peak
to P
eak
Hw
yD
ew D
rop
Min
e tr
ibB
ig F
ive
Tunn
el D
isch
arge
Whi
te R
aven
Indi
ana
Gul
ch
unna
med
trib
- so
uth
unna
med
trib
- so
uth
Sprin
g G
ulch
Lick
Ski
llet G
ulch
Slid
e M
ine
Row
ena
Nug
get G
ulch
Lee
Hill
Gul
ch
Jam
es C
reek
unna
med
trib
- so
uth
off-r
oad
vehi
cle
area
Car
nage
Can
yon
Sixm
ile C
reek
Spru
ce G
ulch
Hal
di w
ater
inta
ke
Figure 14. Hardness calculated from magnesium and calcium concentrations in Lefthand Creek for samples taken from June 15-July 22, 2005.
42
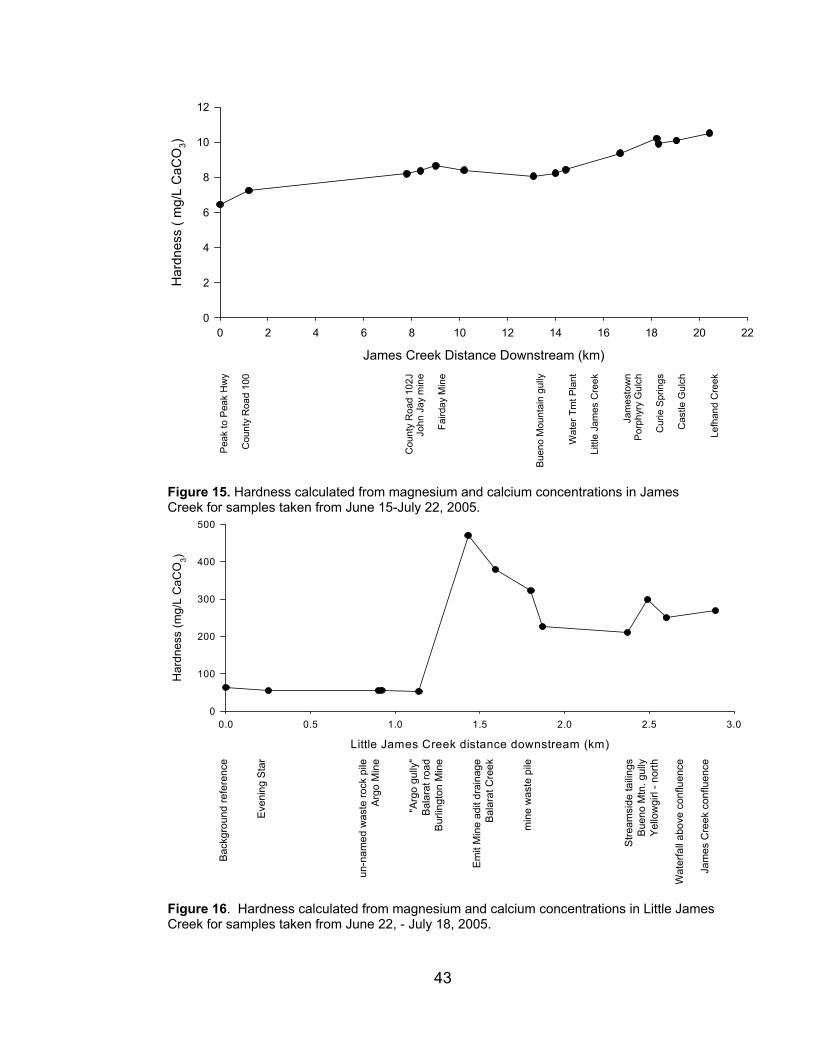
James Creek Distance Downstream (km)
0 2 4 6 8 10 12 14 16 18 20
Har
dnes
s ( m
g/L
CaC
O3)
220
2
4
6
8
10
12
Pea
k to
Pea
k H
wy
Cou
nty
Roa
d 10
0
Cou
nty
Roa
d 10
2JJo
hn J
ay m
ine
Faird
ay M
ine
Bue
no M
ount
ain
gully
Wat
er T
mt P
lant
Littl
e Ja
mes
Cre
ek
Jam
esto
wn
Por
phyr
y G
ulch
Cur
ie S
prin
gs
Cas
tle G
ulch
Lefh
and
Cre
ek
Figure 15. Hardness calculated from magnesium and calcium concentrations in James Creek for samples taken from June 15-July 22, 2005.
Little James Creek distance downstream (km)
0.0 0.5 1.0 1.5 2.0 2.5
Har
dnes
s (m
g/L
CaC
O3)
3.00
100
200
300
400
500
Bac
kgro
und
refe
renc
e
Eve
ning
Sta
r
un-n
amed
was
te ro
ck p
ileA
rgo
Min
e
"Arg
o gu
lly"
Bala
rat r
oad
Bur
lingt
on M
ine
Emit
Min
e ad
it dr
aina
geBa
lara
t Cre
ek
min
e w
aste
pile
Stre
amsi
de ta
iling
sB
ueno
Mtn
. gul
lyYe
llow
girl
- nor
th
Wat
erfa
ll ab
ove
conf
luen
ce
Jam
es C
reek
con
fluen
ce
Figure 16. Hardness calculated from magnesium and calcium concentrations in Little James Creek for samples taken from June 22, - July 18, 2005.
43

Initially, the average chronic and acute TVSs were calculated for each
individual creek using the average hardness throughout the creek (Table 7).
Since hardness varied so much throughout each stream (especially Lefthand
Creek), we decided to calculate the chronic CDPHE TVS for zinc, copper, and
lead at every site in the watershed. These standards are calculated using the
hardness-based equations provided in (Table 5).
Table 7. Acute and chronic table value standards (TVS) for aquatic life for zinc, copper, and lead in Lefthand, James, and Little James Creeks.
acute TVS chronic TVS
creek copper (μg L-1)
lead (μg L-1)
zinc (μg L-1)
copper (μg L-1)
lead (μg L-1)
zinc (μg L-1)
Lefthand Creek 4.2 9.4 44 3.5 0.15 38
James Creek 1.6 2.9 18 1.5 0.050 16
Little James Creek 31 95 268 22 1.5 232
Stream water iron
The concentrations of iron for Lefthand, James, and Little James
Creeks are represented in Figure 17, Figure 18, and Figure 19. The CDPHE
chronic aquatic life standard for iron is 1000 μg L-1. This standard is
exceeded in the Little James Creek only. The reaches of the stream where
this standard is exceeded includes the length of stream just downstream of
Argo Mine and above Porphyry tailings and the length of stream just
downstream of Bueno Mountain gully and just upstream of the confluence
with James Creek. In both James and Lefthand Creek, dissolved iron
remains fairly constant, this indicates that a majority of the iron is in the
44

colloidal form. The average colloidal percentage of iron in Lefthand Creek
was 63±10%, James Creek was 70±8%, and Little James Creek was
36±20%. The high standard deviation in Little James Creek was due to the
extreme differences in the magnitude of total and dissolved iron
concentrations between background and in the stream.
Background total and dissolved iron concentrations in Lefthand Creek
are higher than most in-stream water samples. The drop in iron
concentrations after the Big Five Tunnel drainage is uncharacteristic of this
area. These uncharacteristically low concentrations are most likely due to the
lack of flow coming from the drainage. Previous studies have documented
concentrations above the chronic aquatic life standard (1000 μg L-1) in this
area when the drainage has been flowing. Spikes in iron concentrations in
Lefthand Creek are seen downstream of Sixmile Creek, also the highest total
concentration measured at 277 μg L-1. The highest total iron concentrations
in Little James Creek are seen just downstream of Balarat Creek at 8,130 μg
L-1. The highest concentration of total iron in James Creek measured was
285 μg L-1 and occurred downstream of Curie Springs.
45

Peak
to P
eak
Hw
yD
ew D
rop
Min
e tr
ibB
ig F
ive
Tunn
el D
isch
arge
Puzz
ler G
ulch
Indi
ana
Gul
ch
unna
med
trib
- so
uth
unna
med
trib
- so
uth
Sprin
g G
ulch
Lick
Ski
llet G
ulch
Slid
e M
ine
Row
ena
Nug
get G
ulch
Lee
Hill
Gul
ch
Jam
es C
reek
unna
med
trib
- so
uth
off-r
oad
vehi
cle
area
Car
nage
Can
yon
Sixm
ile C
reek
Spru
ce G
ulch
Hal
di w
ater
inta
ke
Lefthand Creek distance downstream (km)
0 5 10 15 20 25 30
Iron
(μg/
L)
0
50
100
150
200
250
300
Figure 17. Total (•) and dissolved (#) iron along the length of Lefthand Creek. The chronic aquatic life standard for iron is 1000 μg L-1, which was not exceeded.
James Creek distance downstream (km)
0 2 4 6 8 10 12 14 16 18 20 22
Iron
(μg/
L)
0
50
100
150
200
250
300
Pea
k to
Pea
k H
ighw
ay
Cou
nty
Roa
d 10
0
Cou
nty
Roa
d 10
2JJo
hn J
ay m
ine
Faird
ay M
ine
Bue
no M
ount
ain
gully
Wat
er T
reat
men
t Pla
nt
Littl
e Ja
mes
Cre
ek
Jam
esto
wn
Por
phyr
y G
ulch
Cur
ie S
prin
gs
Cas
tle G
ulch
Lefh
and
Cre
ek
Figure 18. Total (•) and dissolved (#) iron along the length of James Creek. The chronic aquatic life standard for iron is 1000 μg/L, which was not exceeded.
46

Little James Creek distance downstream (km)
0.0 0.5 1.0 1.5 2.0 2.5 3.0
Iron
(μg/
L)
0
2000
4000
6000
8000
10000
Back
grou
nd re
fere
nce
Eve
ning
Sta
r
un-n
amed
was
te ro
ck p
ileAr
go M
ine
"Arg
o gu
lly"
Bala
rat r
oad
Bur
lingt
on M
ine
Em
it M
ine
adit
drai
nage
Bala
rat C
reek
min
e w
aste
pile
Stre
amsi
de ta
ilings
Bue
no M
tn. g
ully
Yel
low
girl
- nor
thW
ater
fall
abov
e co
nflu
ence
Jam
es C
reek
con
fluen
ce
Figure 19. Total (•) and dissolved (#) iron along the length of Little James Creek. The chronic aquatic life standard for iron is 1000 μg L-1, which was not exceeded.
Stream water zinc, copper, and lead concentrations
The single field blank concentrations for zinc, copper, and lead were
mostly below detection limits (Table 8). Total copper and dissolved lead
concentrations in the field blanks were reported as values above, but very
close to the detection limits.
For all of the cases where the dissolved concentrations are higher than
the total, the dissolved will be used in place of the total. In these cases, it
was suggested by EPA laboratory managers that this would indicate
concentrations measured near detection limits. The detection limits were not
reported by the EPA laboratory on the concentration data reports.
Concentrations below detection limits were indicated with a flag (yes – below,
no – above). Multiple efforts to obtain the exact limits were not successful
47

because the detection limits changed with each run of approximately 50
samples.
Table 8 Field blank metal concentrations measured at site LJ7. BDL is below detection limits. Because total lead was below detection limits, and dissolved lead was not, we can assume that dissolved lead is close to detection limits.
Metal Total (μg L-1) Dissolved (μg L-1)
Copper 5 BDL Zinc BDL BDL Lead BDL 2.8
Lefthand Creek water –zinc, copper, and lead concentrations
Total lead in Lefthand creek ranged from 0.25-4.6 μg L-1, with the
maximum concentration occurring just downstream of Slide Mine (Figure 20).
The dissolved fraction of samples was high for all three metals in Lefthand
Creek. Dissolved copper averaged approximately 79% of the total copper,
and zinc averaged 80%. The fraction of dissolved lead was not estimated
because so many of the lead concentrations were measured below detection
limits.
Concentrations of dissolved copper and zinc exceeded chronic TVSs
in Lefthand Creek. For zinc, the exceedance occurred at sites just
downstream the Big Five tunnel drainage and White Raven Mine site. Lead
concentrations exceeded the chronic TVS at all sites including the
background site. Copper exceeded the chronic TVS downstream of the Big
Five tunnel drainage, White Raven Mine site and downstream of the Slide
Mine.
48

Lefthand Creek Distance Downstream (km)
Cop
per (μ g
/L)
0
5
10
15
20
25
30
Lead
(μg/
L)
0
2
4
6
8
10
Zinc
(μg/
L)
0
20
40
60
80
100
120
Peak
to P
eak
Hw
yD
ew D
rop
Min
e tr
ibB
ig F
ive
Dis
char
gePu
zzle
r Gul
chIn
dian
a G
ulch
unna
med
trib
- so
uth
unna
med
trib
- so
uth
Sprin
g G
ulch
Lick
Ski
llet G
ulch
Slid
e M
ine
Row
ena
Nug
get G
ulch
Lee
Hill
Gul
ch
Jam
es C
reek
unna
med
trib
- so
uth
off-r
oad
vehi
cle
area
Car
nage
Can
yon
Sixm
ile C
reek
Spru
ce G
ulch
Hal
di w
ater
inta
ke
Figure 20. Total (•) and dissolved (#) zinc, copper, and lead concentrations in Lefthand Creek during June 15-July 22, 2005. Closed circles represent total metals, open circle represent dissolved metals and chronic standards are a function of hardness and are represented by dashed lines.
James Creek water – zinc, copper, and lead concentrations
The maximum total concentrations for copper, zinc, and lead were
lowest in James Creek (Figure 21). Zinc was present mostly in the dissolved
form (76%). Chronic standards were never exceeded for Zn. The maximum
49

concentration of copper in James Creek occurred just downstream of the
Bueno Mountain gully and exceeded chronic table value standards here as
well.
Lead concentrations were also fairly low compared to other creeks in
the watershed; however, the chronic standard was exceeded at all times
because the stream water is so soft. Total lead concentrations ranged from
0.36-0.73 μg L-1 and colloidal concentrations were highest among all metals
(75%). Most dissolved concentrations measured below detection limits,
which is why the trends for lead in Figure 25 are dominated by total
concentrations and not dissolved.
Dissolved concentrations in James Creek comprised most of the total
samples for zinc, copper, and lead. This is somewhat uncertain for lead
because of a majority of the samples measured close to detection limits. The
average percentage of dissolved Cu per sample was 67%.
50

James Creek Distance Downstream (km)
Cop
per (μ g
/L)
0
3
6
9
12
15
18
21
Pea
k to
Pea
k H
ighw
ay
Cou
nty
Roa
d 10
0
Cou
nty
Roa
d 10
2JJo
hn J
ay m
ine
Faird
ay M
ine
Bue
no M
ount
ain
gully
Wat
er T
reat
men
t Pla
nt
Littl
e Ja
mes
Cre
ek
Jam
esto
wn
Por
phyr
y G
ulch
Cur
ie S
prin
gs
Cas
tle G
ulch
Lefh
and
Cre
ek
0 2 4 6 8 10 12 14 16 18 20 22
Lead
(μg/
L)
0
1
2
3
4
Zinc
(μg/
L)
0
4
8
12
16
20
Figure 21. Total (•) and dissolved (#) zinc, copper, and lead concentrations in James Creek during July 1- August 1, 2005. Black closed circles represent total metals, open circle represent dissolved metals, grey closed circles are below detection limits and chronic standards are represented by dashed lines.
Little James Creek water – zinc, copper, and lead concentrations
The highest concentrations of zinc, copper, and lead occurred along
Little James Creek (Figure 22). Concentrations of total zinc ranged from 95.4
to 1440 μg L-1 with the peak total zinc concentration occurring just
downstream of Balarat Creek, which delivers the acid mine drainage from the
51
Burlington Mine to Little James Creek. Both lead and zinc concentrations
show similar trends to each other along James Creek with background levels
at site locations upstream of Argo Mine increasing concentrations
downstream. Both lead and zinc reach peak concentrations after the
Burlington Mine and Emmit Mine adit and decline before entering Jamestown.
Copper concentrations at the background reference point are below the
detection limit. Approximately 0.25 km downstream from the reference site
and downstream of the Evening Star Mine, total copper climbs to 48 μg L-1.
At this site, total zinc claims the highest concentration at 117 μg L-1, while
lead is still below detection limits.
Zinc and copper exceeded both chronic and acute standards
periodically along Little James Creek. As with both James and Lefthand
Creek, Little James Creek always exceeds the chronic standard for lead.
High concentrations of metals are indicative of a low flow stream such as
Little James Creek.
52

Little James Creek Distance Downstream (km)
Cop
per (μ g
/L)
0
50
100
150
200
0.0 0.5 1.0 1.5 2.0 2.5 3.0
Lead
(μg/
L)
0
50
100
150
200
Zinc
(μg/
L)
0
500
1000
1500
2000
Back
grou
nd re
fere
nce
Even
ing
Star
un-n
amed
was
te ro
ck p
ileA
rgo
Min
e
"Arg
o gu
lly"
Bala
rat r
oad
Burli
ngto
n M
ine
Em
it M
ine
adit
drai
nage
Bal
arat
Cre
ek
min
e w
aste
pile
Stre
amsi
de ta
iling
sB
ueno
Mtn
. gul
lyYe
llow
girl
- nor
thW
ater
fall
abov
e co
nflu
ence
Jam
es C
reek
con
fluen
ce
Figure 22. Total (•) and dissolved (#) zinc, copper, and lead concentrations in Little James Creek during June 22, - July 18, 2005. Closed circles represent total metals, open circle represent dissolved metals and chronic standards are represented by dashed lines.
Benthic macroinvertebrate metal concentrations
In order to avoid complexity of species diversity within each individual
site sample, as well as to save time in the field, local taxonomic evaluations
were not completed. Metal concentrations are discussed in terms of the
entire sample comprised of many individual species representative of each
53

field site. However, in the case of Little James Creek, a majority of the sites
were inhabited by a single species, the caddisfly, Dicosmoecus atripes. In
this case, metal concentrations will be discussed in terms of the individual
species where appropriate. Little James Creek was also unique in its lack of
benthic macroinvertebrates at seven out of thirteen sites. Benthic
macroinvertebrate metal concentrations are discussed in mg kg-1 sample with
the sample consisting of multiple individuals and entire body. Laboratory
blanks did not indicate confounding effects of the reagents used to digest the
benthic macroinvertebrates. This was deduced by concentrations for copper,
zinc, and lead measuring below detection limits. Duplicate sample locations
are identical to those taken for stream water in each creek and are
represented once again on the associated figures.
Background concentrations are reported for comparison for each creek
in Table 9 below. Background concentrations for lead are lowest for all
streams. However, in Little James Creek, lead is substantially higher than in
Lefthand and James Creeks. Lead measured at the James Creek
background site was below detection limits.
Table 9 Benthic macroinvertebrate background concentrations measured at sites void of previous mining activities. BDL – Below Detection Limits.
Creek Site Name Cu (μg g-1) Pb (μg g-1) Zn (μg g-1) Lefthand LH1 44.9 0.63 387
James J1 33.6 BDL 251 Little James LJ1 27.5 21.7 267
54

Lefthand Creek benthic macroinvertebrates – zinc, copper, and lead
The concentrations of metals in the benthic macroinvertebrates in
Lefthand Creek increased in the order of zinc > copper > lead (Figure 23).
Duplicate samples taken at site LH10, downstream of Spring Gulch, indicated
excellent reproducibility of results for the benthic macroinvertebrate analysis
as indicated in Figure 23.
Zinc concentrations in benthic macroinvertebrates steadily increased
from 390 μg g-1 at the reference site, north of Peak to Peak Highway, to 1300
μg g-1 downstream of the Big Five tunnel drainage (LH5). The zinc
concentration in benthic macroinvertebrates upstream of the White Raven
Mine at site (LH6, 0.2 km downstream of LH5) decreased to 1100 μg g-1. The
zinc concentration in benthic macroinvertebrates increased again to 2000 μg
g-1 from site LH6 to downstream of the White Raven Mine (LH7). The zinc
concentration in benthic macroinvertebrates in California Gulch (sites LH3 –
LH8) was highest at Sawmill Road (site LH8, 2200 μg g-1). The highest zinc
concentrations in benthic macroinvertebrates were found between sites LH9
(above Lickskillet Road, 2400 μg g-1) and LH14 (downstream of Nugget
Gulch, 3100 μg g-1). Zinc concentrations in benthic macroinvertebrates
steadily decrease from site LH15 (downstream of Lee Hill Gulch, 2000 μg g-1)
to LH19 (above Haldi water intake, 830 μg g-1). The zinc concentration in
benthic macroinvertebrates at the furthest downstream site along Lefthand
Creek (above the Haldi water intake) was comparable to zinc concentration in
benthic macroinvertebrates downstream of the Dew Drop Mine.
55

The copper and lead concentrations in benthic macroinvertebrates at
the reference site were 45 μg g-1 and 0.6 μg g-1 respectively. Copper and
lead concentrations in benthic macroinvertebrates follow similar trends in
California Gulch (Figure 23). The increases and decreases in copper and
zinc concentrations in benthic macroinvertebrates from sites LH1 (above
Peak to Peak highway) to LH7 (downstream of the White Raven Mine) in
California Gulch are similar to those discussed for zinc. However, in contrast
to zinc, copper and lead concentrations in benthic macroinvertebrates
decrease from the site downstream of the White Raven Mine (copper – 670
μg g-1, lead - 27 μg g-1) to the site at Sawmill Road (copper – 290 μg g-1, lead
- 5.9 μg g-1).
The copper concentrations in benthic macroinvertebrates steadily
decline from the site just above Lickskillet Road (220 μg g-1) to the site above
the Haldi water intake (59 μg g-1). Just before the Haldi water intake, the
copper concentration in benthic macroinvertebrates is observed to be close to
the reference site concentration, with a difference of about 10 μg g-1 higher at
the intake.
Lead concentrations in benthic macroinvertebrates generally increase
from the site just above Lickskillet Road (7.0 μg g-1) to the site 5 km
downstream, downstream of the town of Rowena (16 μg g-1). Downstream of
Rowena the lead concentration in benthic macroinvertebrates generally
decreases from 16 μg g-1 to 5 μg g-1. The single deviation from this general
56

decrease in lead concentrations in benthic macroinvertebrates is indicated by
a small peak which occurs downstream of Lee Hill Gulch.
Lefthand Creek Distance Downstream (km)
Cop
per (μ g
/g)
0
200
400
600
800
0 5 10 15 20 25 30
Lead
(μg/
g)
0
5
10
15
20
25
30
Zinc
(μg/
g)
0
500
1000
1500
2000
2500
3000
3500
Peak
to P
eak
Hw
yDew
Dro
p M
ine
trib
Big
Fiv
e Tu
nnel
Dis
char
gePu
zzle
r Gul
chIn
dian
a G
ulch
unna
med
trib
- so
uth
unna
med
trib
- so
uth
Sprin
g G
ulch
Lick
Ski
llet G
ulch
Slid
e M
ine
Row
ena
Nug
get G
ulch
Lee
Hill
Gul
ch
Jam
es C
reek
unna
med
trib
- so
uth
off-r
oad
vehi
cle
area
Car
nage
Can
yon
Sixm
ile C
reek
Spru
ce G
ulch
Hal
di w
ater
inta
ke Figure 23. Zinc, copper, and lead concentrations measured in macroinvertebrates in Lefthand Creek from June 15, - July 22, 2005.
James Creek benthic macroinvertebrate – zinc, copper, and lead
Duplicate samples taken at sites J8 (downstream of the Jamestown
water treatment plant) and J13 (above the confluence with Lefthand Creek)
57

indicate excellent reproducibility of results for the benthic macroinvertebrate
laboratory analysis. These duplicates are difficult to see in
Figure 24 because of the overlaying of points. The results can also be found
in Appendix C, Table C. 4.
A unifying trend is observed between metal concentrations in benthic
macroinvertebrates in James Creek along the 10 km reach downstream of the
Bueno Mountain gully to the confluence with Lefthand Creek (Figure 24).
Zinc concentrations ranged from 250 – 1370 μg g-1 displaying a steady
increase from the background reference location at Peak-to-Peak Highway to
the confluence with Lefthand Creek.
Copper concentrations were among the lowest in the watershed
ranging from 34 μg g-1 (site J1, reference site at Peak to Peak highway) to
86 μg g-1(J12, downstream of Curie Springs). The second highest copper
concentrations in macroinvertebrates in James Creek occurs downstream of
County Road 102J (site J3, 84 μg g-1). Fluctuations in copper concentrations
in benthic macroinvertebrates were not observed for the stream reach
between and including sites J4 – J11.
Lead concentrations in benthic macroinvertebrates were significantly
lower in James Creek as compared to all other sites and creeks sampled in
the watershed. Lead concentrations in macroinvertebrates measured below
detection limits at six out of fourteen locations along James Creek. Lead
concentrations in benthic macroinvertebrates show a steady increase from
the site downstream of the Bueno Mountain gully (1.6 μg g-1) to the site just
58

above the confluence with Lefthand Creek (8.8 μg g-1). The tributaries and
discharges to James Creek along this reach include the Bueno Mountain
gully, Little James Creek, Porphyry Gulch, Curie Springs, and Castle Gulch.
James Creek Distance DOwnstream (km)
Cop
per (μ g
/g)
30
40
50
60
70
80
90
Pea
k to
Pea
k H
ighw
ay
Cou
nty
Roa
d 10
0
Cou
nty
Roa
d 10
2JJo
hn J
ay m
ine
Faird
ay M
ine
Bue
no M
ount
ain
gully
Wat
er T
reat
men
t Pla
nt
Littl
e Ja
mes
Cre
ek
Jam
esto
wn
Por
phyr
y G
ulch
Cur
ie S
prin
gs
Cas
tle G
ulch
Lefh
and
Cre
ek
0 2 4 6 8 10 12 14 16 18 20 22
Lead
(μg/
g)
0
4
8
12
16
20
Zinc
(μg/
g)
0
200
400
600
800
1000
1200
1400
1600
Figure 24. Zinc, copper, and lead concentrations measured in macroinvertebrates in James Creek from July 1, - August 1, 2005. Missing data points indicates levels measured below detection limits.
Little James Creek benthic macroinvertebrates – zinc, copper, and lead
The duplicate samples taken at site LJ5 (downstream of the Argo gully)
indicated moderate reproducibility of results for copper (160 and 140 μg g-1)
59

and zinc (210 and 160 μg g-1) concentrations in benthic macroinvertebrates
for Little James Creek (Table C. 6 and Figure 25). The same duplicate
samples indicated that the reproducibility of results for the lead concentration
in benthic macroinvertebrates was poor for Little James Creek (290 and 180
μg g-1).
The observed zinc concentration in benthic macroinvertebrates at the
reference site was 140 μg g-1 in Little James Creek was the lowest
background zinc concentration among the three investigated creeks. The
highest zinc concentration in benthic macroinvertebrates along Little James
Creek occurred just downstream of the Evening Star mine (1600 μg g-1). This
was the only site where zinc concentrations were found to be well above the
background concentration.
The observed background copper concentration in benthic
macroinvertebrates at the reference site was 14 μg g-1 and similar to the
background zinc concentration in Little James Creek, was the lowest
background copper concentration among the three investigated creeks. The
copper concentration in benthic macroinvertebrates increases from 14 μg g-1
at the reference site to 120 μg g-1 0.25 km downstream, downstream of the
Evening Star Mine. The concentration of copper in benthic
macroinvertebrates are highest between the downstream of the Argo Mine
tailings pile (170 μg g-1) and downstream of the Argo Mine (160 μg g-1).
There were no macroinvertebrates present from downstream of Balarat Creek
to just upstream of the Porphyry Mountain tailings pile.
60
The observed lead concentration in benthic macroinvertebrates at the
reference site was 11 μg g-1. Lead concentrations in benthic
macroinvertebrates remained near the background concentration for the first
0.92 km downstream of the reference site. The first significant increase in
lead concentrations in macroinvertebrates occurred just downstream of the
Argo Mine gully (duplicate samples, 290 μg g-1 and 180 μg g-1). The second
highest lead concentration in benthic macroinvertebrates in Little James
Creek occurred just upstream of the Porphyry Mountain tailings pile (210 mg
kg-1). Besides this record, trends are difficult to infer from the data with no
benthic macroinvertebrates at half of the sites. However, these sites may
indicate water quality impairment which directly effects aquatic life.
Between the Porphyry Mountain tailings pile and the confluence with
James Creek, only site LJ9 (0.5 km downstream of Porphyry Mountain
tailings and just upstream of “streamside tailings”) contained benthic
macroinvertebrate life. In relation to the closest upstream site sampled (LJ5,
downstream of Argo Mine), the concentration of zinc in benthic
macroinvertebrates decreased (160 to 140 μg g-1), copper in benthic
macroinvertebrates decreased (140 to 60 μg g-1), and lead in benthic
macroinvertebrates increased slightly (180 to 210 μg g-1).
61

Little James Creek (km)
Cop
per (μ g
/g)
0
50
100
150
200
Back
grou
nd re
fere
nce
Eve
ning
Sta
r
un-n
amed
was
te ro
ck p
ileArg
o M
ine
"Arg
o gu
lly"
Bal
arat
road
Burli
ngto
n M
ine
Emit
Min
e ad
it dr
aina
geBal
arat
Cre
ek
min
e w
aste
pile
Stre
amsi
de ta
iling
sBue
no M
tn. g
ully
Yel
low
girl
- nor
thW
ater
fall
abov
e co
nflu
ence
Jam
es C
reek
con
fluen
ce
0.0 0.5 1.0 1.5 2.0 2.5 3.0
Lead
(μg/
g)
0
100
200
300
400
Zinc
(μg/
g)
0
200
400
600
800
1000
1200
1400
1600
1800
Figure 25. Zinc, copper, and lead concentrations measured in macroinvertebrates in Little James Creek from June 22, - July 18, 2005. Missing data points indicates levels measured below detection limits. Upside down triangles represent sites with no macroinvertebrates present at the time of sampling.
Streambed sediment investigations
Widely accepted standards for metals in stream sediments do not exist
at this time. Background concentrations for the three investigated streams
are reported in Table 10 below. Little James and James Creeks have similar
background sediment concentrations, indicating similar geology, while
62

Lefthand Creek background concentrations are much less for all investigated
metals.
Table 10 Background metal concentrations were determined as areas upstream from any previously known mining activities.
Creek Cu (mg kg-1) Pb (mg kg-1) Zn (mg kg-1)
Lefthand Creek 12.3 26.3 35 James Creek 41.8 59.6 72.7
Little James Creek 48.3 64.8 77.4
Effects of mass on partial digestion efficiency
The results from the variable mass study at sites LJ13 (just above the
confluence with James Creek on Little James Creek) and LJ7 (just
downstream of Balarat Creek) indicate that the mass of copper removed from
the sediments using the partial digestion method does not depend upon the
mass of sediment digested. It was the assumption that the volumes of digest
solutions and their concentrations were enough to digest variable amounts of
mass (0.25 – 1.3 g), and if the sediments were homogeneous, the results
would be the same for each sample. Copper concentrations in sediments
were not dependent upon the mass of sediment digested as indicated by the
reported relative standard deviations (site LJ13, 1%; LJ7, 2%).
In contrast, the study suggests that the mass of zinc and lead
removed from the sediments using the partial digestion method do depend
upon the mass of sediment digested (Figure 26 and Figure 27). These
conclusions were made as a result of the high relative standard deviations
observed for zinc concentrations in sediments (site LJ13, 12%; site LJ7, 11%)
63

and lead concentrations in sediments (site LJ13, 12%; site LJ7, 9%) using
variable amounts of sediment mass.
These findings could possibly be attributed to the source of metals in
the stream. Zinc and lead may originate partially from mineral complexes
within the sediments while copper is more available and possibly loosely
adsorbed to mineral surfaces. When smaller amounts of mass are digested,
the surfaces are available for longer periods of time allowing more rigorous
contact with the digest solution and thus further breakdown of the mineral
complexes. An interesting future analysis may be to include variable times of
mixing to try and diminish the variance between masses of sediment
digested.
Site LJ 13 Variable mass digested
0.25 g
0.25 g
0.25 g
0.5 g
0.5 g
0.5 g
0.75 g
0.75 g
0.75 g
1.0 g
1.0 g
1.0 g
1.25 g
1.25 g
1.25 g
0.0
100.0
200.0
300.0
400.0
500.0
600.0
Zinc Copper Lead
Mass of dry sediment digested (g)
Met
al (m
g/kg
)
Figure 26. Effect of amount of sediment on metal releases from the sediment collected at site LJ13 (1.59 km) by the partial digestion method.
64

Site LJ7 Variable mass digested
0.25
0.25
0.25
0.50.5
0.5
0.750.75
0.75
1.01.0
1.0
1.251.25
1.25
0.0
100.0
200.0
300.0
400.0
500.0
600.0
Zinc Copper Lead
Mass of dry sediment digested (g)
Met
al (m
g/kg
)
Figure 27. Effect of amount of sediment on metal releases from the sediment collected at site LJ7 (2.89 km) by the partial digestion method.
Reproducibility of sediment methods using field and lab replicates
Field replicate samples taken at sites LH18 (at Buckingham Park), LJ1
(Little James Creek reference), LJ8 (upstream of Porphyry Mountain tailings
pile), LJ9 (downstream of Porphyry Mountain tailings pile) and LJ11
(downstream of “streamside tailings”) indicated uniformity of metals over the
sample area of all individual sites except for the concentration of copper in
sediment at site LJ1. At this site, copper concentrations in sediment ranged
from 20 mg kg-1 to 77 mg kg-1 with a high relative standard deviation of 54%.
The relative standard deviation among triplicate samples at site LJ1 among
zinc concentrations was 10% while the relative standard deviation among
65

lead concentrations was 5%. The other four sites had extremely low relative
standard deviations between samples for all metals ranging from 1-4%, which
indicated good reproducibility for field sampling.
Laboratory procedure replicates indicated good reproducibility of the
partial digestion method for sites LJ4 (upstream of the Argo Mine), LJ5
(downstream of the Argo Mine), LJ6 (upstream of Emmit Mine), LJ10
(upstream of the “streamside tailings” pile), and J3 (Downstream of tailings
pile, just upstream of John Jay Mine). Averages and standard deviations are
reported for each metal and indicate variations of metal concentrations within
individual samples (Table 11). Relative standard deviations for all metals of
all five samples were low, ranging from 1 – 4%, not including replicates from
the sample taken at site LJ10 which ranged between 5-10% (in the order lead
> zinc > copper). This indicates that samples were homogenous for the most
part and that the partial digestion methods produce consistent results.
Average metal concentrations will be used for these sites for the remaining
portions of the text in the appropriate sections.
Table 11 Laboratory method replicate metal concentrations (mg kg-1 dry weight) in streambed sediments collected at sites LJ4, LJ5, LJ6, LJ10 and J3.
Site Name Element LJ4 LJ5 LJ6 LJ10 J3 Zinc 1430 ± 40 39.7 ± 0.8 74.7± 1.7 289 ± 22 51.2 ± 1.3 Copper 1480 ± 50 14.4 ± 0.3 31.5 ± 0.9 243 ± 12 29.6 ± 0.4 Lead 253 ± 9 66.3 ± 0.6 137 ± 3 738 ± 71 65.2 ± 0.8
66

Lefthand Creek streambed sediments – zinc, copper, and lead
Similarities in metal concentration changes along Lefthand Creek are
observed between zinc, copper, and lead (Figure 28). The concentrations of
copper, zinc, and lead in the sediments downstream of California Gulch (11-
32 km) are represented separately in Figure 29 in order to observe the
distribution of the investigated heavy metals on a smaller scale.
In Lefthand Creek, zinc concentrations ranged from 35 mg kg-1 at the
reference site (site LJ1upstream of Peak to Peak highway) to 4900 mg kg-1
downstream of the White Raven Mine site (site LJ7). Copper concentrations
in the sediments ranged from 12 mg kg-1 at the reference site (site LJ1) to
4900 mg kg-1 downstream of the White Raven Mine site (site LJ7). Lead
concentrations in the sediments of Lefthand Creek ranged from 26 mg kg-1 at
the reference site (site LJ1) to 2600 mg kg-1 downstream of the White Raven
Mine site (site LJ7). The concentrations of zinc, copper, and lead in the
sediments downstream of the White Raven Mine site were the highest among
all sites tested in the watershed. Approximately 0.7 km downstream of the
White Raven Mine at Sawmill Road (site LJ8), all metal concentrations are
observed to be lower in the sediments. In Lefthand Creek at Sawmill Road,
the zinc concentration in the sediment is 5 times lower (950 mg kg-) than at
White Raven, 0.7 km upstream (LJ7), while the copper concentration in the
sediment is 7 times lower (670 mg kg-1), and the lead concentration in the
sediment is 10 times lower (260 mg kg-1). In California gulch, the fractions of
67
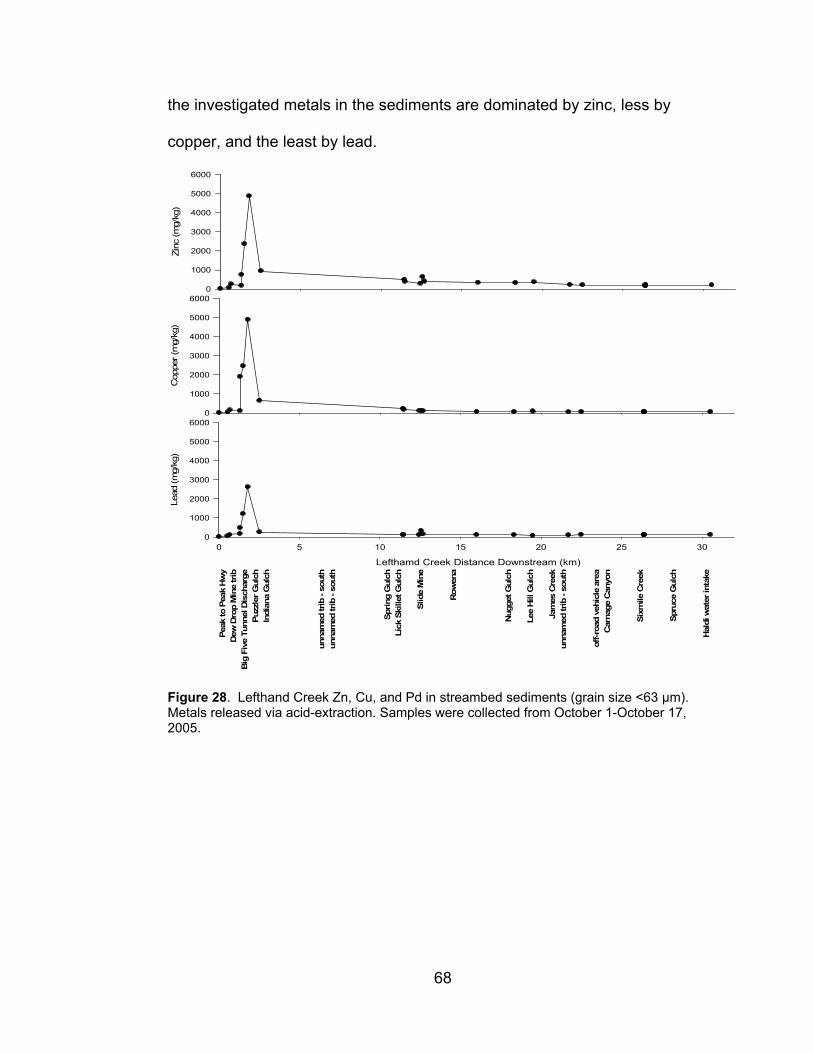
the investigated metals in the sediments are dominated by zinc, less by
copper, and the least by lead.
Lefthamd Creek Distance Downstream (km)
Cop
per (
mg/
kg)
0
1000
2000
3000
4000
5000
6000
Peak
to P
eak
Hw
yD
ew D
rop
Min
e tr
ibB
ig F
ive
Tunn
el D
isch
arge
Puzz
ler G
ulch
Indi
ana
Gul
ch
unna
med
trib
- so
uth
unna
med
trib
- so
uth
Sprin
g G
ulch
Lick
Ski
llet G
ulch
Slid
e M
ine
Row
ena
Nug
get G
ulch
Lee
Hill
Gul
ch
Jam
es C
reek
unna
med
trib
- so
uth
off-r
oad
vehi
cle
area
Car
nage
Can
yon
Sixm
ile C
reek
Spru
ce G
ulch
Hal
di w
ater
inta
ke
0 5 10 15 20 25 30
Lead
(mg/
kg)
0
1000
2000
3000
4000
5000
6000
Zinc
(mg/
kg)
0
1000
2000
3000
4000
5000
6000
Figure 28. Lefthand Creek Zn, Cu, and Pd in streambed sediments (grain size <63 μm). Metals released via acid-extraction. Samples were collected from October 1-October 17, 2005.
68

Lefthand Creek distance downstream (km)
11 13 15 17 19 21 23 25 27 29 31
Met
al c
once
ntra
tion
in s
edim
ents
(mg/
kg)
0
100
200
300
400
500
600
700
Copper (mg/kg) Lead (mg/kg) Zinc (mg/kg) Copper from Slide MineLead From Slide MineZinc from Slide Mine
Sprin
g G
ulch
Lick
Ski
llet G
ulch
Slid
e M
ine
Row
ena
Nug
get G
ulch
Lee
Hill
Gul
ch
Jam
es C
reek
unna
med
trib
- so
uth
off-r
oad
vehi
cle
area
Car
nage
Can
yon
Sixm
ile C
reek
Spru
ce G
ulch
Hal
di w
ater
inta
ke
Figure 29. Lefthand Creek (11-30 km) Cu, Zn and Pd in streambed sediments (grain size <63 μm). Metals released via partial digestion methods.
James Creek streambed sediments – zinc, copper, and lead
The concentrations of zinc in the sediments along James Creek
ranged from 42.3 mg kg-1 just downstream of Castle Gulch to 286 mg kg-1 just
upstream of the confluence with Lefthand Creek. Copper concentrations in
the sediments along James Creek ranged from 21.1 mg kg-1 downstream of
the treatment plant to 345.4 mg kg-1 just upstream of the confluence with
Lefthand Creek. Lead concentrations in the sediments along Lefthand Creek
ranged from 51.6 mg kg-1 just below Castle Gulch to 319 mg kg-1 just
upstream of the confluence with Lefthand Creek. The background reference
concentrations of metals in sediments sampled just upstream of Peak to Peak
highway were higher than concentrations measured downstream of known
abandoned mine and mill sites and waste rock piles. This site did show the
69

lowest metal concentrations in the stream water and benthic
macroinvertebrates and was expected to show the lowest metal
concentrations in sediments. These metal concentrations in the sediments
are most likely a result of the local mineralogy and geology in the watershed.
James Creek Distance Downstream (km)
Cop
per (
mg/
kg)
0
50
100
150
200
250
300
350
400
James Creek distance downstream (km)
0 2 4 6 8 10 12 14 16 18 20 22
Lead
(mg/
kg)
0
50
100
150
200
250
300
350
Zinc
(mg/
kg)
0
50
100
150
200
250
300
Pea
k to
Pea
k H
ighw
ay
Cou
nty
Roa
d 10
0
Cou
nty
Roa
d 10
2JJo
hn J
ay m
ine
Faird
ay M
ine
Bue
no M
ount
ain
gully
Wat
er T
reat
men
t Pla
nt
Littl
e Ja
mes
Cre
ek
Jam
esto
wn
Por
phyr
y G
ulch
Cur
ie S
prin
gs
Cas
tle G
ulch
Lefh
and
Cre
ek
Figure 30. James Creek Zn, Cu, and Pb in sediments (grain size <63 μm). Metals released via acid-extraction. Samples were collected between October 1, - October 17, 2005.
Little James Creek streambed sediments – zinc, copper, and lead
The concentrations of zinc in the sediments of Little James Creek ranged
from 40 mg kg-1 downstream of the Argo mine to 1400 mg kg-1 just upstream
70

of the Argo mine. The concentrations of copper in the sediments ranged from
14 mg kg-1 below the Argo Mine to 250 mg kg-1 just upstream of the
“streamside tailings.” The concentrations of lead in the sediments of Little
James Creek ranged from 60 mg kg-1 at the background reference location
(2.3 k m north of Jamestown) to 690 mg kg-1 just downstream of the
“streamside tailings” and the Bueno Mountain gully.
The concentrations of copper and zinc in the streambed sediments in Little
James Creek show distinctly similar increases and decreases along the entire
stream length. The minimum concentrations of copper and zinc occurred just
downstream of the Argo Mine. Near the confluence with James Creek,
concentrations of copper (50 mg kg-1) and zinc (80 mg kg-1) return to
concentrations measured at the background reference site, while lead
remains above background level concentrations (373 mg kg-1).
71

Little James Creek Distance Downstream (km)
Cop
per (
,g/k
g)
0
200
400
600
800
1000
1200
1400
1600
0.0 0.5 1.0 1.5 2.0 2.5 3.0
Lead
(mg/
kg)
0
100
200
300
400
500
600
700
800
Zinc
(mg/
kg)
0
200
400
600
800
1000
1200
1400
1600
Bac
kgro
und
refe
renc
e
Even
ing
Sta
r
un-n
amed
was
te ro
ck p
ileArg
o M
ine
"Arg
o gu
lly"
Bala
rat r
oad
Bur
lingt
on M
ine
Em
it M
ine
adit
drai
nage
Bala
rat C
reek
min
e w
aste
pile
Stre
amsi
de ta
ilings
Bue
no M
tn. g
ully
Yel
low
girl
- nor
thW
ater
fall
Jam
es C
reek
con
fluen
ce
Figure 31. Little James Creek Zn, Cu, and Pb in sediments (grain size <63 μm). Metals released via partial digestion method. Samples were collected on September 24, 2005.
Streambed sediments – <63 um grain size percentages
Interestingly, sites along the California Gulch segment of Lefthand
Creek which were characteristic of high sediment metal concentrations show
the lowest percentage of fine grain (<63 μm) size fractions. On the other
hand, along areas of Little James Creek where concentrations of the
investigated metals were also among the highest in the watershed, grain size
72

percentages of fine particles were the highest. These results indicate that
grain size percentage is intrinsic of the natural settings along and within the
stream and not metal contributions. Higher percentages of these finer grain
sizes may indicate higher sediment loading near these reaches of the stream.
Areas of possible sediment loading can be assessed by looking at the percent
of small grain sizes per sample (Looking at Figure 32, Figure 33 and Figure
34). Along Lefthand Creek these include areas above Peak to Peak highway,
downstream of Lickskillet Road, downstream of Slide Mine, downstream of
Lee Hill Road and Sixmile Creek. Along James Creek, we see elevated fine
grain size percentages downstream of County Road 102J, and along Ward
Road between Main Street and the Forest Service road with restricted access
(no motor vehicles). Little James Creek has the highest fine grain size
percentages on average and these incidences occur downstream of the Argo
Mine, Balarat Creek, and the “streamside tailings,.”
73

Lefthand Creek Distance Downstream (km)
0 5 10 15 20 25 30
% o
f <63
μm
sed
imen
ts in
sam
ple
0.0%
0.2%
0.4%
0.6%
0.8%
1.0%
Peak
to P
eak
Hw
yD
ew D
rop
Min
e tr
ibB
ig F
ive
Tunn
el D
isch
arge
Puzz
ler G
ulch
Indi
ana
Gul
ch
unna
med
trib
- so
uth
unna
med
trib
- so
uth
Sprin
g G
ulch
Lick
Ski
llet G
ulch
Slid
e M
ine
Row
ena
Nug
get G
ulch
Lee
Hill
Gul
ch
Jam
es C
reek
unna
med
trib
- so
uth
off-r
oad
vehi
cle
area
Car
nage
Can
yon
Sixm
ile C
reek
Spru
ce G
ulch
Hal
di w
ater
inta
ke
Figure 32. Left Hand Creek - percent of sediments that are <63μm in size.
James Creek Distance Downstream (km)0 5 10 15 20
% o
f <63
μm
sed
imen
ts in
sam
ple
0.0%
0.5%
1.0%
1.5%
2.0%
Pea
k to
Pea
k H
ighw
ay
Cou
nty
Roa
d 10
0
Cou
nty
Roa
d 10
2JJo
hn J
ay m
ine
Faird
ay M
ine
Buen
o M
ount
ain
gully
Wat
er T
reat
men
t Pla
nt
Littl
e Ja
mes
Cre
ek
Jam
esto
wn
Por
phyr
y G
ulch
Cur
ie S
prin
gs
Cas
tle G
ulch
Lefh
and
Cre
ek
Figure 33. James Creek - percent of sediments that are <63 um in size.
74

James Creek distance downstream (km)
0.0 0.5 1.0 1.5 2.0 2.5 3.0
% o
f <63
μm
sed
imen
ts in
sam
ple
0.5%
1.0%
1.5%
2.0%
2.5%
3.0%
3.5%
4.0%
Bac
kgro
und
refe
renc
e
Eve
ning
Sta
r
un-n
amed
was
te ro
ck p
ileAr
go M
ine
"Arg
o gu
lly"
Bal
arat
road
Bur
lingt
on M
ine
Em
it M
ine
adit
drai
nage
Bal
arat
Cre
ek
min
e w
aste
pile
Stre
amsi
de ta
ilings
Buen
o M
tn. g
ully
Yel
low
girl
- nor
thW
ater
fall
abov
e co
nflu
ence
Jam
es C
reek
con
fluen
ce
Figure 34. Little James Creek - percent of sediments that are <63 um in size.
Waste rock piles
Waste rock pile sediment metals
As expected, metal concentrations measured via weak acid extraction
from waste rock pile sediments exceeded elutriated metal concentrations.
Concentrations of lead released from sediments via partial digestion were
highest among waste rock piles along Lefthand Creek including the waste
rock piles at the Dew Drop Mine, the White Raven Mine, and the lower Slide
Mine. The lead concentrations in the whole and yellow piles at the White
Raven site were highest among the waste rock piles samples in the
watershed. Waste piles along Little James which were high in lead include
75

those at the Evening Star Mine, Emmit mine and Bueno Mine. Elevated zinc
levels were also measured within the Evening Star waste rock sediments.
Copper concentrations were highest in the sediments at the Corning Tunnel.
0
50
100
150
200
250
300
350
400
450
Lefth
and
Ref
eren
ce
Dew
Dro
p
Big
Fiv
e (g
rey)
Big
Fiv
e(y
ello
w)
Whi
te R
aven
Lick
Ski
llet
Cor
ning
Tun
nel
Upp
er S
lide
Pile
Low
er S
lide
Pile
M
etal
con
cent
ratio
n (m
g/kg
)
Figure 35. Concentrations of metals elutriated from waste rock piles along Lefthand Creek. Data collected by Amber Roche. White bars represent zinc, grey bars represent copper, and black bars represent lead.
0
50
100
150
200
250
300
350
400
450
LittleJames
Reference
EveningStar
Upper ArgoPile
Lower ArgoPile
Emmett StreamSide
Porpyhry Bueno
M
etal
con
cent
ratio
n (m
g/kg
)
Figure 36. Concentrations of metals in sediments at waste rock piles along Little James Creek. Data collected by Amber Roche.
76

Waste rock pile elutriation concentrations
The elutriated waste rock piles sediments with the highest metal content were
consistent with downstream water, benthic macroinvertebrate and sediment
concentrations. These waste rock piles include the Big Five Tunnel, White
Raven and the Slide Mine upper pile.
The investigated metals concentrations (units of mg kg-1) elutriated from
waste rock pile sediments for Lefthand Creek and Little James Creek are
represented in Figure 37 and Figure 38 respectively. Along Lefthand Creek,
concentrations in the tailings pile at the White Raven mine site and less
evidently at the tailings piles at the Slide Mine indicate high concentrations of
lead elutriated from waste rock piles. Copper and zinc are highest in the
tailings pile at the White Raven site and the tailings pile near the Big Five
tunnel.
0
50
100
150
200
250
300
350
400
450
Lefth
and
Ref
eren
ce
Dew
Dro
p
Big
Fiv
e (g
rey)
Big
Fiv
e(y
ello
w)
Whi
te R
aven
Lick
Ski
llet
Cor
ning
Tun
nel
Upp
er S
lide
Pile
Low
er S
lide
Pile
Copper (mg/kg) Lead (mg/kg) Zinc (mg/kg)
M
etal
con
cent
ratio
n (m
g/kg
)
Figure 37. Lefthand Creek waste rock pile total elutriated metal concentrations. Error bars represent standard deviations of duplicate samples.
77

Along Little James Creek the waste rock piles with the highest elutriated lead
concentrations in decreasing order occur at the Evening Star Mine > Upper
Argo Mine > “streamside tailings” > Bueno Mountain. Lead concentrations
dominate the elutriated metals from the respective waste rock piles.
Elutriated zinc is highest in decreasing order at Evening Star >Streamside
tailings > Bueno Mountain. These four waste rock piles will be the focus of
discussion for Little James Creek.
0
50
100
150
200
250
300
350
400
450
LittleJames
Reference
EveningStar
Upper ArgoPile
Lower ArgoPile
Emmett StreamSide
JRT Bueno
Cu Pb Zn
M
etal
con
cent
ratio
n (m
g/kg
)
Figure 38. Little James Creek waste rock pile total elutriated metal concentrations. Error bars represent standard deviations of duplicate samples.
78

Discussion
In order to assess the impacts of intermittent sources of toxic metals to
streams in the Lefthand Creek watershed, metal concentrations were
measured in the stream water, benthic macroinvertebrates, stream
sediments, and waste rock piles. Our analyses focused on zinc, copper, and
lead because these metals most frequently and consistently exceed aquatic
life standards in the watershed (Lefthand Watershed Task Force 2002; Wood
et al. 2004), and because these metals behave quite differently with respect
to adsorption to minerals, organic matter, and organisms (Dzombak and
Morel 1990; Erickson et al. 1996; Farag et al. 1998; Galan et al. 2003).
Exposure time to toxic metals and the fate and transport of metals in streams
were key factors in creating hypotheses.
We hypothesized that benthic macroinvertebrates and sediments,
which have proved to be good monitors of metal loading over time (Hare et al.
1991; Woodward et al. 1994), would provide evidence of metal inputs in to the
streams by intermittent tributaries and snow melt. We examined the data for
spatial correlations between metal concentrations in the benthic
macroinvertebrates and the sediments and metal concentrations in
elutriations of waste rock piles at expected metal sources, the mine and mill
sites in the watersheds.
Because both benthic macroinvertebrates and sediments are expected
to be good monitors of metal loading from intermittent sources, we expected
that the metal concentrations in the benthic macroinvertebrates and the
79

sediments would be correlated, but that the metal concentrations in the
benthic macroinvertebrates and sediments would not be correlated with the
metal concentrations in the stream water. We examined the data for these
correlations in order to test this hypothesis. We expected that zinc, copper,
and lead would follow the patterns of speciation observed in other streams
and soils (Kimball et al. 1995; Farag et al. 1998; Fey et al. 1999; Schemel et
al. 2000; Adriano 2001; Munk et al. 2002). In the stream water samples, we
expected that zinc would be mostly dissolved, lead would be mostly bound to
colloids, and copper would be found in both fractions. Because of this
behavior, we expected to find more lead and less zinc accumulation in the
sediments and benthic macroinvertebrates as a fraction of the total amount of
metals in the streams. We expected that the amount of dissolved organic
matter in the streams would play a role in the metal distributions between
water, sediments, and benthic macroinvertebrates as well – more organic
matter would increase the amount of metals in the dissolved fraction. We
tested these hypotheses by assessing dissolved and colloidal metal
concentrations and correlations between dissolved metal and organic matter
concentrations.
The final section of the Discussion contains our analysis of the implications of
these finding for prioritization of abandoned mine cleanup in the Lefthand
Creek watershed.
80

Copper, zinc, and lead concentrations in stream water, benthic macroinvertebrates, and sediments
Regression analyses for were completed between stream water metal
concentrations and benthic macroinvertebrates and stream water metal
concentrations and sediments in order to find correlations among media
(Figure 39-Figure 41 ). Few strong correlations were found using this analysis
and all but one existed in Lefthand Creek. A single positive correlation in
Little James Creek was found between lead in benthic macroinvertebrates
and stream water samples (r2 = 0.74). In addition to this correlation, the
absence of macroinvertebrates in seven of the thirteen sampling sites in Little
James Creek, and nearby benthic macroinvertebrate lead concentrations
highest in the watershed, it appears that lead impairs the stream water
quality. Concentrations of zinc and copper were ruled out as targets of
impairment due to similar concentrations found in the watershed which
contained an abundance of macroinvertebrates (i.e., downstream of the White
Raven Mine and the Big Five Tunnel drainage). Besides this single
comparison, water concentrations did not show strong correlations with
macroinvertebrate or sediment concentrations within the watershed.
Regression analyses for were completed between stream water metal
concentrations and benthic macroinvertebrates and stream water metal
concentrations and sediments in order to find correlations among media
(Figure 42 - Figure 44). Along the entire length of Lefthand Creek, strong
correlations were observed between macroinvertebrates and sediments for
81

copper (r2 = 0.80) and lead (r2 = 0.64). These were a result of the strong
correlations found within California gulch, and not representative of the entire
stream. For the California Gulch segment of Lefthand Creek, correlations
between macroinvertebrates and sediments improve to r2 = 0.82 for copper
and r2 = 0.90 for lead. Copper and lead have a higher affinity to bind to
surfaces and form complexes than does zinc in the pH range found in
Lefthand Creek which end up in the sediments.
82

0 5 10 15 20 25 30
Mac
roin
verte
brat
e co
pper
(μg
g-1)
0
200
400
600
800
r ² = 0.38
Lefthand Creek Macroinvertebrate vs. Water
0 5 10 15 20 25 30
Sedi
men
t cop
per (
mg
kg-1
)
0
1000
2000
3000
4000
5000
6000
Lefthand Creek Sediment vs. Water
Cu Cu
0 1 2 3 4 50
5
10
15
20
0 1 2 3 4 5
Sed
imen
t lea
d (m
g kg
-1)
0
200
400
600
800
1000
1200
1400
Pb Pb
r ² = 0.50
Dissolved metal (μg/L)
0 20 40 60 80 100 1200
500
1000
1500
2000
2500
3000
3500
r ² = 0.10
r ² = 0.16
Dissolved metal (μg/g)
0 20 40 60 80 100 120
Sedi
men
t zin
c (m
g kg
-1)
0
1000
2000
3000
4000
5000
6000
ZnZn
r ² = 0.68
r ² = 0.02
Mac
roin
verte
brat
e le
ad (μ
g g-1
)M
acro
inve
rtebr
atez
inc
(μg
g-1)
Figure 39. Comparisons of metals in benthic macroinvertebrates and dissolved metals in water (left column) and metals in sediments and dissolved metals in water (right column) for zinc, copper, and lead in Lefthand Creek.
83

0 5 10 15 20 25 30
Mac
roin
verte
brat
e co
pper
(μg
g-1 )
0
20
40
60
80
100
James Creek Macroinvertebrate vs. Water
0 5 10 15 20 25 30
Sed
imen
t cop
per (
mg
kg-1
)
0
100
200
300
400
James Creek Sediment vs. Water
CuCu
0.3 0.4 0.5 0.6 0.7 0.80
2
4
6
8
10
0.3 0.4 0.5 0.6 0.7 0.8
Sed
imen
t lea
d (m
g kg
-1)
0
50
100
150
200
250
300
350Pb Pb
Dissolved metal (μg/L)
0 2 4 6 8 100
200
400
600
800
1000
1200
1400
1600
Dissolved metal (μg/g)
0 2 4 6 8 10
Sed
imen
t zin
c (m
g kg
-1)
0
50
100
150
200
250
300ZnZn
r ² = 0r ² = 0.35
r ² = 0.16 r ² = 0.12
r ² = 0.06 r ² = 0.16
Mac
roin
verte
brat
e le
ad (μ
g g-
1 )M
acro
inve
rtebr
ate
zinc
(μg
g-1 )
Figure 40. Comparisons of metal concentrations in benthic macroinvertebrates and dissolved metals in water (left column) and metal concentrations in sediments and stream water (right column) for copper, zinc, and lead in James Creek.
84

0 20 40 60 80
Mac
roin
verte
brat
e co
pper
(μg
g-1
)
0
25
50
75
100
125
150
175
200
Little James Creek Macroinvertebrate vs. Water
0 5 10 15 20 25 30
Sed
imen
t cop
per
(mg
kg-1
)
0
200
400
600
800
1000
1200
1400
1600
Little James Creek Sediment vs. Water
Cu Cu
0 10 20 30 40 50 600
50
100
150
200
250
300
350
0 10 20 30 40 50 600
100
200
300
400
500
600
700
800Pb Pb
Dissolved metal (μg/L)
0 200 400 600 800 1000 12000
200
400
600
800
1000
1200
1400
1600
1800
Dissolved metal (μg/g)
0 200 400 600 800 1000 1200 14000
200
400
600
800
1000
1200
1400
1600ZnZn
r ² = 0.13
r ² = 0
r ² = 0.74
r ² = 0.10
r ² = 0.14 r ² = 0.12
Mac
roin
verte
brat
e zi
nc (μg
g-1
)M
acro
inve
rtebr
ate
lead
(μg
g-1 )
Sed
imen
t zin
c (m
g kg
-1)
Sed
imen
t lea
d (m
g kg
-1)
Figure 41. Comparisons of metal concentrations in macroinvertebrates and stream water (left column) and metal concentrations in sediments and stream water (right column) for copper, zinc, and, lead in Little James Creek.
85

Lefthand CreekMacroinvertebrate tissue vs. Sediment
0 1000 2000 3000 4000 5000 6000
Mac
roin
verte
brat
e co
pper
( μg
g-1)
0
200
400
600
800
1000
Lefthand Creek - California GulchMacroinvertebrate tissue vs. Sediment
0 1000 2000 3000 4000 5000 6000
Sed
imen
t cop
per (
mg
kg-1
)
0
200
400
600
800
1000Cu Cu
r ² = 0.82
0 500 1000 1500 2000 2500 30000
5
10
15
20
25
30
35
r ² = 0.64
0 500 1000 1500 2000 2500 30000
5
10
15
20
25
30
35
r ² = 0.89
Sediment (μg/g)
0 1000 2000 3000 4000 5000 60000
500
1000
1500
2000
2500
3000
3500
Sediment (μg/g)
0 1000 2000 3000 4000 5000 60000
500
1000
1500
2000
2500
r ² = 0.40
Pb Pb
Zn Zn
r ² = 0.02
r ² = 0.80
Mac
roin
verte
brat
e le
ad ( μ
g g-1
)M
acro
inve
rtebr
ate
zinc
(μg
g-1)
Sed
imen
t lea
d (m
g kg
-1)
Sed
imen
t zin
c (m
g kg
-1)
Figure 42. Comparisons of metals in benthic macroinvertebrates and metals in sediments for all of Lefthand Creek (left column) and for only the California Gulch reach of Lefthand Creek (right column).
86
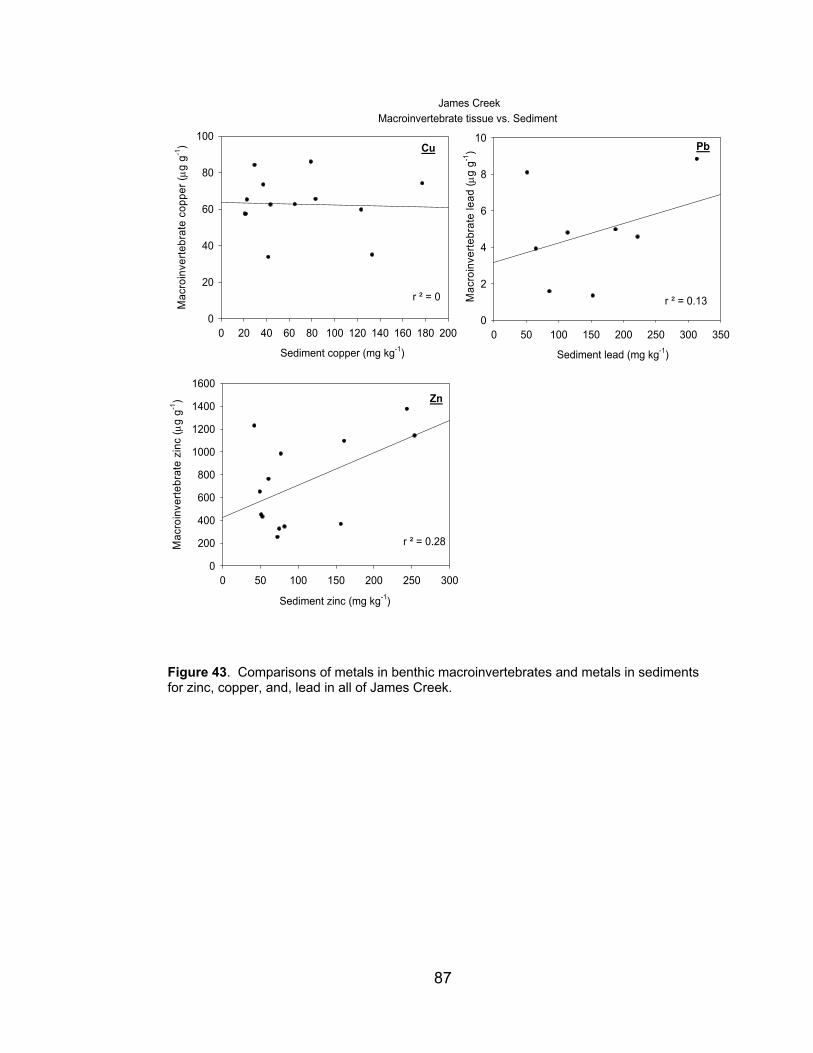
James CreekMacroinvertebrate tissue vs. Sediment
0 20 40 60 80 100 120 140 160 180 200
Mac
roin
verte
brat
e co
pper
( μg
g-1)
0
20
40
60
80
100Cu
0 50 100 150 200 250 300 3500
2
4
6
8
10
0 50 100 150 200 250 3000
200
400
600
800
1000
1200
1400
1600Zn
Pb
Sediment lead (mg kg-1)
r ² = 0.28
r ² = 0 r ² = 0.13
Mac
roin
verte
brat
e zi
nc ( μ
g g-1
)
Mac
roin
verte
brat
e le
ad (μ
g g-1
)
Sediment zinc (mg kg-1)
Sediment copper (mg kg-1)
Figure 43. Comparisons of metals in benthic macroinvertebrates and metals in sediments for zinc, copper, and, lead in all of James Creek.
87

0 200 400 600 800 1000 1200 1400 16000
20
40
60
80
100
120
140
160
180Cu
0 200 400 600 8000
50
100
150
200
250
300
350
0 200 400 600 800 1000 1200 1400 16000
200
400
600
800
1000
1200
1400
1600
1800Zn
Pb
r ² = 0 r ² = 0.09
r ² = 0.08
Little James CreekMacorinvertebrate tissue vs. Sediment
Mac
roin
verte
brat
e co
pper
(μg
g-1
)M
acro
inve
rtebr
ate
zinc
(μg
g-1
)
Mac
roin
verte
brat
e le
ad ( μ
g g-
1 )
Sediment copper (μg g-1)
Sediment zinc (μg g-1)
Sediment lead (μg g-1)
Figure 44. Comparisons of metals in benthic macroinvertebrates and metals in sediments for zinc, copper, and lead in all of Little James Creek.
Zinc, copper, and lead inputs from waste rock piles
We observed a significant difference in concentrations between metals
dissolved from waste rock by the partial digestion and by elutriation was seen
among all samples (Figure 35 - Figure 38). The weak acid extraction method
provides insight into the more tightly bound metals to the sediments in the
waste rock piles, while the elutriation method indicates what portion of metals
may be removed during rainfall and snow melt events. The sixteen waste rock
88

piles analyzed using this method and are listed in Table 12 in decreasing
order of elutriated concentrations of copper, zinc, and lead. We listed these
in decreasing order to get a sense of which metals are attributed to each
tailings pile.
Table 12 Waste rock piles rated in decreasing order of total elutriated zinc, copper and lead.
Rating total Zn mg kg-1 site
total copper mg kg-1 site
total lead
mg kg-1 site 1 118 Evening Star 46.7 White Raven 417 White Raven
2 46.4 Stream Side 30.4 Evening Star 164 Upper Argo Pile
3 44.0 White Raven 27.6 Stream Side 143 Evening Star
4 15.4 Dew Drop 21.9 Upper Argo Pile
114 Stream Side
5 13.4 Bueno 17.9 Big Five (grey portion)
78.2 Bueno
6 13.4 Lower Argo Pile
12.7 Bueno 53.7 Lower Slide Pile
7 10.1 Emmit 12.4 Dew Drop 32.4 Corning Tunnel
8 9.34 Upper Argo Pile
9.84 Emmit 20.2 Emmit
9 8.96 Big Five (yellow portion)
8.20 Big Five (yellow portion)
19.2 Big Five (yellow portion)
10 8.86 Big Five (grey portion)
7.58 Lower Argo Pile
17.5 Lower Argo Pile
11 7.95 Lower Slide Pile
7.28 Corning Tunnel
12.3 JRT
12 7.14 JRT 7.04 JRT 10.3 Big Five (grey portion)
13 4.92 Corning Tunnel
6.33 Lower Slide Pile
8.7 Dew Drop
14 3.29 Upper Slide Pile
1.77 Lefthand Reference
5.65 Lick Skillet
15 3.06 Lefthand Reference
1.63 Lick Skillet 2.38 Upper Slide Pile
16 2.92 Lick Skillet 1.03 Upper Slide Pile
0.86 Lefthand Reference
89

We hypothesized that benthic macroinvertebrates and sediments, which have
proved to be good monitors of metal loading over time (Hare et al. 1991;
Woodward et al. 1994), would provide evidence of metal inputs in to the
streams by intermittent tributaries and snow melt. We expect that the
elutriated metal concentrations (total and dissolved) from waste rock piles will
correlate with downstream benthic macroinvertebrate and streambed
sediment concentrations. To test this hypothesis we conducted a correlation
analysis between total elutriated metal concentrations from the waste rock
piles and the downstream metal concentrations in benthic macroinvertebrate
metal and streambed sediments (Figure 45) for zinc, copper, and lead. We
conducted the same correlation analysis substituting dissolved elutriated
metals for total elutriated metals (Figure 46). The waste rock piles included in
this analysis are those in Table 12 above minus Corning Tunnel (due to the
close proximity of the White Raven site. For sites in which more than one
waste rock pile was analyzed (i.e., Argo Mine and Slide Mine), we summed
the concentrations assuming that metals from both piles leached metals
during precipitation events. We did not find correlations between downstream
benthic macroinvertebrate metal concentrations (copper and zinc) and total or
dissolved elutriated metal concentrations (copper and zinc) from waste rock
piles as indicated by the r2 values in Table 13. There was a week correlation
between lead in benthic macroinvertebrates and both total and dissolved lead
elutriated from waste rock piles. This came as a surprise because lead is the
least mobile of the three investigated metals and would not be expected to
90

enter the stream in similar concentrations as was mobilized by a storm event.
In addition, we did not find correlations for any of the investigated metals
between sediments and elutriated metal concentrations (total and dissolved)
from waste rock piles as indicated by the r2 values in Table 13 below.
Table 13 The r2 values observed from correlation analysis which tested the hypothesis that elutriated metals from waste rock piles correlated with downstream benthic macroinvertebrates and sediments. r2 values for lead in benthic macroinvertebrates a weak correlation in for both total and dissolved portions. benthic
macroinvertebrate vs. total elutriated
sediment vs. total
elutriated
benthic macroinvertebrate vs. dissolved elutriated
sediment vs. dissolved elutriated
zinc 0.018 0.003 0.003 0.07
copper 0.003 0.21 0.03 0.08
lead 0.24 0.02 0.32 0.009
These non-correlations can be attributed to the differences between waste
rock pile flow paths (length from waste pile to stream, slope of path from
waste rock pile to stream), the area of exposed waste rock, and the
mineralogy of the waste rocks along with their ability to leach metals. Lastly,
some of the waste rock piles are known to be constantly draining groundwater
discharge from under the waste rock piles or near the site area (i.e. Big Five
Tunnel, Argo Mine, Burlington Mine, and Bueno Mountain). These flows add
metal concentrations to the streams which can not be identified using results
from the elutriation tests.
91

Benthic macroinvertebrate metal concentrations downstream of waste rock pile vs. total elutriated metals
Total elutriated zinc (mg kg-1)
0 20 40 60 80 100 120
Mac
roin
verte
brat
e zi
nc (m
g kg
-1)
0
500
1000
1500
2000
2500
3000
3500
Streambed sediment metal concentrations downstream of waste rock pile vs. total elutriated metals
0 20 40 60 80 100 120
Sed
imen
t zin
c, (m
g kg
-1)
0
1000
2000
3000
4000
5000
6000r ² = 0r ² = 0.02
Total elutriated copper (mg kg-1)
0 10 20 30 40 50
Mac
roin
verte
brat
e co
pper
(mg
kg-1
)
0
200
400
600
800r ² = 0
0 10 20 30 40 50
Sed
imen
t cop
per (
mg
kg-1
)
0
1000
2000
3000
4000
5000
6000r ² = 0.21
Total elutriated lead (mg kg-1)
0 100 200 300 400 500
Mac
roin
verte
brat
e le
ad (m
g kg
-1)
0
50
100
150
200
250
300
350
0 100 200 300 400 500
Sed
imen
t lea
d (m
g kg
-1)
0
500
1000
1500
2000
2500
3000r ² = 0.02r ² = 0.24
Total elutriated zinc (mg kg-1)
Total elutriated copper (mg kg-1)
Total elutriated lead (mg kg-1)
Figure 45. A correlation analysis between macroinvertebrate (plots on the left) and sediment (plots on the right) metal concentrations downstream of waste rock piles and total elutriated metals (zinc – squares, copper – triangles, and lead – circles). Dashed lines are the 95% confidence intervals.
92

Benthic macroinvertebrate metal concentrations downstream of waste rock pile vs. dissolved elutriated metals
0 20 40 60 80 100 1200
1000
2000
3000
4000
Streambed sediment metal concentrations downstream of waste rock pile vs. dissolved elutriated metals
0 20 40 60 80 100 1200
1000
2000
3000
4000
5000
6000r ² = 0.07r ² = 0.003
0 5 10 15 20 250
200
400
600
800r ² = 0.03
0 5 10 15 20 25 300
1000
2000
3000
4000
5000
6000r ² = 0.08
0 5 10 15 20 25 300
50
100
150
200
250
300
350
0 5 10 15 20 25 30 350
500
1000
1500
2000
2500
3000r ² = 0.009r ² = 0.32
Dissolved elutriated zinc (mg kg-1)
Mac
roin
verte
brat
e zi
nc (m
g kg
-1)
Sed
imen
t zin
c, (m
g kg
-1)
Dissolved elutriated copper (mg kg-1)
Mac
roin
verte
brat
e co
pper
(mg
kg-1
)
Sed
imen
t cop
per (
mg
kg-1
)
Dissolved elutriated lead (mg kg-1)
Mac
roin
verte
brat
e le
ad (m
g kg
-1)
Sed
imen
t lea
d (m
g kg
-1)
Dissolved elutriated zinc (mg kg-1)
Dissolved elutriated copper (mg kg-1)
Dissolved elutriated lead (mg kg-1)
Figure 46. A correlation analysis between macroinvertebrate (plots on the left) and sediment (plots on the right) metal concentrations downstream of waste rock piles and dissolved elutriated metals (zinc – squares, copper – triangles, and lead – circles). Dashed lines are the 95% confidence intervals.
We can analyze the data for spatial correlations between elutriated
metal from waste rock piles and abandoned mills and mines and
93

macroinvertebrates and sediments if the sites did not contain constant
groundwater discharge to the stream. This would allow us to more
confidently state that the metal concentrations elutriated from the waste rock
pile were representative of the amount mobilized during a storm event and
flowing into the stream.
Of the sixteen waste rock pile sites, the Slide Mine and the White
Raven Mine waste rock piles were chosen for this analysis because flows
from intermittent streams near these sites are only observed during
precipitation events or snowmelt. The identification of metals into the stream
via drainage and precipitation events is difficult to distinguish between without
fingerprinting analysis of the sediments and stream water. This was beyond
the scope of this project and so for this analysis (correlating in-stream metal
concentrations with waste rock piles) we have chosen sites the White Raven
and Slide Mine sites on Lefthand Creek and the Evening Star Mine on Little
James Creek, all of which do not have groundwater discharge.
White Raven waste rock pile
Copper was the dominant metal elutriated from the White Raven Mine
waste rock pile. This can be attributed to the high copper content in the
minerals that were prevalent in the Ward mining district, including azurite
(Cu3(OH)2(CO3)2), chalcopyrite (CuFeS2), and bornite (Cu5FeS4) (Eckel
1961). Among all waste rock piles analyzed via the elutriation method, White
Raven waste rock pile contained the highest concentrations of copper and
lead concentrations and contained the third highest concentration of zinc
94

concentrations (Table 12 above). We also see high concentrations of copper,
zinc, and, lead in the stream water, macroinvertebrate and sediments
downstream of the White Raven site (Table 14). The high lead levels in the
waste rock of the White Raven mine (total elutriated = 417 mg kg-1) are
attributed to the prevalence of galena (PbS) in the White Raven vein. The
silver-lead ore produced at this site ranged from 10-15% lead (Cobb 1988).
High zinc levels in macroinvertebrates and sediments downstream of
the White Raven Mine (Table 14) reflect the presence of sphalerite (ZnS) in
the White Raven Mine vein (Eckel 1961). Zinc concentrations in
macroinvertebrates increase downstream of the White Raven Mine by 75%
(Figure 23, Table 14).
The next sampling point after the California Gulch reach is
approximately 8 km downstream. It would be helpful in the future to sample
this area for benthic macroinvertebrates and sediments to look for metal
accumulation from the White Raven site further downstream.
Table 14 Percent increases in benthic macroinvertebrate and sediment metal concentrations from above to downstream of the White Raven Mine and waste rock pile. A negative increase represents a decrease in concentration.
Stream water (ug L-1) Macroinvertebrate (mg kg-1) Streambed sediments (mg kg-1)
Metal UP DOWN %
Increase UP DOWN%
Increase UP DOWN %
Increase White Raven
Copper 18.8 24 27.7% 474 668 40.9% 2460 4910 99.6% Lead 0.43 0.88 104.7% 18.9 27.4 45.0% 1220 2620 114.8% Zinc 71.7 95.3 32.9% 1118 1958 75.1% 2361 4870 106.3%
95

Slide Mine waste rock pile
Due to anecdotal evidence of metal inputs at the Slide Mine, we
expected sediments and benthic macroinvertebrate metals (those found to be
present in the waste rock piles) to increase from above to downstream of the
Slide Mine. The lower Slide Mine elutriated 53.7 mg kg-1 of lead as compared
to the White Raven site which elutriated 417 mg kg-1. Lead concentrations
increased by 944% from above to downstream of the Slide Mine in benthic
macroinvertebrates (1642 to 2922 mg kg-1). Zinc concentrations inputs from
Slide mine are the most likely source of the highest zinc concentrations in
macroinvertebrates found throughout the 10 km reach downstream of the
Slide Mine. In this case, elutriated metals from waste rock piles did not aid in
determining the extent of metal accumulation in macroinvertebrates
downstream. Once again, the size of the waste rock piles and the flow paths
during precipitation events are needed to further asses the impacts of the
individual waste rock piles.
Table 15 Percent increases in benthic macroinvertebrate and sediment metal concentrations from above to downstream of the Slide Mine site. A negative increase represents a decrease in concentration.
Stream water (ug L-1) Macroinvertebrate (mg kg-1) Streambed sediments (mg kg-1)
Metal UP DOWN %
Increase UP DOWN%
Increase UP DOWN %
Increase Slide Mine
Copper 15 7.7 -48.7% 122 202 65.6% 127 107 -15.7%
Lead 0.45 4.7 944.4% 4.54 10.5 131.3% 118 144 22.0%
Zinc 33 44.5 34.8% 1642 2922 78.0% 301 408 35.5%
96

Metal distribution between water, colloids, and sediments
We expected the behavior of copper, lead, and zinc to follow
speciation patterns that have been well documented in streams (Axtmann et
al. 1990; Hare et al. 1991; Kimball et al. 1995; Church et al. 1997; Farag et al.
1998; Munk et al. 2002). Water quality parameters have a direct effect on the
interactions of colloids with metals in stream systems by influencing the
mobility, transport, and attenuation of metals in streams and stream bed
sediments (Stumm 1992; Kimball et al. 1995). Chemical processes in the
stream depend on pH, which influences metal solubility, adsorption of metals
onto mineral and organic surfaces, and precipitation-dissolution reactions.
Calcium and magnesium (measured as hardness) compete with metals for
binding sites.
The distribution of metals in the colloidal phase is dominated by lead,
next copper and the least by zinc(Kimball et al. 1995; Schemel et al. 2000).
Evidence of these patterns are supported by observed distribution coefficients
(Kdobs, L kg-1), which can be used to describe the distribution between the
dissolved and colloidal phase. The observed distribution coefficient for each
metal requires measured colloidal concentrations from filtered samples.
1
11
(( )
( )observed sd
w
C mgkgK Lkg
C mgL
−−
−=)
(3)
where Cs in the solid phase (in this case colloidal) and Cw is the dissolved
concentration in the water (mg L-1). The concentrations of colloids in the
water were not measured, so as a substitute for.the Kd values, colloidal
97

fractions will be used. The colloidal fractions (fcolloid) of zinc, copper, and lead
can be expressed as
( )total dissolved
colloidtotal
C Cf
C−
= (4)
where Ctotal is the total (unfiltered) concentration of a metal and Cdissolved is the
dissolved (filtered) concentration of a metal. In agreement with the patterns
of metal colloidal partitioning, The colloidal fraction were calculated for all
water samples taken along the Lefthand Creek, James Creek, and Little
James Creek and averaged (Figure 47). These averages indicate that lead is
the most abundant in the colloidal phase, copper shows intermediate
behavior, and zinc is the least expected to adsorb to the colloidal phases
removed by 0.45 μm filtration. The observed colloidal fractions are
dependent upon pH (Stumm and Morgan 1996); however, this was not
proved with the steam data (Figure 47).
98

Little James Creek
Zn Cu Pb
f col
loid
0.0
0.2
0.4
0.6
0.8
1.0
James Creek
Zn Cu Pb
f col
loid
0.0
0.2
0.4
0.6
0.8
1.0
Lefthand Creek
Zn Cu Pb
f col
loid
0.0
0.2
0.4
0.6
0.8
1.0 Lefthand Creek
pH6.4 6.6 6.8 7.0 7.2 7.4
f col
loid
0.0
0.2
0.4
0.6
0.8
1.0
Little James Creek
pH5.2 5.6 6.0 6.4 6.8
f col
loid
0.0
0.2
0.4
0.6
0.8
1.0
James Creek
pH6.0 6.2 6.4 6.6 6.8 7.0
f col
loid
0.0
0.2
0.4
0.6
0.8
1.0
Figure 47. The colloidal fraction (fcolloid) of zinc, copper, and lead in the three creeks of the Lefthand watershed (left column, mean and one standard deviation shown by error bar), and the dependence of the colloidal fraction on the pH of the water samples (right column - zinc (circles), copper (triangles), and lead (squares)).
Colloidal metals and Kint
General trends of copper, lead and zinc partitioning into the colloidal
phase also reflect the surface complexation constants, Kint, of these metals as
reported by Dzombak and Morel (1990) and represented logarithmically in
Table 16. The average colloidal fractions in Little James, James, and
Lefthand Creeks correspond well with these intrinsic surface complexation
constants (Figure 48 below). These trends give further evidence of the
99

characteristic binding sequence of Pb > Cu > Zn for acid mine drainage
streams.
Table 16 Intrinsic surface complexation constants (Kint ) reported by Dzombak and Morel (1990).
Metal Intrinsic surface complexation constant (Kint) Lead 4.65
Copper 2.89 Zinc 0.99
Little James Creek
log Kint
0 1 2 3 4 5
f col
loid
0.0
0.2
0.4
0.6
0.8
1.0
James Creek
0 1 2 3 4 50.0
0.2
0.4
0.6
0.8
1.0
Lefthand Creek
0 1 2 3 4 50.0
0.2
0.4
0.6
0.8
1.0
log Kint log Kint
Figure 48. Colloidal fractions of zinc (circles), copper (triangles), and lead (squares) compared to the logarithms of the intrinsic surface complexation constants (log Kint) reported by Dzombak and Morel (1990).
Colloidal metals and hardness
Hardness (Ca and Mg) plays a major role in the toxicity of metals to
aquatic life. The toxic metals compete with calcium and magnesium compete
with for binding sites on the gills of fish and gilled aquatic insects(Kiffney and
Clements 1992; Giddings et al. 2001; Paquin et al. 2002; Markich et al. 2005).
Toxic metals also compete with hardness for binding sites on iron hydroxide
complexes and organic matter in the stream water and therefore remain in the
dissolved phase. Therefore, we expect the colloidal fraction of metals to
100

increase and hardness decreases. Figure 49 displays the testing of this
hypothesis and shows that the fraction of colloidal zinc increases, copper
increases, and lead stays about the same as hardness increases. The
hardness in Little James Creek is extremely high (53 – 470 mg L-1 CaCO3) in
comparison to Lefthand Creek (14 – 38 mg L-1 CaCO3) and James Creek (7.3
– 11 mg L-1 CaCO3). The large differences in hardness coupled with the fact
that lead has the highest and zinc the lowest affinities for binding with
surfaces show that the colloidal fractions of all investigated metals are lower
in Little James and James Creeks than Lefthand Creek with zinc being
affected the most, lead the least and copper somewhere in between (Figure
49). It is important to note that there is a fair amount of variability amongst
these trends which suggests that hardness is not the only factor driving these
speciation patterns.
101

copp
er, f
collo
id
0.0
0.2
0.4
0.6
0.8
1.0
zinc
, fco
lloid
0.0
0.2
0.4
0.6
0.8
1.0
Hardness (mg CaCO3 L-1)
0 50 100 150 200 250 300 350 400 450 500
lead
, fco
lloid
0.0
0.2
0.4
0.6
0.8
1.0
Figure 49. Fractions of colloidal metal versus hardness in James (closed circles), Lefthand (open circles) and Little James (closed triangles creeks.
Colloidal metals and iron hydroxide surfaces
We expected the behavior of copper, lead, and zinc to follow
speciation patterns that have been well documented in streams (Axtmann et
al. 1990; Hare et al. 1991; Kimball et al. 1995; Church et al. 1997; Farag et al.
1998; Munk et al. 2002). We have shown that pH and hardness have a direct
effect on the interactions of colloids with metals in stream systems by
influencing the mobility, transport, and attenuation of metals in stream water.
102

When acid mine drainage tributaries mix with neutral pH streams, amorphous
and semi-crystalline oxyhroxides and hydroxysulfates of iron form (Stumm
and Morgan 1996). These precipitates have surface sites that sorb cations
which also depend upon pH. Figure 50 below shows the colloidal fraction of
iron as a function of pH. Although the correlation is not strong, we observe a
general increase in the fraction of colloidal iron as pH increases.
pH
5.25 5.50 5.75 6.00 6.25 6.50 6.75 7.00 7.25 7.50
Iron,
f collo
id
0.0
0.2
0.4
0.6
0.8
1.0
Figure 50. The influence of pH on colloidal fractions of iron (fcolloid) throughout the watershed.
The iron hydroxide surfaces play a major role in removing zinc, copper,
and lead from the dissolved fraction of the stream water (Stumm and Morgan
1996). To show the relationship between colloidal iron and the removal of
investigated metals, we plotted the colloidal fractions of investigated metals
as a function of the concentration of colloidal iron (μmol L-1) (Figure 51).
Correlations for zinc, copper, and lead were not found as expressed by r2
values of zero for all metals. A better correlation may be seen between the
concentrations of iron in the sediments and the concentrations of investigated
metals in the sediments. As iron precipitates form and bind with zinc, copper,
and lead at neutral pH, they drop out of the stream water column onto the
103

streambed. Iron concentrations were not measured in the streambed
sediments for this study but should be included in future investigations.
Zinc
, fco
lloid
0.0
0.2
0.4
0.6
0.8
1.0
Cop
per,
f col
loid
0.0
0.2
0.4
0.6
0.8
1.0
Colloidal iron (μmol/L)
0 2 4 6 8 10 12 14
Lead
, fco
lloid
0.0
0.2
0.4
0.6
0.8
1.0
Figure 51. Colloidal fraction of copper, zinc, and lead as a function of colloidal iron concentration (μmol L-1). Regression analysis determined r2 values of zero for all metals.
Streambed sediment metal partitioning
We hypothesized that the concentration of metals in sediments as a
fraction of the total amount of metals in the streams would be dominated lead,
followed by copper, and then zinc. The distribution of metals between the
stream water and sediments was calculated for each metal at all sites using a
distribution coefficient, Kd (equation 3 above). The average log-distribution
coefficients of all sampling sites in the watershed were calculated for zinc
(4.37 ± 0.94), copper (4.81 ± 0.71), and lead (5.8 ± 0.83) and support the
104

hypothesis. The large standard deviations of the average Kd values for
copper, zinc, and lead (Table 17) suggest the pH dependence of these
coefficients which has also been described by Stumm and Morgan (1996).
As pH increases, metals show greater affinity for the sediments and less
affinity for the dissolved phase (Figure 52). Once again, the affinity for metals
to bind to surfaces is dominated by lead, less by copper and the least by zinc.
Table 17 Average observed distribution coefficients between the dissolved phase and on the streambed
Metal log Kd (± 1 s.d.) Zinc 4.37 ± 0.94
Copper 4.81 ± 0.71 Lead 5.70 ± 0.83
Distribution coefficients (streamwater and sediments) vs. pH
pH
5.25 5.50 5.75 6.00 6.25 6.50 6.75 7.00 7.25 7.50
log
Kd
1
2
3
4
5
6
7copper lead zinc
Figure 52. Logarithms of the distribution coefficients (Kd, L kg-1) for sediment-water distribution of zinc, copper, and lead for all sampling sites in the watershed as a function of pH.
Benthic macroinvertebrates as biomonitors
Benthic macroinvertebrates have been used extensively to assess
water quality impairment in Rocky Mountain streams (Hare et al. 1991; Cain
et al. 1992; Hare 1992; Clements and Kiffney 1994; Maret et al. 2003; Meyer
105

et al. 2006). Even with the large variability among benthic macroinvertebrates
in their uptake and accumulation of metals, we are still able to observe
elevated metal concentrations in benthic macroinvertebrates in areas
downstream of abandoned mine and mill sites. For example, in James Creek
downstream of Bueno Mountain, zinc and lead concentrations were low in
water and sediments and continued to decline in concentration downstream;
however, metal concentrations in benthic macroinvertebrates remained high
and increased with stream distance until the confluence with Little James
Creek. In this case, as well as others, bioaccumulation of metals in benthic
macroinvertebrates aided in the determination of metal sources in areas
where metal concentrations in the stream water did not. As a note to future
investigators, we advise that samples for sediments and benthic
macroinvertebrates should be taken along the 8 km length of stream from
Sawmill Road to Lickskillet Road. Results from such a study will enable
future researchers to determine the extent of metal loading from California
Gulch.
In many instances where stream water concentrations indicated
decreases or no change in metal loading, metal concentrations in benthic
macroinvertebrates (along with metal concentrations in sediments) increased
by more than 100%. For example, copper and zinc concentrations in the
stream water decreased from above (LH4) to downstream of (LH5) the Big
Five tunnel drainage while lead remained below detection limits at both sites
(Table 18). These samples were both taken on July 8, 2005 when there was
106

not observable flow from the tunnel. However, zinc concentrations in
macroinvertebrates increased by 139%, copper concentrations in
macroinvertebrates increased by 1569%, and lead concentrations in
macroinvertebrates increased by 3050%. We observed similar increases in
sediments. Zinc concentrations in sediments increased by 1200%, the
concentration of copper in sediments increased by 2100%, and the
concentration of lead in sediments increased by 609%. This finding supports
the hypothesis that stream water concentrations would not be indicative of
metal sources while intermittent streams are not flowing.
Better correlations were observed between zinc and copper
concentrations in stream water and benthic macroinvertebrates than with lead
concentrations in stream water and benthic macroinvertebrates. This
correlation was more common for copper and zinc than it was for lead
because of the affinity for lead to adsorb to colloidal materials compared to
copper and zinc, which could make lead less bioavailable to aquatic
organisms. Zinc adsorbs the least to colloidal surfaces and is thus found in
the highest concentrations in the dissolved phase. Dissolved metals are
assimilated into the bodies of benthic macroinvertebrates, which explains why
zinc occurs in the highest concentrations in benthic macroinvertebrates
downstream of abandoned mine and mill sites relative to copper and lead.
High concentrations of zinc in all media, including waste rock piles is due to
its abundance in minerals throughout the watershed.
107

Table 18 Increases in concentrations of copper, zinc and lead in stream water, benthic macroinvertebrates, and sediments from above to downstream of the Big Five tunnel drainage. These sites were sampled on July 8, 2005, when the drainage was not flowing into Lefthand Creek. Negative values indicate decreases in concentrations.
Stream water (ug L-1) Macroinvertebrate
(mg kg-1) Streambed sediments
(mg kg-1)
Metal UP DOW
N %
Increase UP DOWN%
Increase UP DOWN %
Increase Zinc 6.1 3.5 -42.6% 467 1118 139.4% 194 2361 1117.0%
Copper 3.6 1.5 -58.3% 28.4 474 1569.0% 112 2460 2096.4% Lead 0.05 0.05 0.0% 0.6 18.9 3050.0% 172 1220 609.3%
Dissolved organic carbon and metal speciation
Metals are known to bind to organic matter and their total
concentrations in many waters have been correlated with the concentration of
dissolved organic carbon (DOC) (McKnight et al. 1992; Church et al. 1997;
Prusha and Clements 2004). Metals that bind to DOC are less bioavailable
and because of this we expected to see a decrease in metal accumulation in
macroinvertebrates as DOC increased. High DOC levels can inhibit metals
from bioaccumulating in benthic macroinvertebrates (Prusha and Clements
2004). This process is most effective for metals with a high affinity to bind to
organic matter.
Figure 53 shows the concentration of DOC compared to the metal
concentrations in benthic macroinvertebrates for all of the sampling sites. A
negative correlation between macroinvertebrate metal concentrations and
DOC was expected for all metals and in the order Pb > Cu > Zn due to their
affinity to adsorb to organic matter. However, we did not see such correlation
among the pooled data (Figure 53). Negative correlations were found
108

between benthic macroinvertebrates and DOC for all investigated metals in
James Creek and for zinc and lead in Little James Creek, however these
correlations were not significant (r2 values < 0.15). DOC becomes less
effective at controlling metal bioaccumulation in benthic macroinvertebrates at
higher metal concentrations. When available sites on organic matter become
saturated with metals, leaving no available sites, free metals have a greater
chance to bioaccumulate in the bodies of benthic macroinvertebrates.
We further investigated the role of DOC in metal speciation and plotted
the colloidal fractions of metals vs. DOC (Figure 54). If the colloidal fractions
are dominated by organic matter rather than iron hydroxide particulates, then
we should see a positive relationship between colloidal fractions and DOC.
As with the previous regression, r2 values were low for all metals indicating
weak correlations (zinc (0.14), copper (0.06), and lead (0.065) and inverse
relationships. The non-correlations observed may indicate the dependence of
metal speciation on the fractionation of DOC throughout the watershed.
McKnight et al. (1992) observed that the fractionation of DOC (%fulvic,
%humic, and %hydrophilic acids) can be a significant aspect of metal sorption
to DOC in a stream system. Future studies should include determination of
DOC fractions to investigate this hypothesis.
109

DOC (mg/L)1.25 1.50 1.75 2.00 2.25 2.50 2.75 3.00 3.25 3.50 3.75 4.00 4.25 4.50
Cu
in ti
ssue
( μg
g-1)
0
200
400
600
800Cu
Pb in
tiss
ue ( μ
g g-1
)
0
5
10
15
20
25
30
Pb
Zn in
tiss
ue ( μ
g g-1
)
0
500
1000
1500
2000
2500
3000
3500
Zn
r ² = 0.134
r ² = 0.303
r ² = 5.57e-3
Figure 53. Concentration of metals in benthic macroinvertebrates as a function of concentration of dissolved organic carbon (DOC) for all sampling sites.
110

DOC
1.5 2.0 2.5 3.0 3.5 4.0 4.5
f collo
id
0.0
0.2
0.4
0.6
0.8
1.0
copperleadzinc
Figure 54. The colloidal fraction of metals (fcolloid) as a function of DOC show weak correlations (zinc (0.14), copper (0.06), and lead (0.065).
In the future, benthic macroinvertebrate collections should include the
collection of two species from separate feeding guilds in order to decrease
variability among samples. This is possible if further investigations into the
abundance of metal tolerant species can be conducted to find a target
species. Future methods of collection could possibly include harvesting a
single species from background sites and placing them in encasements
throughout the study area. The amount of time the target species should
remain in the encasements shall rely on the lifespan and time of molting of
the species chosen. Researchers indicate that care must be taken when
using pooled communities to assess metal inputs to streams (Clements and
Kiffney 1994). The feeding guild of the benthic macroinvertebrates determines
their sensitivity to metals in the stream water column and the sediments. The
benthic macroinvertebrates used at each site varied in community diversity.
111

Whole communities were digested to get a representative sample at each
site. The nature of this type of collection leads to various questions pertaining
to the accumulation of metals by individuals. Some individual fly larvae filter
feed through the sediments and detritus on rocks while others spin webs and
capture food moving downstream in the form of organic matter and,
sometimes, other larvae. We can also pose questions as to the extent of
metal resistance among individuals. The tolerance of these individuals
depends on their success in passing metals through the body.
Recommendations for remediation
We expected sediment and macroinvertebrate metal concentrations to
lead us to new sources of metal inputs to the streams that flow only
intermittently. We did not find any new sources of metal loading within the
watershed, but we were able to confirm previous recommendations and
reprioritize a few sites. Along Lefthand Creek, Wood et al. (2004) rated the
Dew Drop mine as medium priority because of copper and zinc
concentrations and pH. This ranking is supported by the elutriation test
results and the increases in metals in benthic macroinvertebrates and
sediments downstream of the site. The Big Five tunnel received a high
priority ranking from Wood et al. (2004) based on pH, zinc, copper and lead.
This study supports the ranking with the high concentrations of copper,
lead and zinc downstream of the Big Five tunnel in benthic
macroinvertebrates, sediments, and stream water. However, the leaching
capacity of the sediments from the two waste rock piles at Big Five was low
112

as shown by elutriation tests. The Slide Mine was given a medium priority
ranking by Wood et al. due to pH, zinc and copper. Based upon increases in
concentrations of zinc and lead downstream of this site in benthic
macroinvertebrates (also the highest concentrations in the creek among
benthic macroinvertebrates), we would change the prioritization of this site to
high. Current efforts are underway to remediate the Slide Mine as a voluntary
cleanup program (VCUP) site.
Along James Creek, the Bueno Mountain Mine was given a high
priority ranking based upon Al, Mn, Zn, Cu and Pb by Wood et al. (2004).
Concentrations in benthic macroinvertebrates and sediments support this
ranking with escalating increases of Copper, Zn and Pb for 8 km downstream
of known metal inputs. It is possible that these sources may also emanate
from upstream sources, such as the Fairday Mine or John Jay Mine.
The Bueno Mountain gully along Little James Creek also received a high
priority ranking based upon the same metals and pH. This area, including the
“streamside tailings,” was ranked as high priority by Wood et al. (2004).
These are supported by the lack of aquatic life, low pH, and high
concentrations of copper, zinc and, lead in the sediments. The most
problematic metal to aquatic life in this area is attributed to lead. The
Evening Star Mine, which was referred to as the “un-named” mine between
0.37 – 0.64 km by Wood et al. (2004), was assigned a medium priority
ranking due to Al, Cu, and Pb loading. Streambed sediment and benthic
macroinvertebrate metal concentrations did not confirm lead loadings within
113

the vicinity of the Evening Star Mine inflows, but we did detect elevated
copper and zinc concentrations in benthic macroinvertebrates in this area.
Additionally, the sediments from the Evening Star Mine’s waste rock elutriated
the highest levels of zinc of all tailings piles in the watershed. Copper and
lead concentrations in the Evening Star waste rock pile were ranked in the top
three of all waste rock piles. We advise maintaining the medium priority
ranking of Wood et al. (2004), but we recommend further investigations into
the transport of metals from this site. The Argo Mine gully was given a
medium priority ranking by Wood et al. (2004) due to Al and Cu, but this was
found to be inappropriate from the findings within this study. Concentrations
of copper and zinc in sediments just downstream of the gully were highest
among all samples taken in the creek and benthic macroinvertebrates
exhibited the highest lead and copper concentrations. The Argo Mine waste
rock pile exhibited the second highest elutriations of copper and lead and the
sixth-highest zinc concentration. We would recommend raising the priority of
the Argo Mine gully from medium to high. These rating changes were
changed without regards for size of waste rock piles or their flow paths.
However, the concentrations measured within the streambed sediments and
macroinvertebrates (which represent long term accumulation) and their
proximity to the waste rock piles, give evidence that these changes should be
considered.
114

Summary and Conclusions
Comparisons of stream water metal concentrations to the Colorado
Department of Public Health and the Environments aquatic life standards
provided a basis for the effects on the stream water ecosystem and provided
insight into the relationship between metal bioavailability and stream water
hardness. We were able to show correlations between benthic
macroinvertebrates and sediments in a majority of the samples taken in the
watershed. Besides the correlation between lead in stream water and
sediments, we did not find correlations between stream water and benthic
macroinvertebrates or between stream water and sediments for any of the
metals. Analysis of copper, zinc and lead concentrations in sediments and
benthic macroinvertebrates in relation to waste rock pile locations reconfirmed
known sources of metal inputs. Well documented metal speciation trends for
zinc, copper, and, lead were supported between stream water and sediments
and between dissolved and colloidal metals. They supported the binding
sequence; lead > copper > zinc. Correlations between colloidal metal
fractions and concentrations of iron were not supported with the available field
data. Finally, with the available dataset, the hypothesis which stated that
dissolved organic carbon plays a role in the metal distributions between
water, sediments and benthic macroinvertebrates was not supported.
115

References
Adriano, D. C. (2001). Trace Elements in Terrestrial Environments: Biogeochemistry, Bioavailability, and Risks of Metals, Springer-Verlag New York, Inc., 175 Fifth Avenue, New York, NY 10010.
Axtmann, E. V., V. J. Cain and S. N. Luoma (1990). Distribution of Trace Metals in Fine-grained Bed Sediments and Benthic Insects in the Clark Fork River, Montana. Clark Fork Symposium. University of Montana, Missoula, Montana, U.S. Geological Survey.
Barbour, M. T., G. J., S. B.D. and S. J.B. (1999). Rapid Bioassessment Protocols for Use in Streams and Wadeable Rivers: Periphyton, Benthic Macroinvertebrates, and Fish, Second Edition. EPA 841-B-99-002., U.S. Environmental Protection Agency; Office of Water; Washington, D.C.
Cain, D. J., S. N. Luoma, J. L. Carter and S. V. Fend (1992). Aquatic insects as bioindicators of trace element contamination in cobble-bottom rivers and streams. Canadian Journal of Fisheries and Aquatic Sciences 49: 2141 - 2154.
Cain, D. J., S. N. Luoma and W. G. Wallace (2004). Linking metal bioaccumulation of aquatic insects to their distribution patterns in a mining-impacted river. Environmental Toxicology and Chemistry 23(6): 1463-1473.
Cain, J. C., J. L. Carter, S. V. Fend, S. N. Luoma, C. N. Alpers and H. E. Taylor (2000). Metal exposure in a benthic macroinvertebrate, Hydropsyche californica, related to mine drainage in the Sacramento River. Canadian Journal of Fisheries and Aquatic Science 57: 380-390.
CDPHE (2005). Water Quality Control Commision Regulation No. 31 - The basic standards and methodologies for surface water (5 CCR 1002-31).
CDWR. (2002). "Colorado Division of Water Resources. Lefthand Diversion at So. St. Vrain Creek near Ward, Colorado."
Church, S. E., B. A. Kimball, D. L. Fey, D. A. Ferderer, T. J. Yager and R. B. Vaughn (1997). Source, transport, and partitioning of metals between water, colloids, and bed sediments of the Animas River, Colorado. United States Geological Survey. Open File Report 97-0151.
Clements, W. H. and P. M. Kiffney (1994). Integrated laboratory and field approach for assessing impacts of heavy metals at the Arkansas River, Colorado. Environmental Toxicology and Chemistry 13(3): 397-404.
Clesceri, L. S., A. E. Greenberg and A. B. Easton (1999). Standard Methods for the Examination of Water and Wastewater (20th ed). Washington D.C.: American Public Health Association.
116

Cobb, H. S. (1988). Prospecting Our Past: Gold, Silver and Tungsten Mills of Boulder County, The Book Lode, 1st edition, Longmont, Colorado.
Covelo, E. F., M. L. Andrade and F. A. Vega (2004). Heavy metal adsorption by humic umbrisols: selectivity sequesnces and competitive sorption kinetics. Journal of Colloid and Interface Science 280: 1-8.
Davies, P., S. Brinkman and W. H. Clements (1994). Effects of heavy metals on aquatic organisms under laboratory and field conditions. Federal aid project F-194-R., Fort Collins, Colo.: Colorado Division of Wildlife, Fish Research Section.
Davis, A. and D. Atkins (2001). Metal Distribution in Clark River Sediments. Environmental Science and Toxicology 35: 3501-3506.
Davis, J. A. and D. B. Kent (1990). Surface complexation modeling in aqueous geochemistry: in Mineral-Water Interface Geochemistry, M.F. Hochella and A.F. White, eds. Reviews in Mineralogy 23: 177-260.
Drever, J. I. (1997). The Geochemistry of Natural Waters: Surface and Groundwater Environments - 3rd edition, Prentice Hall, Upper Saddle River, NJ.
Dzombak, D. A. and F. M. M. Morel (1990). Surface Complexation Modeling: Hydrous Ferric Oxide, New York: Wiley Interscience.
Eckel, E. (1961). Minerals of Colorado: A 100 year record, US Geological Survey Bulletin 1114., US Government Printing Office, Washington D.C.
Erickson, R. J., D. A. Benoit, V. R. Mattson, H. P. Nelson and E. N. Leonard (1996). The effects of water chemistry on the toxicity of copper to fathead minnows. Environmental Toxicology and Chemistry 15: 181-193.
Evangelou, V. P. (1995). Pyrite oxidation and its control: solution chemistry, surface chemistry, acid mine drainage (AMD), molecular oxidation mechanisms, microbial role, kinetics, control, ameliorates and limitations, microencapsulation, CRC Press, Boca Raton FL.
Farag, A. M., D. F. Woodward, W. Brumbaugh, J. N. Goldstein, E. MacConnell, C. Hogstrand and F. T. Barrows (1999). Dietary effects of metals-contaminated invertebrates from the Couer d'Alene River, Idaho, on Snake River cutthroat trout (Oncorhynchus clarki spp.). Transactions of the American Fisheries Society 128: 578-592.
Farag, A. M., D. F. Woodward, J. N. Goldstein, W. Brumbaugh and J. S. Meyer (1998). Concentration fo metals associated with mining waste in sediments, biofilm, benthic macroinvertebrates, and fish from the Coeur
117

d'Alene River Basin, Idaho. Archives of Environmental Contamination and Toxicology 34: 119-127.
Fey, D. L., S. E. Church and C. J. Finney (1999). Analytical results for 35 mine-waste tailings cores and six bed-sediment samples, and an estimate of the volume of contaminated material at Buckeye Meadow on Upper Basin Creek, northern Jefferson County, Montana. United States Geological Survey. Open File Report 99-537.
Galan, E., J. L. Gomez-Ariza, I. Gonzalez, J. C. Fernandez-Caliani, E. Morales and I. Giraldez (2003). Heavy metal partitioning in river sediments severely polluted by acid mine drainage in the Iberian Pyrite Belt. Applied Geochemistry 18: 409-421.
Giddings, E. M., M. I. Hornberger and H. K. Hadley (2001). Trace metal concentrations in sediment and water and health of aquatic macroinvertebrate communities of streams near Park City, Summit County, Utah. U.S.G.S. Open File Report 01-4213.
Hageman, P. L. (2004). U.S Geological Survey Scientific Investigations Report 2004-5104: Use of short-term (5-minute) and long-term (18-hour) leaching tests to characterize, fingerprint, and rank mine-waste material from historical mines in the Deer Creek, Snake RIver, and Clear Creek watersheds in and around the Montezuma District, Colorado.
Hageman, P. L. and P. H. Briggs (2000). A simple field leach test for rapid screening and qualitatice characterization of mine-waste dump material on abandoned mine lands. In ICARD 2000: Proceedings from the Fifth International Conference on Acid Rock Drainage, Society for Mining, Metallurgy, and Exploration, May 21-24, 2000, Denver, Colorado.
Hare, L. (1992). Aquatic Insects and trace metals: bioavailability, bioaccumulation, and toxicity. Critical Reviews in Toxicology 22: 327-369.
Hare, L., A. Tessier and P. G. C. Campbell (1991). Trace element distributions in aquatic insects: variations among genera, elements, and lakes. Canadian Journal of Fisheries and Aquatic Sciences 48: 1481- 1491.
Hernandez, K., S. Christensen and S. Forrest (2004). Lefthand Watershed Sampling and Analysis Plan, United States Environmental Protection Agency, Region 8.
Kiffney, P. M. and W. H. Clements (1992). Bioaccumulation of heavy metals by benthic invertebrates at the Arkansas River, Colorado. Environmental Toxicology and Chemistry 12: 1507-1517.
118

Kimball, B. A., E. Callender and E. V. Axtmann (1995). Effects of colloids on metal transport in a river receiving acid mine drainage, upper, Arkansas River, Colorado, U.S.A. Applied Geochemistry 10: 285-306.
LaFontaine, G. (1981). Caddisflies. Guilford, Connecticut, The Lyons Press.
Lanno, R. P., B. Hicks and J. W. Hilton (1997). Histology observations on intrahepatocytic copper containing granules in rainbow trout reared on diets containing elevated levels of copper. Aquatic Toxicology 10: 251-263.
LWTF (2002). Lefthand Watershed Task Force: Final Report to the Board of Health. March 11, 2002.
Maret, T. R., D. J. Cain, D. E. MacCoy and T. M. Short (2003). Response of benthic invertebrate assemblages to metal exposure and bioaccumulation associated with hard-rock mining in northwestern streams, USA. Journal of the North American Benthological Society 22(4): 598-620.
Markich, S. J., G. E. Batley, J. L. Stauber, N. J. Rogers, S. C. Apte, R. V. Hyne, K. C. Bowles, K. L. Wilde and N. M. Creighton (2005). Hardness corrections for copper are inappropriate for protecting sensitive freshwater biota. Chemosphere 60: 1-8.
McKnight, D. M., K. E. Bencala, G. W. Zellweger, G. R. Aiken, G. L. Feder and K. A. Thorn (1992). Sorption of dissolved organic carbon by hydrous aluminum and iron hydroxides occurring at the confluence of Deer Creek with the Snake River, Summit County, Colorado. Environmental Science and Technology 26: 1388-1396.
Meyer, J. S., M. J. Suedkamp, J. M. Morris and A. M. Farag (2006). Leachability of protein and metals incorporated into aquatic invertebrates: Are species and metals-exposure history important? Archives of Environmental Contamination and Toxicology 50: 79-87.
Moore, J. N. and S. N. Luoma (1990). Hazardous wastes from large-scale metal extraction: A case study. Environmental Science and Toxicology 24(9): 1279-1285.
Munk, L., G. Faure, D. E. Pride and J. M. Bigham (2002). Sorption of trace metals to an aluminum precipitate in a stream receiving acid-rock drainage; Snake River, Summit County, Colorado. Applied Geochemistry 17: 421-430.
Pagnanelli, F., E. Moscardini, V. Giuliano and L. Toro (2003). Sequential extraction of heavy metals in river sediments of an abandoned pyrite mining area: pollution detection and affinity series. Environmental Pollution 132: 189-201.
119

Paquin, P. R., J. W. Gorsuch, S. C. Apte, K. C. Bowles, G. E. Batley, P. C. Campbell, C. Delos, D. M. Di Toro, R. L. Dwyer, F. Galvez, R. W. Gensemer, G. G. Goss, C. Hogstrand, C. R. Janssen, J. C. McGeer, R. B. Naddy, R. C. Playle, R. C. Santore, U. Schneider, W. A. Stubblefield, C. M. Wood and K. B. Wu (2002). The biotic ligand model: a historical overview. Comparitive Biochemistry and Physiology 133C: 3-36.
Prusha, B. A. and W. H. Clements (2004). Landscape attributes, dissolved organic C, and metal bioaccumulation in aquatic macroinvertebrates (Arkansas River Basin, Colorado). Jounal of the North American Benthological Society 23(2): 327-339.
Sares, M. and J. Lovekin (1993). USFS [United States Forest Service]-Abandoned Mine Land Inventory Project. Final summary report. For the Boulder Ranger District. Colorado Geological Survey. 40 pp.
Schemel, L. E., B. A. Kimball and K. E. Bencala (2000). Colloid formation and metal transport through two mixing zones affected by acid mine drainage near Silverton, Colorado. Applied Geochemistry 15: 1003-1018.
Singer, P. C. and W. Stumm (1970). Acid Mine Drainage: The Rate Determining Step. Science 167: 1121-1123.
Stumm, W. (1992). Chemistry of the Solid-Water Interface: Processes at the Mineral-Water and Particle-Water Interface in Natural Systems, John Wiley & Sons, Inc.
Stumm, W. and J. J. Morgan (1996). Aquatic Chemistry (3rd edition), Wiley-Interscience, New York.
USEPA (1991). Methods for the determination of metals in environmental samples: Method 200.2, Sample preparation procedure for spectrochemical determination of toal recoverable elements: 15-22.
Wang, F., J. Chen and W. Forsling (1997). Modeling sorption of natural sediments by surface complexation model. Environmental Science and Toxicology 31: 448-453.
Wood, A. R. (2003). Characterization and prioritization of mining related metal sources with metal loading tracer dilution tests, and a review of regulations and mine restoration funding resources, Lefthand Creek watershed, northwestern Boulder County, Colorado. Dept. of Civil/Environmental & Architectural Engineering. Boulder, University of Colorado. Master's of Science: 154.
Wood, A. R., R. Cholas, L. Harrington, L. Isenhart, N. Turner and J. N. Ryan (2004). Characterization and Prioritization of Mining-Related Metal Sources in
120

the Streams and Streambed Sediments of the Lefthand Creek Watershed, Northwestern Boulder County, Colorado., Report 04-01, Department of Civil, Environmental, and Architectural Engineering, University of Colorado at Boulder, prepared for the Lefthand Watershed Oversight Group, Niwot, Colorado.
Woodward, D. F., W. G. Brumbaugh, A. J. DeLonay, E. E. Little and C. E. Smith (1994). Effects on rainbow trout fry of a metals-contaminated diet of benthic invertebrates from the Clark Fork River, Montana. 123: 51-62.
Woodward, D. F., A. M. Farag, H. L. Bergman, A. J. Delonay, E. E. Little, C. E. Smith and F. T. Barrowa (1995). Metal-contaminated benthic invertebrates in hte Clark Fork River, Montana: effects on age-0 brown trout and rainbow trout. Canadian Journal of Fisheries and Aquatic Sciences 52: 1994 - 2000.
121

APPENDIX A
Sampling Dates
Table A. 1 Lefthand Creek water, benthic macroinvertebrate and sediment field sampling dates.
sample name GPS site name
water & macroinvertebrate
sampling date sediment sampling
date
LH1 5560A-1 7/6/2005 10/3/2005
LH2 5560A-6 7/22/2005 10/3/2005
LH3 5560A-8 7/22/2005 10/3/2005
LH4 5560A-13 7/8/2005 10/3/2005
LH5 5560A-14 7/8/2005 10/3/2005
LH6 5560A-17 7/8/2005 10/17/2005
LH7 5560A-21 7/8/2005 10/17/2005
LH-PU 5560A-PU 7/8/2005* 10/17/2005
LH-IN 5560A-IN 7/6/2005* 10/10/2005
LH8 5560A-56 7/6/2005 10/10/2005
LH9 5560A-95-1 6/20/2005 10/1/2005
LH10 5560A-96 7/6/2005 10/1/2005
LH11 5560A-101 7/2/2005 10/1/2005
LH-SL 5560A-SL1 7/2/2005* 10/1/2005
LH12 5560A-103 7/2/2005 10/1/2005
LH13 5560A-113 6/20/2005 10/1/2005
LH14 5560A-123 6/29/2005 10/1/2005
LH15 5560A-129 6/18/2005 10/1/2005
LH16 5560A-136-2 6/29/2005 10/1/2005
LH17 5560A-127 6/15/2005 10/1/2005
LH18 5560A-171 6/29/2005 10/1/2005
LH19 5560A-184 6/29/2005 10/27/2005 * Creek/tributary was dry upon sampling.
122

Table A. 2 James Creek water, benthic macroinvertebrate and sediment sampling dates
sample name GPS site name
water & macroinvertebrate
sampling date sediment
sampling date
J1 5561A-T1 7/25/2005 10/3/2005
J2 5561A-T2 7/23/2005 10/4/2005
J3 5561A-T3 8/1/2005 10/8/2005
J4 5561A-T4 8/1/2005 10/8/2005
J-FD 5561A-FD 8/1/2005 10/8/2005
J5 5561A-JOHN 8/1/2005 10/8/2005
J6 5561A-10 8/1/2005 10/8/2005
J7 5561A-16 7/23/2005 10/8/2005
J8 5561A-28 7/13/2005 10/17/2005
J9 5561A-30-582 7/13/2005 10/4/2005
J10 5561A-55 7/1/2005 10/4/2005
J-CU 5561A-CU 7/2/2005 10/4/2005
J11 5561A-52 7/1/2005 10/4/2005
J12 5561A-53 7/1/2005 10/4/2005
J-CG 5561A-CG 7/1/05* 10/4/2005
J13 5561A-61 7/1/2005 10/4/2005
J14 5561A-62 6/30/2005 10/1/2005
* Creek/tributary was dry upon sampling.
123

Table A. 3 Little James Creek water, benthic macroinvertebrate and sediment sampling dates.
sample name GPS site name
water-macroinvertebrate
sampling date sediment
sampling date
LJ1 5562A-0 7/18/2005 9/24/2005*
LJ2 5562A-1 7/18/2005 9/24/2005*
LJ3 5562A-6 7/18/2005 9/24/2005
LJ4 5562A-8 7/18/2005 9/24/2005
LJ5 5562A-10 7/18/2005 9/24/2005
LJ6 5562A-14 7/18/2005 9/24/2005
LJ7 5562A-16 7/18/2005 9/24/2005*
LJ8 5562A-18-1 7/13/2005 9/24/2005*
LJ9 5562A-21 6/30/2005 9/24/2005
LJ10 5562A-28 7/13/2005 9/24/2005*
LJ11 5562A-32 7/13/2005 9/24/2005*
LJ12 5562A-35 7/13/2005 9/24/2005
LJ13 5562A-38 6/22/2005 9/24/2005
*Creek/tributary was dry upon sampling.
124

Water quality data
Table A. 4 Lefthand Creek water quality data - pH, specific conductance, and temperature
site name GPS Site
Name sample date pH
specific conductance
(μS cm-1) temperature
(ºC)
LH1 5560A-1 7/6/05 6.7 30.2 13.5
LH2 5560A-6 7/22/05 7.0 47.0 14.6
LH3 5560A-8 7/22/05 7.0 45.1 14.5
LH4 5560A-13 7/8/05 6.8 25.2 11.9
LH5 5560A-14 7/8/05 6.7 30.8 11.6
LH6 5560A-17 7/8/05 6.7 29.7 11.5
LH7 5560A-21 7/8/05 6.5 37.7 11.2
LH8 5560A-56 7/6/05 6.7 47.6 12.8
LH9 5560A-95-1 6/20/05 6.8 61.2 12.3
LH10 5560A-96 7/6/05 6.9 63.9 10.5
LH11 5560A-101 7/2/05 7.2 63.5 12.0
LH12 5560A-103 7/2/05 7.1 71.8 11.2
LH13 5560A-113 6/20/05 7.0 77.0 10.5
LH14 5560A-123 6/29/05 7.0 12.1 12.6
LH15 5560A-129 6/18/05 7.3 115 11.3
LH16 5560A-136-2 6/29/05 6.7 41.1 11.7
LH17 5560A-127 6/15/05 6.9 61.6 11.5
LH18 5560A-171 6/29/05 6.9 42.6 11.3
LH19 5560A-184 6/29/05 6.8 47.6 11.0
125

Table A. 5 Lefthand Creek water quality data - Dissolved Organic Carbon (DOC)
site name GPS site name
distance downstream
(km) DOC, ppm st dev (ppm) RSD %
LH1 5560A-1 0 2.81 0.031 1.1
LH2 5560A-6 0.539 2.81 0.00957 0.34
LH3 5560A-8 0.67 2.8 0.0707 0.25
LH4 5560A-13 1.302 3.25 0.126 0.39
LH5 5560A-14 1.311 3.23 0.005 0.15
LH6 5560A-17 1.5 3.18 0.00816 0.26
LH7 5560A-21 1.788 3.12 0.005 0.16
LH8 5560A-56 2.514 2.59 0.0171 0.66
LH9 5560A-95-1 11.429 2.88 0 0
LH10 5560A-96 11.47 2.85 0.005 0.18
LH11 5560A-101 12.435 2.8 0.00957 0.34
LH12 5560A-103 12.675 2.78 0.01 0.36
LH13 5560A-113 16 2.78 0.0171 0.61
LH14 5560A-123 18.317 2.7 0.015 0.56
LH15 5560A-129 19.482 2.71 0 0
LH16 5560A-136-2 21.702 1.97 0.005 0.25
LH17 5560A-127 22.493 1.94 0 0
LH18 5560A-171 26.391 2 0.00957 0.48
LH19 5560A-184 30.508 2.04 0.005 0.24
CONTROL - - 0.739 0.002 0.27
MQ - Blank - - 0.764 0.0416 5.45
Field Blank - - 1.06 0.0212 1.99
126

Table A. 6 James Creek water quality data - pH, specific conductance, and temperature
site name
GPS site name
sample date
specific conductance (μS cm-1)
temperature (ºC) pH
J1 5561A-T1 7/25/05 6.4 20.5 12.4
J2 5561A-T2 7/23/05 6.9 22.0 16.3
J3 5561A-T3 8/1/05 6.4 20.8 15.9
J4 5561A-T4 8/1/05 6.3 23.6 15.3
J5 5561A-JOHN 8/1/05 6.4 24.8 14.4
J6 5561A-10 8/1/05 6.4 24.5 14.4
J7 5561A-16 7/23/05 6.6 23.5 16.7
J8 5561A-28 7/13/05 6.4 23.0 15.3
J9 5561A-30-582 7/13/05 6.2 25.1 14.2
J10 5561A-55 7/1/05 6.6 27.9 13.0
J11 5561A-52 7/1/05 6.7 31.9 12.8
J12 5561A-53 7/1/05 6.4 30.5 11.9
J13 5561A-61 7/1/05 6.3 33.5 10.5
J14 5561A-62 6/30/05 6.1 33.6 10.0
127

Table A. 7 James Creek water quality data - Dissolved Organic Carbon (DOC) site name
GPS site name
distance downstream
(km) DOC, ppm st dev (ppm) RSD %
J1 5561A-T1 0.00 1.6 0 0
J2 5561A-T2 1.20 1.67 0 0
J3 5561A-T3 7.80 1.77 0 0
J4 5561A-T4 8.36 1.85 0.0141 0.76
J5 5561A-JOHN 9.00 2.2 0.0707 0.32
J6 5561A-10 10.18 2.08 0.0707 0.34
J7 5561A-16 10.18 2.82 0.00707 0.25
J8 5561A-28 14.00 1.99 0.00957 0.48
J9 5561A-30-582 14.42 1.78 0 0
J10 5561A-55 16.69 1.81 0.005 0.28
J11 5561A-52 18.21 1.82 0 0
J12 5561A-53 18.29
J13 5561A-61 19.04 1.76 0.0129 0.74
J14 5561A-62 20.42 1.87 0.005 0.27
CONTROL - - 0.739 0.002 0.27% MQ - Blank - - 0.764 0.0416 5.45% Field Blank - - 1.06 0.0212 1.99
128

Table A. 8 Little James Creek water quality data - pH, specific conductance, and temperature
site name GPS site name sample
date pH
specific conductance
(μS cm-1) temperature
(ºC)
LJ1 5562A-0 7/18/05 6.7 209 13.1
LJ2 5562A-1 7/18/05 6.2 200 16.5
LJ3 5562A-6 7/18/05 6.7 181 19.8
LJ4 5562A-8 7/18/05 6.5 201 17.3
LJ5 5562A-10 7/18/05 5.9 187 13.5
LJ6 5562A-14 7/18/05 5.4 1620 12.9
LJ7 5562A-16 7/18/05 5.6 1360 13.4
LJ8 5562A-18-1 7/13/05 5.7 1100 20.8
LJ9 5562A-21 6/30/05 6.1 481 16.8
LJ10 5562A-28 7/13/05 5.7 640 17.0
LJ11 5562A-32 7/13/05 6.1 824 20.5
LJ12 5562A-35 7/13/05 6.2 703 19.0
LJ13 5562A-38 6/22/05 6.3 507 16.8
129

Table A. 9 Little James Creek water quality data - Dissolved Organic Carbon (DOC)
sample name
GPS site name
distance downstream
(km) DOC, ppm st dev (ppm) RSD %
LJ1 5562A-0 0 3.36 0.006 0.15
LJ2 5562A-1 0.25 3.76 0.00707 0.19
LJ3 5562A-6 0.9 3.68 0.00957 0.26
LJ4 5562A-8 0.92 4.36 0.0141 0.32
LJ5 5562A-10 1.14 3.57 0 0
LJ6 5562A-14 1.43 2.28 0.0707 0.31
LJ7 5562A-16 1.59 2.78 0.041 0.51
LJ8 5562A-18-1 1.8 1.68 0.0212 1.27
LJ9 5562A-21 1.87 2.86 0.0707 0.25
LJ10 5562A-28 2.37 2.86 0.005 0.17
LJ11 5562A-32 2.49 3.04 0.0141 0.47
LJ12 5562A-35 2.6 3.16 0.007 0.22
LJ13 5562A-38 2.89 3.08 0.0212 0.69
CONTROL - - 0.739 0.002 0.27% MQ - Blank - - 0.764 0.0416 5.45% Field Blank - - 1.06 0.0212 1.99
NC, Not Collected due to lack of water at site
130

APPENDIX B
Metal concentrations in water
Table B. 1 Lefthand Creek Cu, Pb, and Zn concentrations in water
site name
GPS Site Name
total Cu
(μg L-1)
dissolved Cu
(μg L-1)
total Pb
(μg L-
1
dissolved Pb
(μg L-1)
total Zn
(μg L-
1
dissolved Zn
(μg L-1)
LH1 5560A-1 5* 5.8* BDL** 0.29** BDL 5.8
LH2 5560A-6 1* 2.4* BDL** 0.46** 2.9 2.9
LH3 5560A-8 0.86 1.2 BDL** BDL** 4.9 BDL
LH4 5560A-13 1 3.6 BDL** BDL** 5.4 6.1
LH5 5560A-14 1.2 1.5 0.41 BDL** 5.9 3.5
LH6 5560A-17 20.6* 18.8* 1.4 0.43** 74 71.7
LH7 5560A-21 28* 24* .65** 0.82** 106 95.3
LH8 5560A-56 21.7* 18* 0.61** 0.6** 80 69.3
LH9 5560A-95-1 7.7* 6.6* 0.88** 0.31** 30.4 25.8
LH10a 5560A-96a 8.1 5.3* 0.93 BDL** 31.4 23.3
LH10b 5560A-96b 23 24 BDL BDL 33 28
LH11 5560A-101 7.1* 15 BDL 0.45 32.2 35
LH12 5560A-103 7.5* 7.7* BDL 4.7 33 44.5
LH13 5560A-113 7.2* 6.3* 2.1 BDL 32.9 26.4
LH14 5560A-123 7 5.1 1.7 BDL 31.3 23.5
LH15 5560A-129 7.3* 5.2* 0.86 BDL 29.6 23.2
LH16 5560A-127 1.9* 1.9 1.6* BDL 8.1 7.2
LH17 5560A-136-2 1.6 2 1.4* 0.25** 7.6 5.4
LH18 5560A-171 3 2.9 1.3* BDL 9.1 5.4
LH19 5560A-184 2.7 2.1 0.61* BDL 8.1 5.3
FB FIELD_BLANK 2.7 2.1 BDL BDL BDL 2.8*
BDL, Below Detection Limit * Analyzed by ICP-MS, Detection Limit for Copper, 2 μg L-1
** Analyzed by ICP-MS, Detection Limit for Lead, 1 μg L-1
131

Table B. 2 James Creek Cu, Pb, and Zn Concentrations in Water
site name
GPS site name
total Cu
(μg L-
1)
dissolved Cu
(μg L-1)
total Pb (μg
L-1)
dissolved Pb
(μg L-1)
total Zn
(μg L-
1)
dissolved Zn
(μg L-1()
J1 5561A-T1 0.91 BDL* BDL BDL** 2.9 2.8
J2 5561A-T2 3.1* 1.3 0.68** 38** BDL 4.9
J3 5561A-T3 3.8* 1.1 BDL** BDL** BDL 4.5
J4 5561A-T4 1.4* 1.2 1.4 BDL** BDL BDL
J5 5561A-J0HN 1.7* 1.4 BDL** BDL** 3.1 3.5
J6 5561A-10 2.6* 1.4 0.78** 0.6** 2.7 5.2
J7 5561A-16 5.9 1.5 BDL** 0.52** 3.7 8.8
J8a 5561A-28a 1.2 1.6 0.54** BDL** 3 6.3
J8b 5561A-28b 14 13 BDL BDL 3 4
J9 5561A-30-582 1.7* 2.1 0.73** BDL** 2.9 4.7
J10 5561A-55 1.4* 2.4* 0.56** BDL** 4.8 3.6
J11 5561A-52 5.6* 2.1* 0.66** BDL** 4.8 8.1
J12 5561A-53 1.5* 2* 0.36** BDL 4.7 4.2
J13a 5561A-61a 6* 1.7* 0.72** BDL** 5.3 7.4
J13b 5561A-61b 16 12 BDL BDL 17 7
J14 5561A-62 1.5* 1.9* 0.61** BDL** 5.9 4.7
FB FIELD_BLANK 5* 1.5* BDL BDL BDL 2.8* BDL, Below Detection Limit * Analyzed by ICP-MS, Detection Limit for Copper, 2 μg L-1
** Analyzed by ICP-MS, Detection Limit for Lead, 1 μg L-1
132

Table B. 3 Little James Creek Cu, Pb, and Zn Concentrations in Water
site name GPS Site Name
total Cu (μg L-1)
dissolved Cu
(μg L-1)
total Pb
(μg L-
1)
dissolved Pb
(μg L-1)
total Zn
(μg L-1)
dissolved Zn
(μg L-1)
LJ1 5562A-0 1.4* 1.7* BDL** BDL** BDL BDL
LJ2 5562A-1 48.1* 46.4* 1** BDL** 112 117
LJ3 5562A-6 164 53.3* 6.6 0.59** 322 278
LJ4 5562A-8 20* 17.6* 1.1** 0.84** 89.4 95.4
LJ5a 5562A-10a 41 39.8 61.3 51.6 215 219
LJ5b 5562A-10b 71 --- 106 --- 256 ---
LJ6 5562A-14 51.7 46.3 38.6 26.5 1100 1100
LJ7 5562A-16 68.9 38.8 77.7 24.1 1440 1040
LJ8 5562A-18-1 57.8 49.1 69.7 40.6 1260 1250
LJ9 5562A-21 29.2 29.8 5.3 5.8 717 737
LJ10 5562A-28 79 77.7 10.8 9.6 603 615
LJ11 5562A-32 28 24.9* 4.6 2.1** 543 567
LJ12 5562A-35 14.2* 7* 1.7** 0.35** 420 415
LJ13 5562A-38 8.8* 5* 0.88** 0.44** 360 353
FB FIELD BLANK 1.4* 1.7* BDL** BDL** BDL BDL
BDL, Below Detection Limit * Analyzed by ICP-MS, Detection Limit for Copper, 2 ug L-1
** Analyzed by ICP-MS, Detection Limit for Lead, 1 ug L-1
133

APPENDIX C
Metal concentrations in benthic macroinvertebrates
Table C. 1 Lefthand Creek concentrations of Cu, Zn, and Pb in Benthic macroinvertebrate Digest Solution as Reported by EPA Region VIII Laboratory
site name GPS site name
macroinvertebrate dry wt (g)
Cu (μg L-1)
Pb (ug L-1)
Zn (ug L-1)
LH1 5560A-1 0.602 54.1* 0.76* 466
LH2 5560A-6 0.567 70.6* 0.9* 770
LH3 5560A-8 0.432 56.6 1.5 756
LH4 5562A-13 0.92 52.2* 1.1* 859
LH5 5560A-14 0.678 813 18.1 1810
LH6 5560A-17 0.114 108 4.3 255
LH7 5560A-21 0.0475 63.5 2.6 186
LH8 5560A-56 0.842 483 9.9 3710
LH9 5560A-95-1 0.409 179 5.7 1950
LH10a 5560A-96a 0.531 164 4.2 2269
LH10b 5560A-96b 0.630 196 3.6 2861
LH11 5560A-101 1.62 394 14.7 5320
LH12 5560A-103 0.722 292 15.1 4220
LH13 5560A-113 0.162 55.4 5.2 748
LH14 5560A-123 0.798 322 14.2 4930
LH15 5560A-129 0.622 181 15 2480
LH16 5560A-136-2 0.914 206 15.1 3560
LH17 5560A-127 0.698 111 12.1 1890
LH18 5560A-171 1 136 16.4 2030
LH19 5560A-184 1.011 120 10.1 1670
LB LAB_BLANK - BDL BDL BDL BDL, Below Detection Limit *Analyzed by ICP-MS
134

Table C. 2 Lefthand Creek Cu, Zn, and Pb Concentrations in Benthic macroinvertebrates Calculated from values in Table C.1
site name
GPS site name
macroinvertebrate
dry wt (g) Cu
(ug g-1 dry wt) Pb
(ug g-1 dry wt)
Zn (ug g-1 dry
wt)
LH1 5560A-1 0.602 44.9* 0.6* 387
LH2 5560A-6 0.567 62.3* 0.8* 679
LH3 5560A-8 0.432 65.5 1.7 875
LH4 5562A-13 0.92 28.4* 0.6* 467
LH5 5560A-14 0.678 600 13.3 1335
LH6 5560A-17 0.114 474 18.9 1118
LH7 5560A-21 0.0475 668 27.4 1958
LH8 5560A-56 0.842 287 5.9 2203
LH9 5560A-95-1 0.409 219 7.0 2384
LH10a 5560A-96a 0.531 164 4.2 2269
LH10b 5560A-96b 0.630 156 2.90 2271
LH11 5560A-101 1.62 122 4.54 1642
LH12 5560A-103 0.722 202 10.5 2922
LH13 5560A-113 0.162 171 16.0 2309
LH14 5560A-123 0.798 202 8.90 3089
LH15 5560A-129 0.622 145 12 1994
LH16 5560A-136-2 0.914 113 8.26 1947
LH17 5560A-127 0.698 79.5 8.67 1354
LH18 5560A-171 1 68.0 8.20 1015
LH19 5560A-184 1.011 59.3 5.00 826
LB LAB_BLANK - BDL BDL BDL
BDL, Below Detection Limit *Analyzed by ICP-MS
135

Table C. 3 James Creek concentrations of Cu, Zn, and Pb in Benthic macroinvertebrate Digest Solution as Reported by EPA Region VIII Laboratory
site name GPS site name
macroinvertebrate dry weight (g)
Cu (ug L-1)
Pb (ug L-1)
Zn (ug L-
1)
J1 5561A-T1 0.646 43.4 BDL 324
J2 5561A-T2 0.695 48.4 BDL 477
J3 5561A-T3 0.281 47.2 2.2 252
J4 5561A-T4 0.56 72.9 1.5 482
J5 5561A-JOHN 0.466 58.1 BDL 301
J6 5561A-10 0.461 54.9 BDL 337
J7 5561A-16 0.798 ---* ---* ---*
J8a 5561A-28a 0.501 55.5 BDL 622
J8b 5561A-28b 0.336 39.6 BDL 455
J9 5561A-30-582 0.507 58.1 1.6 771
J10 5561A-55 0.637 83.2 6.1 1250
J11 5561A-52 0.745 93.1 7.4 1630
J12 5561A-53 0.735 126 6.7 2020
J13a 5561A-61a 0.522 72.6 6.1 1230
J13b 5561A-61b 0.544 79.0 8.0 1430
J14 5561A-62 0.561 83 9.9 1280
LB LAB_BLANK - BDL BDL BDL BDL, Below Detection Limits *Not determined due to laboratory digestion failure
136

Table C. 4 James Creek Cu, Zn, and Pb Concentrations in Benthic macroinvertebrates Calculated from values in Table C.3
site name
GPS site name
macroinvertebrate dry weight (g)
Cu (ug g-1 dry wt)
Pb (ug g-1 dry wt)
Zn (ug g-1 dry wt)
J1 5561A-T1 0.646 33.6 BDL 250.8
J2 5561A-T2 0.695 34.8 BDL 343.2
J3 5561A-T3 0.281 84.0 3.9 448.4
J4 5561A-T4 0.56 65.1 1.3 430.4
J5 5561A-JOHN 0.466 62.3 BDL 323.0
J6 5561A-10 0.461 59.5 BDL 365.5
J7 5561A-16 0.589 36.8 -- --
J8a 5561A-28a 0.501 55.4 BDL 620.8
J8b 5561A-28b 0.336 58.9 BDL 677.1
J9 5561A-30-582 0.507 57.3 1.6 760.4
J10 5561A-55 0.637 65.3 4.8 981.2
J11 5561A-52 0.745 62.5 5.0 1094.0
J12 5561A-53 0.735 85.7 4.6 1374.1
J13a 5561A-61a 0.522 69.5 5.8 1178.2
J13b 5561A-61b 0.544 72.6 7.4 1314.3
J14 5561A-62 0.561 74.0 8.8 1140.8
LB LAB_BLANK - BDL BDL BDL
BDL, Below Detection Limits *Not determined due laboratory digestion failure
137

Table C. 5 Little James Creek concentrations of Cu, Zn, and Pb in Benthic macroinvertebrate Digest Solution as Reported by EPA Region VIII Laboratory
site name
GPS site name
macroinvertebrate
dry weight (g) Cu (ug L-1) Pb (ug L-1) Zn (ug L-1)
LJ1 5562A-0 0.973 27.5* 21.7* 267
LJ2 5562A-1 0.786 185 30.1 2540
LJ3 5562A-6 1.222 410 58 388
LJ4 5562A-8 0.869 168 30.6 288
LJ5a 5562A-10a 0.786 257 450 330
LJ5b 5562A-10b 1.103 316 402 359
LJ6 5562A-14 NMP NMP NMP NMP
LJ7 5562A-16 NMP NMP NMP NMP
LJ8 5562A-18-1 NMP NMP NMP NMP
LJ9 5562A-21 0.773 87.9 320 209
LJ10 5562A-28 NMP NMP NMP NMP
LJ11 5562A-32 NMP NMP NMP NMP
LJ12 5562A-35 NMP NMP NMP NMP
LJ13 5562A-38 NMP NMP NMP NMP
LB LAB_BLANK - BDL BDL BDL BDL, Below Detection Limit NMP, No Benthic macroinvertebrates Present * Analyzed by ICP-MS
138

Table C. 6 Little James Creek Cu, Zn, and Pb Concentrations in Benthic macroinvertebrates Calculated from values in Table C.5
site name
GPS site name
macroinvertebrate dry weight (g)
Cu (ug g-1 dry wt)
Pb (ug g-1 dry wt)
Zn (ug g-1
dry wt)
LJ1 5562A-0 0.973 14.1* 11.2* 137
LJ2 5562A-1 0.786 118 19.1 1616
LJ3 5562A-6 1.222 168 23.7 159
LJ4 5562A-8 0.869 96.7 17.6 166
LJ5a 5562A-10a 0.786 163 286 210
LJ5b 5562A-10b 1.103 143 182 163
LJ6 5562A-14 NMP NMP NMP NMP
LJ7 5562A-16 NMP NMP NMP NMP
LJ8 5562A-18-1 NMP NMP NMP NMP
LJ9 5562A-21 0.773 56.9 207 135
LJ10 5562A-28 NMP NMP NMP NMP
LJ11 5562A-32 NMP NMP NMP NMP
LJ12 5562A-35 NMP NMP NMP NMP
LJ13 5562A-38 NMP NMP NMP NMP
LB LAB_BLANK --- BDL BDL BDL
BDL, Below Detection Limit NMP, No Benthic macroinvertebrates Present *Analyzed by ICP-MS
139

APPENDIX D
Metal concentrations in bed sediments
Table D. 1 Lefthand Creek Metal Concentrations in Sediment Digest Solution Riverbed Sediments as Reported by University of Colorado – LEGS laboratory
site name GPS site name sediment dry wt.
(g) Cu
(mg L-1) Pb
(mg L-1) Zn
(mg L-1)
LH1 5560A-1 1.009 0.628 1.33 1.77
LH2 5560A-6 1.014 1.83 2.38 3.95
LH3 5560A-8 1 7.09 5.75 12.7
LH4 5562A-13 1.006 5.58 8.60 9.70
LH5 5560A-14 0.761 72.3 18.3 28.8
LH6 5560A-17 1.013 124 61.2 118
LH7 5560A-21 0.753 183 97.6 181
LH8 5560A-56 1.066 35.1 13.5 50.0
LH9 5560A-95-1 0.981 11.8 6.2 24.6
LH10 5560A-96 1.007 9.59 6.72 20.2
LH11 5560A-101 1.088 6.84 6.39 16.2
LHSL 5560A-SL 1.067 6.04 17.9 34.5
LH12 5560A-103 1.052 5.57 7.54 21.3
LH13 5560A-113 1.031 3.77 6.35 17.9
LH14 5560A-123 0.733 2.44 4.11 12.2
LH15 5560A-129 1.02 4.61 4.31 18.5
LH16 5560A-136-2 1.0132 2.70 4.84 11.8
LH17 5560A-127 1.005 3.35 7.03 10.6
LH18A 5560A-171A 0.985 3.01 5.50 10.1
LH18B 5560A-171B 1.073 3.18 5.85 10.3
LH18C 5560A-171C 1.13 3.34 6.25 11.1
LH19 5560A-184 1.051 3.61 6.97 10.7
SEDB1 LAB_BLANK 1 - 0.02 0.00 0.024
SEDB2 LAB_BLANK 2 - 0.00 0.00 0.011
SEDB3 LAB_BLANK 3 - 0.02 0.05 0.048
140

Table D. 2 Lefthand Creek Cu, Zn, and Pb Concentrations in Riverbed Sediments Calculated from Values in Table D.1
site name GPS site name sediment dry wt
(g) Cu
(mg kg-1) Pb
(mg kg-1) Zn
(mg kg-1)
LH1 5560A-1 1.009 12.3 26.3 35.0
LH2 5560A-6 1.014 36.2 47.0 78.1
LH3 5560A-8 1 143 116 256
LH4 5562A-13 1.006 112 172 194
LH5 5560A-14 0.761 1918 486 764
LH6 5560A-17 1.013 2460 1220 2361
LH7 5560A-21 0.753 4910 2620 4870
LH8 5560A-56 1.066 665 255 946
LH9 5560A-95-1 0.981 243 127 507
LH10 5560A-96 1.007 192 134 404
LH11 5560A-101 1.088 127 118 301
LHSL 5560A-SL 1.067 114 339 652
LH12 5560A-103 1.052 107 144 408
LH13 5560A-113 1.031 73.6 124 350
LH14 5560A-123 0.733 66.9 113 334
LH15 5560A-129 1.02 91.0 85.0 366
LH16 5560A-136-2 1.0132 53.6 96.1 234
LH17 5560A-127 1.005 67.0 141 213
LH18A 5560A-171A 0.985 61.4 112 206
LH18B 5560A-171B 1.073 59.7 110 193
LH18C 5560A-171C 1.13 59.6 111 197
LH19 5560A-184 1.051 69.1 134 205
141

Table D. 3 James Creek Metal Concentrations in Sediment Digest Solution Riverbed Sediments as Reported by University of Colorado – LEGS laboratory
site name GPS site name sediment dry
weight (g) Cu
(mg L-1) Pb
(mg L-1) Zn
(mg L-1)
J1 5561A-T1 1.011 2.10 3.00 3.67
J2 5561A-T2 1.02 6.74 5.36 4.18
J3D 5561A-T3D 1.134 1.67 3.72 2.85
J3E 5561A-T3E 1.123 1.69 3.64 2.85
J3F 5561A-T3F 0.981 1.43 3.14 2.59
J4 5561A-T4 1.183 1.36 8.97 3.12
J5 5561A-JOHN NC NC NC NC
JFD 5561A-FD 1.064 2.31 6.41 3.98
J6 5561A-10 0.991 6.07 8.82 7.71
J7 5561A-16 1.109 1.22 3.88 2.75
J8 5561A-28 1.105 1.17 4.71 3.36
J9 5561A-30-582 1.091 4.52 6.18 4.20
J10 5561A-55 1.012 3.27 9.43 8.09
J11 5561A-52 NC NC NC NC
J12 5561A-53 1.018 4.01 11.2 12.3
JCG 5561A-CG 0.972 1.81 2.50 2.06
J13 5561A-61 0.995 8.75 15.4 12.5
J14 5561A-62 0.385 6.60 6.10 5.47
SEDB1 LAB_BLANK 1 - 0.02 0.00 0.02
SEDB2 LAB_BLANK 2 - 0.00 0.00 0.01
SEDB3 LAB_BLANK 3 - 0.02 0.05 0.05
142

Table D. 4 James Creek Cu, Zn, and Pb Concentrations in Riverbed Sediments Calculated from Values in Table D.3
site name GPS site name sediment dry
weight (g) Cu
(mg kg-1) Pb
(mg kg-1) Zn
(mg kg-1)
J1 5561A-T1 1.011 41.8 59.6 72.7
J2 5561A-T2 1.02 133.2 105.8 82.2
J3D 5561A-T3D 1.134 29.5 66.0 50.2
J3E 5561A-T3E 1.123 30.1 65.1 50.7
J3F 5561A-T3F 0.981 29.3 64.4 52.7
J4 5561A-T4 1.183 23.0 152.9 52.9
J5 5561A-JOHN NC NC NC NC
JFD 5561A-FD 1.064 43.7 121.3 75.1
J6 5561A-10 0.991 123.5 179.5 156.7
J7 5561A-16 1.109 21.9 70.3 49.6
J8 5561A-28 1.105 21.1 85.8 61.0
J9 5561A-30-582 1.091 83.5 114.1 77.3
J10 5561A-55 1.012 65.1 188.0 161.0
J11 5561A-52 NC NC NC NC
J12 5561A-53 1.018 79.3 222.0 243.9
JCG 5561A-CG 0.972 37.3 51.6 42.3
J13 5561A-61 0.995 177.5 313.3 254.1
J14 5561A-62 0.385 345.4 319.1 285.7
143

Table D. 5 Little James Creek Metal Concentrations in Sediment Digest Solution Riverbed Sediments as Reported by University of Colorado – LEGS laboratory
site name
GPS site name sediment dry weight (g)
Cu (mg L-1)
Pb (mg L-1)
Zn (mg L-1)
LJ1A 5562A-0A 1.03 3.93 3.15 4.39
LJ1B 5562A-0B 1.01 1.03 3.44 3.54
LJ1C 5562A-0C 1.02 2.40 3.25 3.86
LJ2 5562A-1 1.03 1.08 3.15 2.37
LJ3 5562A-6 1.07 38.0 7.93 35.2
LJ4D 5562A-8D 0.93 69.5 11.9 66.9
LJ4E 5562A-8E 1.04 73.3 12.5 71.5
LJ4F 5562A-8F 1.05 78.4 13.4 75.9
LJ5D 5562A-10D 1.00 0.74 3.28 2.00
LJ5E 5562A-10E 0.97 0.69 3.19 1.89
LJ5F 5562A-10F 0.98 0.72 3.27 1.99
LJ6D 5562A-14D 0.99 1.51 6.55 3.61
LJ6E 5562A-14E 0.97 1.55 6.67 3.68
LJ6F 5562A-14F 1.00 1.58 6.85 3.72
LJ7i 5562A-16i 0.25 0.84 6.87 1.25
LJ7ii 5562A-16ii 0.51 1.62 12.6 2.34
LJ7iii 5562A-16iii 0.75 2.44 17.1 3.19
LJ7iv 5562A-16iv 1.01 3.18 21.7 4.07
LJ7v 5562A-16v 1.25 3.86 26.2 4.91
LJ8A 5562A-18-1A 0.98 10.2 12.4 15.4
LJ8B 5562A-18-1B 0.97 10.2 12.1 15.1
LJ8C 5562A-18-1C 1.01 10.3 12.3 15.4
LJ9A 5562A-21A 1.13 2.06 10.6 4.46
LJ9B 5562A-21B 1.19 2.11 11.1 4.38
LJ9C 5562A-21C 1.03 1.88 9.78 4.06
LJ10D 5562A-28D 1.01 12.3 38.0 14.8
LJ10E 5562A-28E 1.06 13.4 41.6 16.1
LJ10F 5562A-28F 1.01 11.5 32.8 13.2
LJ11A 5562A-32A 1.01 9.54 34.4 7.46
144

LJ11B 5562A-32B 1.03 10.1 40.1 8.17
LJ11C 5562A-32C 1.01 9.80 35.1 7.41
LJ12 5562A-35 1.00 4.73 16.5 4.81
LJ13i 5562A-38i 0.26 0.69 6.18 1.44
LJ13ii 5562A-38ii 0.50 1.29 10.3 2.35
LJ13iii 5562A-38iii 0.76 1.93 14.5 3.46
LJ13iv 5562A-38iv 1.00 2.53 18.5 4.21
LJ13v 5562A-38v 1.27 3.24 23.0 5.27
SEDB1 LAB_BLANK 1 - 0.02 0.00 0.02
SEDB2 LAB_BLANK 2 - 0.00 0.00 0.01
SEDB3 LAB_BLANK 3 - 0.02 0.05 0.05
145

Table D. 6 Little James Creek Cu, Zn, and Pb Concentrations in Riverbed Sediments Calculated from Values in Table D.5
site name gps site name sediments dry
weight (g) Cu
(mg kg-1) Pb
(mg kg-1) Zn
(mg kg-1)
LJ1A 5562A-0A 1.03 77.3 61.9 86.0
LJ1B 5562A-0B 1.01 20.3 68.3 70.2
LJ1C 5562A-0C 1.02 47.5 64.2 76.1
LJ2 5562A-1 1.03 20.9 61.6 46.0
LJ3 5562A-6 1.07 715 149 663
LJ4D 5562A-8D 0.93 1505 257 1447
LJ4E 5562A-8E 1.04 1420 243 1384
LJ4F 5562A-8F 1.05 1513 259 1464
LJ5D 5562A-10D 1.00 14.6 65.8 39.8
LJ5E 5562A-10E 0.97 14.1 66.2 38.8
LJ5F 5562A-10F 0.98 14.5 67.0 40.4
LJ6D 5562A-14D 0.99 30.5 133 72.9
LJ6E 5562A-14E 0.97 32.2 139 76.2
LJ6F 5562A-14F 1.00 31.9 139 74.9
LJ7i 5562A-16i 0.25 65.9 545 97.5
LJ7ii 5562A-16ii 0.51 63.8 502 91.9
LJ7iii 5562A-16iii 0.75 65.2 458 85.0
LJ7iv 5562A-16iv 1.01 63.3 433 80.9
LJ7v 5562A-16v 1.25 62.1 422 78.8
LJ8A 5562A-18-1A 0.98 209 254 316
LJ8B 5562A-18-1B 0.97 211 251 313
LJ8C 5562A-18-1C 1.01 206 246 307
LJ9A 5562A-21A 1.13 36.6 189 79.2
LJ9B 5562A-21B 1.19 35.7 188 73.9
LJ9C 5562A-21C 1.03 36.7 191 79.1
LJ10D 5562A-28D 1.01 246 764 297
LJ10E 5562A-28E 1.06 254 793 306
LJ10F 5562A-28F 1.01 230 658 264
LJ11A 5562A-32A 1.01 191 690 149
146

LJ11B 5562A-32B 1.03 197 783 159
LJ11C 5562A-32C 1.01 195 699 147
LJ12 5562A-35 1.00 95.0 333 96.4
LJ13i 5562A-38i 0.26 52.7 482 110.3
LJ13ii 5562A-38ii 0.50 51.5 413 93.5
LJ13iii 5562A-38iii 0.76 50.9 386 91.3
LJ13iv 5562A-38iv 1.00 50.8 373 84.6
LJ13v 5562A-38v 1.27 51.3 365 83.3
147

Percentage of fine grained sediments
Table D. 7 Lefthand Creek - percent of <63 um grain size in total sediment sample at each site.
GPS site name total weight (g) <63 μm sample wt (g) weight % of <63 μm
sediments
5560A-1 1484.1 13.414 0.904
5560A-6 1717.8 4.672 0.272
5560A-8 954 2.187 0.229
5560A-13 871.1 1.128 0.129
5560A-14 1203.4 0.898 0.075
5560A-17 1528.1 2.36 0.154
5560A-21 1541.9 0.831 0.054
5560A-56 1576.5 12.389 0.786
5560A-95-1 1699.3 2.985 0.176
5560A-96(1) 1582.7 0.782 0.049
5560A-96(2) 1483.9 0.634 0.043
5560A-101 1506.1 1.567 0.104
Slide Mine discharge 908.6 144.535 15.907
5560A-103 1604.6 6.972 0.435
5560A-113 1810.8 3.578 0.198
5560A-123 1635.8 0.887 0.054
5560A-129 1603.9 5.638 0.352
5560A-136-2 1575.4 9.378 0.595
5560A-127 1541.3 3.386 0.220
5560A-171 1601.1 8.562 0.535
5560A-184 1300.1 3.27 0.252
148

Table D. 8 James Creek - percent of <63 um grain size in total sediment sample at each site.
GPS site name total weight (g) <63 μm sample wt (g) weight % of <63 μm
sediments
5561A-T1 1455 9.34 0.642
5561A-T2 1664 2.64 0.159
5561A-T3 1610 10.38 0.645
5561A-T4 1527 1.59 0.104
5561A-FD 1570 2.43 0.154
5561A-10 1625 3.08 0.190
5561A-16 1427 5.74 0.402
5561A-28 1353 13.43 0.992
5561A-30-582 1446 8.08 0.559
5561A-55 1620 12.12 0.748
5561A-53 1573 3.55 0.225
5561A-CG 1577 12.53 0.795
5561A-61 1766 2.02 0.114
5561A-62 1449 0.54 0.037
149

Table D. 9 Little James Creek - percent of <63 um grain size in total sediment sample at each site.
GPS site name total weight (g) <63 μm sample wt (g) weight % of <63 μm
sediments
5562A-0(1) 1447 15.1 1.044
5562A-0(2) 1482 15.6 1.052
5562A-1 1196 9.59 0.802
5562A-6 1189 20.9 1.758
5562A-8 1332 32.9 2.470
5562A-10 1254 44.8 3.573
5562A-14 1300 10.8 0.833
5562A-15 1369 14.1 1.029
5562A-16 1329 9.30 0.700
5562A-18-1 1136 20.6 1.809
5562A-21 1148 39.3 3.424
5562A-28 1376 9.84 0.715
5562A-32 1536 30.0 1.955
5562A-38 1331 10.4 0.780
150