an investigation of english language learners performance
TRANSCRIPT
An investigation of English Language Learners’ performance on regular content assessments: A
study of Kansas ELLs
By
© 2015
Christina Lee Kitson
Submitted to the graduate degree program in Curriculum and Teaching and the Graduate Faculty
of the University of Kansas in partial fulfillment of the requirements for the degree of Doctor of
Philosophy
________________________________
Chairperson Dr. Manuela Gonzalez-Bueno
________________________________
Dr. Lizette Peter
________________________________
Dr. Paul Markham
________________________________
Dr. Steven White
________________________________
Dr. Vicki Peyton
Date Defended: 11/16/2015

ii
The Dissertation Committee for Christina Lee Kitson
certifies that this is the approved version of the following dissertation:
An investigation of English Language Learners performance on regular content assessments: A
study of Kansas ELLs
________________________________
Chairperson Dr. Manuela Gonzalez-Bueno
Date approved: 11/30/2015
iii
Abstract
AN INVESTIGATION OF ENGLISH LANGUAGE LEARNERS’ PERFORMANCE ON
REGULAR CONTENT ASSESSMENTS: A STUDY OF KANSAS ELLS
by
Christina Lee Kitson
Due to the federal No Child Left Behind Act and accountability requirements, English language
learners (ELLs) in Kansas are expected to make progress in both content area academic
achievement and English language proficiency (ELP), as is measured using the state mandated
testing for Title I and Title III. In Kansas this is done using the Kansas English Language
Proficiency Assessment (KELPA) and the content assessments created by the Center for
Educational Testing and Evaluation (CETE) for Math, Reading, and Science. Using validity
theory as the framework, the intention of this study was to analyze the relationship between
students’ English language proficiency category, as measured by the KELPA, and their scores on
the content assessments in Math, Reading, and Science. One goal of the research is to examine
the predictive power of English language proficiency on content area assessment scores.
Additional demographic variables were added to the analysis to measure their influence on
content assessment scores. Multiple regressions and multiple ANOVA analysis were performed
on state-wide data for all ELLs in the state of Kansas in 3rd – 11th grade classified as ELLs, who
took the KELPA and at least one content assessment in 2010. The results confirm that English
language proficiency category positively corresponds to content area assessment score for all
skills examined. This means that the lower the English proficiency, the lower the content
assessment score. Like previous research, Reading had the strongest connection. Students with
exceptionality codes (gifted or learning disabled), the English language proficiency category, and
the Number of Years in the U.S., were all found to have significance, on average, at least 70% of

iv
the time Qualifying for Free and Reduced Lunch, Native Language, and Gender were found to
be significant between 60% - 70% of the time overall. When two demographic variables were
combined and analyzed as a pair, no pair combination was found to be significant more than
70% of the time overall. Total Proficiency Category and Exceptionality Code was the only pair
combination that had an overall influence above 60%, with an average of 67% across the skills.
Discussion is provided expressing the implications of these findings in regards to validity, as
well as specific suggestions for teachers, schools, state education systems, and the federal
education system. A final appeal is made to ensure that the assessments used with the ELL
population accurately reflect that population’s needs, and take into account the issues regarding
validity of assessment scores from the ELL population.
Keywords: assessment, NCLB, English language learners, English language proficiency, Title I,
Title III, validity theory, Exceptionality, Number of Years in the U.S., Free and Reduced Lunch
Program, Native Language, and Gender.
v
Acknowledgments
I would like to thank the members of my committee for their patience and understanding of all
the obstacles I faced during the writing of this dissertation. The statistics consulting lab at
Kansas State University. I would like to thank my friends, you know who you are, for the
support over the years. Their expectation that I would eventually finish this degree, helped drive
me. I would like to thank my mother, who never got the chance to go to college, I know this
does not make up for it--but I hope it helps. My father, who did not get the chance to call me
Doctor, but probably prefers it that way. To my brother, who waited patiently for me to
complete. My husband, who at times was beyond frustrated with my slow progression through
this project, but still supported me. Last, but certainly not least, to my son Alexander, without
whom this probably would have been done six months earlier--but at least he made that delay
worth it.
vi
Table of Contents
Acceptance ...................................................................................................................................... ii
Abstract .......................................................................................................................................... iii
Acknowledgements ........................................................................................................................ iv
Table of Contents ............................................................................................................................ v
List of Tables ................................................................................................................................. vi
Chapter 1: Introduction ................................................................................................................... 1
Introduction to the Problem ........................................................................................................ 1
Background of the Study ............................................................................................................ 6
Statement of the Problem ............................................................................................................ 8
Theoretical Framework ............................................................................................................. 12
Operational Definitions ............................................................................................................. 16
Chapter 2: Literature Review ........................................................................................................ 19
Related Literature ..................................................................................................................... 19
Test Usefulness ......................................................................................................................... 30
Conclusion ................................................................................................................................ 43
Chapter 3: Methods ....................................................................................................................... 45
Research Questions and Hypotheses ........................................................................................ 45
Data Analysis ............................................................................................................................ 54
Summary ................................................................................................................................... 56
Chapter 4: Results ......................................................................................................................... 57
Research Question 1: ................................................................................................................ 58
Research Question 2: ................................................................................................................ 86
vii
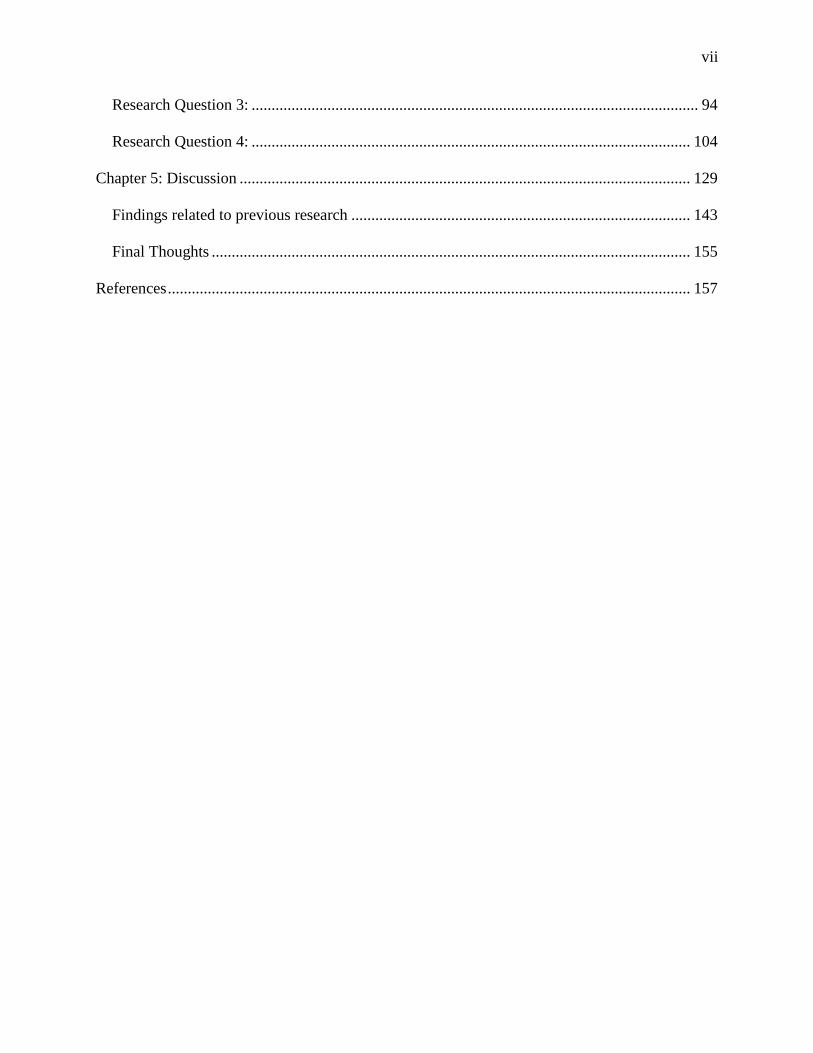
Research Question 3: ................................................................................................................ 94
Research Question 4: .............................................................................................................. 104
Chapter 5: Discussion ................................................................................................................. 129
Findings related to previous research ..................................................................................... 143
Final Thoughts ........................................................................................................................ 155
References ................................................................................................................................... 157

viii
List of Tables
Table 1: Kansas English Language Proficiency Assessment (KELPA) Performance Category
Definitions for Total Score............................................................................................................ 49
Table 2: Third Grade Math........................................................................................................... 59
Table 3: Fourth Grade Math ........................................................................................................ 61
Table 4: Fifth Grade Math ............................................................................................................ 62
Table 5: Sixth Grade Math ........................................................................................................... 63
Table 6: Seventh Grade Math ....................................................................................................... 64
Table 7: Eighth Grade Math ......................................................................................................... 65
Table 8: Ninth Grade Math........................................................................................................... 66
Table 9: Tenth Grade Math .......................................................................................................... 67
Table 10: Eleventh Grade Math ................................................................................................... 68
Table 11: Third Grade Reading .................................................................................................... 70
Table 12: Fourth Grade Reading ................................................................................................. 71
Table 13: Fifth Grade Reading ..................................................................................................... 72
Table 14: Sixth Grade Reading..................................................................................................... 73
Table 15: Seventh Grade Reading ................................................................................................ 74
Table 16: Eighth Grade Reading .................................................................................................. 75
Table 17: Ninth Grade Reading .................................................................................................... 76
Table 18: Tenth Grade Reading ................................................................................................... 77
Table 19: Eleventh Grade Reading............................................................................................... 78
Table 20: Fourth Grade Science ................................................................................................... 80
Table 21: Seventh Grade Science ................................................................................................. 81
ix
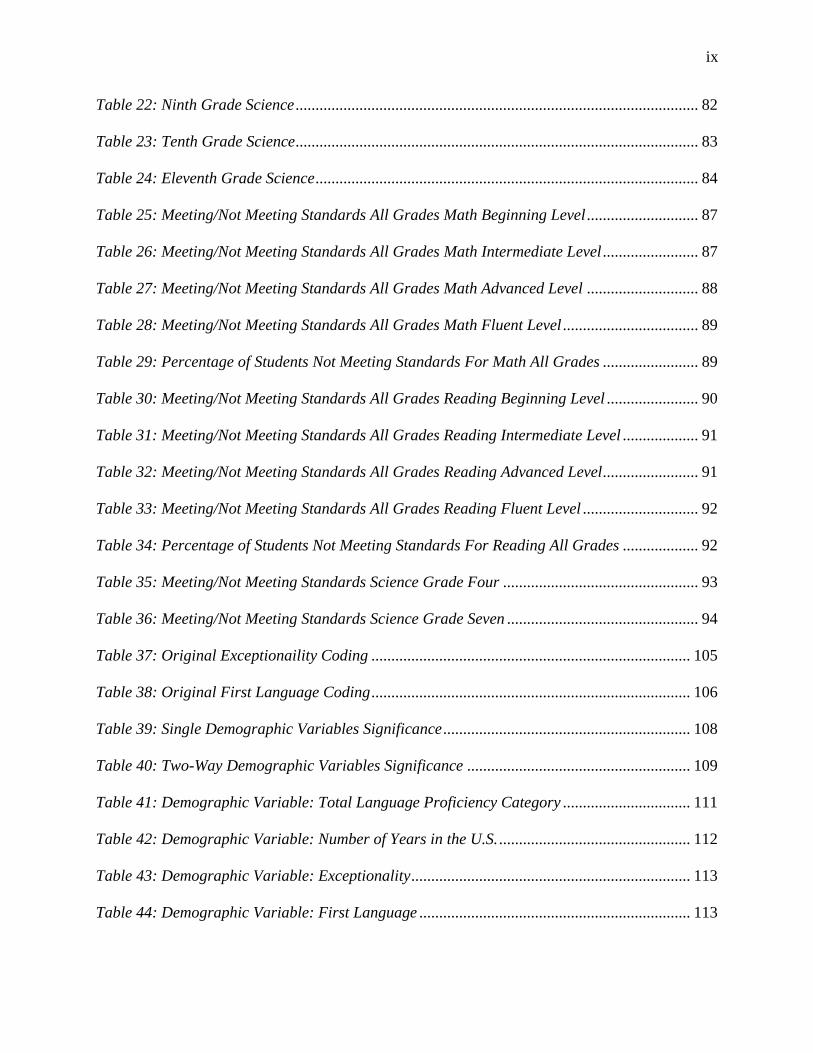
Table 22: Ninth Grade Science ..................................................................................................... 82
Table 23: Tenth Grade Science ..................................................................................................... 83
Table 24: Eleventh Grade Science ................................................................................................ 84
Table 25: Meeting/Not Meeting Standards All Grades Math Beginning Level ............................ 87
Table 26: Meeting/Not Meeting Standards All Grades Math Intermediate Level ........................ 87
Table 27: Meeting/Not Meeting Standards All Grades Math Advanced Level ............................ 88
Table 28: Meeting/Not Meeting Standards All Grades Math Fluent Level .................................. 89
Table 29: Percentage of Students Not Meeting Standards For Math All Grades ........................ 89
Table 30: Meeting/Not Meeting Standards All Grades Reading Beginning Level ....................... 90
Table 31: Meeting/Not Meeting Standards All Grades Reading Intermediate Level ................... 91
Table 32: Meeting/Not Meeting Standards All Grades Reading Advanced Level ........................ 91
Table 33: Meeting/Not Meeting Standards All Grades Reading Fluent Level ............................. 92
Table 34: Percentage of Students Not Meeting Standards For Reading All Grades ................... 92
Table 35: Meeting/Not Meeting Standards Science Grade Four ................................................. 93
Table 36: Meeting/Not Meeting Standards Science Grade Seven ................................................ 94
Table 37: Original Exceptionaility Coding ................................................................................ 105
Table 38: Original First Language Coding ................................................................................ 106
Table 39: Single Demographic Variables Significance .............................................................. 108
Table 40: Two-Way Demographic Variables Significance ........................................................ 109
Table 41: Demographic Variable: Total Language Proficiency Category ................................ 111
Table 42: Demographic Variable: Number of Years in the U.S. ................................................ 112
Table 43: Demographic Variable: Exceptionality ...................................................................... 113
Table 44: Demographic Variable: First Language .................................................................... 113
x
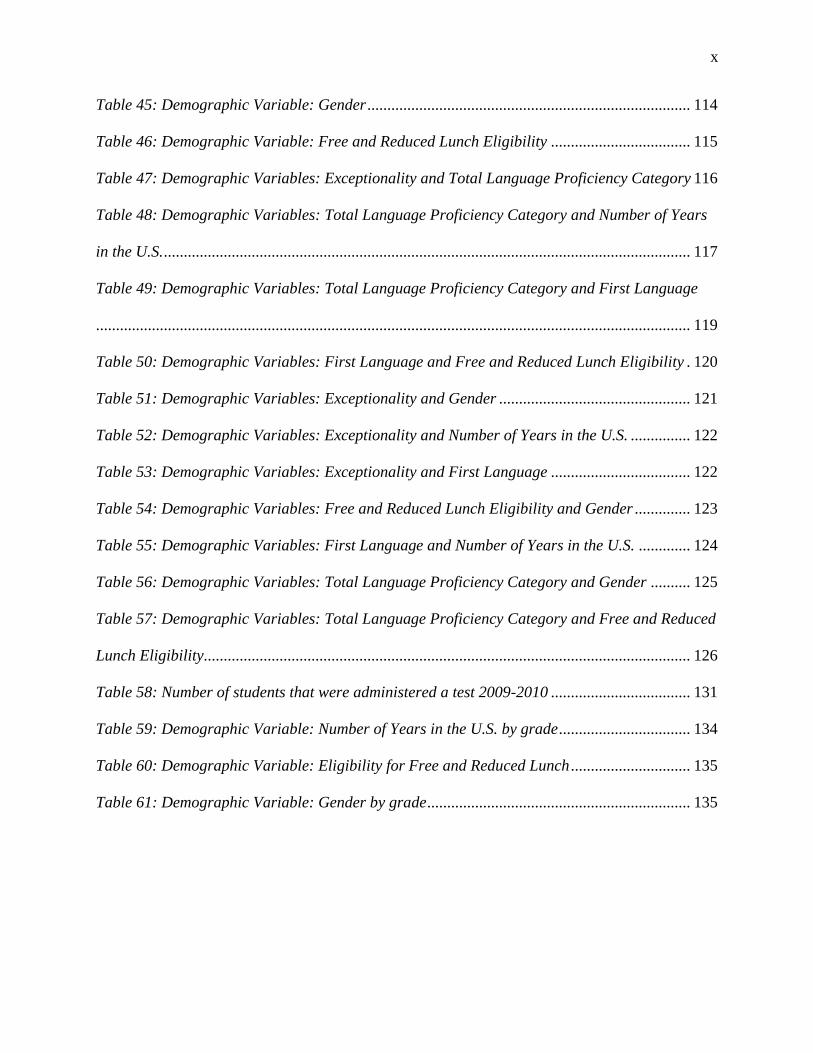
Table 45: Demographic Variable: Gender ................................................................................. 114
Table 46: Demographic Variable: Free and Reduced Lunch Eligibility ................................... 115
Table 47: Demographic Variables: Exceptionality and Total Language Proficiency Category 116
Table 48: Demographic Variables: Total Language Proficiency Category and Number of Years
in the U.S. .................................................................................................................................... 117
Table 49: Demographic Variables: Total Language Proficiency Category and First Language
..................................................................................................................................................... 119
Table 50: Demographic Variables: First Language and Free and Reduced Lunch Eligibility . 120
Table 51: Demographic Variables: Exceptionality and Gender ................................................ 121
Table 52: Demographic Variables: Exceptionality and Number of Years in the U.S. ............... 122
Table 53: Demographic Variables: Exceptionality and First Language ................................... 122
Table 54: Demographic Variables: Free and Reduced Lunch Eligibility and Gender .............. 123
Table 55: Demographic Variables: First Language and Number of Years in the U.S. ............. 124
Table 56: Demographic Variables: Total Language Proficiency Category and Gender .......... 125
Table 57: Demographic Variables: Total Language Proficiency Category and Free and Reduced
Lunch Eligibility.......................................................................................................................... 126
Table 58: Number of students that were administered a test 2009-2010 ................................... 131
Table 59: Demographic Variable: Number of Years in the U.S. by grade ................................. 134
Table 60: Demographic Variable: Eligibility for Free and Reduced Lunch .............................. 135
Table 61: Demographic Variable: Gender by grade .................................................................. 135

1
Chapter 1: Introduction
Introduction to the Problem
As the population of English Language Learners (ELLs) grows in the United States, an
increasing numbers of ELLs are entering schools across the country. ELL students are those
acquiring the English language as a second or additional language. There is no consistent way to
refer to those who are learning English. These students are referred to as ELLs, English as a
second language learners (ESL), limited English proficiency learners (LEP), language minority
learners (LM), learners of English as a second or other language (ESOL), students from non-
English backgrounds, and linguistically diverse students. There is no one standard term for
researchers to use when describing these students that is reflected in all literature and
government policy for this population. For the sake of this study, the term English Language
Learners (ELLs) will be used when referring to this group. According to Samson and Lesauz
(2009), the federal government uses “limited English proficiency”, but the most commonly used
term in the research was English language learner (ELL); for the sake of this study, ELL will be
the term used.
Samson and Lesauz (2009) stated that, “…the LM [language minority] population has
grown by more than 60% in the past decade, from approximately 3.1 million in the 1994–1995
school year to 5.1 million in the 2004–2005 school year” (p. 149). This expansion prompted
Menken and Antunez (2001) to say that half of the teachers in the United States should expect to
have ELL students in their classes. There is a consensus in the research that this is the fastest
growing group of students in the K-12 system in the United States (Wolf et al., 2008a; Tsang,
Katz, & Stack, 2008; Abedi, 2004; Kim & Herman, 2009). According to the National Center for
Education Statistics (2012), the number of ELLs in public schools in the United States grew from

2
8%, or approximately 3.7 million students, in 2000–2001 to 10%, or approximately 4.7 million
students, in 2009–2010. ELLs made up between 7 and 14 % of the student population in the state
of Kansas in the 2009–2010 school year. Kansas experienced a 5% population growth in ELLs in
public schools from the school year 2000–2001 to 2009–2010.
It is safe to say that the size and growth of this group make it a population that cannot be
ignored. The United States requires everyone to be given the opportunity to be educated through
the Equal Educational Opportunities Act (1974) (Public Law (PL) 93–380) and more recently
with the No Child Left Behind Act (2001) (PL 107–110). Numerous court cases and other acts
have influenced ELL education in the United States. Perhaps the most influential case is Lau v.
Nichols (1974) (414 U.S. 563), where the courts found that ELLs should be treated equally with
other students and given the same opportunities to learn, including additional English instruction
to facilitate English language acquisition.
Through the NCLB (2001), there are explicit stipulations for assessing all students in the
K-12 system. No matter the proficiency or duration of time in the country, all ELLs have to be
given assessments. They are given their core content assessments, Title I, from the state as well
as an English proficiency assessment, Title III. The English proficiency assessment has to be
given to all students identified as ELLs. Students in Kansas are identified by completing a
“Home Language Survey” (KSDE, 2014, p. 1). If on that survey a language other than English is
mentioned, then the student is identified to take a language proficiency assessment (the specific
test is based on their grade level). If the student scores below, “fluent/proficient” (KSDE, 2014,
p. 1) in any area, then they are identified as an ELL and referred for services. The States’ content
assessments are a little different. All students have to take the Math assessment once they reach
the third grade, but the other assessments (Reading and Science) can be skipped during the

3
ELLs’ first year in the United States. After the first year, all ELLs are required to take all state
assessments like any other student in their grade. The scores from these tests are not used for
accountability purposes for the first year (Neill, 2005; Rabinowitz, 2008). This study attempted
to determine if it is valid to test all levels of English proficiency among English Language
Learners (ELLs) on state-mandated content assessments. This study aimed to show that
assessments should reveal students’ understanding of content, rather than their understanding of
content through the lens of their English proficiency.
A few studies have attempted to show the relationship between language proficiency and
standardized content assessment scores, and many show the gap between ELLs and non-ELLs.
Studies that focus on English language proficiency and content assessment scores are still rare,
and none were found for Kansas, looking at the Kansas English Language Proficiency
Assessment (KELPA) and standardized content assessment scores. Lack of research on the
validity of using standardized content assessments with all proficiency levels of ELLs, but
requiring all students to be assessed made this study important.
Young, Holtzman, and Steinberg (2011) studied how ELLs performed on Math and
English language arts tests, based on their status as ELL, former ELL, or non-ELL. For one state,
they found that native speakers had the highest mean scores and ELLs had the lowest mean
scores. The former ELLs were in the middle. For the second state in their study, they found that
former ELLs had the highest mean scores while non-ELLs scores were a little lower. ELLs had
the lowest average scores. Young, Holtzman, and Steinberg (2011) also found that ELLs had the
highest amount of score variance. This was surprising to them as in previous studies they
referenced, ELLs had lower amounts of score variance. They attributed that difference to the
similarity of proficiency level (on the lower end of the scale) of the ELLs that were in the study.

4
Tsang, Katz, and Stack (2008) studied the achievement tests of ELLs and the Re-
designated Fluent English Proficient (RFEP). They found that correlations were higher between
Reading and Math (story problems) than correlations between Reading and Math (equations).
They also looked at how long ELLs were in school, and used that as a measure of how long they
had studied English. They found that as the students spent more time in school, they started to
meet the national norming sample. There was little difference due to the language background
(only one year in their study). Their findings regarding the timeline to learn English support the
body of research that it takes five to seven years to learn the language. Tsang, Katz, and Stack
(2008) also indicate their results support, “creating more flexible approaches in accountability
systems to determine the achievement of ELLs” (p. 20). They go on to call for reforming the
process for annual yearly progress.
Beal, Adams, and Cohen (2010) conducted a study investigating performance by
proficiency on Math tests by high school students. They conducted a one-way analysis of
variance using English language proficiency levels and the Math exam as the dependent variable.
They found that non-ELLs and the top two proficiency categories had similar Math scores.
Those scores were higher than those of their lower proficiency level peers. Students with higher
levels of English proficiency performed better on their Math and problem-solving tests. Beal,
Adams, and Cohen (2010) then conducted a regression to see if scores for the subskills of
listening, reading, speaking, and writing were predictors for math scores. They did not find any
subskill area to be significant, but Reading was close at p = 0.067 (p. 67). They state, “A
minimum level of reading proficiency is required before improvements in math performance will
be observed” (p. 67). Their results suggest that there is a non-linear relationship between math
and reading proficiency.
5
Butler and Castellon-Wellington (2005) examined the relationship between the language
proficiency scores of ELLs and their scores on the Stanford 9 reading, language, and math
assessments. They looked at the third grade (n = 778) and 11th grade (n = 184) using the
categories; English only (EO), fluent English proficient (FEP), and limited English proficient
(LEP). By using a multivariate analysis of variance (MANOVA), they found that at the third
grade level there was a difference in test scores across all tests based on language performance.
They also found that LEP students in this grade performed significantly worse than any other
proficiency level on all parts of the Stanford 9 assessments. In eleventh grade, they found that
EO students performed the best. They were unable to conduct a MANOVA due to the limited
population in eleventh grade, but indicated that the difference in means across the different
proficiency levels was significant. Butler and Castellon-Wellington (2005) found that English
proficiency scores could account for content score variation, with LEP students constantly
performing poorly on content assessments based on their proficiency levels. The higher levels
performed significantly better than the lower levels.
It is clear that there is a relationship between ELLs English Language proficiency level
and content assessment scores, which is especially pronounced between the highest and lowest
proficiency levels. The current research explored the relationship between English language
proficiency level and the content assessment scores in Kansas to determine how proficiency level
influences content achievement. This study was carried out using data obtained from the state of
Kansas Kindergarten-12th grade (K-12) assessment system, which at the time of data collection
was contracted through the Center for Educational Testing and Evaluation (CETE) at the
University of Kansas. Findings of an analysis of ELL students’ performance on the states content

6
assessments will be reported. The ELLs were divided into proficiency groups based on their
scores on the state’s English language proficiency assessment, the KELPA.
Background of the Study
The NCLB act mandates that all students be assessed (Abedi, 2001; Albus, Klein, Liu, &
Thurlow, 2004; Katz, Low, Stack, & Tsang, 2004; Menken, 2010; O’Conner, Abedi, & Tung,
2012; Rabinowitz, 2008). “All students” includes those classified as ELLs, who are considered a
subgroup of the overall population. In much of the previous research related to this population,
ELLs are treated as a single subgroup. This approach treats the group as if it were a
homogeneous group, when it is not. This approach also focuses on the gap between ELLs and
their non-ELL peers (Abedi, 2004; Abedi, Hofstetter, & Lord, 2004; Abedi, Lord, Boscardin, &
Miyoshi, 2001; Butler, Orr, Bousquet Gutierrez, & Hakuta, 2000; Katz, Low, Stack, & Tsang,
2004; La Celle-Peterson & Rivera, 1994; McNamara, 2011; Menken, 2010; Neill, 2005;
O’Conner, Abedi, & Tung, 2012; Pappamihiel & Walser, 2009; Wolf et al., 2008b). There are
obvious differences in language, culture, length of time in the United States, race, and
socioeconomic status, to name a few. There is also the issue of language proficiency. All ELLs
are required to take a state-level language proficiency assessment every year. If we take two
students, one at an advanced level and one that moved into the country one year ago and has
been placed at the beginning level, it is expected that they score differently on their content and
language proficiency assessments, due to their differing levels of English proficiency.
Nonetheless, much of the current research focuses on the gap between ELLs and non-ELLs. This
research would put these two students together along with all other ELLs to form the single
subgroup of ELLs.

7
One factor that contributes to making across-state comparisons of the English proficiency
level difficult is that each state determines how many proficiency levels they will have and to
what scores those levels correspond. While the English proficiency assessment of each state is
different, there are certain parts in common for all the states. All ELL students are required to
take the test and all students receive a score. In Kansas, the KELPA divides students into four
proficiency levels. Another similarity in the tests is that there are certain factors that are
mandatory for all English language proficiency assessments. The assessments have to have
reading, writing, listening, and speaking; they must assess the academic language of the student,
and align with the state’s language proficiency and state content standards. Therefore, while all
states will have different English language proficiency assessments, there are some common
components to the design of the assessment. There are also some similarities in the uses of the
assessment. Schools use the data to determine what language services to offer ELLs; they are
also required to report students’ scores for their school’s accountability. While each state may
design their own assessment instrument, there are many similarities in both the elements required
of the test and the use of the test scores.
The linguistic demands of the content assessments are often beyond the lower level ELL
students’ capabilities. Testing all proficiency levels with a general assessment, i.e. one not
specifically designed for ELLs (Abedi, 2001; Neill, 2005; Pappamihiel & Walser, 2009;
Solórzano, 2008), renders the lower proficiency level English students to be placed in a position
of disadvantage. A low proficiency student may have excellent math skills but not be able to
navigate a math test in English due to the complexity of the language required to complete the
test. This brings into question the validity of the content assessments for ELLs. Currently, all
ELL students are treated the same way with regard to state-mandated testing. The linguistic

8
demands of the standardized content assessments are based on academic English that takes
longer to master than conversational English, which students are usually more familiar with. Jim
Cummins has spent much of his career looking at the various aspects of academic language
demands and has suggest that students are often ill prepared for the rigors of high linguistic
demand assessments (Cummins, 1980, 1984, & 2008).
Statement of the Problem
Title I, Title III assessments, and accountability programs require that ELLs not only
improve their English language proficiency, but also advance their academic knowledge. While
content assessments (Title I) were not necessarily normed for this population (Abedi, 2001; La
Celle-Peterson & Rivera, 1994; Neill, 2005; Pappamihiel & Walser, 2009; Solórzano, 2008) they
count toward school accountability goals. The problem investigated in this research is the
validity of using the test scores from ELLs on their content assessments for making decisions
that could potentially affect the student, school, district, and even possibly the state. This study
intends to show that English language proficiency should be a factor in determining an
individual’s participation in unmodified state content assessments. By examining the proficiency
levels assigned by the KELPA, and by considering how ELLs score on their content assessments,
decisions can be made about who is capable of succeeding on regular content assessments and
who would benefit from modified or alternative assessment. This relates directly to the validity
of the assessments used with ELLs. As proffered by Wolf, Herman, and Dietel (2010), validity
is, “the degree to which an assessment system produces accurate information about ELL
students’ performance and provides a sound basis for policy decision-making” (p. 1). If language
proficiency influences the standardized content assessment scores of students, then the validity

9
of those assessments is in question with ELLs. This information can help, in turn, to inform
policy with the aim of serving this population better.
Another facet of looking at ELL test performance is determining if a student’s content
score can be predicted based solely on English language proficiency. If English language
proficiency can predict content scores for ELLs, then modifications to the current practice of
testing all language proficiency levels in the same manner can be suggested. This may not be
universally expressed over all proficiency levels. Having a better understanding of the results for
ELLs will help guide policy for the future in how this population should be tested and even how
this “group” should be viewed. Can this “group” be clearly defined as such? Grouping ELLs also
leads to the inclusion of demographic variables that may influence content assessment scores.
It is clear from the research that ELLs do not all have the English language proficiency to
succeed on content assessments in an unmodified way, but few studies focus on the language
proficiency level to demine at what point ELLs become successful on content assessments. In
Kansas, no formal study has been conducted to connect the KELPA score to the content
assessment score for all areas. Therefore, a study linking the two tests will help provide a better
understanding of what language proficiency level is needed in order to succeed on the state
content assessments.
Objectives of the dissertation research (purpose of the study)
The purpose of this quantitative study was to test the validity of using standardized
content assessments with all levels of English language proficiency. Does higher language
proficiency lead to higher content assessment scores? This research relates the English language
proficiency level (independent variable) to the content assessment scores (dependent variable).
Demographic variables, including language proficiency level (independent variable) are also
10
used to examine content assessment scores (dependent variable) to see if relationships between
test performance and membership in a particular demographic group exist. This research would
encourage the implementation of assessments that judge the students’ understanding of content,
rather than their understanding of content through their English language ability.
This research will help determine a level of language ability that has improved
performance on standardized content assessments based on grade level. The quantitative nature
of the study allowed the researcher to look at vast amounts of data for the entire state, rather than
relying on a single district or area. This will allow the results to be more universally applicable
across the state as well as across other states with similar demographics. To determine if an
ELL’s proficiency level affects their performance on the content assessments, two factors need to
be analyzed. The first factor is the level of language proficiency of the student. This information
can be acquired from the state’s language assessment, the KELPA. The second factor is the
student’s score on the content assessments, which can be obtained from the state’s testing
program. With all the test scores, collected analysis can be conducted to determine the extent to
which English language proficiency influences content assessments. The inclusion of the
demographic variables will help reveal other areas of potential concern relating to validity.
Significance of the Study
This study could help lead to a change in the policy of testing all ELLs regardless of their
proficiency level, and including their content assessment scores as part of the school’s Adequate
Yearly Progress (AYP). If a relationship is found between English language proficiency level
and content assessment scores, that relationship can be further analyzed to improve the testing
system. This study was aimed at separating the ELL subgroup into those who can show their

11
content knowledge because their proficiency is adequate, and those whose proficiency level
prevents them from demonstrating their understanding of the content.
The group that will benefit the most from this study is the ELL students. No student
wants to take a test where failure is certain, or feel that they failed a test they could have passed
without language barriers. This study will directly help policy makers reevaluate their policies on
uniformly testing all ELL students for content assessments. This study may also guide policy and
practice to acknowledge the difference between proficiency levels and their ability to perform on
assessments. There has been research on linguistic modification (Abedi, 2007) that reveals the
ability to lighten the linguistic load for content assessments, which could be emphasized if
language proficiency is found to be a significant factor in content performance. This study aimed
at contending that ELLs should be given the same opportunities to demonstrate their knowledge
regardless of their English linguistic development.
The need for this study stems from the uniform policy currently in place testing all ELLs
on standardized content assessments. The blanket approach to treating all ELLs the same
regardless of their proficiency level is another way to place certain ELL students at a
disadvantage. If a student does not have the basic language ability to take and pass a test,
regardless of content, that student is not benefiting from the process and neither is the school.
Due to current structure of accountability, schools with large ELL populations are performing
poorly in terms of their yearly progress, which can lead to funding cuts, the loss of jobs, or even
building closure. Properly testing students with regard to their language and content ability is
critical in making such high-stakes decisions.
12
Theoretical Framework
The concept of differential validity (Rabinowitz, 2008; Young, 2009) and the test
usefulness theory (Bachman & Palmer, 1996) were used to design this study. Differential
validity is the idea of judging the performance of ELLs and dividing them into subgroups. This
would include research into how the ELL subgroup performs compared to other groups in
content assessments (such as non-ELLs), but it would also include how subgroups within ELLs
perform (such as separating them by proficiency level or demographic variables, as done in the
current research).
Bachman and Palmer (1996) articulated the “test usefulness theory” as six main aspects
to evaluate tests on: reliability, which is defined as “consistency of measurement” (p. 19);
validity (primarily construct validity), which is defined as “the meaningfulness and
appropriateness of the interpretations that we make on the basis of test scores” (p. 21);
authenticity which is defined as, “ the degree of correspondence of the characteristics of a given
language test task to the characteristics of a TLU (Target Language Use) task” (p. 23);
interactiveness which is defined as, “the extent and type of involvement of the test taker’s
individual characteristics in accomplishing a test task” (p. 25); impact, which is discussed in two
ways, “a micro level, in terms of individuals who are affected by the particular test use, and a
macro level, in terms of the educational system or society” (p. 29–30); and practicality which is
defined as, “the ways in which the test will be implemented, and, to a large degree, whether it
will be developed and used at all” (p. 35).
For the current research, the focus will be on validity (especially differential and
construct), interactiveness, and impact. These areas relate to language proficiency and content
assessment scores. To accomplish this, demographic variables that could be potential threats to
13
within group validity will be analyzed, and the role they could play in the nature of the impact of
the test scores. Language proficiency could create construct-irrelevant variance (Abedi, 2005;
Bachman & Palmer, 1996; Rabinowitz, 2008; Young, 2009) in content assessments. If language
proficiency has an impact on content assessment scores, and that is not part of the construct, then
it is a threat to construct validity.
Rabinowitz (2008) provides guidelines for future validity research that helped serve as a
foundation for this study. Rabinowitz suggested there were, “standard practice specialized
validity studies” (p. 21). These studies can be conducted right now, based on the records that are
already required for each state and would pose no threats to the population. He suggests there are
two categories in this area: Category I studies (ELL performance on English Language
Proficiency [ELP] assessments vs. content assessments), and Category II studies (ELL
performance vs. Non-ELL performance on content assessments). The current research is a
Category I study. Rabinowitz (2008) indicates that states should be able to predict the content
assessment scores of ELLs based on their language proficiency and that as proficiency levels
increase, so should content score results. There are three questions that Rabinowitz (2008)
suggested as a part of Category I studies, “How strong should the relationship be between ELP
level and content mastery?... Should the relationship between ELP levels and content mastery
differ by content area?... Should the relationship between ELP levels and content mastery differ
by language group (or other demographic indicators)?” (p. 24). These questions helped guide the
current research and led to the research questions of this study. Through the lens of validity, we
can examine the fairness and impact of using these test scores for decisions about this
population.

14
Research Questions
Do all ELLs perform in the same manner on their content assessments? Does having
higher English language proficiency change the outcomes on content assessments? Are there any
other demographic variables that change the outcomes of content assessments? One way to
answer these questions would be to look at the different levels of proficiency separately and see
how they are performing on their content assessments based on their grade. The idea that
different proficiency levels might perform differently led to the first research question.
Research Question 1: What are the outcomes of Kansas content area assessments for
Mathematics, Reading, and Science for ELLs by language proficiency level?
Hypothesis 1: The performance of ELLs on the content assessments will be influenced
by the ELP category. This difference between proficiency categories will be especially
pronounced between the lower English Language Proficiency categories and the higher
ones (between Beginner and Advanced, Beginner and Fluent, Intermediate and
Advanced, Intermediate and Fluent).
To examine the relationship between KELPA proficiency level and content area scores,
factors need to be analyzed further. The next research question focuses on how ELLs perform on
the content assessments in Reading, Math, and Science based on their language proficiency.
Research Question 2: What are the relative effects of proficiency level on assessment
scores across grade levels?
Hypothesis 2: As the cognitive demands on the content assessment increase, i.e. as grade
level increases, the number of low language proficiency students not meeting state
standards will become more pronounced. If the null hypothesis were used in this
15
situation, it could be assumed that no difference would be perceptible based solely on
proficiency level.
A facet of assessing performance is predicting what students will do. Is there a way to
predict students’ performance on their content assessments through their proficiency level on the
KELPA? This led to the next research question.
Research Question 3: To what extent does the KELPA predict students’ scores on
content assessments in Math, Reading, and Science?
Hypothesis 3: The scores on the KELPA will not be a predictor of content area scores in
Math and Science, but will be in Reading.
Research Question 4: What role do other demographic variables (such as Free and
Reduced Lunch, Native Language, Gender, Length of Time in the U.S., or Exceptionality
Code) play in student achievement on content assessments for ELLs?
Hypothesis 4: Some variables will reflect a positive relationship with student
achievement (Native Language and Length of Time in the U.S.), no relationship with
student achievement (Gender), or a negative relationship with student achievement (Free
and Reduced Lunch and Exceptionality Code).
Repeatedly administering assessments that a student will fail does not help anyone. In
this age of accountability and standardized tests, the learning process may have been left behind.
ELLs have to struggle to both learn the language of instruction as well as the materials being
covered in that instruction. It is the researchers’ contention that testing them in the same manner
as non-ELLs is doing a disservice to them. Likewise, testing them with tests that were designed
and normed on native speakers does not take into account their unique learning situation. The
results of this analysis contains recommendations about the appropriate time to test ELLs with
16
unmodified content assessments, as well as suggestions to reduce the influence of other factors,
with the goal of creating the most valid test possible.
Assumptions and Limitations
An assumption of this study is that every year students will perform similarly on their
assessments so that the results could apply to years beyond what the current research specifically
looks at. Currently, the research has not tracked longitudinally to see how ELLs improve and
change over time. Due to the use of only one years’ worth of data, basic assumptions of the
initial patterns of performance have been drawn from the results of the proficiency tests.
A limitation of this study is that it extends only to the state of Kansas. Due to the nature
of English proficiency assessments, each state has a different assessment. Each state determines
its own standards, cut scores, and proficiency levels. This study has only used Kansas data, so it
cannot be extrapolated to other states. It may be possible to extrapolate the results to other states
that have a similar ELL population. The results can indicate areas of weakness that need to be
evaluated in each state’s system and overall policy changes that can be made to the system.
Operational Definitions
Comprehension of certain terms is essential to understand the field of language testing.
Some of these have already been discussed. As discussed before, English Language Learners
(ELLs) are those individuals who are learning English as a second or additional language. The
following is a review of the key terms.
English Language Learner (ELL). Students are defined as ELLs if they have a native
language other than English, or if there is the presence of another language besides English in
their homes, and they are not yet fluent in English as measured by an English language
proficiency assessment (KSDE, 2011, p. 4)

17
English Language Proficiency Assessment (ELPA). ELPA is a measure of the English
language proficiency of an ELL in four different domain areas: Listening, Speaking, Reading,
and Writing (KSDE, 2015a, para. 1). This is a requirement for Title III.
Kansas English Language Proficiency Assessment (KELPA). ELPA developed by the
CETE for the Kansas State Department of Education to measure English language proficiency of
ELLs in Kansas as part of the Title III mandate is known as the KELPA (KSDE, 2015c, p. 1).
Social language. It was formerly referred to as Basic Interpersonal Communication Skills
(BICS). This is the everyday language of social interactions. This is an informal language and
depends more on social interaction for meaning (Cummins, 2008; KSDE, 2011).
Academic language. This was formerly referred to as Cognitive Academic Language
Proficiency (CALP). This is the language of classroom instruction and content terms. It is
associated with literacy and academic achievement including specialized vocabulary and
discourse (Cummins, 2008; KSDE, 2011).
Content assessments. Those assessments dealing directly with a specified content area,
including English language arts (ELA)/Reading, Mathematics, and Science to assess students’
understanding of content area (Young, Holtzman, & Steinberg, 2011). This is a requirement for
Title I.
Summary
In this chapter, a brief background of the ELL population is given and then the issue of
ELLs taking content assessments is introduced. The framework of test usefulness and validity
theory was discussed to establish the foundation for the study. The goals of this study were
discussed related to the issue of the possible relationship between language proficiency and
18
content assessment scores, and the scope of its influence on the ELLs test scores is determined.
Four research questions are laid out to examine possible relationships.
In the following chapter, a review of the literature related to this topic will be discussed,
focusing on the validity, interactiveness, and impact of tests for this population, as well as
current testing practices and further background of the population. In Chapter 3, the research
methodology will be described, including the research design. There is an explanation of the
population of the study, the instruments used, the analysis used, and ethical issues of the study.
Chapter 4 will contain a description of the analysis of the data and a summary of the conclusions
for each research question. Lastly, Chapter 5 will be a discussion of the results, conclusions,
recommendations to concerned parties, and limitations and recommendations for the future.
The intent of this research study is to add in the understanding of the relationship between
English language proficiency in Kansas ELLs and their subsequent performance on mandated
content assessments in English Language Arts (ELA)/Reading, Mathematics, and Science. This
critical examination of the validity of using the same content assessments with ELLs could help
motivate test developers, policy makers, and decision makers to address the issue of language
proficiency in their testing plans and development. I hope that this study will facilitate
understanding of the validity issues involved in content assessments for the ELL population and
how that influences accountability.

19
Chapter 2: Literature Review
Related Literature
This study stems from the inclusion of ELLs in assessments that are being used for school
accountability. The foundation of this study is the idea that all students have the right to receive
fair and valid assessments. This includes both English language proficiency assessments as well
as general content assessments. It is important to understand that all tests administered to ELLs
are in some way measuring their English language ability. It is because of this connection between
assessment and language ability that these “large-scale, standardized assessments for ELLs have
garnered attention” (Bunch, Shaw, & Geaney, 2010, p. 186).
The first step is to look at the population taking the test. In the United States, ELLs are a
growing population with their own needs. According to the National Clearinghouse for English
Language Acquisition and Language Instruction Educational Programs (2011), there were
approximately 5.3 million ELL students in preK-12 in 2008–2009 in the United States. This
accounted for around 10.8% of all public school students. In 1998–1999, there were 3.5 million
ELLs in public education, which indicates an ELL population growth of over 50%. In some
districts or individual schools, ELLs can account for half of the student population or more. This
population needs to be considered when designing and constructing the general education tests
required by NCLB (2001) or other mandated state testing.
ELL Proficiency Testing
On top of taking the content assessments, all ELL students are required to take the state’s
English Language Proficiency assessment and in the state of Kansas, it is called the KELPA.
Each state is responsible for creating or acquiring an English language proficiency assessment of
their own to use for the purpose of accountability. This is referred to as Title III of the NCLB and

20
it requires that ELLs show they are making progress in acquiring English language proficiency
(Pitoniak et al., 2009). The KELPA has four domains, reading, writing, listening, and speaking.
The students receive a domain score as well as an overall composite score that contains a
weighted representation of the domain scores depending on grade level.
There are arguably different types of language that ELLs have to learn to succeed on the
states’ language proficiency assessment. One type is the language that has been referred to as
social language or BICS. Social language is the everyday common language used for spoken
communication (Cummins, 1984). Alterations made to this theory came from Gee’s (1990)
“primary discourse”, Gibbons’ (1991) “playground language” and research from Biber (1985)
and Carson (1995) dealing with specific lexical differences in language used in different
situations. Cummins’ new description of this language is conversational fluency (Cummings
2008) but the idea remains the same, this is the daily conversational language used. Another type
of language is academic language or CALP, which is the instructional language and vocabulary
used in the classroom (Cummins, 1984; Scarcella, 2003). Again, Cummins made alterations to
this definition based on research by Biber (1985), Carson (1995), Gee’s (1990) “secondary
discourse” idea, and Gibbons (1991) “classroom language” and is now referred to as academic
language proficiency (Cummins 2008).
The idea that there are separate types of language to be tested on an English proficiency
assessment does raise some concerns. What skills are we really testing on the English language
proficiency assessment? How can a student speak English well, but do poorly on the language
proficiency assessment? A student may have a good handle on the conversational fluency aspect,
but still do poorly on the state’s language assessment due to their low level of academic language
proficiency. Before the current NCLB legislation that requires academic language proficiency be
21
tested as well as conversational fluency was enacted, many tests were designed without taking
into consideration academic language proficiency. Without considering a students’ academic
language proficiency, they would be ill prepared for their academic careers in school and their
subsequent content assessments.
The NCLB mandates that all state ELP assessments include reading, writing, listening,
and speaking, assess a student’s academic language proficiency; align with the states language
proficiency requirements, and align with the states content standards (Abedi, 2008). This is
asking a lot of a proficiency assessment. The issue this study is looking at is the validity of using
general content assessments with all ELLs, no matter what their ELP level is. It is generally
accepted that it will take 4–7 years to learn English (Hakuta, Goto, & Witt, 2000; Tsang, Katz, &
Stack, 2008; Abedi & Herman, 2010). This does not mean that students are fluent at this point,
but rather this is the point at which they “overcome the language demands of mathematics word
problems in standardized achievement test” (Tsang, Katz, & Stack, 2008, p. 19). Tsang, Katz,
and Stack go on to say that in these years, learners are gaining the required language skills to be
able to “negotiate in mainstream classrooms” (p. 19). According to Abedi and Herman (2010),
this time is “to gain sufficient mastery of academic English to join English-speaking peers in
taking full advantage of instruction in English” (p. 725). Yet all ELLs are tested immediately
upon arrival (within 30 days of being in a district) in English and within a year in all other grade
level content, even though their scores do not influence accountability. Conversational fluency
may develop more rapidly, but it is not the only thing being tested. The lower the level of
proficiency the student has, the more linguistically demanding the general content assessments
may be for them, due to their lower conversational fluency as well as their lower academic
language proficiency.

22
State Assessment of ELLs
Though there is federal law supporting the inclusion and education of ELLs in the public
school system, there are also methods of addressing the measurement of the education that these
students receive. Currently, in the United States, all students are required to take content
assessments for accountability due to the NCLB (2001) Act. This is referred to as Title I of the
NCLB, where all students, including ELLs, have to perform in terms of accountability and AYP
(Pitoniak et al., 2009). ELLs are required to take the Reading content assessments after one year
in the United States, once they reach the third grade. During the first year after arrival, ELLs
have the option of taking the Reading content assessment, or using their KELPA score, and they
are required to take the Math and Science assessments, though they do not count toward AYP
(Pappamihiel & Walser, 2009). The Science assessment for Kansas is required in the fourth and
seventh grades and twice in the ninth to eleventh grades for all students.
For ELL students, a content assessment is also a measure of their language ability.
Several studies on ELLs have analyzed them as one subgroup (Abedi & Gandara, 2006; Pitoniak
et al., 2009; Young, Holtzman, & Steinberg, 2011), but by analyzing ELLs this way they have
ignored one of the basic features of the group. This is not a homogenous group of students
(Bailey & Huang, 2011). They have different language proficiency levels, content knowledge,
formal instruction time, native languages, durations of time in the United States, and many other
factors that make members of this population unique. A student’s proficiency level in English
will be a factor in a student’s ability to decode the content on the assessment successfully. The
duration of time spent in the U.S. will influence both the knowledge of English and the content.
23
Linguistic complexity on content assessments
One reason why students might underperform on content assessments, is that they are
too linguistically demanding. A student might be capable of complex mathematics, but may not
be able to read and understand the directions to answer the question correctly. This illustrates
how linguistic complexity could play a role in a student’s ability to perform on their content
assessments. This affects the reliability and validity of the assessments, “Research clearly has
shown that unnecessary linguistic complexity of assessment negatively impacts the reliability
and validity of assessment for ELL students” (Abedi & Herman, 2010, p. 725). When looking at
standardized content assessments, Abedi and Gandara (2006) had this to say, “Due to the
complex linguistic structure of these tests, ELL students’ performance outcomes are very likely
to be underestimated” (p. 39). There are very real implications that for these tests, not only will
ELLs be facing validity and reliability issues related to the linguistic complexity of the
assessment during the testing, but they will also face issues related to their placement based on
the test results after the assessment is completed.
There are reasons for reducing the effects of linguistic complexity on the test takers and
on their placement. Abedi and Gandara (2006) mention,
“(1) reducing the linguistic complexity of assessment tools helped ELL students to
perform significantly better because it reduced the performance gap between ELL and
non-ELL, and (2) the process of reducing linguistic complexity of test items did not alter
the construct under measurement” (p. 39).
Abedi and Gandara have shown in their research that changing the linguistic load would
allow ELLs to be assessed more validly while maintaining measurement of the same construct as
the assessment was originally supposed to measure. This would be a way to alter the existing test
to be more reliable and valid for our ELLs. This idea is shared by Bunch, Shaw, and Gearney
(2010) with the addition of using performance assessments “due to putative reductions in
24
linguistic demands, performance assessments have also been touted as more valid measures of
content learning for ELs” (p. 187). There are many ways to reduce the linguistic complexity of
ELL assessments. The goal is to make sure the construct remains unchanged and that the tests
reliability and validity with the ELL population are improved, while not altering the reliability
and validity of the non-ELL population also being measured by the assessment.
One option discussed through research is that of reducing the linguistic complexity. This
goes beyond in-class test accommodations to the idea of linguistic modification in the test design
itself. According to Abedi (2007), linguistic modification is reducing the unnecessary linguistic
complexity of an item or assessment. This is a uniform and standardized modification made to
the assessments, unlike accommodations which depend on those administering the test in each
school. Linguistic modification has not only shown improvement for ELLs, but “research
indicates that linguistic modification helps performance of other low-performing students, not
just ELL students” (Wolf, Herman, & Dietel, 2010, p. 6). This concept allows test developers to
ensure that their construct is being measured reliably and validly while making a modification
that can improve ELL students’ opportunities on assessments.
The performance gap between ELLs and non-ELLs
Standardized tests have two very distinct impacts on K-12 education in the United States.
It is a matter of thinking in terms of the school and the students. There are repercussions for both
based on a student’s performance on a standardized test. Performance on standardized tests can
play a role in funding, advancement through grades, placement, etc. Research has already
established that ELLs face challenges that their native-speaking peers do not. It is important to
look at the performance of ELLs compared to their native-speaking peers. In the CSE Technical
Report 663, the authors present different research studies related to this issue. They call it a
25
performance “gap”, referring to the gap between ELLs and native English-speaking students or
non-ELLs. Within the first few pages of that study, they contend, “There is a gap between the
performance of English language learners (ELLs) and their native English-speaking peers (non-
ELLs)” (Abedi, et al., 2005, p. 2). The findings of one of the articles in the report state a very
similar idea, “As expected, the LEP (limited English proficient) students in the sample
performed less well than the non-LEP students” (p. 47). This idea is echoed through the research
presented in this report. One article states that, “The results of analyses comparing ELL and non-
ELL students indicated that ELL students performed substantially lower than non-ELL students.
This finding is consistent across grade levels, test levels, and across different sites” (Abedi,
Leon, & Mirocha, 2000/2005, p. 26). This report is clear in its research presented that there is
indeed a gap between ELLs and students not classified as ELL. This is the idea that Abedi and
Gandara (2006) presented by suggesting that since ELLs do not have a high command of the
English language, their assessment performance is affected by their ability to use and understand
the language. Their solution, “both learning and assessment conditions must be addressed to help
close the performance gap” (Abedi & Gandara, 2006, p. 37). According to the Center on
Educational Policy report, Title I students have decreased the gap and have improved at rates
better than their non-Title I peers (CEP, 2011a). Kansas, specifically, witnessed a narrowing of
the gap between Title I and non-Title I students (CEP, 2011b).
Research supports the idea of a performance “gap” between ELLs and their native-
speaking peers. “Results of these analyses indicated that ELL students generally performed
lower than non-ELL students in all subject areas, and particularly so in those areas with more
language load” (Abedi, Leon, & Mirocha, 2000/2005, p. 38). Language demand or linguistic

26
demand is cited as a reason for the low performance of ELLs on standardized assessments and
for threats to validity of those assessments with the ELL population.
Language load, linguistic/language demands, linguistic complexity all describe the
demands of working in a content area in a second language. The lack of English proficiency of
ELLs taking standardized tests, thus affecting their overall test scores, is what leads to the
performance gap. This language demand is cited as being a major contributor to the performance
gap of ELLs and their non-ELL peers (Abedi & Gandara, 2006; Tsang, Katz, & Stack, 2008; &
Abedi, Leon, Mirocha, 2000/2005). Language demands do not affect all areas assessed in the
same manner. The more language used in the assessment, the more the impact of the language on
the performance of ELLs, which contributes to widening the “gap”. Reading has the highest
“gap”, as it places the most language demand on the ELLs. According to CSE Technical Report
663, “The gap between the performance of ELL and non-ELL students becomes smaller in other
content areas where there is less language load” (Abedi, Leon, & Mirocha, 2000/2005, p. 3).
They also suggest that math has the smallest gap, “particularly on math items where language
has less impact, such as on math computation items” (p. 3). The language demands in an
assessment influence the performance of ELL and further separate ELLs from their non-ELL
peers.
If language demand influences the scores of students (as research has proven it does),
then it is logical to infer that the lower the proficiency of the test taker in English, the lower their
scores will be. As an example of that “test items for ELL students, particularly ELL students at
the lower end of the English proficiency spectrum, suffered from lower internal consistency”
(Abedi, Leon, & Mirocha, 2000/2005, p. 39). Currently, there is little if any research into how

27
different proficiency groups of ELLs perform on their content assessments. It is through this lens
that the present study will focus.
ELL Performance on standardized tests
Students in the United States take content and proficiency tests in English that evaluate
their knowledge of the English language and their understanding of the content area, these may
be influenced by the students’ English proficiency. According to Tsang, Katz, and Stack (2008),
“One ongoing controversy has been the use of standardized achievement tests written in English
to access the academic performance of English Language Learners” (p. 3). This controversy goes
beyond simply the use of these tests to measure academic performance, but also to the
construction of the tests themselves. Many standardized assessments are normed using native
English speakers, thus possibly carrying a bias against ELLs (Gronna, Chin-Chance, & Abedi,
2000).
Abedi and Gandara (2006) build on this idea by looking at The National Research
Council’s warning about using tests that were constructed for native English-speaking students
with ELLs. Quoting directly from The National Research Council, Abedi and Gandara (2006)
say, “If a student is not proficient in the language of the test, her performance is likely to be
affected by construct-irrelevant variance” (p. 39). This idea crosses over into test development
and good testing practices. It is important that the assessments used to evaluate and place
students are accurately measuring what they are supposed to be measuring. It is also important to
schools, as they strive to meet AYP that the assessments being used accurately reflect what their
students understand of the content. Neill (2005) indicated that AYP is a problem for students
who cannot meet the goals because of language requirements.

28
While considering the performance of ELL students, it is important to note that not all
ELLs are the same. In a study by Abedi and Herman (2010), it was found that “lower levels of
English language proficiency (lower ELD levels) were associated with lower performance” (p.
729). This suggests going beyond looking at how the test was written and what the construct
was, and moves into the performance of the students taking the tests themselves. ELLs perform
worse on standardized tests than do their native English-speaking peers (Menken, 2008; Abedi &
Herman, 2010). Abedi and Herman go on to say that this is true in, “academic subjects that are
high in English language demand” (p. 724). Gronna, Chin-Chance, and Abedi (2000) give us a
possible reason why these students score lower, “Studies suggest that English language
proficiency may influence student performance on standardized assessments” (p. 3). They go on
to say in the same article that, “standardized test scores do not represent the complete spectrum
of students learning” (p. 4). These ideas are connected. Language demands may influence ELL
students’ performance on standardized assessments, “Student language proficiency level is
associated with performance on content-based assessments” (Abedi, Leon, & Mirocha,
2000/2005, p. 2). If proficiency is linked to performance on content assessments, then looking at
student performance on content assessments through the lens of student language proficiency
seems like a natural fit. One aim of this study is to look at the relationship between proficiency
and content assessment scores.
When discussing standardized content assessments, it is important to note that, “critics
have argued that such tests do not provide an accurate estimate of these students’ academic
achievements, because their limited proficiency in English interferes with their performance on
the tests” (Tsang, Katz, & Stack, 2008, p. 3). The major component of language proficiency that
affects students’ performance on standardized assessments is their reading skills, “Students’ level

29
of reading proficiency obviously plays a major role in their assessment outcomes since without
proficiency in reading, students will have difficulty understanding test questions” (Abedi &
Gandara, 2006, p. 38). If students are not able to understand the test question, then their ability to
answer is greatly limited. In a test measuring reading this is part of the construct, but in a test for
a subject like math, a students’ ability to read and understand an item should be less important
than their ability to perform the steps required to solve the mathematical problems. A study by
Gronna, Chin-Chance, and Abedi (2000) looked at the performance differences in mathematics
and reading scores of students who had limited English and those that were native speakers or
listed as English proficient. Mathematics was studied because language should have less
influence on student performance, while reading was selected because, “assessment performance
is necessarily affected by students’ language background and English language proficiency” (p.
3).
The research presented so far presents an image of standardized assessments; how
“language factors may seriously confound the outcomes of instruction and assessment in content-
based areas” (Abedi & Gandara, 2006, p. 39). Content areas are tested using these standardized
assessments. Research has proven that this can pose problems for the ELLs taking the
assessments. According to Wolf, Herman, and Dietel (2010), even math tests are in a way
English language tests for the ELL students, and “the language demands of any test may get in
the way of ELL students showing what they know and inappropriately constrain their
performance” (p. 5–6). English skills are tested no matter what the test construct is in
standardized content area tests. More than just English skills, ELLs may lack other skills in their
ability to function in English on these tests. “English language demands of the problem solving
subscale affect all students, they have a larger effect on English learners’ performance, thus

30
rendering the tests inaccurate in measuring English learners’ subject matter achievement”
(Tsang, Katz, & Stack, 2008, p. 2). There is a concern that tests in content areas require too much
English language skill for an ELL to successfully navigate, which further broaches the issue of
validity; “performance on these tests may reflect the English language abilities of ELL students
rather than their knowledge of the content material the tests are designed to measure (e.g.,
mathematics skills, scientific knowledge, etc.)” (Bailey, 2000/2005, p. 81). These ideas led the
researcher to look at English language proficiency as a factor in content assessment performance.
From the research on standardized content assessments, we can see that ELLs are at a
disadvantage on these assessments. This group does not have the necessary linguistic
background for displaying their knowledge and understanding all content in a fair and equitable
way; as Abedi and Gandara (2006) suggest, “unnecessary linguistic complexity may hinder ELL
students’ ability to express their knowledge of the construct being measured” (p. 39). They go on
to say that, “ELL students have historically lagged behind their English proficient peers in all
content areas, particularly academic subjects that are high in English language demand” (Abedi
& Gandara, 2006, p. 36). This is an important idea. If ELLs are not performing as well as they
could due to the test design and implementation of the assessment, rather than their skill and
knowledge in the content area, there may be a need to evaluate the test and the testing method
itself. This study aims to do that by looking at how English proficiency interacts with content
assessment scores.
Test Usefulness
For this study, it is important to look at the basic design of the tests and their use. This
foundation comes from Bachman and Palmer (1996) and their model of test usefulness for
language assessments. As laid out by Bachman and Palmer in 1996, there are six main aspects to

31
evaluate tests: reliability, validity (primarily construct validity), authenticity, interactiveness,
impact, and practicality. Each of these aspects is important in test design and use and, while they
were originally designed for language assessment, they certainly apply to all assessments that
ELLs take where the use of English is required.
Reliability. Testing ELLs is not simple. The tests designed and normed for native
speakers of English may not be as valid or reliable for this population. Gronna, Chin-Chance,
and Abedi (2000) suggest that large-scale standardized assessments are normed nationally using
native English speakers could be “biased against students who have limited English proficiency”
(p. 3). This means that content assessments that have been normed and created with native-
speaking learners in mind may not take into account some of the issues and biases that could be
faced by a non-native learner.
Validity. One of the first steps of the process is to look at how we go about validating a
test. “The validation process begins with consideration of the construct to be measured, the
interpretations that are to be drawn from the test, and the purposes of a test” (Wolf et al., 2008, p.
11). While there has been research on the validity of content assessments for ELLs (Abedi, Leon,
Mirocha, 2000/2005; Abedi, & Herman, 2010; Abedi, Lord, Boscardin, Miyoshi, 2001; Bailey,
2000/2005; Bailey, Butler, & Abedi, 2000/2005; Butler & Castellon-Wellington, 2000/2005;
Pitoniak et al., 2009; Wolf et al., 2008), as well as appropriateness of accommodations for ELLs
(Abedi, 2007; Abedi, Hofstetter, & Lord, 2004; Wolf et al., 2008b); there has been little research
into how this group actually performs on their content assessments based on their language
proficiency (Albus, Klein, Liu, & Thurlow, 2004; Abedi, 2001). Grouping all ELLs together
implies that they are functioning as a group and this is not necessarily the case (Abedi, 2001;
Katz, Low, Stack, & Tsang, 2004; Neill, 2005; Wolf et al., 2008a). While ELLs qualify for the

32
same accommodations on their content assessments (no matter their proficiency level), they
certainly have differing ability levels in their knowledge and use of the English language.
Authenticity. Content assessments are, in a way, an authentic task for ELLs. The
language instruction that they have received should help them perform better on the content
assessments. Content assessments are written in academic language, and while there is an
expectation that ELLs will know and understand that language, it is not always possible at grade
level. Since content assessments are testing the content, and except for reading, that content is
not language, the authenticity of the task is reduced for ELLs.
Interactiveness. If on a content assessment, we are trying to measure a student’s content
knowledge, then the need to use English – when English proficiency is below a native speaker –
is questionable. The test would be measuring language ability (not a test construct) and the
content knowledge (a test construct). This could lead students with low proficiencies to perform
poorly on a content assessment due to their language ability, rather than their content knowledge.
This could also happen if other areas influence student performance, such as demographic
variables that are not controlled for in testing.
Impact. Though this population is not homogenous, it does have a similar impact on
schools, “ELL subgroups are being left behind and that schools and districts that serve
significant proportions of ELLs are less likely to meet their AYP goals and more likely to be
subject to corrective action than schools serving fewer ELLS” (Abedi & Herman, 2010 p. 725).
If a school has a high population of ELLs then it is more likely to not meet AYP goals. This is
not the fault of the ELLs rather it is the fault of the system. If this group is universally
underperforming then it might be time to evaluate the performance system:
“Because ELL students by definition, do not have a strong command of the English
language, both learning and assessment are affected by their limited English proficiency,

33
and both learning and assessment conditions must be addressed to help close the
performance gap” (Abedi & Gandara, 2006, p. 37).
With the current emphasis on assessment, the focus has been on the system and the
government mandated acts, such as the NCLB (2001). The most attention has been paid to how
these students will perform on assessments, which was brought up in Albus, Shyyan, and
Thurlow (2006): “This has occurred largely through the implementation of accountability
systems that rely on the assessment of students, including students with disabilities and students
learning English as a second or other language…” (p. 1).
Test scores from state content assessments are used for accountability as per NCLB
(2001) legislature. Each school is responsible for meeting AYP. Schools with ELLs are held to
the same expectations of progress; they have to teach their ELLs the content as well as the
language required to show that they know the content on their state’s assessment. The problem
with this concept is best illustrated by Tsang, Katz, and Stack (2008) “critics have argued that
such tests do not provide an accurate estimate of these students’ academic achievement because
their limited proficiency in English interferes with their performance on the tests” (p. 3). For
ELL students, having the knowledge and being able to perform on standardized tests depends on
English language ability, and furthermore on their English language proficiency, as well as their
ability to understand and utilize their content instruction.
Practicality. If we move past the design of the test and consider the implementation of
the tests, this is also fraught with issues for ELLs. When we administer standardized tests, we do
so in English with English directions. This leads to other issues, such as “Students’ level of
reading proficiency obviously plays a major role in their assessment outcomes since without
proficiency in reading, students will have difficulty understanding test questions” (Abedi &
34
Gandara, 2006, p. 38). For those students learning English, just navigating the test itself can be a
challenge leading to failure.
While all of these areas are discussed under language test usefulness, the areas that
overlap with the current research are validity, interactiveness, and impact. There are many
different types of validity and this research will focus on construct and differential. The extent to
which language proficiency influences the content assessment score is a measure of the
interactiveness of the language proficiency and of the content assessment score. Impact is part of
the idea of fairness for this population, as well as societal impact. According to Bachman (2009),
test use and validity are linked, and it is important to consider not only how the tests work, but
also what impact they have on the population and on society as a whole.
The issue of validity
Validity is related to verifying if the test measures what it claims to measure (Bachman,
2004; Brown & Abeywickrama, 2010; Messick, 1993; van der Walt & Steyn, 2008). An aspect
of validity not yet discussed is the, “adequacy and appropriateness of interpretations and actions
based on test scores” (Messick, 1993, p. 1). One major threat to validity in using standardized
content assessments with ELLs “is the fact that the language demands of the tests may exceed
the English language abilities of ELL students” (Bailey., 2000/2005, p. 79). It is because
“performance on these assessments may therefore not be an accurate reflection of the content
knowledge of ELL students if students are stymied in their efforts to answer questions by the
presence of construct-irrelevant language” (Bailey, 2000/2005, p. 79).
Construct validity began as a concept in the 1950’s and started out at “congruent validity”
(Cakir, 2012, p. 669). Cronbach wanted a process, “where to validate is to investigate” (Cakir,
2012, p. 670). A key part of construct validity is what the interpretation will be and how it will

35
be made. Current concepts of construct validity include four aspects including: “plausibility of a
proposed interpretation or use of test scores…extended analysis of inferences and
assumptions…evaluation of the consequences of test uses” (Kane, 2008, p. 328) and, “an
integrated, or unified, evaluation of the interpretation” (Kane, 2008, p. 329). Cakir (2012) reports
that, “all validity is construct validity” (p. 671).
Brown and Abeywickrama (2010) illustrate the difficult nature of validity by highlighting
seven different types of validity: content, criterion-related, concurrent, predictive, construct,
consequential, and face (p. 30–36). While there are many approaches to analyzing validity, the
importance of validity to testing transcends the approaches used. According to the CSE report,
there is an “important national need for determining the validity of large-scale content
assessments in English, with students who are in the process of acquiring English as a second
language” (Abedi et al., 2005, p. vii). Messick (1993) suggests that validity, “assumes both a
scientific and a political role that can by no means be fulfilled by a simple correlation
coefficient…” (p. 2). Part of what makes construct validity key in testing research is that there is
a “consequential aspect” (Messick, 1993, p. 4). It is clear that validity (and its use and
interpretation) is crucial in all forms of assessment. To look at validity as an argument, there
needs to be an evaluation of the, “intended interpretation and uses of test scores” (Kane, 2008, p.
329). The relationship between, “the evidence and the inference to be drawn should determine
the validation focus” (Messick, 1993, p. 5). In this research, the inference is to look specifically
at English language proficiency and if that provides construct-irrelevant variance (Abedi, 2005;
Bachman, 2005; Bachman & Palmer, 1996; Bailey, 2000/2005; Rabinowitz, 2008; Young, 2009;
Messick, 1993) on content assessment scores. This study also shows differences based on
demographic variables within the total ELL subgroup.

36
The idea of looking at subgroup performance on assessments is called differential
validity. Differential validity aims to show that a subgroup’s performance is similar and we can
interpret it in the same way as other subgroups (Young, 2009). Most studies looking at the gap
between non-ELLs and ELLs are differential validity studies. This can also include demographic
subgroups (Young, 2009). The main threat to validity for ELLs is that their content assessment
scores are based on their English language proficiency rather than their content knowledge. This
is an issue of construct validity, specifically the inclusion of construct-irrelevant variance
(Bachman, 2005; Rabinowitz, 2008; Young, 2009).
As we begin to think about validity, it is important to remember the steps of the
validation process. According to Wolf et al. (2008), we first think about the construct being
measured, then the interpretation of the results, and lastly, the purpose of the test. Steps to
improve our assessments, and how we interact with this population, are related to the NCLB Act
of 2001. Before this Act, there was very little regulation governing how the ELL population was
assessed and how those assessments were analyzed. “Many of the pre-NCLB assessments were
not based on an operationally defined concept of English proficiency, had limited academic
content coverage, were not consistent with the content standards of the states, and had
psychometric flaws” (Abedi, 2008, p. 194). Since there have not always been federal guidelines
in place, and even today states have individual rights when it comes to testing and assessment,
there is a need to ensure that the tests are connected to our curriculum and are germane to the
content. “Evidence of content-relatedness is concerned with the extent to which the content of
the test adequately represents the construct that a test is intended to measure” (Wolf et al., 2008,
p. 9). That same article goes on to say, “Alignment studies conducted to examine the relationship
between state standards and assessments represent this first type of evidence” (p. 9). Part of
37
ensuring validity is making sure that the content is aligned with both the standards and the
construct of the tests. This idea regarding ELP testing is well summarized by Wolf et al. (2008):
If an ELL assessment is to be used to evaluate student progress from year to year, the
items and tasks must reflect the construct of language proficiency (claim 1), must address
state ELP standards (claim 2), must provide a reliable, coherent score of the construct
(claim 3), must be comparable from year to year (claim 4), must be sensitive to
opportunity to learn (OTL, claim 5) (p. 9).
ELLs must take not only the standardized content assessments but also an ELP
assessment. Each state is responsible under the NCLB Act (2001) for “implement[ing] a single,
reliable, and valid ELP assessment that annually measures listening, speaking, Reading, writing,
and comprehension” (Abedi, 2008, p. 197). To best analyze these ELP assessments, “one can
examine the extent to which the content of the ELP test is aligned with the construct of [the] ELP
as defined in the state’s ELP standards” (Wolf et al., 2008, p. 12). Abedi (2008) echoed this
sentiment: “Alignment of ELP assessment content with the states’ ELP content standards
provides assessments that are relevant to students’ academic needs” (p. 195). To ensure the fair
assessment of ELLs’ English language proficiency, one must utilize valid and reliable
assessments and note the role of language in the proficiency assessments themselves. On these
assessments, ELLs must transcend the day-to-day language used with peers and teachers, to
language based on content and vocabulary appropriate to the area of study. In order to determine
the influence of English proficiency on content scores, we need to make an inference (Mislevy,
1994), i.e. take what we know and draw reasonable conclusions regarding what we see.
Assessment accommodations for ELLs
When ELLs take tests, educators make some accommodations for their ability to take a
content assessment in a language other than their native tongue. Each state establishes its own
accommodations. Researchers have conducted studies on accommodation use in state

38
assessments. In particular, Abedi and Gandara (2006) found that “the results indicated that of the
73 accommodations used by different states only 11 (or 15%) of them were highly relevant for
these students” (p. 40). Part of the reason for the lack of efficiency in accommodations might be
the origins of the accommodations themselves. In many cases, educators simply modified
accommodations for special education students (Abedi, Hofstetter, & Lord, 2004; La Celle-
Paterson and Rivera, 1994; Rabinowitz, Ananda & Bell, 2004; Solano-Flores, 2008; Wolf et al.,
2008a). Researchers have found accommodations specifically designed for ELLs more effective:
“Results from experimentally controlled studies suggest accommodations that are language-
based or consistent with students’ language needs are more effective and valid for ELL students
than those originally created and proposed specifically for students with disabilities” (Abedi &
Gandara, 2006, p. 40). Another aspect of the use of accommodation is that it is, “difficult to
design appropriate accommodations to compensate for ELLs’ lack of English proficiency,
particularly when they are tested in reading/language arts” (CEP, 2010b, p. 2).
In Kansas, ELLs can use the following accommodations: extended time, small group
administration, one-on-one administration, directions read aloud in English, test items (most or
all) read aloud in English (not available for the Reading test), breaks during the test, a bilingual
dictionary (without definition in either language), directions read aloud in the Native Language
(Spanish), test items read aloud in Spanish (not available in Reading), and a Spanish version of
the test (Math and Science if instruction was in Spanish) (KSDE, 2011). Perhaps, on content
assessments, English proficiency could be a criterion for accommodation, as “research evidence
supports the use of the length of time students have been instructed in the United States as well
as level of English proficiency as valid criteria for decisions regarding appropriate
accommodations for ELL students” (Abedi & Gandara, 2006, p. 40–41).
39
How ELL performance affects schools
There are many ways that standardized testing affects schools and the employees of those
schools. Since the NCLB Act was passed, there has been accountability for all schools and
teachers, not just those related to ELLs, but to all students and their performance on standardized
assessments. The fact that ELLs are included in the accountability of schools after their first year
has greatly influenced their importance to schools. “Schools and districts with large populations
of ELLs are being labeled as unsuccessful because many students in the process of acquiring
English are not able to meet the percent proficient targets” (Tsang, Katz, & Stack, 2008, p. 20).
Because ELLs are included in a schools accountability, if a school has a disproportionate number
of ELLs their overall school score is affected; this can be especially pronounced in schools or
districts that serve high proportions of ELLs (Abedi & Herman, 2010).
Schools that have large populations of ELLs may find that their schools do not perform
well on their tests as a whole and fail to meet progress as defined in NCLB (2001). When this
happens, teachers may turn to other means to help their students succeed, “ample research shows
that administrators and teachers generally tend to respond to strong accountability demands by
focusing their efforts on what is expected of students; by aligning curriculum and instruction
with standards, and particularly with what is tested” (Abedi & Herman, 2010, p. 726). Teaching
to the test occurs with this population (Diamond, 2012), even though teachers are taught to avoid
it. It is important to remember that teachers are trained professionals. They go to college and take
classes that teach them proper methods and theories for their profession. As the population of
ELLs grows, the teachers needing training in working with this population also grows, and some
teachers working with ELLs do not have the training to work with this population. “ELLs are
more likely than other students to be taught by teachers without relevant teaching credentials and

40
with little classroom experience” (Abedi & Herman, 2010, p. 725). This population has to
overcome many obstacles to perform on standardized tests and often they are aided by teachers
who do not know the relevant theories and methods for working with them.
How ELL performance affects students
As schools face repercussions of the test scores of ELLs, the students have many of their
own issues. There are issues of test anxiety, cultural background, language proficiency, and
exposure to the academic content, to name a few. “Many students in both the United States and
countries throughout the world attend schools where they are required to use languages other
than those they speak at home” (Bunch, Shaw, & Geaney, 2010, p. 185). This is not a unique
problem to the US, but as it is related to the NCLB (2001), there are specific limitations to
address regarding the students themselves. “ELL students begin school significantly behind their
English-speaking peers and so require extra time and instruction from the very beginning of
school to catch up” (Abedi & Gandara, 2006, p. 37). Not only do they have to learn English to
learn content and take their assessments, but ELLs are sometimes also behind in the academic
content knowledge when they get to school. Even if they are up to date on their content, their
limited English skills will slow them down in class (and even sometimes remove them from class
in a pull-out situation, where they go to an ELL teacher during a subject class time). “Cultural
and linguistic minority students have less exposure to content, and their instruction tends to
cover less content relative to nonminority students” (Abedi & Herman, 2010, p. 727). If they
have less exposure and less access, how can it be valid and reliable to assess them as everyone
else is assessed?
As ELL students are struggling to learn English, they often take some mainstream classes
and some special ELL classes. Just because they are in mainstream classes does not mean they

41
are able to keep up or that their understanding of the content is at the same level as their non-
ELL peers, but “subgroups including ELLs have had less access than other students to
challenging curriculum that would prepare them for success on today’s standards” (Abedi &
Herman, 2010, p. 725). ELL students who are struggling with English and with the content of
their courses are not being given the same opportunities as non-ELL peers. “Gee (1990) has also
pointed out the limitations to academic language acquisition within classrooms because children
are often not given sufficient opportunity to use scientific language themselves” (Bailey,
2000/2005, p. 93). Another implication for ELLs due to their limited English skills is that they
may be placed into remedial programs, “We know that consistently low test scores often lead to
placement in remedial and low-level instruction that further disadvantages already disadvantaged
learners” (Abedi & Gandara, 2006, p. 39). This can set them back even further in their education,
“students’ access to and engagement in the academic content and their need to perform well on
tests and achieve standards—looms large as a possible barrier to the success of ELLs” (Abedi &
Herman, 2010, p. 726). ELLs have a lot to overcome during their time in school. Their
performance on both content and proficiency assessments might change their placement in
classes, access to services, and have psychological effects as well.
Repercussions for test development
The system for assessment of ELLs currently in place holds many opportunities for
improvement. It is important for test developers to continue working with these assessments
taking heed of the advice of the researchers in this area. There are many suggestions in the
research for changes or alterations in the current practice of test development for the ELL
population.
42
One step is to look at the area of accommodations and perhaps try to rethink how we use
them, and “designing assessments that are accessible to the greatest number of students possible
could reduce the need for accommodations” (Wolf, Herman, & Dietel, 2010, p. 9). If
assessments can be designed with ELLs in mind, it could help all students perform better on the
assessments while still measuring the construct being assessed. This could be, in part, to make
sure the linguistic complexity or language demands on the assessment are appropriate to the
construct, and do not add undue complexity to the language, which could impair the performance
of ELLs. “The notion of identifying a threshold of language proficiency is still viable with a test
that provides a clear indication that the language complexity of the content assessment is not a
barrier to student performance” (Bailey, Butler, & Abedi, 2005, p. 105). Another idea is to create
a more flexible system for accountability when looking at the ELL population (Butler & Stevens,
2001; Gottlieb, 2003; Kim & Sunderman, 2005; McKay, 2005; Tsang, Katz, & Stack, 2008). By
creating a more “flexible approach” to accountability and working harder to evaluate the
achievement of the ELLs, a more effective system could be created.
Abedi and Gandara (2006) found that ELLs had a “deficit in syntactic awareness skills”
and they suggest that “test makers would do well to reduce syntactic complexity in test items that
will be used for ELL students” (p. 38). They state in that same article that ELLs may need more
time to learn reading skills than their non-ELL peers and that test makers “must be cognizant of
these factors when developing, administering, and scoring test items for ELL students” (p. 38).
Wolf, Herman and Dietel (2010) also make suggestions for the design of materials for content
assessments of language characteristics, and “several principles including the use of high
frequency words, avoiding colloquial and double-meaning words, and reduction of unnecessary
expository materials for mathematics assessments” (p. 9). These modifications might assist ELLs

43
in expressing their understanding of content materials, which should led to more reliable and
valid assessments for this population.
Conclusion
If language demand impacts students’ scores as the research has shown, then it is logical
to infer that the lower the proficiency of the test taker in English, the lower their scores will be
(Abedi & Herman, 2010; Abedi, 2005; Albus, Klein, Liu, & Thurlow, 2004; Katz, Low, Stack, &
Tsang, 2004; Solórzano, 2008; Young, Holtzman, & Steinberg, 2011). Currently, there is little
research directly into how different proficiency groups of ELLs perform on their content
assessments. “The previous work did not include independent measures of language skills but
rather looked at student performance on content measures by district- or state-designated
language categories such as LEP/non-LEP and bilingual/non-bilingual” (Butler & Castellon-
Wellington, 2000/2005, p. 48). This line of inquiry could dramatically change how ELLs are
assessed in the future. Wolf, Herman, and Dietel state, “There is also limited empirical research
on the assessment and instructional needs for ELL students at different levels of English
proficiency” (Wolf, Herman, & Dietel, 2010, p. 10).
The current research examines the important concept of the English language proficiency
of ELLs, and its relationship with, or influence on content assessment scores. If there is a point
of proficiency where the test results are valid, the way we administer and interpret standardized
content assessments could be altered. If there are other options for administering tests, we should
analyze them:
An important consideration underlying the research reported here was the goal of
identifying and/or recommending a threshold level on a widely used language proficiency
test that would indicate when ELL students’ performance on a standardized content test
would be valid from a linguistic standpoint… The use of an academic language
proficiency assessment would allow for another option in assessing English language
learners: Include ELL students in the testing process but assess only their growth in

44
English proficiency until they reach the language proficiency threshold. In other words,
for accountability purposes, students who do not reach the threshold would take a
measure of English growth at the same time other students take a content assessment
(Bailey, Butler, & Abedi, 2005, p. 104–105).
It is due to these ideas of linguistic/language demands, lack of content knowledge and
vocabulary, and basic English proficiency that this research is looking at English language
performance related to content test scores. If low proficiency ELLs are performing similarly then
altering how we assess this group and how we use their scores for accountability purposes would
benefit not only the students by reducing test anxiety, but also the schools by separating some
ELLs from their accountability demands. To serve the ELL population better, it is important to
make sure that they are being tested for the right reasons and that what they learn from that test is
beneficial. Forcing all ELLs who have been in the U.S. for more than a year to take content
assessments, disregarding their level of English proficiency may not be the most suitable option.
Bailey, Butler, and Abedi contend that “development of a language test that emphasizes the
academic language needed for accurate assessment of content knowledge could be used as an
indicator of ELL readiness to take content tests” (Bailey, Butler, & Abedi, 2005, p. 102). This
study aims to prove that suggestions like this could be a viable alternative to the current
practices. These alternatives would promote testing the understanding of content of the students,
rather than testing their understanding of content through the lens of their English proficiency.

45
Chapter 3: Methods
As discussed in Chapters 1 and 2, ELLs are generally grouped as a population, rather
than broken down to examine individual variation within that population (considering their
English proficiency level and other demographic information). In the previous chapters, the
needs of ELL population were discussed, as well as the implications of test use on this
population. The foundation of the current research as a study of construct and differential
validity, as well as aspects of test usefulness including; validity, interactiveness, and impact were
discussed. Details of previous research regarding the ELL population were discussed, including
the performance gap between ELLs and non-ELLs, ELL overall performance, linguistic
demands, and accommodation use. The current research is guided by four research questions that
were introduced in chapter one.
In this chapter, the methods used to analyze the data for the study will be discussed and
how the analysis reflects on the original research questions posed. This chapter will begin with a
restatement of the research questions and hypotheses, then a description of the participants (the
ELL students who took the assessments), next the assessment tools will be briefly described, and
then the data collection and the data analysis procedures will be discussed.
Research Questions and Hypotheses
This study examines how different ELLs perform on their content assessments based on
their English proficiency, as determined by the state’s English language proficiency assessment.
What follows is a review of the research questions posed and the hypotheses for each question:
Research Question 1: What are the outcomes of Kansas’ content area assessments for
Mathematics, Reading, and Science for ELLs by language proficiency level?

46
Hypothesis 1: The performance of ELLs on the content assessments is influenced by
their ELP category. This difference between proficiency categories is especially
pronounced at the lower ELP categories (between Beginner and Advanced, Beginner and
Fluent, Intermediate and Advanced, Intermediate and Fluent).
Research Question 2: What are the relative effects of proficiency level on assessment
scores across grade levels?
Hypothesis 2: As the cognitive demands on the content assessment increase (i.e., as the
level of grades increases) the number of low language proficiency level students unable
to meet state standards becomes more pronounced. If the null hypothesis were used in
this situation, it could be assumed that no difference is perceptible based solely on
proficiency level.
Research Question 3: To what extent does the KELPA predict students’ scores on
content assessments in Math, Reading, and Science?
Hypothesis 3: The scores on the KELPA will not be a predictor of content area scores in
Math and Science, but will be in Reading.
Research Question 4: What role do other demographic variables (such as free and
reduced lunch, Native Language, Gender, Length of Time in the U.S., or Exceptionality
Code) play in student achievement on content assessments for ELLs?
Hypothesis 4: Some variables will reflect a positive relationship with student
achievement (Native Language and Length of Time in the U.S.), no relationship with
student achievement (Gender), or a negative relationship with student achievement (free
and reduced lunch and Exceptionality Code).
47
Description of the participants
This research studies ELLs and their performance on state content assessments in the
state of Kansas. Due to this focus, the participants are the ELLs that took the state proficiency
assessment and at least one content assessment. This section will be primarily based on a
summarization of participants by Peyton (2009) and the numbers from the dataset used in the
current study. The KELPA is administered every year to about 33,000 students in the state who
have been identified as ELLs. For the 2009–2010 dataset, there were 26,663 students given the
KELPA in grades three through eleven (the grades that are administered content assessments).
The two largest language groups are speakers of Spanish and speakers of Vietnamese. Hispanic
students made up 81.4% of the 26,663 total ELL population or about 21,711 students.
Vietnamese accounted for 3.3% of the population or about 888 students. The other languages
that were above 1% were Chinese (about 300 students), German (about 374 students), Laotian
(about 285 students), and Arabic (with about 239 students); there were 15 languages identified at
less than 1% and 5.1% listed as other, making up the remaining 2,841 students.
In 2010, the number of ELL students varied in each grade with fourth to fifth and sixth to
eighth both having 18.5% of the total ELL population (about 6,112 students each grade band).
Kindergarten and ninth to twelfth grade both had 13.5% of the population (about 4,460 students
each). First grade had 12.9% (about 4,262 students). Second grade had 12% (about 3,964
students). Lastly, third grade had the smallest percentage with 10.8% (about 3,568 students).
The services that Kansas ELLs receive vary by school and district. According to Peyton
(2009), 70.7% of ELLs receive access to a combination approach to ESOL/Bilingual program.
While 15.4% receive state ESOL, 6.1% has a parent waive their ESOL education, 3.7% receives
Title III, 2.5% is assessed late, and 1.6% is in monitored status, which means they have received
48
ESOL services in the past, but are now in the mainstream classroom. According to the dataset, in
grades three through eleven, most (89%) ELL students are in regular education (approximately
23,738 students). About 2,098 or 7.9% are identified as having an Exceptionality Code, and
about 78 or 0.3% is listed as gifted. Approximately 749 or 2.8% of the remaining students are
identified as having one of the following: autism, developmental disability, emotional
disturbance, hearing impairment, multiple disabilities, mental retardation, other health
impairment, orthopedic impairment, speech/language issues, traumatic brain injury, or visual
impairment.
Instruments used for analysis
For this analysis, there were four major instruments used. The first is the KELPA. All the
content data was pulled based on the inclusion of a KELPA score. The next instruments used
were the Math, Reading, and Science content assessments. To be included in this research a
participant had to have both a KELPA score and at least one content area score.
The Kansas English Language Proficiency Assessment (KELPA). The KELPA is
administered in grade level bands. There are multiple test forms but they are consistent across a
grade level band. The bands are from kindergarten to first grade, second to third grade, fourth to
fifth grade, sixth to eight grade, and ninth to twelfth grade. In the year 2009, according to Peyton
(2009), Kindergarten to first grade was the largest band with approximately 8,722 students,
second to third grade had the next largest number of students with approximately 7,532, fourth to
fifth and sixth to eight each had approximately 6,112 students per band, and ninth to twelfth had
about 4,460 students. As the students grade level went up, the total number of students per band
decreased. For this dataset third grade was by itself (since second does not take content
assessments) and had approximately 4,300 students making it the smallest band, the next

49
smallest was ninth through eleventh with approximately 6,409 students, then came fourth and
fifth with approximately 7,728, and last was sixth through eight with the largest population of
approximately 8,226 students.
The KELPA takes approximately 90 to 120 minutes to administer depending on the grade
level band. All grade level bands have four subsections that are added together to create a
composite score. These subsections are: listening, reading, writing, and speaking. On each
subsection, a proficiency score is given. The proficiency scores are: Beginning, Intermediate,
Advanced, and Fluent. The Beginning proficiency is characterized by a lack of ability to
understand in English, with common misspellings and mispronunciations. The Intermediate
proficiency is characterized by an ability to understand informal conversations and questions
spoken at a normal speed on familiar topics, as well as reading with some fluency and allowance
for re-reading as necessary. The Advanced proficiency is characterized by the ability to speak
and write well in English, and to read for information and description with the ability to react to
information just read. In the Fluent proficiency there is an expectation of academic
understanding. Fluent students should be able to participate and understand in almost any
situation and be able to perform grade appropriate writing and reading. The descriptions of the
proficiency scores can be seen in table 1. This table is from the Kansas State Department of
Education.
Table 1: Kansas English Language Proficiency Assessment (KELPA) Performance Category Definitions for Total Score
Beginning Intermediate Advanced Fluent

50
Demonstrates zero to limited ability in understanding the English language. May often mispronounce or misspell words.
May be able to understand most informal questions and conversations on familiar topics spoken distinctively at normal speed. May be able to read with some fluency and speed, but will often need to reread for clarification.
May speak and write in English in most situations. May be able to read for information and description, to follow sequence of events, and to react to information just read.
Can participate in academic settings without language support services. Is able to understand and participate in almost any conversation within the range of experience with a high degree of fluency. Should be able to read with fluency and speed. Older students in the Fluent category should also be able to write short papers and express statement of position, point of view, and arguments and should understand the meaning of new words from context.
(KSDE, n.d.)
In grades K-8, all students take the KELPA. Content assessments start in the third grade
with Math and Reading, which are tested every year until the eighth grade and in high school.
Science is tested in grades four, seven, and in high school. All content assessments in the state of
Kansas are administered on the computer. Something that affects all students’ content
assessments at the high school level is the opportunity to learn rules. In high school, students are
tested differently than in grades three to eight. Math and Reading follow the same rules; Science
has its own rules regarding opportunity to learn. The core idea for this policy in Reading and
Math is that high school students are assessed two times. If they score “proficient” the first time,
they have completed the necessary NCLB testing in that skill. If they do not score “proficient”,
they are given a second opportunity to test in a later semester. The assessments have to be done
by the end of their eleventh grade year. The Science assessment has two parts, one on life
Science and one on physical Science, which can be given in any order. Science assessments are

51
given each year, with scores recorded until the students testing window closes at the end of their
eleventh grade year (Science OTL/w-o Rules, 2009 & Reading and Math OTL/w Rules, 2009).
Reliability and validity studies were conducted on the KELPA. Validity measures came
from comparing other English proficiency assessments to the KELPA to determine the validity
of the test. Overall, the test was found to be valid and reliable with the ELL population. Each of
the subskills (reading, writing, listening, and speaking) are strongly connected with the overall
composite score (Peyton, et al., 2009). Test scores were also compared with teacher ratings of
skills and correlated well (Peyton, et al., 2009). The final measure of validity was to look at the
KELPA score compared to the Reading score from the general state assessments. The
correlations were found to be consistent across time and reasonably strong (Peyton, et al., 2009).
Mathematics Assessment. The Mathematics assessment is performed every year for
grades three to eight and up to two times in high school as part of the opportunity to learn as
described previously. The test is broken into three testing sessions, two of which allow a
calculator and one that does not (for all levels, except eighth grade). These sessions are not
timed, but they last approximately 45–60 minutes. The number of indicators tested varies by
grade: 3=12; 4=14; 5=15; 6=14; 7=15; 8=15, and HS=15. The number of questions also varies
by grade level: 3=70; 4=73; 5=73; 6=86; 7=84; 8=86; and HS=84. There are four to eight items
tested per indicator.
Reading Assessment. The Reading assessment is performed every year for grades three
to eight and up to two times in high school as part of the opportunity to learn, as described
previously. The test has three untimed (recommended 45 minutes) test sessions. Eleven to
sixteen indicators are assessed for each grade level and the number of questions varies from 58
(grade three) to 84 (grade seven). There are four to seven items per indicator.
52
Science Assessment. The Science assessment is performed in grades four, seven, and in
high school as part of the opportunity to learn, as described previously. In grades four and seven,
there are two untimed sessions of about 45–60 minutes each. Grade four has 22 indicators tested,
and a total of 44 items. Grade seven has 30 indicators tested, and 60 items total. High school is
untimed and has two parts as well. Each part has 15 indicators, and 30 items. For all the levels,
there are two items tested per indicator.
For all three content areas discussed above, all the questions are multiple choice. Paper and
pencil versions of the test are available as an accommodation. There are five performance levels:
Exemplary, Exceeds Standard, Meets Standard, Approaches Standard, and Academic Warning.
ELLs take the state assessment and have the same AYP targets as the general population. For
Mathematics and Science, a Spanish language version is available for those that received their
instruction in Spanish (Kansas Mathematics/Science/Reading Assessment Fact Sheets 2011–
2012). The reliability and validity of the tests were found to be positive. For both Math and
Reading, reliabilities were high and misclassifications were low, and the validity measures were
positive (Irwin, et al., 2007). A technical report developed by CETE indicated the reliability and
validity of the Science assessment across the entire test taking population as being appropriate
and indicated that there were no substantial differences between the paper and pencil test and the
computerized version. There was no indication of the inclusion of ELLs in their research (Irwin,
et al., 2009).
Procedures for data collection
The data used in this study came from the CETE at the University of Kansas. CETE collects
all the state assessment data for the state of Kansas. This specific data was requested from CETE
in the spring of 2011, while the researcher was a Graduate Research Assistant (GRA) at CETE.

53
Permission to use human subjects was requested from HSCL and this project received approval
in the spring of 2011. The data includes the test scores for all ELL students on their KELPA,
Math, Science, and ELA/Reading assessments for the school year 2009–2010. The data also
contains demographic information describing the population and any accommodations that were
used on the assessments. The demographic information comes from the Kansas Individual Data
on Students (KIDS) system, also from CETE.
The original request of KIDS information was for the following categories: Gender; Date
of Birth; Current Grade Level; Hispanic Ethnicity; School Entry Date; District Entry Date; State
Entry Date; Exit/Withdrawal Type; Comprehensive Race; Eligibility for National School Lunch
Program; Primary Disability Code; Gifted Student Code; ESOL/Bilingual Program Entry Date;
First Entry Date into a School in the United States; First Language; ESOL/Bilingual Program
Participation Code; ESOL/Bilingual Program Ending Date; Title I Participation; Title I
Supplemental Educational Services (SES); Miles Transported; Served with At-Risk Funds;
Immigrant Status; Country of Birth; Refugee Status. The researcher also requested KELPA data
regarding domain scores, total Scores, and proficiency categories. Content area information was
requested for Math, Reading, and Science regarding Continuous level scores and performance
categories.
The researcher was granted from CETE all requested data from the KIDS system
regarding Gender, Date of Birth, Current Grade Level, Hispanic Ethnicity, School Entry Date,
District Entry Date, State Entry Date, Exit/Withdrawal Type, Comprehensive Race, Eligibility
for National School Lunch Program, Primary Exceptionality Code, Secondary Exceptionality
Code, ESOL/Bilingual Program Entry Date, First Entry Date into a School in the United States,
First Language, ESOL/Bilingual Program Participation Code, and ESOL/Bilingual Program
54
Ending Date. All KELPA data and content assessment data was provided. The KIDS information
that was not provided was not necessary, as the study has been designed. The information would
be available from the State of Kansas rather than CETE if desired. The following were not
provided with the data requested: Title I Participation, Title I SES, Miles Transported, Served
with At-Risk Funds, Immigrant Status, Country of Birth, and Refugee Status.
Data Analysis
This study was aimed at evaluating a possible relationship between ELP, as determined by
the KELPA, and scores on the state’s content assessments.
To answer the first research question, “What are the outcomes of Kansas content area
assessments for Mathematics, Reading, and Science for ELLs by language proficiency level?,”
the test scores for ELLs were reported for each content area assessment provided in the state of
Kansas in the 2009–2010 school year. Student data was categorized into one of four proficiency
groups, based on their KELPA scores by grade levels. A one-way analysis of variance was
conducted for each grade level and content area separately. The dependent variables were the
Mathematics, Reading, or Science content assessment scores and the independent variable was
the KELPA proficiency category assigned to the student on the English Language proficiency
assessment (i.e., Beginning, Intermediate, Advanced, or Fluent).
To answer the second research question “What are the relative effects of proficiency level
on assessment scores across grade levels?,” basic descriptive statistics were displayed using
proportions showing how students performed on each content assessment based on grade level,
and whether there were differences in the proportions of students who did or did not meet/exceed
standards across grade levels for each content area separately.
55
To answer the third research question, “To what extent does the KELPA predict students’
scores on content assessments in Math, Reading, and Science?” A bivariate linear regression
analysis was used to predict scores based on equated percent correct content assessment scores.
Student level data was analyzed by grade level for each content area separately. The dependent
variable for the set of analyses was the content assessment score and the independent variable
was the students’ English language total score as determined by the KELPA.
The final research question is, “What role do other demographic variables (such as Free
and Reduced Lunch, Native Language, Gender, Length of Time in the U.S., or Exceptionality
Code) play in student achievement on content assessments for ELLs?” To answer this question, a
set of multiple linear regression analyses were used to predict scores based on equated percent
correct content assessment scores. For this set of analyses, the dependent variable was the
content assessment score and the independent variables were: student-proficiency group based
on total KELPA score (Beginning, Intermediate, Advanced, and Fluent); and then each of the
following demographic variables; Free and Reduced Lunch status; the Native Language of the
test taker (Spanish and other); the Gender of the test taker; the Lenth of Time in the U.S.; and the
final variable was the students’ Exceptionality Code.
Data Entry and Missing Data. The data set represents the students who were
administered the KELPA and content assessments in 2010 in the state of Kansas. Data of all
students tested was provided if they completed a content assessment and a KELPA in the year.
Not all content areas are assessed every year. This means that there were grade levels that did not
have scores for every test. Results were reported if both KELPA scores and content scores are
available. When data has not been provided completely, it was removed from the study and
reported as a percentage of tested individuals that were not analyzed for this study.
56
Ethical Issues. This research has the potential to change policy in assessment of ELLs in
the future. For this reason, the research is significant. It is important to note that the researcher
was granted access to data with the identifying information removed. Since the data was already
free of identifying information, the biggest potential source of bias had been accounted for. The
researcher made every attempt to perform the analysis in a scientific and unbiased way.
Summary
The results of this research should provide a better understanding of the assessment of
ELLs in the schools and a higher level of accuracy in the interpretation of the test results of the
ELLs. This chapter discussed the research questions and hypotheses, provided a description of
the participants (the ELL students who took the assessments), briefly described the assessment
tools, and lastly discussed the data analysis procedures. In chapter four, the data analysis and
results will be discussed, based on the research questions. The results will be given based on
grade and content area for the first three questions, and then using demographic variables for the
final question. In chapter five, the final discussion will take place. The discussion will address
how the current study’s findings relate to the literature. There will also be a discussion of the
limitations of the current study, and suggest areas where future research should focus.

57
Chapter 4: Results
This study examined the relationship between the performance of ELLs and the KELPA,
as required for Title I and Title III, and the content area assessments for Reading, Math, and
Science administered by the CETE for the state of Kansas. It looked at the predictive ability of
the KELPA, based on grade and language proficiency of test-takers to determine content area
scores, as well as how different demographic variables influence test scores. In this chapter,
findings from various quantitative analyses conducted using the Statistical Analysis Software
(SAS) and the assistance of a graduate statistics student are presented as they relate to the
research questions.
The original data provided by CETE included all individuals tested during the time 2009–
2010 school year. The first step was to remove the grades that were not given both a content
assessment and the KELPA; this includes kindergarten through second and twelfth grades. All
analyses were done by grade, even though the KELPA was administered to grade bands. This
was done because the tests were not equated.
The data included in the study represents ELLs in the entire state of Kansas who took one
of the content assessments (Reading, Math, or Science) and the KELPA from the spring 2010
testing period, in grades three through eleven. Due to the nature of the data, only complete pairs
were analyzed. To be a complete pair, there had to be a content area test score and a KELPA
score for the individual. The data was analyzed looking at just those pairs, so for an individual
who took the KELPA, Math, and Science, two pairs were analyzed. That individual would not be
part of the Reading analysis. Most data reported here has been rounded to the nearest hundredth.
Ninth grade presented problems across all tests. Very small populations were reported for
each grade and proficiency level. For ninth grade Math, there were 2,263 students tested, but
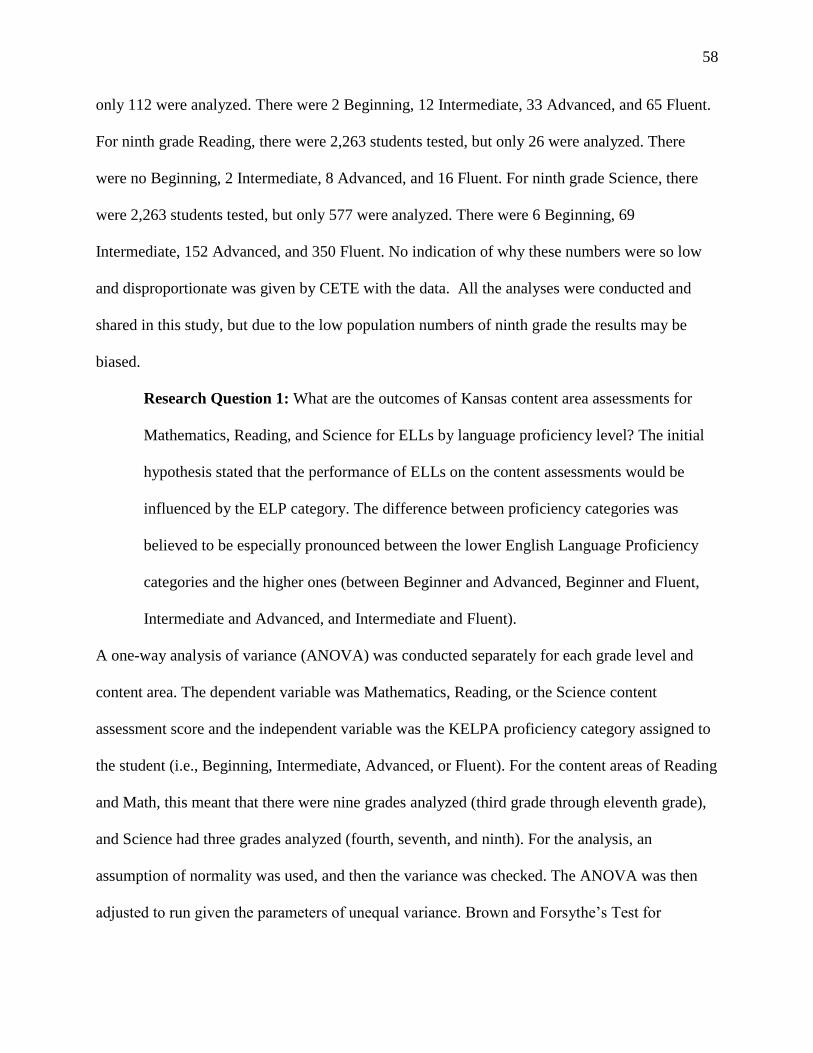
58
only 112 were analyzed. There were 2 Beginning, 12 Intermediate, 33 Advanced, and 65 Fluent.
For ninth grade Reading, there were 2,263 students tested, but only 26 were analyzed. There
were no Beginning, 2 Intermediate, 8 Advanced, and 16 Fluent. For ninth grade Science, there
were 2,263 students tested, but only 577 were analyzed. There were 6 Beginning, 69
Intermediate, 152 Advanced, and 350 Fluent. No indication of why these numbers were so low
and disproportionate was given by CETE with the data. All the analyses were conducted and
shared in this study, but due to the low population numbers of ninth grade the results may be
biased.
Research Question 1: What are the outcomes of Kansas content area assessments for
Mathematics, Reading, and Science for ELLs by language proficiency level? The initial
hypothesis stated that the performance of ELLs on the content assessments would be
influenced by the ELP category. The difference between proficiency categories was
believed to be especially pronounced between the lower English Language Proficiency
categories and the higher ones (between Beginner and Advanced, Beginner and Fluent,
Intermediate and Advanced, and Intermediate and Fluent).
A one-way analysis of variance (ANOVA) was conducted separately for each grade level and
content area. The dependent variable was Mathematics, Reading, or the Science content
assessment score and the independent variable was the KELPA proficiency category assigned to
the student (i.e., Beginning, Intermediate, Advanced, or Fluent). For the content areas of Reading
and Math, this meant that there were nine grades analyzed (third grade through eleventh grade),
and Science had three grades analyzed (fourth, seventh, and ninth). For the analysis, an
assumption of normality was used, and then the variance was checked. The ANOVA was then
adjusted to run given the parameters of unequal variance. Brown and Forsythe’s Test for
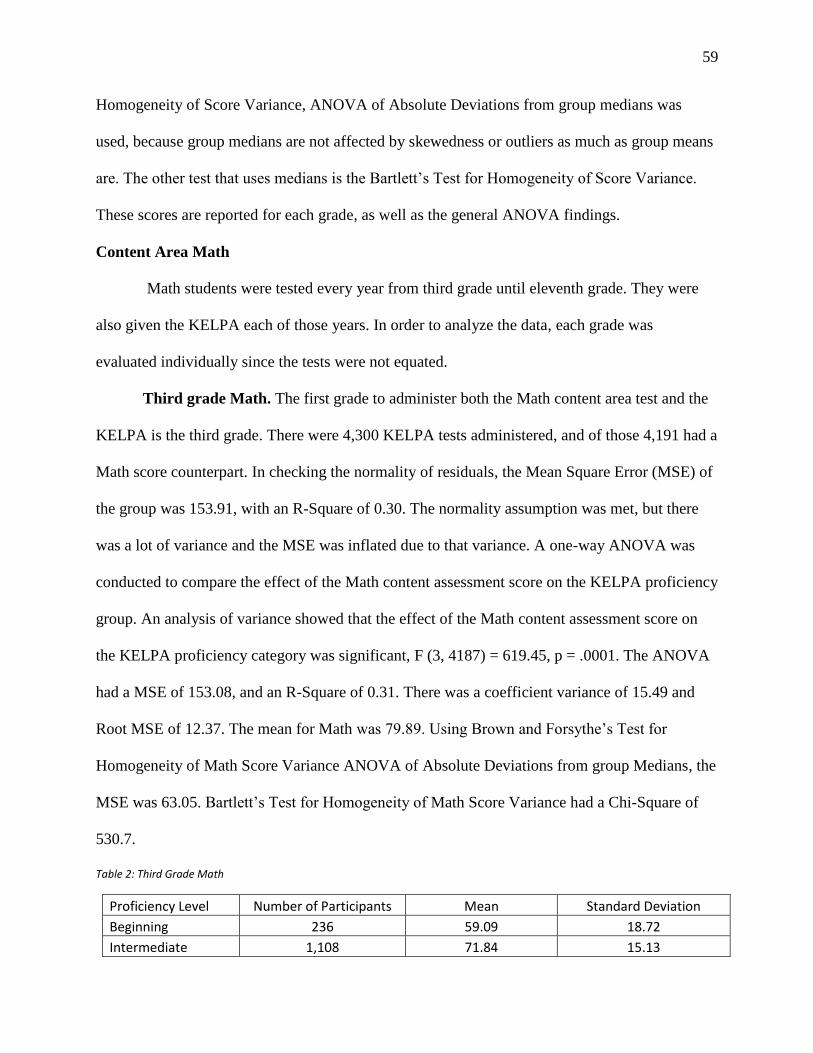
59
Homogeneity of Score Variance, ANOVA of Absolute Deviations from group medians was
used, because group medians are not affected by skewedness or outliers as much as group means
are. The other test that uses medians is the Bartlett’s Test for Homogeneity of Score Variance.
These scores are reported for each grade, as well as the general ANOVA findings.
Content Area Math
Math students were tested every year from third grade until eleventh grade. They were
also given the KELPA each of those years. In order to analyze the data, each grade was
evaluated individually since the tests were not equated.
Third grade Math. The first grade to administer both the Math content area test and the
KELPA is the third grade. There were 4,300 KELPA tests administered, and of those 4,191 had a
Math score counterpart. In checking the normality of residuals, the Mean Square Error (MSE) of
the group was 153.91, with an R-Square of 0.30. The normality assumption was met, but there
was a lot of variance and the MSE was inflated due to that variance. A one-way ANOVA was
conducted to compare the effect of the Math content assessment score on the KELPA proficiency
group. An analysis of variance showed that the effect of the Math content assessment score on
the KELPA proficiency category was significant, F (3, 4187) = 619.45, p = .0001. The ANOVA
had a MSE of 153.08, and an R-Square of 0.31. There was a coefficient variance of 15.49 and
Root MSE of 12.37. The mean for Math was 79.89. Using Brown and Forsythe’s Test for
Homogeneity of Math Score Variance ANOVA of Absolute Deviations from group Medians, the
MSE was 63.05. Bartlett’s Test for Homogeneity of Math Score Variance had a Chi-Square of
530.7.
Table 2: Third Grade Math
Proficiency Level Number of Participants Mean Standard Deviation
Beginning 236 59.09 18.72
Intermediate 1,108 71.84 15.13

60
Advanced 1,538 81.15 11.79
Fluent 1,309 88.98 8.37
The basic information for third grade Math can be found in Table 2 above. These means
represent the Least Square Means (LSM) for the different proficiency groups. The differences in
LSM between Beginning and Intermediate is -12.75 with a standard error of 1.30 and a t value of
-9.80. For the Beginning to Advanced group, the estimate is -22.06 with a standard error of 1.23
and a t-value of -17.57. From the Beginning to the Fluent group, the estimate is -29.89 with a
standard error of 1.24 and a t-value of -24.10. From the Intermediate to Advanced group, the
estimate is -9.31 with a standard error of 0.55 and a t-value of -17.08. From the Intermediate to
the Fluent group, the estimate is -17.14 with a standard error of 0.51 and a t-value of -33.61. The
final group considered was the Advanced to the Fluent group, with an estimate of -7.83 and a
standard error of 0.38 and a t-value of -20.65.
Fourth grade Math. There were 4,109 KELPA tests administered, and of those 3,991
had a Math score counterpart. In checking the normality of residuals, the MSE of the group was
161.74, with an R-Square of 0.32. A one-way ANOVA was conducted to compare the effect of
the Math content assessment score on the KELPA proficiency group. An analysis of variance
showed that the effect of the Math content assessment score on the KELPA proficiency category
was significant, F (3, 3987) = 627.07, p = .0001. The ANOVA had a MSE of 161.42, and an R-
Square of 0.32. There was a coefficient variance of 17.44 and Root MSE of 12.71. The mean for
Math was 72.85. Using Brown and Forsythe’s Test for Homogeneity of Math Score Variance
ANOVA of Absolute Deviations from group medians, the MSE was 57.25. Bartlett’s Test for
Homogeneity of Math Score Variance had a Chi-Square of 295.8.

61
Table 3: Fourth Grade Math
Proficiency Level Number of Participants Mean Standard Deviation
Beginning 279 53.84 18.67
Intermediate 1,124 64.56 14.47
Advanced 1,423 74.81 11.86
Fluent 1,165 83.01 9.74
The basic information for fourth grade Math can be found in Table 3 above. These
means represent the LSMs for the different proficiency groups. The difference in LSM between
Beginning and Intermediate is -10.72, with a standard error of 1.20 and a t-value of -8.95. For the
Beginning to Advanced group, the estimate is -20.97, with a standard error of 1.16 and a t-value
of -18.06. From the Beginning to the Fluent group, the estimate is -29.17, with a standard error
of 1.15 and a t-value of -25.28. From the Intermediate to Advanced group, the estimate is -10.25,
with a standard error of 0.53 and a t-value of -19.20. From the Intermediate to the Fluent group,
the estimate is -18.45, with a standard error of 0.52 and a t-value of -35.59. The final group
considered was the Advanced to the Fluent group, with an estimate of -8.20 and a standard error
of 0.43 and a t-value of -19.25.
Fifth grade Math. There were 3,619 KELPA tests administered, and of those 3,518 had
a Math score counterpart. In checking the normality of residuals, the MSE of the group was
158.41, with an R-Square of 0.29. A one-way ANOVA was conducted to compare the effect of
the Math content assessment score on the KELPA proficiency group. An analysis of variance
showed that the effect of the Math content assessment score on the KELPA proficiency category
was significant, F (3, 3514) = 489.80, p = .0001. The ANOVA had a MSE of 158.07, and an R-
Square of 0.30. There was a coefficient variance of 17.62 and Root MSE of 12.57. The mean for
Math was 71.36. Using Brown and Forsythe’s Test for Homogeneity of Math Score Variance

62
ANOVA of Absolute Deviations from group Medians, the MSE was 55.43. Bartlett’s Test for
Homogeneity of Math Score Variance had a Chi-Square of 55.41.
Table 4: Fifth Grade Math
Proficiency Level Number of Participants Mean Standard Deviation
Beginning 155 50.36 16.66
Intermediate 635 61.61 13.47
Advanced 1,218 69.15 12.67
Fluent 1,510 79.40 11.58
The basic information for fifth grade Math can be found in Table 4 above. These means
represent the LSMs for the different proficiency groups. The difference in LSM between
Beginning and Intermediate is -11.25, with a standard error of 1.44 and a t-value of -7.80. For the
Beginning to Advanced group, the estimate is -18.79, with a standard error of 1.39 and a t-value
of -13.55. From the Beginning to the Fluent group, the estimate is -29.04 with a standard error of
1.38 and a t-value of -21.18. From the Intermediate to Advanced group, the estimate is -7.54
with a standard error of 0.65 and a t-value of -11.67. From the Intermediate to the Fluent group,
the estimate is -17.79 with a standard error of 0.61 and a t-value of -29.08. The final group
considered was the Advanced to the Fluent group, with an estimate of -10.25 and a standard error
of 0.47 and a t-value of -21.82.
Sixth grade Math. There were 3,174 KELPA tests administered, and of those 3,104 had
a Math score counterpart. In checking the normality of residuals, the MSE of the group was
192.28, with an R-Square of 0.33. A one-way ANOVA was conducted to compare effect of the
Math content assessment score on the KELPA proficiency group. An analysis of variance
showed that the effect of the Math content assessment score on the KELPA proficiency category
was significant, F (3, 3100) = 500.45, p = .0001. The ANOVA had a MSE of 192.29, and an R-
Square of 0.33. There was a coefficient variance of 19.93 and Root MSE of 13.87. The mean for
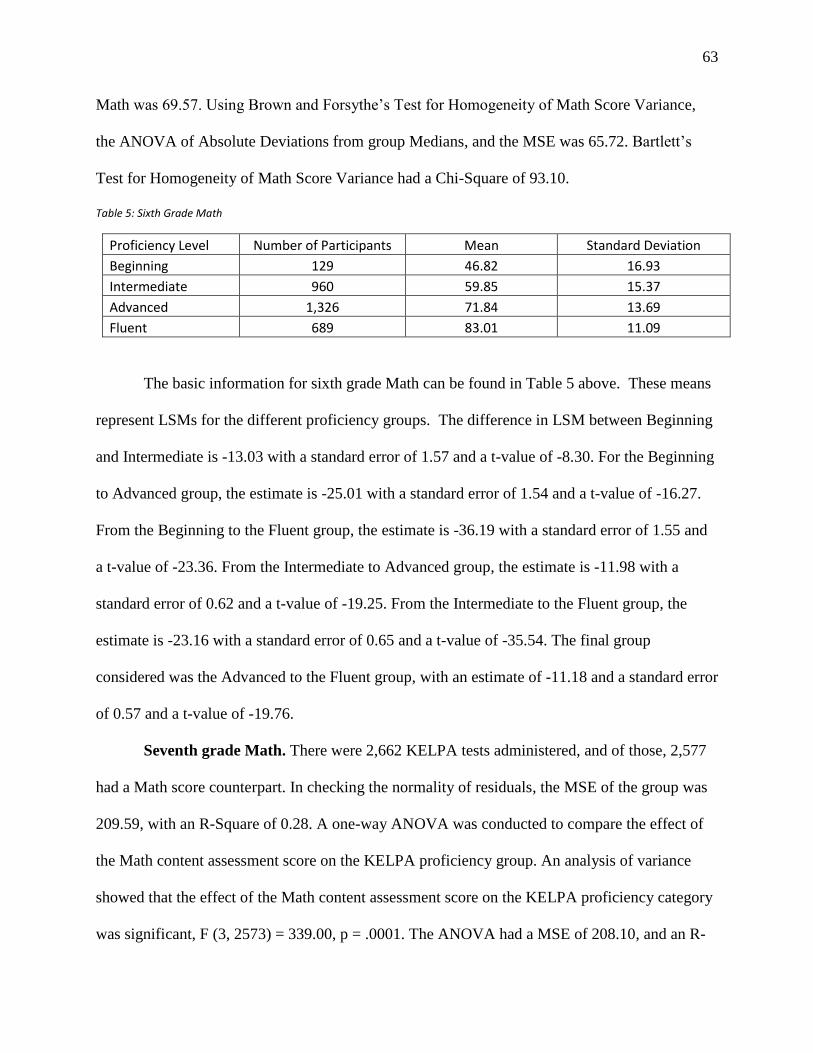
63
Math was 69.57. Using Brown and Forsythe’s Test for Homogeneity of Math Score Variance,
the ANOVA of Absolute Deviations from group Medians, and the MSE was 65.72. Bartlett’s
Test for Homogeneity of Math Score Variance had a Chi-Square of 93.10.
Table 5: Sixth Grade Math
Proficiency Level Number of Participants Mean Standard Deviation
Beginning 129 46.82 16.93
Intermediate 960 59.85 15.37
Advanced 1,326 71.84 13.69
Fluent 689 83.01 11.09
The basic information for sixth grade Math can be found in Table 5 above. These means
represent LSMs for the different proficiency groups. The difference in LSM between Beginning
and Intermediate is -13.03 with a standard error of 1.57 and a t-value of -8.30. For the Beginning
to Advanced group, the estimate is -25.01 with a standard error of 1.54 and a t-value of -16.27.
From the Beginning to the Fluent group, the estimate is -36.19 with a standard error of 1.55 and
a t-value of -23.36. From the Intermediate to Advanced group, the estimate is -11.98 with a
standard error of 0.62 and a t-value of -19.25. From the Intermediate to the Fluent group, the
estimate is -23.16 with a standard error of 0.65 and a t-value of -35.54. The final group
considered was the Advanced to the Fluent group, with an estimate of -11.18 and a standard error
of 0.57 and a t-value of -19.76.
Seventh grade Math. There were 2,662 KELPA tests administered, and of those, 2,577
had a Math score counterpart. In checking the normality of residuals, the MSE of the group was
209.59, with an R-Square of 0.28. A one-way ANOVA was conducted to compare the effect of
the Math content assessment score on the KELPA proficiency group. An analysis of variance
showed that the effect of the Math content assessment score on the KELPA proficiency category
was significant, F (3, 2573) = 339.00, p = .0001. The ANOVA had a MSE of 208.10, and an R-
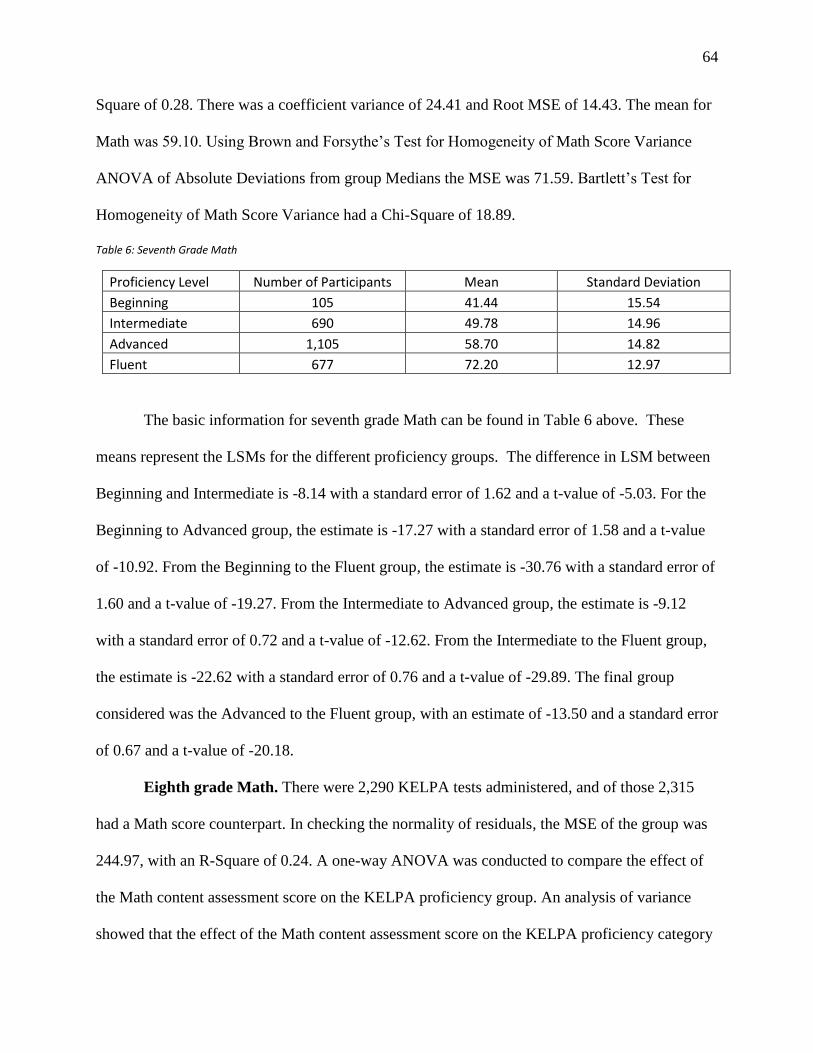
64
Square of 0.28. There was a coefficient variance of 24.41 and Root MSE of 14.43. The mean for
Math was 59.10. Using Brown and Forsythe’s Test for Homogeneity of Math Score Variance
ANOVA of Absolute Deviations from group Medians the MSE was 71.59. Bartlett’s Test for
Homogeneity of Math Score Variance had a Chi-Square of 18.89.
Table 6: Seventh Grade Math
Proficiency Level Number of Participants Mean Standard Deviation
Beginning 105 41.44 15.54
Intermediate 690 49.78 14.96
Advanced 1,105 58.70 14.82
Fluent 677 72.20 12.97
The basic information for seventh grade Math can be found in Table 6 above. These
means represent the LSMs for the different proficiency groups. The difference in LSM between
Beginning and Intermediate is -8.14 with a standard error of 1.62 and a t-value of -5.03. For the
Beginning to Advanced group, the estimate is -17.27 with a standard error of 1.58 and a t-value
of -10.92. From the Beginning to the Fluent group, the estimate is -30.76 with a standard error of
1.60 and a t-value of -19.27. From the Intermediate to Advanced group, the estimate is -9.12
with a standard error of 0.72 and a t-value of -12.62. From the Intermediate to the Fluent group,
the estimate is -22.62 with a standard error of 0.76 and a t-value of -29.89. The final group
considered was the Advanced to the Fluent group, with an estimate of -13.50 and a standard error
of 0.67 and a t-value of -20.18.
Eighth grade Math. There were 2,290 KELPA tests administered, and of those 2,315
had a Math score counterpart. In checking the normality of residuals, the MSE of the group was
244.97, with an R-Square of 0.24. A one-way ANOVA was conducted to compare the effect of
the Math content assessment score on the KELPA proficiency group. An analysis of variance
showed that the effect of the Math content assessment score on the KELPA proficiency category
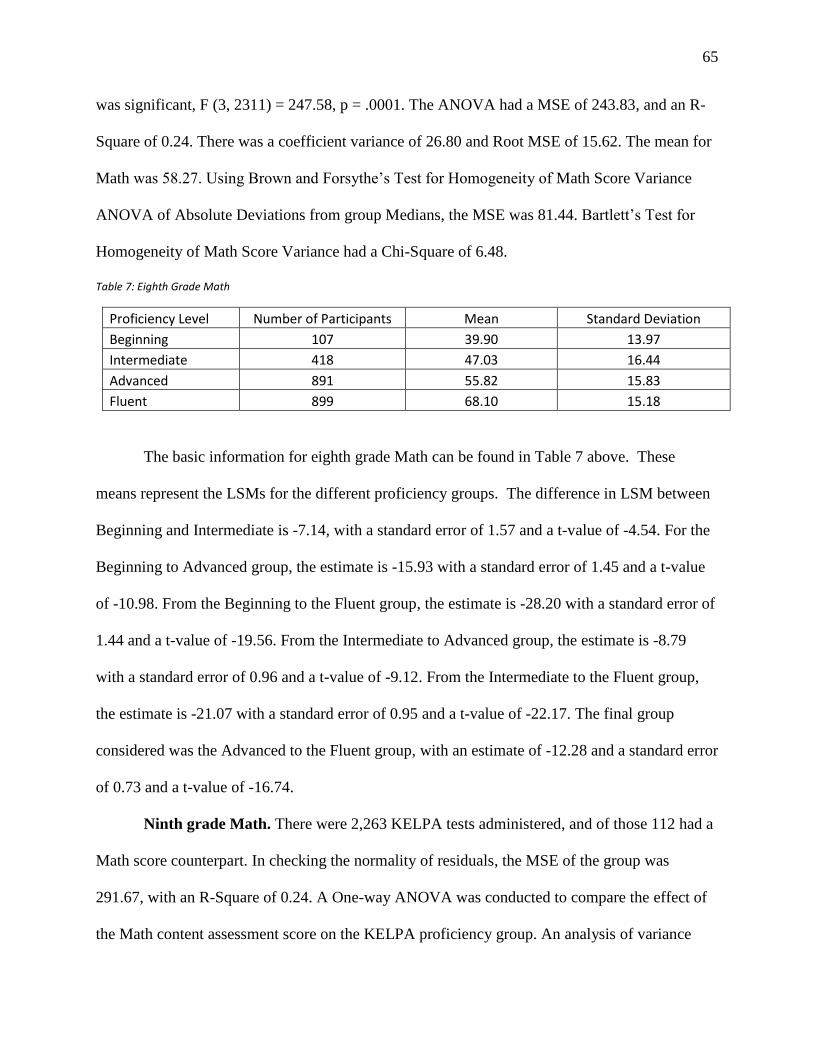
65
was significant, F (3, 2311) = 247.58, p = .0001. The ANOVA had a MSE of 243.83, and an R-
Square of 0.24. There was a coefficient variance of 26.80 and Root MSE of 15.62. The mean for
Math was 58.27. Using Brown and Forsythe’s Test for Homogeneity of Math Score Variance
ANOVA of Absolute Deviations from group Medians, the MSE was 81.44. Bartlett’s Test for
Homogeneity of Math Score Variance had a Chi-Square of 6.48.
Table 7: Eighth Grade Math
Proficiency Level Number of Participants Mean Standard Deviation
Beginning 107 39.90 13.97
Intermediate 418 47.03 16.44
Advanced 891 55.82 15.83
Fluent 899 68.10 15.18
The basic information for eighth grade Math can be found in Table 7 above. These
means represent the LSMs for the different proficiency groups. The difference in LSM between
Beginning and Intermediate is -7.14, with a standard error of 1.57 and a t-value of -4.54. For the
Beginning to Advanced group, the estimate is -15.93 with a standard error of 1.45 and a t-value
of -10.98. From the Beginning to the Fluent group, the estimate is -28.20 with a standard error of
1.44 and a t-value of -19.56. From the Intermediate to Advanced group, the estimate is -8.79
with a standard error of 0.96 and a t-value of -9.12. From the Intermediate to the Fluent group,
the estimate is -21.07 with a standard error of 0.95 and a t-value of -22.17. The final group
considered was the Advanced to the Fluent group, with an estimate of -12.28 and a standard error
of 0.73 and a t-value of -16.74.
Ninth grade Math. There were 2,263 KELPA tests administered, and of those 112 had a
Math score counterpart. In checking the normality of residuals, the MSE of the group was
291.67, with an R-Square of 0.24. A One-way ANOVA was conducted to compare the effect of
the Math content assessment score on the KELPA proficiency group. An analysis of variance
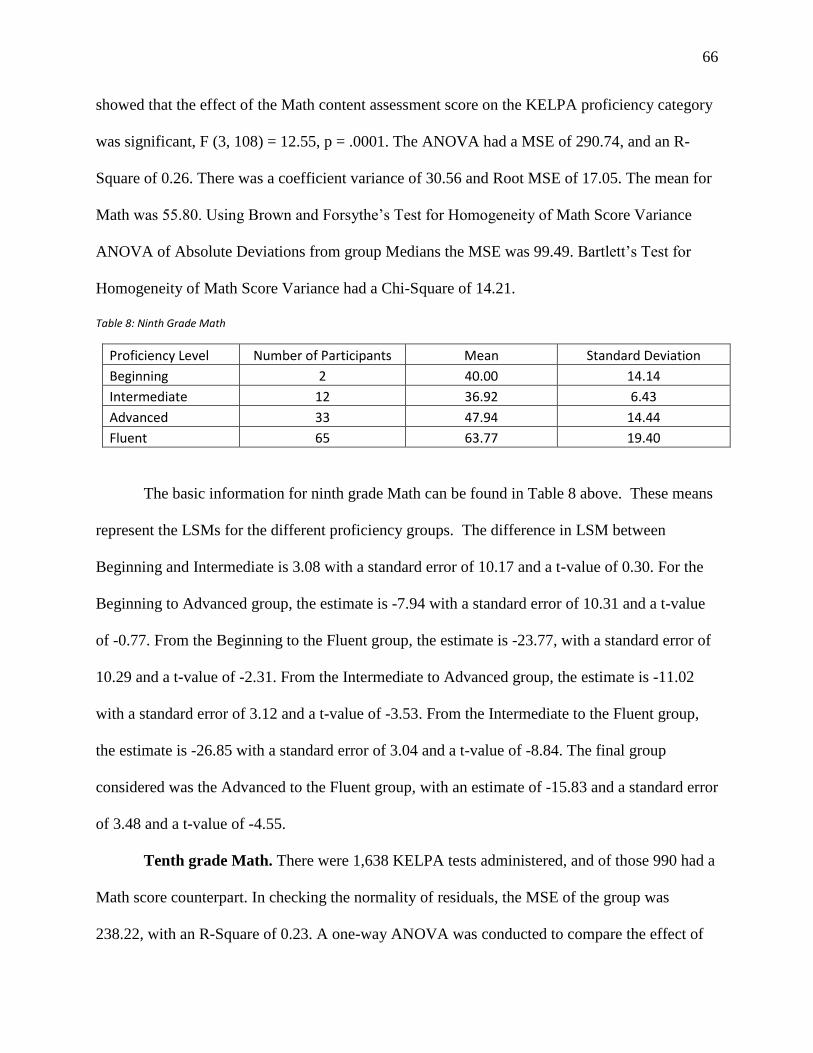
66
showed that the effect of the Math content assessment score on the KELPA proficiency category
was significant, F (3, 108) = 12.55, p = .0001. The ANOVA had a MSE of 290.74, and an R-
Square of 0.26. There was a coefficient variance of 30.56 and Root MSE of 17.05. The mean for
Math was 55.80. Using Brown and Forsythe’s Test for Homogeneity of Math Score Variance
ANOVA of Absolute Deviations from group Medians the MSE was 99.49. Bartlett’s Test for
Homogeneity of Math Score Variance had a Chi-Square of 14.21.
Table 8: Ninth Grade Math
Proficiency Level Number of Participants Mean Standard Deviation
Beginning 2 40.00 14.14
Intermediate 12 36.92 6.43
Advanced 33 47.94 14.44
Fluent 65 63.77 19.40
The basic information for ninth grade Math can be found in Table 8 above. These means
represent the LSMs for the different proficiency groups. The difference in LSM between
Beginning and Intermediate is 3.08 with a standard error of 10.17 and a t-value of 0.30. For the
Beginning to Advanced group, the estimate is -7.94 with a standard error of 10.31 and a t-value
of -0.77. From the Beginning to the Fluent group, the estimate is -23.77, with a standard error of
10.29 and a t-value of -2.31. From the Intermediate to Advanced group, the estimate is -11.02
with a standard error of 3.12 and a t-value of -3.53. From the Intermediate to the Fluent group,
the estimate is -26.85 with a standard error of 3.04 and a t-value of -8.84. The final group
considered was the Advanced to the Fluent group, with an estimate of -15.83 and a standard error
of 3.48 and a t-value of -4.55.
Tenth grade Math. There were 1,638 KELPA tests administered, and of those 990 had a
Math score counterpart. In checking the normality of residuals, the MSE of the group was
238.22, with an R-Square of 0.23. A one-way ANOVA was conducted to compare the effect of
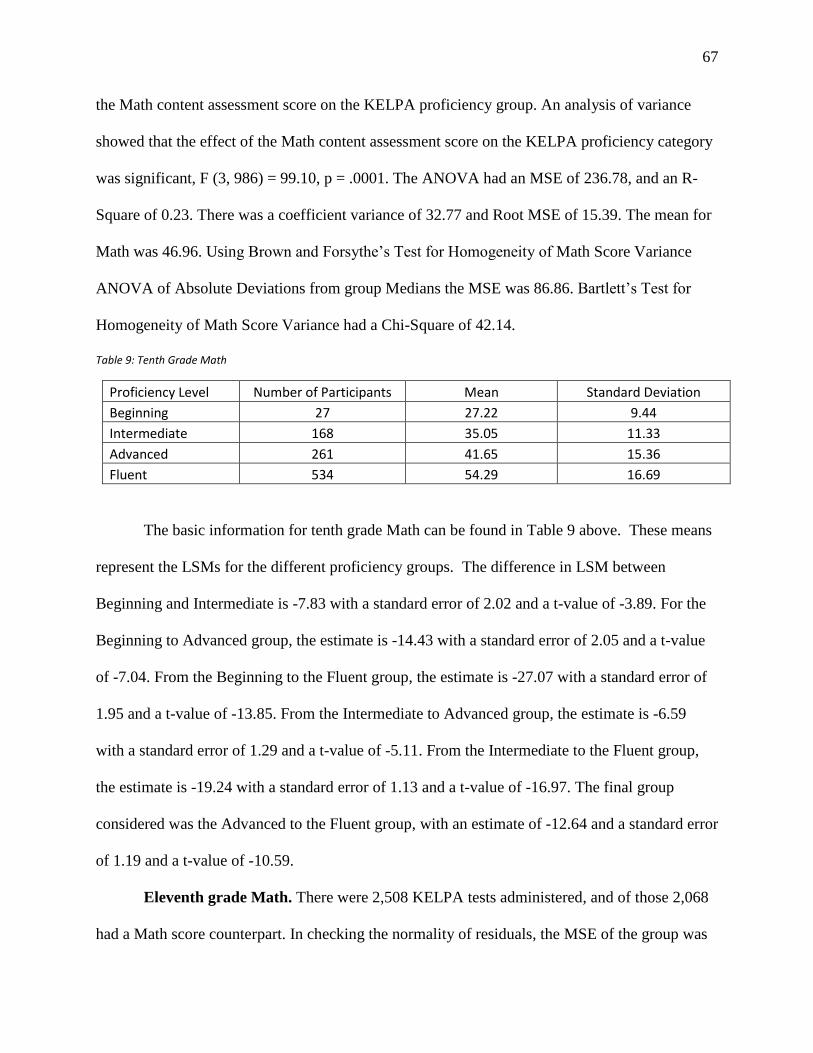
67
the Math content assessment score on the KELPA proficiency group. An analysis of variance
showed that the effect of the Math content assessment score on the KELPA proficiency category
was significant, F (3, 986) = 99.10, p = .0001. The ANOVA had an MSE of 236.78, and an R-
Square of 0.23. There was a coefficient variance of 32.77 and Root MSE of 15.39. The mean for
Math was 46.96. Using Brown and Forsythe’s Test for Homogeneity of Math Score Variance
ANOVA of Absolute Deviations from group Medians the MSE was 86.86. Bartlett’s Test for
Homogeneity of Math Score Variance had a Chi-Square of 42.14.
Table 9: Tenth Grade Math
Proficiency Level Number of Participants Mean Standard Deviation
Beginning 27 27.22 9.44
Intermediate 168 35.05 11.33
Advanced 261 41.65 15.36
Fluent 534 54.29 16.69
The basic information for tenth grade Math can be found in Table 9 above. These means
represent the LSMs for the different proficiency groups. The difference in LSM between
Beginning and Intermediate is -7.83 with a standard error of 2.02 and a t-value of -3.89. For the
Beginning to Advanced group, the estimate is -14.43 with a standard error of 2.05 and a t-value
of -7.04. From the Beginning to the Fluent group, the estimate is -27.07 with a standard error of
1.95 and a t-value of -13.85. From the Intermediate to Advanced group, the estimate is -6.59
with a standard error of 1.29 and a t-value of -5.11. From the Intermediate to the Fluent group,
the estimate is -19.24 with a standard error of 1.13 and a t-value of -16.97. The final group
considered was the Advanced to the Fluent group, with an estimate of -12.64 and a standard error
of 1.19 and a t-value of -10.59.
Eleventh grade Math. There were 2,508 KELPA tests administered, and of those 2,068
had a Math score counterpart. In checking the normality of residuals, the MSE of the group was

68
215.64, with an R-Square of 0.10. A one-way ANOVA was conducted to compare the effect of
the Math content assessment score on the KELPA proficiency group. An analysis of variance
showed that the effect of the Math content assessment score on the KELPA proficiency category
was significant, F (3, 2064) = 78.63, p = .0001. The ANOVA had an MSE of 214.89, and an R-
Square of 0.10. There was a coefficient variance of 34.64 and Root MSE of 14.66. The mean for
Math was 42.32. Using Brown and Forsythe’s Test for Homogeneity of Math Score Variance
ANOVA of Absolute Deviations from group Medians the MSE was 84.54. Bartlett’s Test for
Homogeneity of Math Score Variance had a Chi-Square of 63.67.
Table 10: Eleventh Grade Math
Proficiency Level Number of Participants Mean Standard Deviation
Beginning 90 27.86 9.47
Intermediate 577 37.39 13.29
Advanced 601 43.00 13.91
Fluent 800 47.00 16.51
The basic information for eleventh grade Math can be found in Table 10 above. These
means represent LSMs for the different proficiency groups. The difference in LSM between
Beginning and Intermediate is -9.53, with a standard error of 1.14 and a t-value of -8.35. For the
Beginning to Advanced group, the estimate is -15.14 with a standard error of 1.15 and a t-value
of -13.19. From the Beginning to the Fluent group, the estimate is -19.15 with a standard error of
1.16 and a t-value of -16.56. From the Intermediate to Advanced group, the estimate is -5.61
with a standard error of 0.79 and a t-value of -7.08. From the Intermediate to the Fluent group,
the estimate is -9.62 with a standard error of 0.80 and a t-value of -11.96. The final group
considered was the Advanced to the Fluent group, with an estimate of -4.00 and a standard error
of 0.81 and a t-value of -4.92.
69
Summary of Math Content Area. Language proficiency category was found to be
significant at all grade levels in Math (Pr > F <.0001). In all except the ninth grade, the language
proficiency levels were an indicator of overall performance, with the beginning students doing
the worst up to the Fluent students doing the best. In all but two grades (eighth and ninth), the
standard deviations were highest for the Beginning students and got progressively lower until the
Fluent level. The largest Estimate value was the category of Beginning to Fluent in all but ninth
grade. The next largest Estimate values were Beginning to Advanced (four times) and then
Intermediate to Fluent (three times). The lowest Estimates were in Advanced to Fluent (four
times) and Beginning to Intermediate (three times). This data supports the original hypothesis
that larger differences would be present in the high-to-low combinations (Beginning to Advance,
Beginning to Fluent, and Intermediate to Fluent) and the smaller differences would be the
categories next to each other (Beginning to Intermediate, Intermediate to Advanced, and
Advanced to Fluent).
Content Area Reading
For Reading, students were given tests every year from third grade until eleventh grade.
They were also given the KELPA each of those years. In order to analyze the data, each grade
will be evaluated individually since the tests were not equated.
Third grade Reading. The first grade that is administered both the Reading content area
test and the KELPA is third grade. There were 4,300 KELPA tests administered, and of those
4,103 had a Reading score counterpart. In checking the normality of residuals, the MSE of the
group was 132.62, with an R-Square of 0.39. A one-way ANOVA was conducted to compare the
effect of the Reading content assessment score on the KELPA proficiency group. An analysis of
variance showed that the effect of the Reading content assessment score on the KELPA

70
proficiency category was significant, F (3, 4099) = 881.55, p = .0001. The ANOVA had a MSE
of 132.10, and an R-Square of 0.39. There was a coefficient variance of 16.14 and Root MSE of
11.49. The mean for Reading was 71.19. Using Brown and Forsythe’s Test for Homogeneity of
Reading Score Variance ANOVA of Absolute Deviations from group Medians, the MSE was
49.09. Bartlett’s Test for Homogeneity of Reading Score Variance had a Chi-Square of 369.0.
Table 11: Third Grade Reading
Proficiency Level Number of Participants Mean Standard Deviation
Beginning 188 53.50 18.31
Intermediate 1,085 60.61 13.89
Advanced 1,525 71.16 10.42
Fluent 1,305 82.57 8.94
The basic information for third grade Reading can be found in Table 11 above. These
means represent the LSMs for the different proficiency groups. The difference in LSM between
Beginning and Intermediate is -7.12, with a standard error of 1.40 and a t-value of -5.08. For the
Beginning to Advanced group, the estimate is -17.67 with a standard error of 1.36 and a t-value
of -12.97. From the Beginning to the Fluent group, the estimate is -29.08, with a standard error
of 1.36 and a t-value of -21.41. From the Intermediate to Advanced group, the estimate is -10.55
with a standard error of 0.50 and a t-value of -21.14. From the Intermediate to the Fluent group,
the estimate is -21.96 with a standard error of 0.49 and a t-value of -44.91. The final group
considered was the Advanced to the Fluent group, with an estimate of -11.41 and a standard error
of 0.36 and a t-value of -31.36.
Fourth grade Reading. There were 4,109 KELPA tests administered, and of those 3,915
had a Reading score counterpart. In checking the normality of residuals, the MSE of the group
was 116.95, with an R-Square of 0.43. A one-way ANOVA was conducted to compare the effect
of the Reading content assessment score on the KELPA proficiency group. An analysis of

71
variance showed that the effect of the Reading content assessment score on the KELPA
proficiency category was significant, F (3, 3911) = 1007.80, p = .0001. The ANOVA had a MSE
of 115.93, and an R-Square of 0.44. There was a coefficient variance of 14.71 and Root MSE of
10.77. The mean for Reading was 73.21. Using Brown and Forsythe’s Test for Homogeneity of
Reading Score Variance ANOVA of Absolute Deviations from group Medians the MSE was
42.95. Bartlett’s Test for Homogeneity of Reading Score Variance had a Chi-Square of 599.2.
Table 12: Fourth Grade Reading
Proficiency Level Number of Participants Mean Standard Deviation
Beginning 234 50.73 18.57
Intermediate 1,100 63.97 12.93
Advanced 1,420 75.37 9.45
Fluent 1,161 83.86 7.35
The basic information for fourth grade Reading can be found in Table 12 above. These
means represent the LSMs for the different proficiency groups. The difference in LSM between
Beginning and Intermediate is -13.24, with a standard error of 1.27 and a t-value of -10.39. For
the Beginning to Advanced group, the estimate is -24.64 with a standard error of 1.24 and a t-
value of -19.88. From the Beginning to the Fluent group, the estimate is -33.13 with a standard
error of 1.23 and a t-value of -26.88. From the Intermediate to Advanced group, the estimate is -
11.40 with a standard error of 0.46 and a t-value of -24.59. From the Intermediate to the Fluent
group, the estimate is -19.89 with a standard error of 0.45 and a t-value of -44.65. The final
group considered was the Advanced to the Fluent group, with an estimate of -8.49 and a standard
error of 0.33 and a t-value of -25.67.
Fifth grade Reading. There were 3,619 KELPA tests administered, and of those 3,438
had a Reading score counterpart. In checking the normality of residuals, the MSE of the group
was 130.07, with an R-Square of 0.43. A One-way ANOVA was conducted to compare the

72
effect of the Reading content assessment score on the KELPA proficiency group. An analysis of
variance showed that the effect of the Reading content assessment score on the KELPA
proficiency category was significant, F (3, 3424) = 861.01, p = .0001. The ANOVA had a MSE
of 128.88, and an R-Square of 0.43. There was a coefficient variance of 16.15 and Root MSE of
11.40. The mean for Reading was 70.56. Using Brown and Forsythe’s Test for Homogeneity of
Reading Score Variance ANOVA of Absolute Deviations from group Medians the MSE was
48.55. Bartlett’s Test for Homogeneity of Reading Score Variance had a Chi-Square of 164.6.
Table 13: Fifth Grade Reading
Proficiency Level Number of Participants Mean Standard Deviation
Beginning 110 42.86 15.53
Intermediate 612 57.32 13.90
Advanced 1,212 67.98 11.65
Fluent 1,504 80.06 9.56
The basic information for fifth grade Reading can be found in Table 13 above. These
means represent the LSMs for the different proficiency groups. The difference in LSM between
Beginning and Intermediate is -14.47 with a standard error of 1.58 and a t-value of -9.14. For the
Beginning to Advanced group, the estimate is -25.12 with a standard error of 1.52 and a t-value
of -16.55. From the Beginning to the Fluent group, the estimate is -37.21 with a standard error of
1.50 and a t-value of -24.79. From the Intermediate to Advanced group, the estimate is -10.66
with a standard error of 0.65 and a t-value of -16.30. From the Intermediate to the Fluent group,
the estimate is -22.74 with a standard error of 0.61 and a t-value of -37.06. The final group
considered was the Advanced to the Fluent group, with an estimate of -12.08 and a standard error
of 0.42 and a t-value of -29.07.
Sixth grade Reading. There were 3,174 KELPA tests administered, and of those 3,032
had a Reading score counterpart. In checking the normality of residuals, the MSE of the group

73
was 144.71, with an R-Square of 0.44. A one-way ANOVA was conducted to compare the effect
of the Reading content assessment score on the KELPA proficiency group. An analysis of
variance showed that the effect of the Reading content assessment score on the KELPA
proficiency category was significant, F (3, 3028) = 808.65, p = .0001. The ANOVA had a MSE
of 143.65, and an R-Square of 0.45. There was a coefficient variance of 17.46 and Root MSE of
11.99. The mean for Reading was 68.64. Using Brown and Forsythe’s Test for Homogeneity of
Reading Score Variance ANOVA of Absolute Deviations from group Medians the MSE was
51.99. Bartlett’s Test for Homogeneity of Reading Score Variance had a Chi-Square of 324.0.
Table 14: Sixth Grade Reading
Proficiency Level Number of Participants Mean Standard Deviation
Beginning 92 41.62 15.53
Intermediate 936 56.69 14.85
Advanced 1,318 71.71 11.21
Fluent 686 82.68 7.75
The basic information for sixth grade Reading can be found in Table 14 above. These
means represent the LSMs for the different proficiency groups. The difference in LSM between
Beginning and Intermediate is -16.07 with a standard error of 1.69 and a t-value of -8.19. For the
Beginning to Advanced group, the estimate is -30.09 with a standard error of 1.65 and a t-value
of -19.26. From the Beginning to the Fluent group, the estimate is -41.06 with a standard error of
1.65 and a t-value of -24.95. From the Intermediate to Advanced group, the estimate is -15.02
with a standard error of 0.58 and a t-value of -26.10. From the Intermediate to the Fluent group,
the estimate is -25.99 with a standard error of 0.57 and a t-value of -45.72. The final group
considered to the Fluent group was the Advanced, with an estimate of -10.97 and a standard error
of 0.43 and a t-value of -25.66.

74
Seventh grade Reading. There were 2,662 KELPA tests administered, and of those
2,515 had a Reading score counterpart. In checking the normality of residuals, the MSE of the
group was 123.62, with an R-Square of 0.49. A One-way ANOVA was conducted to compare
the effect of the Reading content assessment score on the KELPA proficiency group. An analysis
of variance showed that the effect of the Reading content assessment score on the KELPA
proficiency category was significant, F (3, 2511) = 804.61, p = .0001. The ANOVA had a MSE
of 123.15, and an R-Square of 0.49. There was a coefficient variance of 16.33 and Root MSE of
11.10. The mean for Reading was 67.95. Using Brown and Forsythe’s Test for Homogeneity of
Reading Score Variance ANOVA of Absolute Deviations from group Medians the MSE was
44.89. Bartlett’s Test for Homogeneity of Reading Score Variance had a Chi-Square of 131.7.
Table 15: Seventh Grade Reading
Proficiency Level Number of Participants Mean Standard Deviation
Beginning 64 40.23 13.39
Intermediate 676 54.54 12.92
Advanced 1,097 69.48 11.23
Fluent 678 81.47 8.34
The basic information for seventh grade Reading can be found in Table 15 above. These
means represent the LSMs for the different proficiency groups. The difference in LSM between
Beginning and Intermediate is -14.30 with a standard error of 1.75 and a t-value of -8.19. For the
Beginning to Advanced group, the estimate is -29.24 with a standard error of 1.71 and a t-value
of -17.13. From the Beginning to the Fluent group, the estimate is -41.24 with a standard error of
1.70 and a t-value of -24.20. From the Intermediate to Advanced group, the estimate is -14.94
with a standard error of 0.60 and a t-value of -24.84. From the Intermediate to the Fluent group,
the estimate is -26.93 with a standard error of 0.59 and a t-value of -45.56. The final group

75
considered to the Fluent group was the Advanced, with an estimate of -11.99 and a standard error
of 0.47 and a t-value of -25.71.
Eighth grade Reading. There were 2,390 KELPA tests administered, and of those 2,242
had a Reading score counterpart. In checking the normality of residuals, the MSE of the group
was 161.56, with an R-Square of 0.44. A one-way ANOVA was conducted to compare the effect
of the Reading content assessment score on the KELPA proficiency group. An analysis of
variance showed that the effect of the Reading content assessment score on the KELPA
proficiency category was significant, F (3, 2238) = 573.85, p = .0001. The ANOVA had an MSE
of 161.66, and an R-Square of 0.44. There was a coefficient variance of 19.40 and Root MSE of
12.72. The mean for Reading was 65.53. Using Brown and Forsythe’s Test for Homogeneity of
Reading Score Variance ANOVA of Absolute Deviations from group Medians, the MSE was
61.11. Bartlett’s Test for Homogeneity of Reading Score Variance had a Chi-Square of 78.53.
Table 16: Eighth Grade Reading
Proficiency Level Number of Participants Mean Standard Deviation
Beginning 70 36.81 14.65
Intermediate 396 49.88 15.65
Advanced 880 63.13 12.75
Fluent 896 77.03 10.95
The basic information for eighth grade Reading can be found in Table 16 above. These
means represent the LSMs for the different proficiency groups. The difference in LSM between
Beginning and Intermediate is -13.07 with a standard error of 1.92 and a t-value of -6.81. For the
Beginning to Advanced group, the estimate is -26.31 with a standard error of 1.80 and a t-value
of -14.59. From the Beginning to the Fluent group, the estimate is -40.22 with a standard error of
1.79 and a t-value of -22.48. From the Intermediate to Advanced group, the estimate is -13.25
with a standard error of 0.90 and a t-value of -14.78. From the Intermediate to the Fluent group,
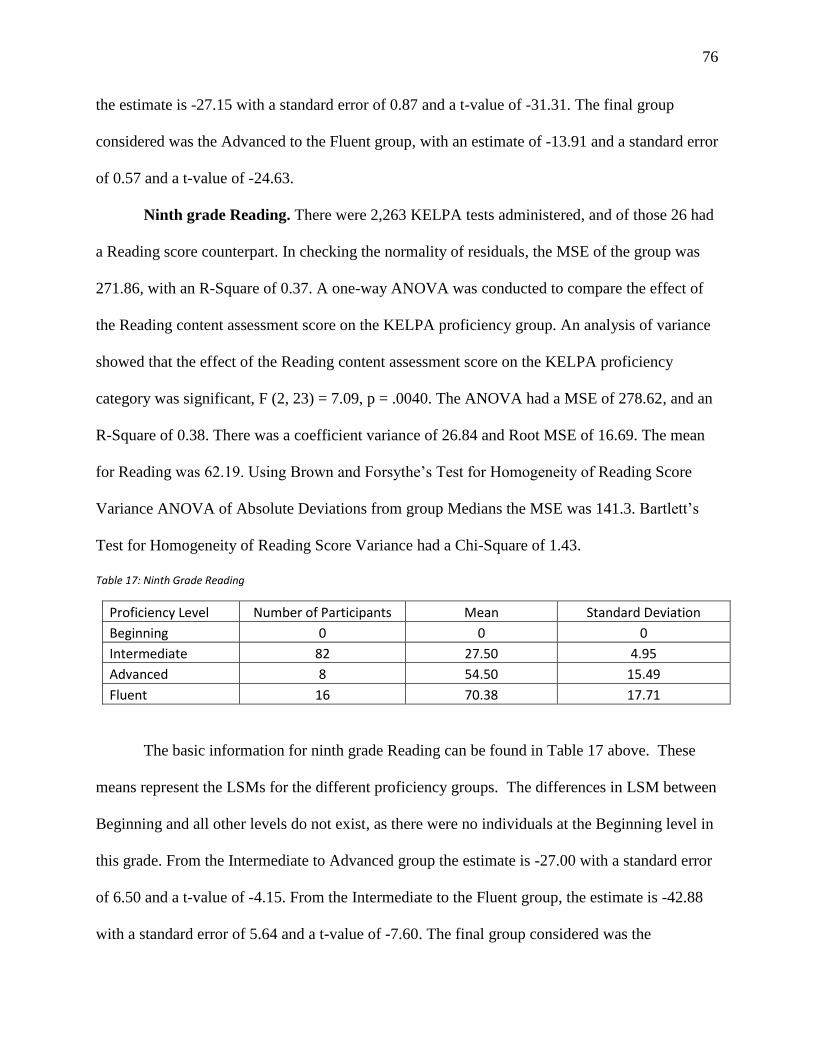
76
the estimate is -27.15 with a standard error of 0.87 and a t-value of -31.31. The final group
considered was the Advanced to the Fluent group, with an estimate of -13.91 and a standard error
of 0.57 and a t-value of -24.63.
Ninth grade Reading. There were 2,263 KELPA tests administered, and of those 26 had
a Reading score counterpart. In checking the normality of residuals, the MSE of the group was
271.86, with an R-Square of 0.37. A one-way ANOVA was conducted to compare the effect of
the Reading content assessment score on the KELPA proficiency group. An analysis of variance
showed that the effect of the Reading content assessment score on the KELPA proficiency
category was significant, F (2, 23) = 7.09, p = .0040. The ANOVA had a MSE of 278.62, and an
R-Square of 0.38. There was a coefficient variance of 26.84 and Root MSE of 16.69. The mean
for Reading was 62.19. Using Brown and Forsythe’s Test for Homogeneity of Reading Score
Variance ANOVA of Absolute Deviations from group Medians the MSE was 141.3. Bartlett’s
Test for Homogeneity of Reading Score Variance had a Chi-Square of 1.43.
Table 17: Ninth Grade Reading
Proficiency Level Number of Participants Mean Standard Deviation
Beginning 0 0 0
Intermediate 82 27.50 4.95
Advanced 8 54.50 15.49
Fluent 16 70.38 17.71
The basic information for ninth grade Reading can be found in Table 17 above. These
means represent the LSMs for the different proficiency groups. The differences in LSM between
Beginning and all other levels do not exist, as there were no individuals at the Beginning level in
this grade. From the Intermediate to Advanced group the estimate is -27.00 with a standard error
of 6.50 and a t-value of -4.15. From the Intermediate to the Fluent group, the estimate is -42.88
with a standard error of 5.64 and a t-value of -7.60. The final group considered was the

77
Advanced to the Fluent group with an estimate of -15.88 and a standard error of 7.04 and a t-
value of -2.25.
Tenth grade Reading. There were 1,638 KELPA tests administered, and of those 990
had a Reading score counterpart. In checking the normality of residuals, the MSE of the group
was 192.71, with an R-Square of 0.36. A one-way ANOVA was conducted to compare the effect
of the Reading content assessment score on the KELPA proficiency group. An analysis of
variance showed that the effect of the Reading content assessment score on the KELPA
proficiency category was significant, F (3, 970) = 181.16, p = .0001. The ANOVA had a MSE of
191.75, and an R-Square of 0.36. There was a coefficient variance of 22.43 and Root MSE of
13.85. The mean for Reading was 61.75. Using Brown and Forsythe’s Test for Homogeneity of
Reading Score Variance ANOVA of Absolute Deviations from group Medians the MSE was
72.50. Bartlett’s Test for Homogeneity of Reading Score Variance had a Chi-Square of 25.99.
Table 18: Tenth Grade Reading
Proficiency Level Number of Participants Mean Standard Deviation
Beginning 10 28.60 5.08
Intermediate 135 44.40 16.94
Advanced 265 54.35 13.90
Fluent 564 69.97 13.08
The basic information for tenth grade Reading can be found in Table 18 above. These
means represent the LSMs for the different proficiency groups. The difference in LSM between
Beginning and Intermediate is -15.80 with a standard error of 2.17 and a t-value of -7.28. For the
Beginning to Advanced group, the estimate is -25.75 with a standard error of 1.82 and a t-value
of -14.15. From the Beginning to the Fluent group, the estimate is -41.37 with a standard error of
1.70 and a t-value of -24.35. From the Intermediate to Advanced group, the estimate is -9.95
with a standard error of 1.70 and a t-value of -5.89. From the Intermediate to the Fluent group,

78
the estimate is -25.57 with a standard error of 1.56 and a t-value of -16.40. The final group
considered was the Advanced to the Fluent group, with an estimate of -15.62 and a standard error
of 1.02 and a t-value of -15.37.
Eleventh grade Reading. There were 2,508 KELPA tests administered, and of those
2,121 had a Reading score counterpart. In checking the normality of residuals, the MSE of the
group was 173.58, with an R-Square of 0.36. A one-way ANOVA was conducted to compare the
effect of the Reading content assessment score on the KELPA proficiency group. An analysis of
variance showed that the effect of the Reading content assessment score on the KELPA
proficiency category was significant, F (3, 2117) = 404.67, p = .0001. The ANOVA had a MSE
of 172.89, and an R-Square of 0.37. There was a coefficient variance of 23.98 and Root MSE of
13.15. The mean for Reading was 54.83. Using Brown and Forsythe’s Test for Homogeneity of
Reading Score Variance ANOVA of Absolute Deviations from group Medians the MSE was
66.90. Bartlett’s Test for Homogeneity of Reading Score Variance had a Chi-Square of 26.66.
Table 19: Eleventh Grade Reading
Proficiency Level Number of Participants Mean Standard Deviation
Beginning 68 31.59 7.91
Intermediate 550 41.86 13.03
Advanced 602 55.15 13.19
Fluent 901 64.29 13.50
The basic information for eleventh grade Reading can be found in Table 19 above. These
means represent the LSMs for the different proficiency groups. The difference in LSM between
Beginning and Intermediate is -10.27 with a standard error of 1.11 and a t-value of -9.26. For the
Beginning to Advanced group, the estimate is -23.56 with a standard error of 1.10 and a t-value
of -21.42. From the Beginning to the Fluent group, the estimate is -32.70 with a standard error of
1.06 and a t-value of -30.86. From the Intermediate to Advanced group, the estimate is -13.29
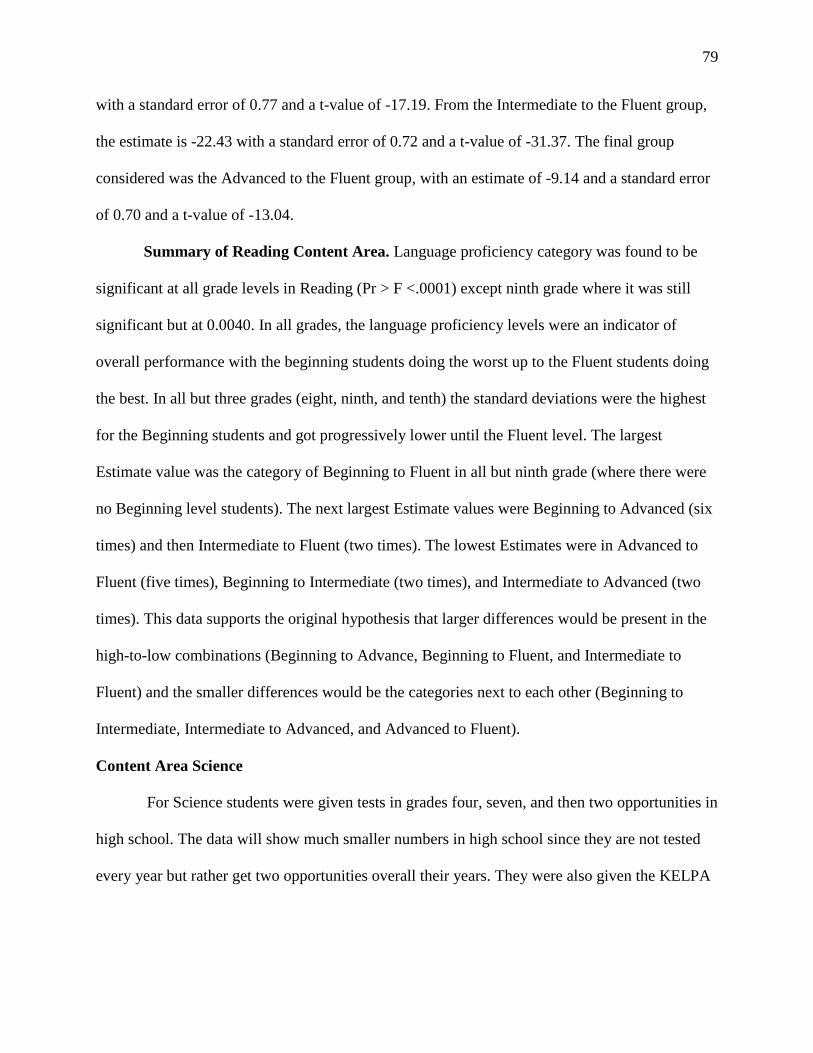
79
with a standard error of 0.77 and a t-value of -17.19. From the Intermediate to the Fluent group,
the estimate is -22.43 with a standard error of 0.72 and a t-value of -31.37. The final group
considered was the Advanced to the Fluent group, with an estimate of -9.14 and a standard error
of 0.70 and a t-value of -13.04.
Summary of Reading Content Area. Language proficiency category was found to be
significant at all grade levels in Reading (Pr > F <.0001) except ninth grade where it was still
significant but at 0.0040. In all grades, the language proficiency levels were an indicator of
overall performance with the beginning students doing the worst up to the Fluent students doing
the best. In all but three grades (eight, ninth, and tenth) the standard deviations were the highest
for the Beginning students and got progressively lower until the Fluent level. The largest
Estimate value was the category of Beginning to Fluent in all but ninth grade (where there were
no Beginning level students). The next largest Estimate values were Beginning to Advanced (six
times) and then Intermediate to Fluent (two times). The lowest Estimates were in Advanced to
Fluent (five times), Beginning to Intermediate (two times), and Intermediate to Advanced (two
times). This data supports the original hypothesis that larger differences would be present in the
high-to-low combinations (Beginning to Advance, Beginning to Fluent, and Intermediate to
Fluent) and the smaller differences would be the categories next to each other (Beginning to
Intermediate, Intermediate to Advanced, and Advanced to Fluent).
Content Area Science
For Science students were given tests in grades four, seven, and then two opportunities in
high school. The data will show much smaller numbers in high school since they are not tested
every year but rather get two opportunities overall their years. They were also given the KELPA

80
each of those years. In order to analyze the data, each grade will be evaluated individually since
the tests were not equated.
Fourth grade Science. The first grade that is administered both the Science content area
test and the KELPA is fourth grade. There were 4,109 KELPA tests administered, and of those
3,991 had a Science score counterpart. In checking the normality of residuals, the MSE of the
group was 169.39, with an R-Square of 0.30. A one-way ANOVA was conducted to compare the
effect of the Science content assessment score on the KELPA proficiency group. An analysis of
variance showed that the effect of the Science content assessment score on the KELPA
proficiency category was significant, F (3, 3987) = 562.64, p = .0001. The ANOVA had a MSE
of 169.08, and an R-Square of 0.30. There was a coefficient variance of 20.34 and Root MSE of
13.00. The mean for Science was 63.92. Using Brown and Forsythe’s Test for Homogeneity of
Science Score Variance ANOVA of Absolute Deviations from group Medians the MSE was
61.79. Bartlett’s Test for Homogeneity of Science Score Variance had a Chi-Square of 98.16.
Table 20: Fourth Grade Science
Proficiency Level Number of Participants Mean Standard Deviation
Beginning 282 58.56 17.63
Intermediate 1,121 55.39 13.46
Advanced 1,422 64.83 12.66
Fluent 1,166 74.72 11.58
The basic information for fourth grade Science can be found in Table 20 above. These
means represent the LSMs for the different proficiency groups. The difference in LSM between
Beginning and Intermediate is -6.63 with a standard error of 1.12 and a t-value of -6.08. For the
Beginning to Advanced group, the estimate is -16.27 with a standard error of 1.10 and a t-value
of -14.77. From the Beginning to the Fluent group, the estimate is -26.16 with a standard error of
1.10 and a t-value of -23.72. From the Intermediate to Advanced group, the estimate is -9.45
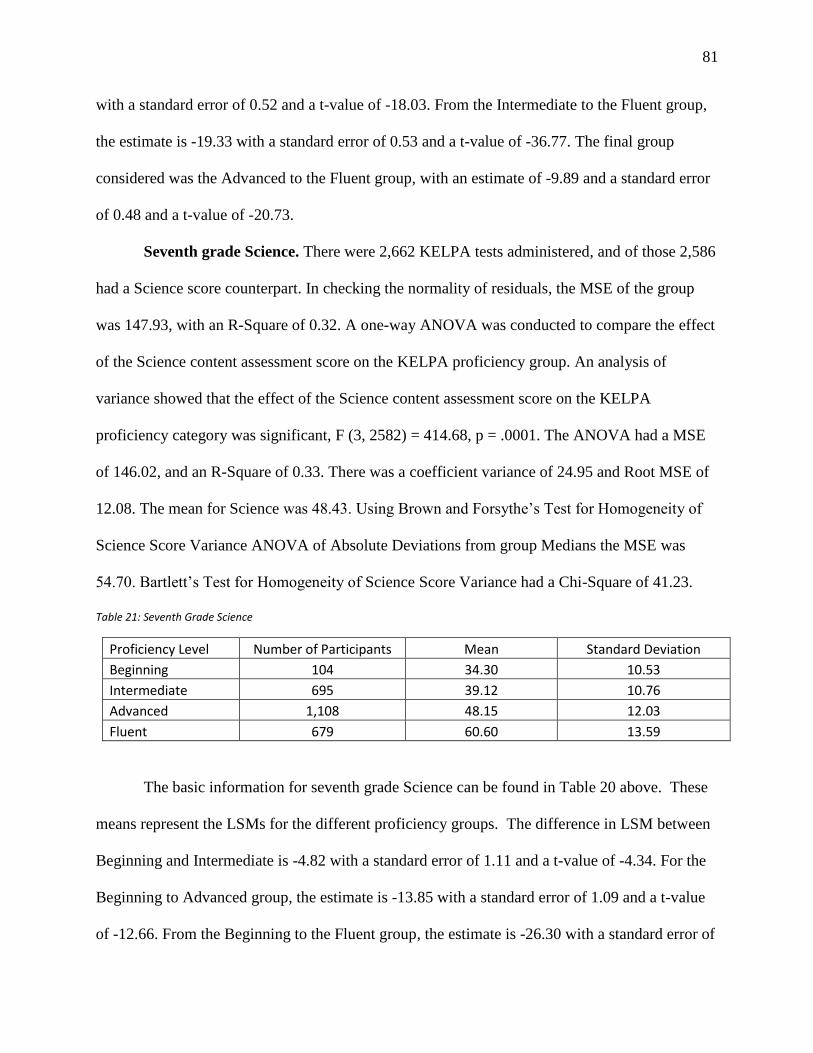
81
with a standard error of 0.52 and a t-value of -18.03. From the Intermediate to the Fluent group,
the estimate is -19.33 with a standard error of 0.53 and a t-value of -36.77. The final group
considered was the Advanced to the Fluent group, with an estimate of -9.89 and a standard error
of 0.48 and a t-value of -20.73.
Seventh grade Science. There were 2,662 KELPA tests administered, and of those 2,586
had a Science score counterpart. In checking the normality of residuals, the MSE of the group
was 147.93, with an R-Square of 0.32. A one-way ANOVA was conducted to compare the effect
of the Science content assessment score on the KELPA proficiency group. An analysis of
variance showed that the effect of the Science content assessment score on the KELPA
proficiency category was significant, F (3, 2582) = 414.68, p = .0001. The ANOVA had a MSE
of 146.02, and an R-Square of 0.33. There was a coefficient variance of 24.95 and Root MSE of
12.08. The mean for Science was 48.43. Using Brown and Forsythe’s Test for Homogeneity of
Science Score Variance ANOVA of Absolute Deviations from group Medians the MSE was
54.70. Bartlett’s Test for Homogeneity of Science Score Variance had a Chi-Square of 41.23.
Table 21: Seventh Grade Science
Proficiency Level Number of Participants Mean Standard Deviation
Beginning 104 34.30 10.53
Intermediate 695 39.12 10.76
Advanced 1,108 48.15 12.03
Fluent 679 60.60 13.59
The basic information for seventh grade Science can be found in Table 20 above. These
means represent the LSMs for the different proficiency groups. The difference in LSM between
Beginning and Intermediate is -4.82 with a standard error of 1.11 and a t-value of -4.34. For the
Beginning to Advanced group, the estimate is -13.85 with a standard error of 1.09 and a t-value
of -12.66. From the Beginning to the Fluent group, the estimate is -26.30 with a standard error of
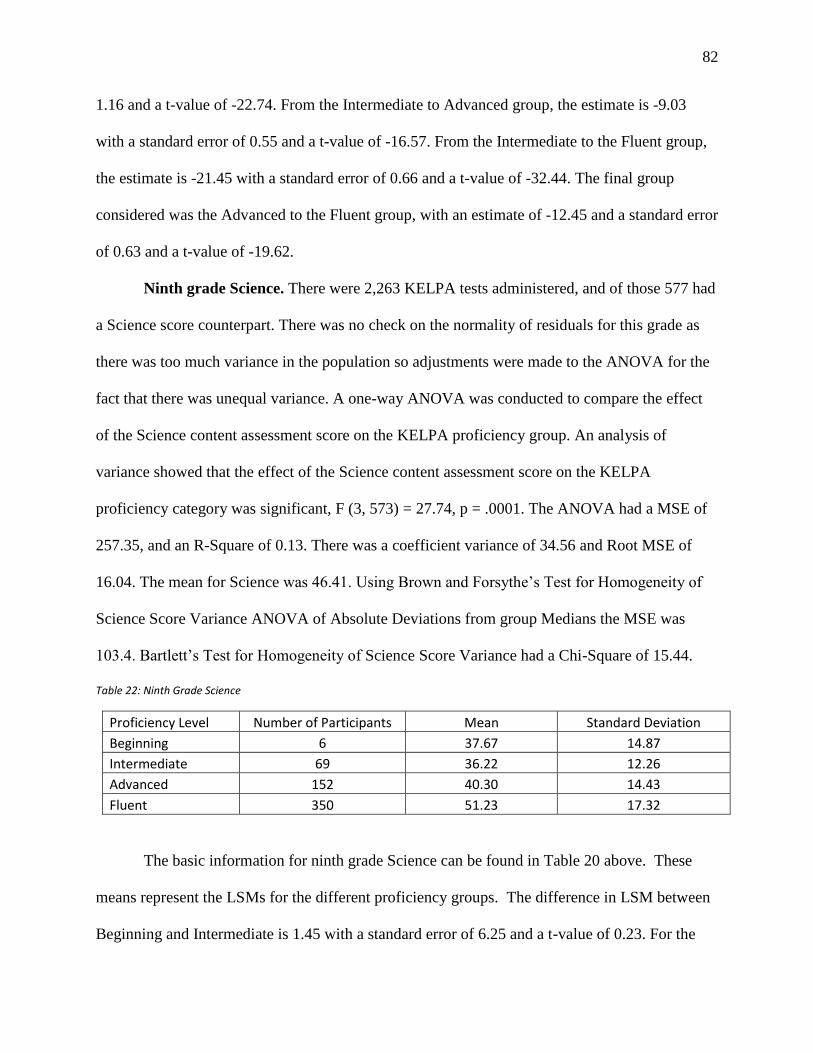
82
1.16 and a t-value of -22.74. From the Intermediate to Advanced group, the estimate is -9.03
with a standard error of 0.55 and a t-value of -16.57. From the Intermediate to the Fluent group,
the estimate is -21.45 with a standard error of 0.66 and a t-value of -32.44. The final group
considered was the Advanced to the Fluent group, with an estimate of -12.45 and a standard error
of 0.63 and a t-value of -19.62.
Ninth grade Science. There were 2,263 KELPA tests administered, and of those 577 had
a Science score counterpart. There was no check on the normality of residuals for this grade as
there was too much variance in the population so adjustments were made to the ANOVA for the
fact that there was unequal variance. A one-way ANOVA was conducted to compare the effect
of the Science content assessment score on the KELPA proficiency group. An analysis of
variance showed that the effect of the Science content assessment score on the KELPA
proficiency category was significant, F (3, 573) = 27.74, p = .0001. The ANOVA had a MSE of
257.35, and an R-Square of 0.13. There was a coefficient variance of 34.56 and Root MSE of
16.04. The mean for Science was 46.41. Using Brown and Forsythe’s Test for Homogeneity of
Science Score Variance ANOVA of Absolute Deviations from group Medians the MSE was
103.4. Bartlett’s Test for Homogeneity of Science Score Variance had a Chi-Square of 15.44.
Table 22: Ninth Grade Science
Proficiency Level Number of Participants Mean Standard Deviation
Beginning 6 37.67 14.87
Intermediate 69 36.22 12.26
Advanced 152 40.30 14.43
Fluent 350 51.23 17.32
The basic information for ninth grade Science can be found in Table 20 above. These
means represent the LSMs for the different proficiency groups. The difference in LSM between
Beginning and Intermediate is 1.45 with a standard error of 6.25 and a t-value of 0.23. For the

83
Beginning to Advanced group, the estimate is -2.64 with a standard error of 6.18 and a t-value of
-0.43. From the Beginning to the Fluent group, the estimate is -13.56 with a standard error of
6.14 and a t-value of -2.21. From the Intermediate to Advanced group, the estimate is -4.09 with
a standard error of 1.88 and a t-value of -2.17. From the Intermediate to the Fluent group, the
estimate is -15.01 with a standard error of 1.74 and a t-value of -8.62. The final group considered
was the Advanced to the Fluent group with an estimate of -10.92 and a standard error of 1.49 and
a t-value of -7.32.
Tenth grade Science. There were 1,638 KELPA tests administered, and of those 799 had
a Science score counterpart. In checking the normality of residuals, the MSE of the group was
208.13, with an R-Square of 0.12. A one-way ANOVA was conducted to compare the effect of
the Science content assessment score on the KELPA proficiency group. An analysis of variance
showed that the effect of the Science content assessment score on the KELPA proficiency
category was significant, F (3, 795) = 38.06, p = .0001. The ANOVA had a MSE of 206.58, and
an R-Square of 0.13. There was a coefficient variance of 30.71 and Root MSE of 14.37. The
mean for Science was 46.80. Using Brown and Forsythe’s Test for Homogeneity of Science
Score Variance ANOVA of Absolute Deviations from group Medians the MSE was 80.47.
Bartlett’s Test for Homogeneity of Science Score Variance had a Chi-Square of 4.81.
Table 23: Tenth Grade Science
Proficiency Level Number of Participants Mean Standard Deviation
Beginning 11 27.82 9.54
Intermediate 99 38.95 13.21
Advanced 177 41.10 14.06
Fluent 512 50.69 14.77
The basic information for tenth grade Science can be found in Table 20 above. These
means represent the LSMs for the different proficiency groups. The difference in LSM between

84
Beginning and Intermediate is -11.13 with a standard error of 3.17 and a t-value of -3.51. For the
Beginning to Advanced group, the estimate is -13.28 with a standard error of 3.06 and a t-value
of -4.33. From the Beginning to the Fluent group, the estimate is -22.88 with a standard error of
2.95 and a t-value of -7.76. From the Intermediate to Advanced group, the estimate is -2.15 with
a standard error of 1.70 and a t-value of -1.27. From the Intermediate to the Fluent group, the
estimate is -11.74 with a standard error of 1.48 and a t-value of -7.94. The final group considered
was the Advanced to the Fluent group, with an estimate of -9.60 and a standard error of 1.24 and
a t-value of -7.73.
Eleventh grade Science. There were 2,508 KELPA tests administered, and of those
2,084 had a Science score counterpart. In checking the normality of residuals, the MSE of the
group was 164.03, with an R-Square of 0.16. A one-way ANOVA was conducted to compare the
effect of the Science content assessment score on the KELPA proficiency group. An analysis of
variance showed that the effect of the Science content assessment score on the KELPA
proficiency category was significant, F (3, 2080) = 131.85, p = .0001. The ANOVA had a MSE
of 163.83, and an R-Square of 0.16. There was a coefficient variance of 32.30 and Root MSE of
12.80. The mean for Science was 39.63. Using Brown and Forsythe’s Test for Homogeneity of
Science Score Variance ANOVA of Absolute Deviations from group Medians the MSE was
62.32. Bartlett’s Test for Homogeneity of Science Score Variance had a Chi-Square of 81.30.
Table 24: Eleventh Grade Science
Proficiency Level Number of Participants Mean Standard Deviation
Beginning 88 29.76 9.61
Intermediate 566 32.73 10.83
Advanced 570 39.23 11.93
Fluent 860 45.45 14.69

85
The basic information for eleventh grade Science can be found in Table 20 above. These
means represent the LSMs for the different proficiency groups. The difference in LSM between
Beginning and Intermediate is -2.97 with a standard error of 1.12 and a t-value of -2.65. For the
Beginning to Advanced group, the estimate is -9.47 with a standard error of 1.14 and a t-value of
-8.31. From the Beginning to the Fluent group, the estimate is -15.69 with a standard error of
1.14 and a t-value of -13.76. From the Intermediate to Advanced group, the estimate is -6.50
with a standard error of 0.68 and a t-value of -9.61. From the Intermediate to the Fluent group,
the estimate is -12.73 with a standard error of 0.68 and a t-value of -18.80. The final group
considered was the Advanced to the Fluent group, with an estimate of -6.23 and a standard error
of 0.71 and a t-value of -8.80.
Summary of Science Content Area. Language proficiency category was found to be
significant at all grade levels in Science (Pr > F <.0001). In all but fourth and ninth grade, the
language proficiency levels were an indicator of overall performance with the beginning students
doing the worst up to the Fluent students doing the best. In all but ninth grade, the standard
deviations were highest for the Beginning students and got progressively lower until the Fluent
level. The largest Estimate value was the category of Beginning to Fluent in all but ninth grade.
The next largest Estimate values were Intermediate to Fluent (three times) and then Beginning to
Advanced (one time). The lowest Estimates were in Beginning to Intermediate (four times) and
Intermediate to Advanced (one time). This data supports the original hypothesis that larger
differences would be present in the high-to-low combinations (Beginning to Advance, Beginning
to Fluent, and Intermediate to Fluent) and the smaller differences would be the categories next to
each other (Beginning to Intermediate, Intermediate to Advanced, and Advanced to Fluent).

86
Research Question 2: What are the relative effects of proficiency level on assessment
scores across grade levels? The initial hypothesis was that as the cognitive demands on
the content assessment increase, meaning that as grade level increases, the number of low
language proficiency students not meeting state standards will become more pronounced.
If the null hypothesis were used in this situation, it could be assumed that no difference
would be perceptible based solely on proficiency level. This question was answered using
proportions that showed how students performed on each content assessment based on
grade level and to find out whether there were differences in the proportions of students
who did or did not meet/exceed standards across grade levels for each content area
separately. All the tables represent the students that meet standards and do not meet
standards with the number of each group shown on the column in the appropriate area.
Math Content Area
Looking first at Math, the following tables show how each different proficiency
performed on their Math content assessment based on their grade level. Table 25 shows how the
Beginning level performed on the Math assessment. Other than ninth grade (which only had two
participants), more than half of the students do not meet standards. As illustrated by Table 2,
there is a steady increase of students not meeting standards as the grade levels go up. In third
grade, 61% are not meeting standards; by fourth grade it is 63%. In fifth grade, it is 72%, then
77% in sixth grade, 80% in seventh grade, and 85% in eighth grade. Ninth grade has only two
participants at this level and is being presented for the sake of transparency of data analysis with
50% not meeting standards. Tenth and eleventh grade both have about 96% not meeting
standards at this level.

87
Table 25: Meeting/Not Meeting Standards All Grades Math Beginning Level
Table 26 shows how the Intermediate proficiency students did on the Math assessment
based on their grade. At this level, third, fourth, and fifth grade all have over half their students
meeting standards. After that, there is a steady increase in the number of students not meeting
standards as can be seen in Table 3. In third grade, 38% are not meeting standards by fourth
grade it is 42%. In fifth grade, it is 47%, then 53% in sixth grade, 65% in seventh grade, and
70% in eighth grade. Ninth grade has only twelve participants at this level and is being presented
for the sake of transparency of data analysis with 92% not meeting standards in this instance.
Tenth grade has 85% and eleventh grade has 83% not meeting standards at this level.
Table 26: Meeting/Not Meeting Standards All Grades Math Intermediate Level
144 177 112 99 84 91
1
26 86
92 102 43 30 21 16
1
1 4
0%
20%
40%
60%
80%
100%
Grade 3 Grade 4 Grade 5 Grade 6 Grade 7 Grade 8 Grade 9 Grade 10 Grade 11
MATH BEGINNING LEVEL
Not Meeting Standard Meeting Standard
422 476 297 505446 292
11 143 477
686 648 338 455244 126
1 25 100
0%
20%
40%
60%
80%
100%
Grade 3 Grade 4 Grade 5 Grade 6 Grade 7 Grade 8 Grade 9 Grade 10 Grade 11
MATH INTERMEDIATE LEVEL
Not Meeting Standard Meeting Standard
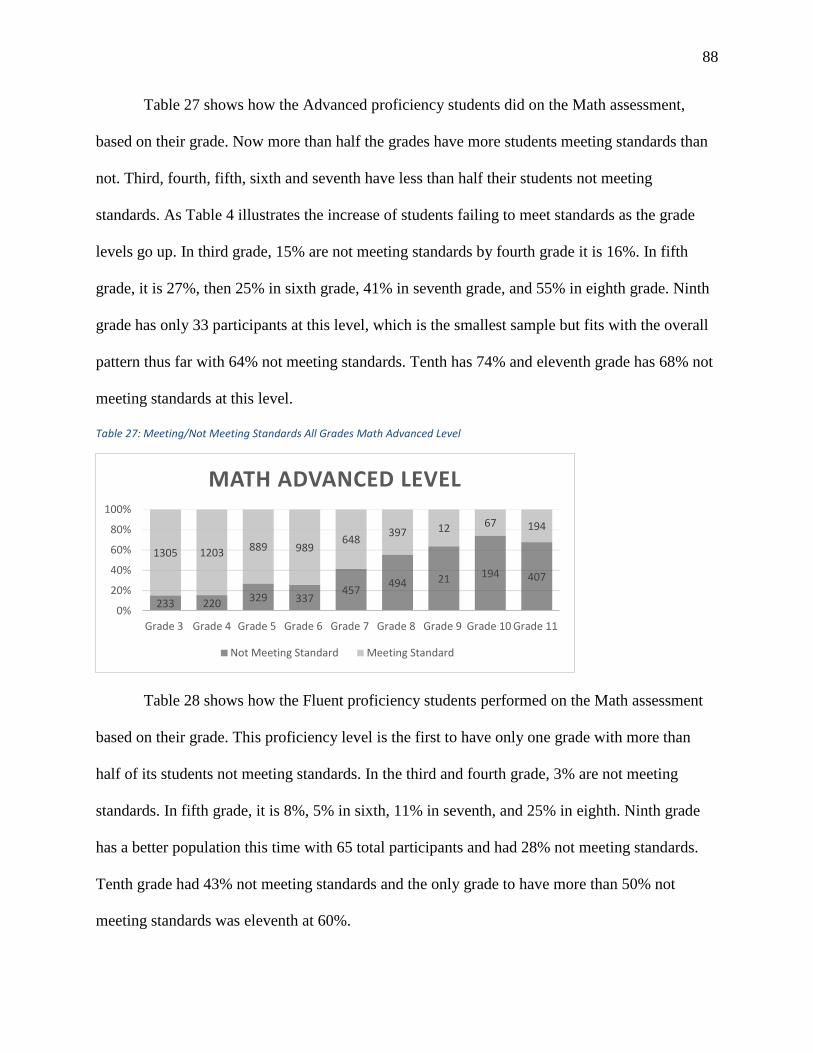
88
Table 27 shows how the Advanced proficiency students did on the Math assessment,
based on their grade. Now more than half the grades have more students meeting standards than
not. Third, fourth, fifth, sixth and seventh have less than half their students not meeting
standards. As Table 4 illustrates the increase of students failing to meet standards as the grade
levels go up. In third grade, 15% are not meeting standards by fourth grade it is 16%. In fifth
grade, it is 27%, then 25% in sixth grade, 41% in seventh grade, and 55% in eighth grade. Ninth
grade has only 33 participants at this level, which is the smallest sample but fits with the overall
pattern thus far with 64% not meeting standards. Tenth has 74% and eleventh grade has 68% not
meeting standards at this level.
Table 27: Meeting/Not Meeting Standards All Grades Math Advanced Level
Table 28 shows how the Fluent proficiency students performed on the Math assessment
based on their grade. This proficiency level is the first to have only one grade with more than
half of its students not meeting standards. In the third and fourth grade, 3% are not meeting
standards. In fifth grade, it is 8%, 5% in sixth, 11% in seventh, and 25% in eighth. Ninth grade
has a better population this time with 65 total participants and had 28% not meeting standards.
Tenth grade had 43% not meeting standards and the only grade to have more than 50% not
meeting standards was eleventh at 60%.
233 220 329 337457
494 21 194 407
1305 1203 889 989648
397 12 67 194
0%
20%
40%
60%
80%
100%
Grade 3 Grade 4 Grade 5 Grade 6 Grade 7 Grade 8 Grade 9 Grade 10 Grade 11
MATH ADVANCED LEVEL
Not Meeting Standard Meeting Standard
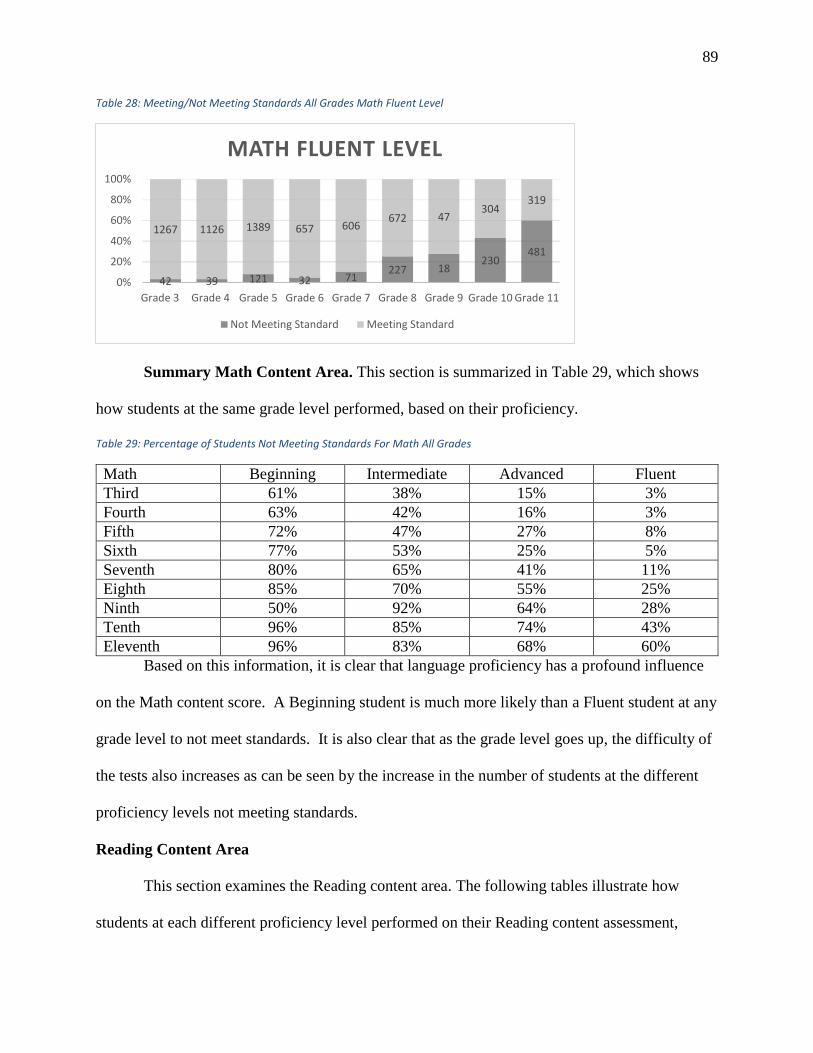
89
Table 28: Meeting/Not Meeting Standards All Grades Math Fluent Level
Summary Math Content Area. This section is summarized in Table 29, which shows
how students at the same grade level performed, based on their proficiency.
Table 29: Percentage of Students Not Meeting Standards For Math All Grades
Math Beginning Intermediate Advanced Fluent
Third 61% 38% 15% 3%
Fourth
63% 42% 16% 3%
Fifth
72% 47% 27% 8%
Sixth 77% 53% 25% 5%
Seventh 80% 65% 41% 11%
Eighth 85% 70% 55% 25%
Ninth 50% 92% 64% 28%
Tenth 96% 85% 74% 43%
Eleventh 96% 83% 68% 60%
Based on this information, it is clear that language proficiency has a profound influence
on the Math content score. A Beginning student is much more likely than a Fluent student at any
grade level to not meet standards. It is also clear that as the grade level goes up, the difficulty of
the tests also increases as can be seen by the increase in the number of students at the different
proficiency levels not meeting standards.
Reading Content Area
This section examines the Reading content area. The following tables illustrate how
students at each different proficiency level performed on their Reading content assessment,
42 39 121 32 71227 18
230481
1267 1126 1389 657 606672 47
304319
0%
20%
40%
60%
80%
100%
Grade 3 Grade 4 Grade 5 Grade 6 Grade 7 Grade 8 Grade 9 Grade 10 Grade 11
MATH FLUENT LEVEL
Not Meeting Standard Meeting Standard

90
based on their grade level. Table 30 illustrates how the Beginning proficiency students did on the
Reading assessment based on their grade. This proficiency level has low numbers overall with no
students in ninth grade and only ten in tenth grade. All grades have over half their students not
meeting standards. In third grade, 67% are not meeting standards, 71% in fourth grade, 80% in
fifth grade, 76% in sixth grade, 73% in seventh grade, and 83% in eighth grade. There were no
students in ninth grade at this level, and only ten in tenth grade, of which 100% did not meet
standards. In eleventh grade, 97% did not meet standards.
Table 30: Meeting/Not Meeting Standards All Grades Reading Beginning Level
Table 31 shows how the Intermediate proficiency students did on the Reading assessment
based on their grade. At this level, ninth grade had only two students but all the other levels had
adequate levels. In third grade, 35% of the students did not meet standards, in fourth, 57%, in
fifth, 70%, in sixth, 61%, in seventh, 63%, and in eighth, 76%. In ninth, there were only two
students so the data is not useable, plus 100% did not meet standards. In tenth grade, 81% did not
meet standards, and in eleventh, 94% did not meet standards.
126 167 88 70 47 58
0
10 66
62 67 22 22 17 12
0
0 2
0%
20%
40%
60%
80%
100%
Grade 3 Grade 4 Grade 5 Grade 6 Grade 7 Grade 8 Grade 9 Grade 10 Grade 11
BEGINNING READING LEVEL
Not Meeting Standard Meeting Standard
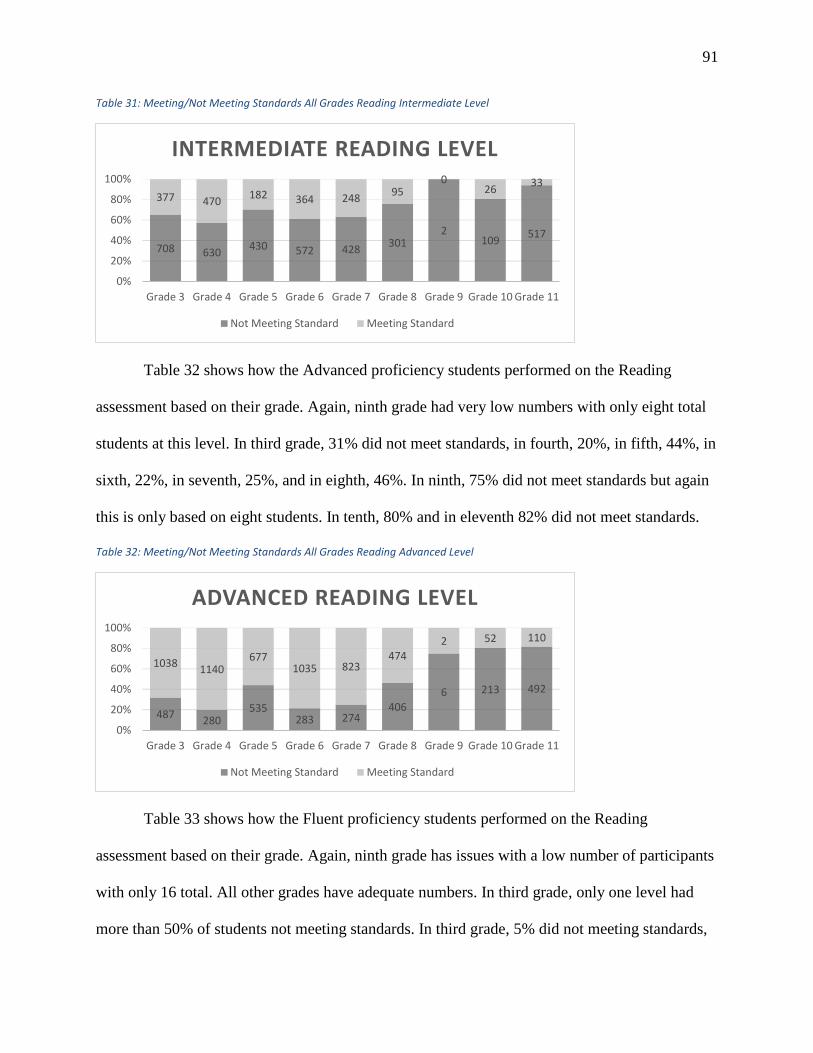
91
Table 31: Meeting/Not Meeting Standards All Grades Reading Intermediate Level
Table 32 shows how the Advanced proficiency students performed on the Reading
assessment based on their grade. Again, ninth grade had very low numbers with only eight total
students at this level. In third grade, 31% did not meet standards, in fourth, 20%, in fifth, 44%, in
sixth, 22%, in seventh, 25%, and in eighth, 46%. In ninth, 75% did not meet standards but again
this is only based on eight students. In tenth, 80% and in eleventh 82% did not meet standards.
Table 32: Meeting/Not Meeting Standards All Grades Reading Advanced Level
Table 33 shows how the Fluent proficiency students performed on the Reading
assessment based on their grade. Again, ninth grade has issues with a low number of participants
with only 16 total. All other grades have adequate numbers. In third grade, only one level had
more than 50% of students not meeting standards. In third grade, 5% did not meeting standards,
708 630430 572 428
3012
109517
377 470182 364 248
950
2633
0%
20%
40%
60%
80%
100%
Grade 3 Grade 4 Grade 5 Grade 6 Grade 7 Grade 8 Grade 9 Grade 10 Grade 11
INTERMEDIATE READING LEVEL
Not Meeting Standard Meeting Standard
487280
535283 274
4066 213 492
10381140
6771035 823
4742 52 110
0%
20%
40%
60%
80%
100%
Grade 3 Grade 4 Grade 5 Grade 6 Grade 7 Grade 8 Grade 9 Grade 10 Grade 11
ADVANCED READING LEVEL
Not Meeting Standard Meeting Standard

92
fourth, 3%, fifth, 9%, sixth, 2%, seventh, 3%, and eighth, is 12%. Ninth as previously mentioned
has too low of participation to judge but has 23% not meeting standards. In tenth grade, 38% and
in eleventh grade, 58% did not meet standards.
Table 33: Meeting/Not Meeting Standards All Grades Reading Fluent Level
Summary Reading Content Area. This section is summarized in Table 34 which shows
how students at the same grade level did based on their proficiency.
Table 34: Percentage of Students Not Meeting Standards For Reading All Grades
Reading Beginning Intermediate Advanced Fluent
Third 67% 35% 32% 5%
Fourth
71% 57% 20% 3%
Fifth
80% 70% 44% 9%
Sixth 76% 61% 22% 2%
Seventh 73% 63% 25% 3%
Eighth 83% 76% 46% 12%
Ninth 0% 100% 75% 23%
Tenth 100% 81% 80% 38%
Eleventh 97% 94% 82% 58%
Based on this information, it seems clear that language proficiency has some influence on
the Reading content score.
Science Content Area
67 35 141 13 21 104 3213
521
1238 1126 1363 673 657 792 13351
380
0%
20%
40%
60%
80%
100%
Grade 3 Grade 4 Grade 5 Grade 6 Grade 7 Grade 8 Grade 9 Grade 10 Grade 11
FLUENT READING LEVEL
Not Meeting Standard Meeting Standard

93
This last section looks at the Science content area. The following tables show how each
different proficiency group performed on their Science content assessment for their fourth grade
and seventh grade tests. The data from high school cannot be analyzed because the data for
meeting standards was not included in the data set received. This is due to the Opportunity To
Learn (OTL) program that exists at the high school level for the area of Science, and how the
data is reported back to the testing agency. The analysis was done using just the fourth and
seventh grade, where the data for meeting or not meeting standards was provided.
Table 35 shows how the students did on the Science assessment based on their grade. For
fourth grade, 66% of the Beginning level did not meet standards, 37% at the Intermediate level,
13% at the Advanced level, and 2% at the Fluent level. A pattern of increasing performance as
the proficiency level of the participants goes up is clear and shows that there is a relationship
between the two variables.
Table 35: Meeting/Not Meeting Standards Science Grade Four
Table 36 shows how the students did on the Science assessment based on their grade. For
the seventh grade, 86% of Beginning participants did not meet standards, 74% of Intermediate
level, 45% of Advanced level, and 15% of Fluent level. A pattern of increasing performance as
185411
181 26
96710
1241 1140
0%
20%
40%
60%
80%
100%
Beginning Intermediate Advanced Fluent
SCIENCE GRADE 4
Not Meeting Standard Meeting Standard

94
the proficiency level of the participants goes up is clear and shows that there is a relationship
between the two variables.
Table 36: Meeting/Not Meeting Standards Science Grade Seven
Summary of Science Content Area. The Science content area posed a major issue for
this analysis. The lack of data on how the students performed according to standards for most of
the grades made for only two levels that could be analyzed. In those two levels, there is a pattern
of the number of students not meeting standards going down as the proficiency level goes up. As
the grade went up, the number of students who met standards went down (at the Beginning level
from 34% meeting standards in fourth grade to 14% for Beginning level students in seventh
grade).
Research Question 3: To what extent does the KELPA predict students’ scores on
content assessments in Math, Reading, and Science? The initial hypothesis, the null
hypothesis, stated that the scores on the KELPA are not a predictor of content area scores
in Math, Reading, and Science. A bivariate linear regression analysis was done to predict
scores based on equated percent correct content assessment scores. Student level data was
analyzed by grade level for each content area separately. The dependent variable for the
89514
502
99
14181
606
580
0%
20%
40%
60%
80%
100%
Beginning Intermediate Advanced Fluent
SCIENCE GRADE 7
Not Meeting Standard Meeting Standard

95
set of analyses was the content assessment score and the independent variable was the
students’ English language total score as determined by the KELPA.
Like the previously discussed ANOVA, the data included a lot of variance, but this time
it could not be controlled for as it was with the ANOVA. Due to the high sample sizes in the
study, an assumption of normalcy was made using the Central Limit Theorem, the idea that the
sampling distributions of means became more normal due to sample sizes. The high variance
contributed to an inflated MSE measurement. The results will be divided by content area and
grade level, and will be reported in the same manner as the ANOVA results. The number of
participants for each grade remained the same as previously reported.
Content Area Math
Math students were given tests every year from third grade until eleventh grade. They
were also given the KELPA each of those years. In order to analyze the data, each grade will be
evaluated individually since the tests were not equated. This section includes all the grades that
took Math, with a description of students’ performance based on a linear regression.
Third grade Math. A simple linear regression was calculated to predict the content
assessment scores based on the language proficiency. A significant regression equation found (F
(1, 4189) = 2208.47, p < .0001) with an R-Square of 0.35. The Root MSE was 12.03, with a
dependent mean of 79.89, and a Coefficient variance of 15.05. The Parameter Estimates for the
Intercept were a DF of 1, an estimate of 28.40, Standard Error of 1.11, a t Value of 25.55, and a
Pr > |t| of <.0001. For the proficiency category, there was a DF of 1, an Estimate of 0.69,
Standard Error of 0.02, a t Value of 46.99, and a Pr > |t| of <.0001.
Fourth grade Math. A simple linear regression was calculated to predict the content
assessment scores based on the language proficiency. A significant regression equation found (F
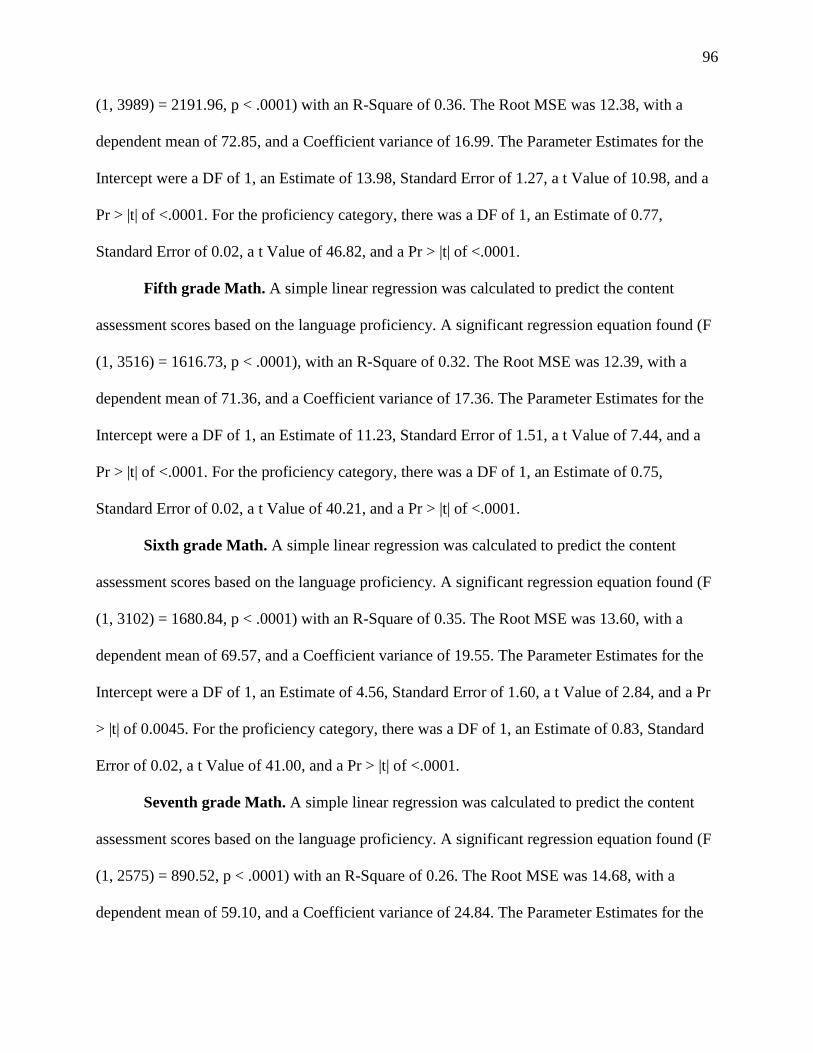
96
(1, 3989) = 2191.96, p < .0001) with an R-Square of 0.36. The Root MSE was 12.38, with a
dependent mean of 72.85, and a Coefficient variance of 16.99. The Parameter Estimates for the
Intercept were a DF of 1, an Estimate of 13.98, Standard Error of 1.27, a t Value of 10.98, and a
Pr > |t| of <.0001. For the proficiency category, there was a DF of 1, an Estimate of 0.77,
Standard Error of 0.02, a t Value of 46.82, and a Pr > |t| of <.0001.
Fifth grade Math. A simple linear regression was calculated to predict the content
assessment scores based on the language proficiency. A significant regression equation found (F
(1, 3516) = 1616.73, p < .0001), with an R-Square of 0.32. The Root MSE was 12.39, with a
dependent mean of 71.36, and a Coefficient variance of 17.36. The Parameter Estimates for the
Intercept were a DF of 1, an Estimate of 11.23, Standard Error of 1.51, a t Value of 7.44, and a
Pr > |t| of <.0001. For the proficiency category, there was a DF of 1, an Estimate of 0.75,
Standard Error of 0.02, a t Value of 40.21, and a Pr > |t| of <.0001.
Sixth grade Math. A simple linear regression was calculated to predict the content
assessment scores based on the language proficiency. A significant regression equation found (F
(1, 3102) = 1680.84, p < .0001) with an R-Square of 0.35. The Root MSE was 13.60, with a
dependent mean of 69.57, and a Coefficient variance of 19.55. The Parameter Estimates for the
Intercept were a DF of 1, an Estimate of 4.56, Standard Error of 1.60, a t Value of 2.84, and a Pr
> |t| of 0.0045. For the proficiency category, there was a DF of 1, an Estimate of 0.83, Standard
Error of 0.02, a t Value of 41.00, and a Pr > |t| of <.0001.
Seventh grade Math. A simple linear regression was calculated to predict the content
assessment scores based on the language proficiency. A significant regression equation found (F
(1, 2575) = 890.52, p < .0001) with an R-Square of 0.26. The Root MSE was 14.68, with a
dependent mean of 59.10, and a Coefficient variance of 24.84. The Parameter Estimates for the
97
Intercept were a DF of 1, an Estimate of 2.08, Standard Error of 1.93, a t Value of 1.08, and a Pr
> |t| of 0.2809. For the proficiency category, there was a DF of 1, an Estimate of 0.72, Standard
Error of 0.02, a t Value of 29.84, and a Pr > |t| of <.0001.
Eighth grade Math. A simple linear regression was calculated to predict the content
assessment scores based on the language proficiency. A significant regression equation found (F
(1, 2313) = 672.25, p < .0001) with an R-Square of 0.23. The Root MSE was 15.79, with a
dependent mean of 58.27, and a Coefficient variance of 27.11. The Parameter Estimates for the
Intercept were a DF of 1, an Estimate of 1.32, Standard Error of 2.22, a t Value of 0.60, and a Pr
> |t| of 0.55. For the proficiency category, there was a DF of 1, an Estimate of 0.70, Standard
Error of 0.03, a t Value of 25.93, and a Pr > |t| of <.0001.
Ninth grade Math. A simple linear regression was calculated to predict the content
assessment scores based on the language proficiency. A significant regression equation found (F
(1, 110) = 33.51, p < .0001) with an R-Square of 0.23. The Root MSE was 17.18, with a
dependent mean of 55.80, and a Coefficient variance of 30.78. The Parameter Estimates for the
Intercept were a DF of 1, an Estimate of -23.92, Standard Error of 13.87, a t Value of -1.73, and
a Pr > |t| of 0.0873. For the proficiency category, there was a DF of 1, an Estimate of 0.95,
Standard Error of 0.16, a t Value of 5.79, and a Pr > |t| of <.0001.
Tenth grade Math. A simple linear regression was calculated to predict the content
assessment scores based on the language proficiency. A significant regression equation found (F
(1, 988) = 293.70, p < .0001) with an R-Square of 0.23. The Root MSE was 15.40, with a
dependent mean of 46.96, and a Coefficient variance of 32.79. The Parameter Estimates for the
Intercept were a DF of 1, an Estimate of -10.10, Standard Error of 3.37, a t Value of -3.00, and a

98
Pr > |t| of 0.0028. For the proficiency category, there was a DF of 1, an Estimate of 0.69,
Standard Error of 0.04, a t Value of 17.14, and a Pr > |t| of <.0001.
Eleventh grade Math. A simple linear regression was calculated to predict the content
assessment scores based on the language proficiency. A significant regression equation found (F
(1, 2066) = 263.29, p < .0001) with an R-Square of 0.11. The Root MSE was 14.57, with a
dependent mean of 42.32, and a Coefficient variance of 34.42. The Parameter Estimates for the
Intercept were a DF of 1, an Estimate of 11.61, Standard Error of 1.92, a t Value of 6.05, and a
Pr > |t| of <.0001. For the proficiency category, there was a DF of 1, an Estimate of 0.39,
Standard Error of 0.02, a t Value of 16.23, and a Pr > |t| of <.0001.
Summary of Math Content Area. At all grade levels p<.0001 and was found to be
significant. This means that the null hypothesis has been rejected and the proficiency level does
play a role in the Math content score. The R-Square for these grades was not always the same, so
differing amounts of the score are attributed to the fitness of this model. In third grade, the R-
Square was 0.35, in fourth, 0.36, in fifth, 0.32, in sixth, 0.35, in seventh, 0.26, in eighth, 0.23, in
ninth, 0.23, in tenth, 0.23, and finally in eleventh, 0.11. This means that the model fit the best in
the lower grades and became weaker in the higher grades.
Content Area Reading
Reading students were given tests every year from third grade until eleventh grade. They
were also given the KELPA each of those years. In order to analyze the data, each grade was
evaluated individually since the tests were not equated. This section has all the grades that took
Reading, with a description of students’ performance based on a linear regression.
Third grade Reading. A simple linear regression was calculated to predict the content
assessment scores based on the language proficiency. A significant regression equation found (F
99
(1, 4101) = 3135.00, p < .0001) with an R-Square of 0.43. The Root MSE was 11.10, with a
dependent mean of 71.19, and a Coefficient variance of 15.59. The Parameter Estimates for the
Intercept were a DF of 1, an Estimate of 10.47, Standard Error of 1.10, a t Value of 9.53, and a
Pr > |t| of <.0001. For the proficiency category, there was a DF of 1, an Estimate of 0.81,
Standard Error of 0.02, a t Value of 55.99, and a Pr > |t| of <.0001.
Fourth grade Reading. A simple linear regression was calculated to predict the content
assessment scores based on the language proficiency. A significant regression equation found (F
(1, 3913) = 3679.62, p < .0001) with an R-Square of 0.49. The Root MSE was 10.29, with a
dependent mean of 73.21, and a Coefficient variance of 14.06. The Parameter Estimates for the
Intercept were a DF of 1, an Estimate of 4.80, Standard Error of 1.14, a t Value of 4.21, and a Pr
> |t| of <.0001. For the proficiency category, there was a DF of 1, an Estimate of 0.89, Standard
Error of 0.02, a t Value of 60.66, and a Pr > |t| of <.0001.
Fifth grade Reading. A simple linear regression was calculated to predict the content
assessment scores based on the language proficiency. A significant regression equation found (F
(1, 3436) = 2993.56, p < .0001) with an R-Square of 0.47. The Root MSE was 11.03, with a
dependent mean of 70.56, and a Coefficient variance of 15.62. The Parameter Estimates for the
Intercept were a DF of 1, an Estimate of -10.62, Standard Error of 1.50, a t Value of -7.10, and a
Pr > |t| of <.0001. For the proficiency category, there was a DF of 1, an Estimate of 1.00,
Standard Error of 0.02, a t Value of 54.71, and a Pr > |t| of <.0001.
Sixth grade Reading. A simple linear regression was calculated to predict the content
assessment scores based on the language proficiency. A significant regression equation found (F
(1, 3030) = 3012.31, p < .0001) with an R-Square of 0.50. The Root MSE was 11.39, with a
dependent mean of 68.64, and a Coefficient variance of 16.59. The Parameter Estimates for the
100
Intercept were a DF of 1, an Estimate of -11.12, Standard Error of 1.48, a t Value of -7.58, and a
Pr > |t| of <.0001. For the proficiency category, there was a DF of 1, an Estimate of 1.01,
Standard Error of 0.02, a t Value of 54.88, and a Pr > |t| of <.0001.
Seventh grade Reading. A simple linear regression was calculated to predict the content
assessment scores based on the language proficiency. A significant regression equation found (F
(1, 2513) = 2682.01, p < .0001) with an R-Square of 0.52. The Root MSE was 10.81, with a
dependent mean of 67.95, and a Coefficient variance of 15.90. The Parameter Estimates for the
Intercept were a DF of 1, an Estimate of -14.48, Standard Error of 1.61, a t Value of -9.02, and a
Pr > |t| of <.0001. For the proficiency category, there was a DF of 1, an Estimate of 1.03,
Standard Error of 0.02, a t Value of 51.79, and a Pr > |t| of <.0001.
Eight grade Reading. A simple linear regression was calculated to predict the content
assessment scores based on the language proficiency. A significant regression equation found (F
(1, 2240) = 1898.72, p < .0001) with an R-Square of 0.56. The Root MSE was 12.44, with a
dependent mean of 65.53, and a Coefficient variance of 18.98. The Parameter Estimates for the
Intercept were a DF of 1, an Estimate of -20.96, Standard Error of 2.00, a t Value of -10.47, and
a Pr > |t| of <.0001. For the proficiency category, there was a DF of 1, an Estimate of 1.05,
Standard Error of 0.02, a t Value of 43.57, and a Pr > |t| of <.0001.
Ninth grade Reading. A simple linear regression was calculated to predict the content
assessment scores based on the language proficiency. A significant regression equation found (F
(1, 24) = 13.76, p 0.0011) with an R-Square of 0.36. The Root MSE was 16.56, with a dependent
mean of 62.19, and a Coefficient variance of 26.63. The Parameter Estimates for the Intercept
were a DF of 1, an Estimate of -77.11, Standard Error of 37.69, a t Value of -2.05, and a Pr > |t|
101
of 0.0519. For the proficiency category, there was a DF of 1, an Estimate of 1.60, Standard Error
of 0.43, a t Value of 3.71, and a Pr > |t| of 0.0011.
Tenth grade Reading. A simple linear regression was calculated to predict the content
assessment scores based on the language proficiency. A significant regression equation found (F
(1, 972) = 592.81, p <.0001) with an R-Square of 0.38. The Root MSE was 13.62, with a
dependent mean of 61.75, and a Coefficient variance of 22.06. The Parameter Estimates for the
Intercept were a DF of 1, an Estimate of -30.43, Standard Error of 3.81, a t Value of -7.98, and a
Pr > |t| of <.0001. For the proficiency category, there was a DF of 1, an Estimate of 1.09,
Standard Error of 0.05, a t Value of 24.35, and a Pr > |t| of <.0001.
Eleventh grade Reading. A simple linear regression was calculated to predict the
content assessment scores based on the language proficiency. A significant regression equation
found (F (1, 2119) = 1355.10, p <.0001) with an R-Square of 0.39. The Root MSE was 12.88,
with a dependent mean of 54.83, and a Coefficient variance of 23.48. The Parameter Estimates
for the Intercept were a DF of 1, an Estimate of -10.24, Standard Error of 1.79, a t Value of -
5.72, and a Pr > |t| of <.0001. For the proficiency category, there was a DF of 1, an Estimate of
0.82, Standard Error of 0.02, a t Value of 26.81, and a Pr > |t| of <.0001.
Summary of Reading Content Area. At all grade levels p<.0001, which was found to
be significant. This means that the null hypothesis has been rejected and the proficiency level
does play a role in the Reading content score. The R-Square for these grades was not always the
same, so differing amounts of the score are attributed to the fitness of this model. In third grade,
the R-Square was 0.43, in fourth, 0.49, in fifth, 0.47, in sixth, 0.50, in seventh, 0.52, in eighth,
0.56, in ninth, 0.36, in tenth, 0.38, and finally in eleventh, 0.39. This means that the model fit the
best in the lower grades and became weaker in the higher grades.

102
Content Area Science
Science students were given tests in fourth, seventh, and twice in grades nine through
eleven. They were also given the KELPA each of those years. In order to analyze the data, each
grade was evaluated individually since the tests were not equated. This section has all the grades
that took Science with a description of students’ performance based on a linear regression.
Fourth grade Science. A simple linear regression was calculated to predict the content
assessment scores based on the language proficiency. A significant regression equation found (F
(1, 3989) = 1798.11, p < .0001) with an R-Square of 0.31. The Root MSE was 12.88, with a
dependent mean of 63.92, and a Coefficient variance of 20.15. The Parameter Estimates for the
Intercept were a DF of 1, an estimate of 8.79, Standard Error of 1.32, a t Value of 6.67, and a Pr
> |t| of <.0001. For the proficiency category, there was a DF of 1, an Estimate of 0.72, Standard
Error of 0.02, a t Value of 42.40, and a Pr > |t| of <.0001.
Seventh grade Science. A simple linear regression was calculated to predict the content
assessment scores based on the language proficiency. A significant regression equation found (F
(1, 2584) = 1006.77, p < .0001) with an R-Square of 0.28. The Root MSE was 12.47, with a
dependent mean of 48.43, and a Coefficient variance of 25.76. The Parameter Estimates for the
Intercept were a DF of 1, an estimate of -3.00, Standard Error of 1.64, a t Value of -1.83, and a
Pr > |t| of 0.0672. For the proficiency category, there was a DF of 1, an Estimate of 0.65,
Standard Error of 0.02, a t Value of 31.73, and a Pr > |t| of <.0001.
Ninth grade Science. A simple linear regression was calculated to predict the content
assessment scores based on the language proficiency. A significant regression equation found (F
(1, 575) = 80.47, p < .0001) with an R-Square of 0.12. The Root MSE was 16.05, with a
dependent mean of 46.42, and a Coefficient variance of 34.58. The Parameter Estimates for the

103
Intercept were a DF of 1, an estimate of -5.73, Standard Error of 5.85, a t Value of -0.98, and a
Pr > |t| of 0.33. For the proficiency category, there was a DF of 1, an Estimate of 0.62, Standard
Error of 0.07, a t Value of 8.97, and a Pr > |t| of <.0001.
Tenth grade Science. A simple linear regression was calculated to predict the content
assessment scores based on the language proficiency. A significant regression equation found (F
(1, 797) = 129.80, p < .0001) with an R-Square of 0.14. The Root MSE was 14.24, with a
dependent mean of 46.80, and a Coefficient variance of 30.42. The Parameter Estimates for the
Intercept were a DF of 1, an estimate of 0.67, Standard Error of 4.08, a t Value of 0.16, and a Pr
> |t| of 0.87. For the proficiency category, there was a DF of 1, an Estimate of 0.54, Standard
Error of 0.05, a t Value of 11.39, and a Pr > |t| of <.0001.
Eleventh grade Science. A simple linear regression was calculated to predict the content
assessment scores based on the language proficiency. A significant regression equation found (F
(1, 2082) = 382.02, p < .0001) with an R-Square of 0.16. The Root MSE was 12.83, with a
dependent mean of 39.63, and a Coefficient variance of 32.37. The Parameter Estimates for the
Intercept were a DF of 1, an estimate of 7.33, Standard Error of 1.68, a t Value of 4.37, and a Pr
> |t| of <.0001. For the proficiency category, there was a DF of 1, an Estimate of 0.41, Standard
Error of 0.02, a t Value of 19.55, and a Pr > |t| of <.0001.
Summary of Science Content Area. At all grade levels p<.0001, which was found to be
significant. This means that the null hypothesis has been rejected and the proficiency level does
play a role in the Science content score. The R-Square for these grades was not always the same,
so differing amounts of the score are attributed to the fitness of this model. In fourth grade the R-
Square was 0.31, in seventh, 0.28, in ninth, 0.12, in tenth, 0.14, and finally in eleventh, 0.16.

104
This means that the model fit the best in the lower grades and became weaker in the higher
grades.
General Discussion of all Areas
For all the grades and content areas, the regression was significant Pr > F = <.0001. This
means that for all content areas, the null hypothesis was rejected and the English language
proficiency level does significantly influence content assessment score. The R-square values
were not even across grades, with the model fitting Reading the best. Math and Science saw
smaller R-square values. All content areas had smaller R-square values in the higher grades,
meaning the model explained the variance in the lower grades better.
Research Question 4: What role do other demographic variables (such as Free and
Reduced Lunch, Native Language, Gender, Length of Time in the U.S., or Exceptionality
Code) play in student achievement on content assessments for ELLs? The initial
hypothesis was that some variables reflect a positive relationship with student
achievement (Length of Time in the U.S.), no relationship with student achievement
(Gender and First Language), or a negative relationship with student achievement (Free
and Reduced Lunch and Exceptionality Code). The analysis for this question will be a set
of multiple linear regression analysis. The dependent variable is the content assessment
score and the independent variables are the students’ proficiency group and each of the
various demographic variables (Gender; Eligibility for National School Lunch Program;
Exceptionality Code; First Language; and Number of Years in the US).
Demographic Variables and Their Coding
Gender (reported as “Gender”) is the first demographic variable and was already coded
when the data was received. A female was coded as a “zero” and a Male as a “one”. Eligibility

105
for National School Lunch Program (reported as lunch) was originally coded as; Blank meaning
not eligible, “one” eligible for reduced price lunch, and “two” meaning eligible for free lunch.
The data was recoded for this study to group free and reduced together (Abedi, 2001), with a
“zero” for not eligible and a “one” for eligible for Free and Reduced Lunch as a combined
category. Exceptionality Code (reported as except) was the next demographic and was a bit more
complicated. The original data had a primary and secondary code system. Table 37 shows all the
different coding in the original data.
Table 37: Original Exceptionaility Coding
The only other category that was coded was Gifted, which was coded as a “GI”. For this
study being identified as having an Individualized Education plan (IEP) was the primary focus,
with all those without IEPs grouped into one “none” category. This means that Learning
Disabled, Gifted, and all the other coding options in Table 37, except “blank” for none, were
grouped together as those with IEPs. Those with IEPs were coded as “zero” while those with no
IEPs were coded as “one”. The next demographic variable was the First Language (reported as
“lang”) of the individual. Table 38 shows all the different coding in the original data.

106
Table 38: Original First Language Coding
These were recoded to combine all non-Spanish speakers together in an “other” category
and then Spanish speakers. The top language was Spanish which was coded as “zero”. All other
languages were added together and grouped as “other” which was coded as “one”. The reason
for doing this is the size of the Spanish speaking population in the data. Over eighty percent of
the population is Spanish speaking and doing any other combination would allow the size of the
population to influence the analysis even more. The final demographic variable that was
examined was the number of years (reported as “years”) the individual had been in the United
States. For this, the US entry date was subtracted from the generic date of April 30, 2010, which
was the last date they could take their tests that year, and an approximate number of years in the
United States were the result. The number was reported in whole years 0–18.
The other variable that is reported in this section is Total Proficiency Category (reported
as “totalcat”). This represents the proficiency category of Beginning, coded as “one”,
Intermediate, coded as “two”, Advanced, coded as “three”, or Fluent, coded as “four”. While this

107
has been looked at in previous questions as a dependent variable, it is now also considered a
demographic variable.
The Analysis
The first analysis was done with just one demographic variable, and a second analysis
was done to see if any two-way interaction of variables was significant. A Type III Sums of
Square was used to examine the demographic variables. All demographic variables were run
though the test (all individuals along with all pair options).
First, a look at the overall performance. Each instance when a demographic variable was
identified as being significant (Pr > F of 5% or less) in a Type III Sums of Square analysis, was
compiled. This was done for each content area (Math, Reading, and Science). All grades were
grouped by content area. The overall predictor quality was described using this information and
the totals of significance across all content areas. For this study high predictor quality was
anything identified 100–70% of the time, Medium was 69–30% of the time, Low was 29–1% of
the time, and none meant that there were no instances where that demographic information was
found to be significant. This system was created by the researcher as a way of explaining
predictor quality. It is important to note that Math and Reading have more grades tested so the
percentages will look different when compared to Science for the same number of instance. Math
and Reading both have nine grade levels, and Science has only five grade levels that were tested.
Table 39 shows the single demographic variables that were found to be significant, separated by
content area, and with a total overall percent as well. As the table shows, only one demographic
variable had a high percentage of predictability, and that was Total Proficiency Category, which
was significant 96% of the time. This variable was significant in all but Reading at the ninth
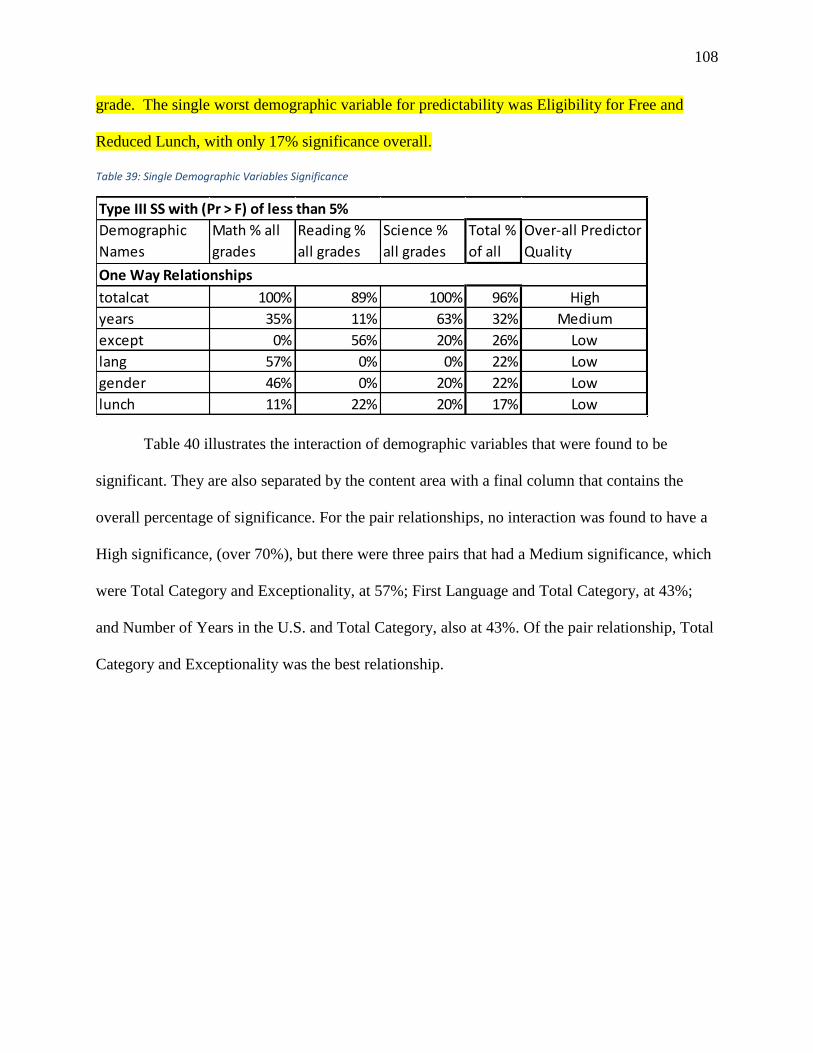
108
grade. The single worst demographic variable for predictability was Eligibility for Free and
Reduced Lunch, with only 17% significance overall.
Table 39: Single Demographic Variables Significance
Table 40 illustrates the interaction of demographic variables that were found to be
significant. They are also separated by the content area with a final column that contains the
overall percentage of significance. For the pair relationships, no interaction was found to have a
High significance, (over 70%), but there were three pairs that had a Medium significance, which
were Total Category and Exceptionality, at 57%; First Language and Total Category, at 43%;
and Number of Years in the U.S. and Total Category, also at 43%. Of the pair relationship, Total
Category and Exceptionality was the best relationship.
Demographic
Names
Math % all
grades
Reading %
all grades
Science %
all grades
Total %
of all
Over-all Predictor
Quality
totalcat 100% 89% 100% 96% High
years 35% 11% 63% 32% Medium
except 0% 56% 20% 26% Low
lang 57% 0% 0% 22% Low
gender 46% 0% 20% 22% Low
lunch 11% 22% 20% 17% Low
Type III SS with (Pr > F) of less than 5%
One Way Relationships

109
Table 40: Two-Way Demographic Variables Significance
The next section will show tables for each different demographic variable that shows all
three content areas and grades. The tables also include the Estimate, Pr > |t| value and the R-
Square for each grade if it was significant. The tables are presented in the order of how
significant they were found to be overall, the same order as the previous two tables, 39 and 40.
The final five interactions do not have a table because they are significant in very few instances.
They will be summarized after the last of the tables. Ninth grade is being included for the sake of
completeness and is being included in percentages; but it needs to be noted that ninth grade did
not represent even numbers of the proficiency levels and had population size issues. So while it
is being included for clarity it is not to be used for decision making.
Table 41 shows the Total Proficiency Category, which represents the language
proficiency of the test takers. This was significant 96% of the time. It was significant in all but
Type III SS with (Pr > F) of less than 5%
Demographic
Names
Math % all
grades
Reading %
all grades
Science %
all grades
Total %
of all
Over-all Predictor
Quality
Two Way Relationships
totalcat*except 33% 78% 60% 57% Medium
years*totalcat 47% 47% 46% 47% Medium
lang*totalcat 57% 24% 63% 45% Medium
lunch*lang 56% 0% 20% 26% Low
gender*except 24% 24% 23% 23% Low
years*except 0% 57% 0% 22% Low
lang*except 11% 24% 22% 19% Low
lunch*gender 13% 24% 20% 19% Low
years*lang 11% 12% 43% 19% Low
gender*totalcat 22% 11% 20% 17% Low
lang*gender 25% 0% 20% 14% Low
lunch*totalcat 24% 0% 20% 14% Low
years*lunch 0% 13% 40% 14% Low
years*gender 11% 13% 0% 9% Low
lunch*except 11% 11% 0% 9% Low

110
one grade in Reading (ninth). The table shows that this variable was very significant in
predicting the participants’ scores. Table 41 shows how English proficiency category influences
student scores. The table is broken down into grades, the different proficiency categories, and
the content areas (Math, Reading, and Science). For example, in the case of seventh grade, a
Beginning student would be about forty-two points lower than a Fluent student in Math, fifty-one
points lower in Reading, and forty points lower in Science. An Intermediate seventh grade
student would be about twenty points lower than a Fluent student in Math, twenty-nine points
lower in Reading, and twenty-eight points lower in Science. An Advanced seventh grade student
would be about nine points lower than a Fluent student in Math, fourteen points lower in
Reading, and sixteen points lower in Science.

111
Table 41: Demographic Variable: Total Language Proficiency Category
Table 42 shows the Number Years in the U.S., which was significant 30% of the time. It
was significant in three grades in Science (seventh, eighth, and eleventh), three grades in Math
Estimate Pr > |t| R-Square Estimate Pr > |t| R-Square Estimate Pr > |t| R-Square
Grade 3 Beginning -30.3889 <.0001 0.32 -42.6522 <.0001 0.43
Grade 3 Intermediate -13.4962 <.0001 0.32 -24.0753 <.0001 0.43
Grade 3 Advanced -4.3460 0.0192 0.32 -9.8146 <.0001 0.43
Grade 3 Fluent Control Control 0.32 Control Control 0.43
Grade 4 Beginning -38.1914 <.0001 0.35 -45.6657 <.0001 0.46 -40.2812 <.0001 0.34
Grade 4 Intermediate -13.8751 <.0001 0.35 -20.0877 <.0001 0.46 -18.6887 <.0001 0.34
Grade 4 Advanced -6.8194 0.0007 0.35 -7.6826 <.0001 0.46 -7.6939 0.0002 0.34
Grade 4 Fluent Control Control 0.35 Control Control 0.46 Control Control 0.34
Grade 5 Beginning -40.0363 <.0001 0.33 -49.0161 <.0001 0.45
Grade 5 Intermediate -12.7469 <.0001 0.33 -26.9467 <.0001 0.45
Grade 5 Advanced -5.4270 0.0070 0.33 -12.3863 <.0001 0.45
Grade 5 Fluent Control Control 0.33 Control Control 0.45
Grade 6 Beginning -41.3025 <.0001 0.35 -52.2994 <.0001 0.47
Grade 6 Intermediate -23.6822 <.0001 0.35 -29.6755 <.0001 0.47
Grade 6 Advanced -10.8578 <.0001 0.35 -10.9222 <.0001 0.47
Grade 6 Fluent Control Control 0.35 Control Control 0.47
Grade 7 Beginning -41.8925 <.0001 0.33 -50.6069 <.0001 0.50 -38.9506 <.0001 0.39
Grade 7 Intermediate -20.3662 <.0001 0.33 -28.8189 <.0001 0.50 -28.051 <.0001 0.39
Grade 7 Advanced -8.5614 0.0008 0.33 -14.1649 <.0001 0.50 -15.7622 <.0001 0.39
Grade 7 Fluent Control Control 0.33 Control Control 0.50 Control Control 0.39
Grade 8 Beginning -39.6693 <.0001 0.31 -48.1419 <.0001 0.47
Grade 8 Intermediate -18.6716 <.0001 0.31 -34.0354 <.0001 0.47
Grade 8 Advanced -11.0260 <.0001 0.31 -15.6911 <.0001 0.47
Grade 8 Fluent Control Control 0.31 Control Control 0.47
Grade 9 Beginning -46.7972 0.0147 0.47 -27.2193 0.0962 0.20
Grade 9 Intermediate -49.4952 0.0147 0.47 -25.7293 <.0001 0.20
Grade 9 Advanced -17.2141 0.3258 0.47 -17.8058 0.0015 0.20
Grade 9 Fluent Control Control 0.47 Control Control 0.20
Grade 10 Beginning -31.5814 <.0001 0.32 -37.9769 0.0122 0.42 -29.9675 0.0734 0.19
Grade 10 Intermediate -24.7426 <.0001 0.32 -33.3017 <.0001 0.42 -19.4897 0.0005 0.19
Grade 10 Advanced -8.5210 0.0116 0.32 -15.9345 <.0001 0.42 -8.4353 0.042 0.19
Grade 10 Fluent Control Control 0.32 Control Control 0.42 Control Control 0.19
Grade 11 Beginning -29.7903 <.0001 0.21 -35.5914 <.0001 0.41 -18.9342 <.0001 0.23
Grade 11 Intermediate -9.9161 <.0001 0.21 -24.8965 <.0001 0.41 -17.3687 <.0001 0.23
Grade 11 Advanced 2.6851 0.2898 0.21 -11.8261 <.0001 0.41 -7.3576 0.0008 0.23
Grade 11 Fluent Control Control 0.21 Control Control 0.41 Control Control 0.23
Total Proficency Category
(Estimate Received by each proficiency group per chart)
Math Reading Science

112
(fifth, seventh, and eighth), and one grade in Reading (eleventh). The table shows that this
variable was significant in predicting the participants score in Math and Science, but it did not
predict well in Reading. The estimates would lower the score in Math the longer the student has
been in the U.S. There were only a few instances of positive influence (eleventh grade in both
Reading and Science).
Table 42: Demographic Variable: Number of Years in the U.S.
Table 43 shows the Exceptionality demographic, which was significant 26% of the time.
It was significant in one grade in Science (Seventh), no grades in Math, and it was most
significant in Reading, at 56% of the time (third, fourth, fifth, sixth, and eighth). The table shows
that this variable was very significant in predicting the participants score in the lower grades in
Reading, and it was a positive relationship. Those students with IEPs in the lower grades
performed better than those without an IEP in Reading. There was no influence on Math scores
and very little on Science.
Estimate Pr > |t| R-Square Estimate Pr > |t| R-Square Estimate Pr > |t| R-Square
Grade 3
Grade 4
Grade 5 -0.3411 0.3374 0.33
Grade 6
Grade 7 -0.5977 0.0834 0.33 -0.5878 0.0391 0.39
Grade 8 -0.4145 0.1799 0.31 -0.1673 0.7808 0.20
Grade 9
Grade 10
Grade 11 0.2578 0.2720 0.41 0.4997 0.0330 0.23
Number of Years in the U.S.
(Estimate Received by multiplying number of years)
Math Reading Science

113
Table 43: Demographic Variable: Exceptionality
Table 44 shows the First Language, which was significant 22% of the time. It was not
significant in any grade in Science or Reading. The table shows that this variable was significant
in predicting the participants score in Math, 56% of the time, but showed no relationship with
Reading or Science. It also seemed better able to predict in the middle grade levels in Math
(fifth, sixth, seventh, eighth, and ninth). The estimate is always negative meaning that Spanish
speaker’s scores would be lowered by the estimated amount, doing worse than speakers of other
languages.
Table 44: Demographic Variable: First Language
Estimate Pr > |t| R-Square Estimate Pr > |t| R-Square Estimate Pr > |t| R-Square
Grade 3 4.1103 0.1495 0.43
Grade 4 3.5387 0.2340 0.46
Grade 5 13.8880 <.0001 0.45
Grade 6 12.3410 0.0056 0.47
Grade 7 12.0841 0.0009 0.39
Grade 8 1.7099 0.6940 0.47
Grade 9
Grade 10
Grade 11
Exceptionality
(Estimate received by those with an IEP)
Math Reading Science
Estimate Pr > |t| R-Square Estimate Pr > |t| R-Square Estimate Pr > |t| R-Square
Grade 3
Grade 4
Grade 5 -1.7059 0.3866 0.33
Grade 6 -2.0669 0.3905 0.35
Grade 7 -7.3903 0.0022 0.33
Grade 8 -11.6277 <.0001 0.31
Grade 9 -9.0101 0.0046 0.32
Grade 10
Grade 11
First Language
(Estimate received by Spanish Speakers)
Math Reading Science

114
Table 45 shows the Gender Category, which was also significant 22% of the time. It was
significant in one grade in Science (seventh), four grades in Math (fourth, eighth, ninth, and
eleventh), and no grades in Reading. The table shows that this variable was significant in
predicting the participants’ scores, in Math, in the higher grades. In all but one instance the
estimate is negative, lowering girls’ scores, other than in eighth grade Math.
Table 45: Demographic Variable: Gender
Table 46 shows the Free and Reduced Lunch Program Eligibility Category, which was
significant 17% of the time. This was the worst single demographic variable for predicting. It
was significant in one grade in Science (eleventh), one grade in Math (eleventh), and two grades
in Reading (third and eleventh). The table shows that this variable was not very significant in
predicting the participants score in most grades in all content areas. This was an entirely positive
relationship, meaning those that do not receive Free and Reduced Lunch have higher scores that
those that do, in the grades where significance was found.
Estimate Pr > |t| R-Square Estimate Pr > |t| R-Square Estimate Pr > |t| R-Square
Grade 3
Grade 4 -4.0670 0.0160 0.35
Grade 5
Grade 6
Grade 7 -10.1598 <.0001 0.39
Grade 8 2.6064 0.2629 0.31
Grade 9 -20.4876 0.0445 0.47
Grade 10
Grade 11 -4.2913 0.0489 0.21
Gender
(Estimate received by Girls)
Math Reading Science
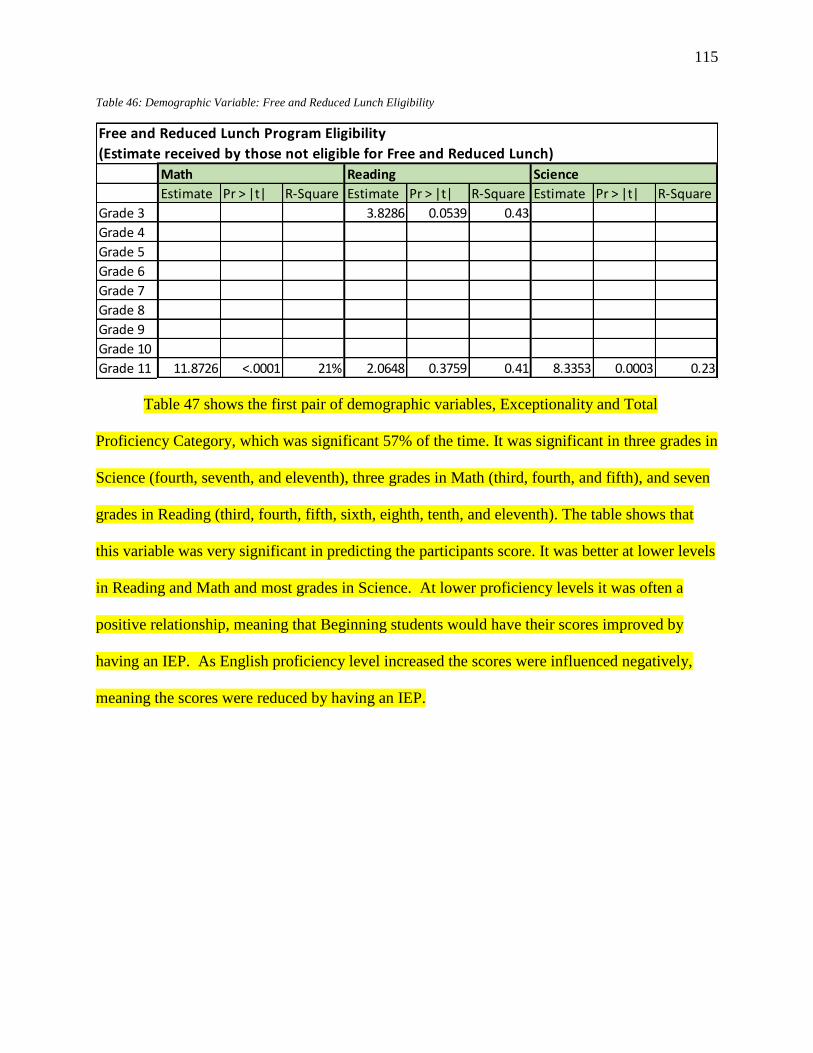
115
Table 46: Demographic Variable: Free and Reduced Lunch Eligibility
Table 47 shows the first pair of demographic variables, Exceptionality and Total
Proficiency Category, which was significant 57% of the time. It was significant in three grades in
Science (fourth, seventh, and eleventh), three grades in Math (third, fourth, and fifth), and seven
grades in Reading (third, fourth, fifth, sixth, eighth, tenth, and eleventh). The table shows that
this variable was very significant in predicting the participants score. It was better at lower levels
in Reading and Math and most grades in Science. At lower proficiency levels it was often a
positive relationship, meaning that Beginning students would have their scores improved by
having an IEP. As English proficiency level increased the scores were influenced negatively,
meaning the scores were reduced by having an IEP.
Estimate Pr > |t| R-Square Estimate Pr > |t| R-Square Estimate Pr > |t| R-Square
Grade 3 3.8286 0.0539 0.43
Grade 4
Grade 5
Grade 6
Grade 7
Grade 8
Grade 9
Grade 10
Grade 11 11.8726 <.0001 21% 2.0648 0.3759 0.41 8.3353 0.0003 0.23
Free and Reduced Lunch Program Eligibility
(Estimate received by those not eligible for Free and Reduced Lunch)
Math Reading Science
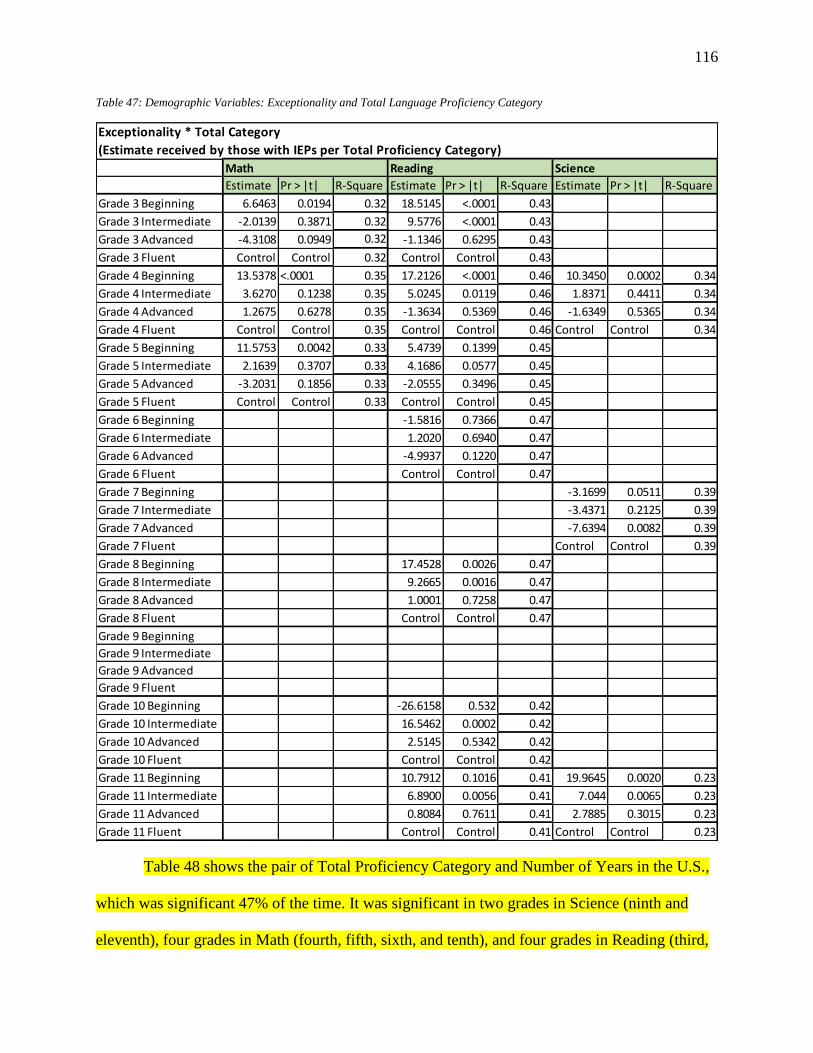
116
Table 47: Demographic Variables: Exceptionality and Total Language Proficiency Category
Table 48 shows the pair of Total Proficiency Category and Number of Years in the U.S.,
which was significant 47% of the time. It was significant in two grades in Science (ninth and
eleventh), four grades in Math (fourth, fifth, sixth, and tenth), and four grades in Reading (third,
Estimate Pr > |t| R-Square Estimate Pr > |t| R-Square Estimate Pr > |t| R-Square
Grade 3 Beginning 6.6463 0.0194 0.32 18.5145 <.0001 0.43
Grade 3 Intermediate -2.0139 0.3871 0.32 9.5776 <.0001 0.43
Grade 3 Advanced -4.3108 0.0949 0.32 -1.1346 0.6295 0.43
Grade 3 Fluent Control Control 0.32 Control Control 0.43
Grade 4 Beginning 13.5378 <.0001 0.35 17.2126 <.0001 0.46 10.3450 0.0002 0.34
Grade 4 Intermediate 3.6270 0.1238 0.35 5.0245 0.0119 0.46 1.8371 0.4411 0.34
Grade 4 Advanced 1.2675 0.6278 0.35 -1.3634 0.5369 0.46 -1.6349 0.5365 0.34
Grade 4 Fluent Control Control 0.35 Control Control 0.46 Control Control 0.34
Grade 5 Beginning 11.5753 0.0042 0.33 5.4739 0.1399 0.45
Grade 5 Intermediate 2.1639 0.3707 0.33 4.1686 0.0577 0.45
Grade 5 Advanced -3.2031 0.1856 0.33 -2.0555 0.3496 0.45
Grade 5 Fluent Control Control 0.33 Control Control 0.45
Grade 6 Beginning -1.5816 0.7366 0.47
Grade 6 Intermediate 1.2020 0.6940 0.47
Grade 6 Advanced -4.9937 0.1220 0.47
Grade 6 Fluent Control Control 0.47
Grade 7 Beginning -3.1699 0.0511 0.39
Grade 7 Intermediate -3.4371 0.2125 0.39
Grade 7 Advanced -7.6394 0.0082 0.39
Grade 7 Fluent Control Control 0.39
Grade 8 Beginning 17.4528 0.0026 0.47
Grade 8 Intermediate 9.2665 0.0016 0.47
Grade 8 Advanced 1.0001 0.7258 0.47
Grade 8 Fluent Control Control 0.47
Grade 9 Beginning
Grade 9 Intermediate
Grade 9 Advanced
Grade 9 Fluent
Grade 10 Beginning -26.6158 0.532 0.42
Grade 10 Intermediate 16.5462 0.0002 0.42
Grade 10 Advanced 2.5145 0.5342 0.42
Grade 10 Fluent Control Control 0.42
Grade 11 Beginning 10.7912 0.1016 0.41 19.9645 0.0020 0.23
Grade 11 Intermediate 6.8900 0.0056 0.41 7.044 0.0065 0.23
Grade 11 Advanced 0.8084 0.7611 0.41 2.7885 0.3015 0.23
Grade 11 Fluent Control Control 0.41 Control Control 0.23
Exceptionality * Total Category
(Estimate received by those with IEPs per Total Proficiency Category)
Math Reading Science

117
sixth, seventh and eleventh). The table shows that this variable was significant in predicting the
participants score for all three content areas evenly. The relationship is mostly negative in Math
and Science, but Reading at the lower proficiency levels is mostly positive.
Table 48: Demographic Variables: Total Language Proficiency Category and Number of Years in the U.S.
Estimate Pr > |t| R-Square Estimate Pr > |t| R-Square Estimate Pr > |t| R-Square
Grade 3 Beginning 0.9633 0.1009 0.43
Grade 3 Intermediate -0.5856 0.1134 0.43
Grade 3 Advanced -0.1074 0.7571 0.43
Grade 3 Fluent Control Control 0.43
Grade 4 Beginning -1.0317 0.0305 0.35
Grade 4 Intermediate -1.1211 0.0015 0.35
Grade 4 Advanced -0.2722 0.4345 0.35
Grade 4 Fluent Control Control 0.35
Grade 5 Beginning -0.7395 0.2501 0.33
Grade 5 Intermediate -1.2901 0.0001 0.33
Grade 5 Advanced -0.4959 0.0906 0.33
Grade 5 Fluent Control Control 0.33
Grade 6 Beginning 1.4746 0.0308 0.35 2.7329 <.0001 0.47
Grade 6 Intermediate -0.1606 0.6436 0.35 0.6591 0.0318 0.47
Grade 6 Advanced -0.3820 0.2702 0.35 -0.0825 0.7855 0.47
Grade 6 Fluent Control Control 0.35 Control Control 0.47
Grade 7 Beginning 1.7581 0.0073 0.50
Grade 7 Intermediate -0.0448 0.8671 0.50
Grade 7 Advanced -0.1460 0.5518 0.50
Grade 7 Fluent Control Control 0.50
Grade 8 Beginning
Grade 8 Intermediate
Grade 8 Advanced
Grade 8 Fluent
Grade 9 Beginning -45.8654 0.0089 0.20
Grade 9 Intermediate 0.6300 0.3510 0.20
Grade 9 Advanced 0.5840 0.2614 0.20
Grade 9 Fluent Control Control 0.20
Grade 10 Beginning -0.7264 0.7462 0.32
Grade 10 Intermediate 1.1519 0.0059 0.32
Grade 10 Advanced -0.1193 0.6958 0.32
Grade 10 Fluent Control Control 0.32
Grade 11 Beginning 1.1640 0.0439 0.41 -1.0124 0.0642 0.23
Grade 11 Intermediate 0.5464 0.0082 0.41 -0.3307 0.1213 0.23
Grade 11 Advanced 0.0898 0.6348 0.41 -0.4126 0.0298 0.23
Grade 11 Fluent Control Control 0.41 Control Control 0.23
Total Category * Number of Years in the U.S.
(Estimate received for each Year in the U.S. and Total Proficiency Category)
Math Reading Science

118
Table 49 shows the pair of Total Language Proficiency Category and First Language,
which was significant 45% of the time. It was significant in three grades in Science (fourth,
seventh and eleventh), five grades in Math (fourth, fifth, seventh, eighth, and eleventh), and only
two grades in Reading (third and eleventh). The table shows that this variable was significant in
predicting the participants score for Science and Math the best. For Science the relationship is a
positive one improving Spanish speaking students’ scores, with the largest gains for the
Beginning proficiency level. In Math, Beginning students’ scores were also improved the most
and always positively, but the other proficiency groups had both positive and negative
relationships. In Reading, in third grade it is an entirely positive influence, but in eleventh grade
it is negative at the lower levels with only Advanced students improving their scores.

119
Table 49: Demographic Variables: Total Language Proficiency Category and First Language
At this point, there is a shift in the overall percentages of significance. The rest of the
demographic pair relationships are less than 30% significant overall. Rather than discussing the
Estimate Pr > |t| R-Square Estimate Pr > |t| R-Square Estimate Pr > |t| R-Square
Grade 3 Beginning 2.2559 0.4202 0.43
Grade 3 Intermediate 3.8829 0.0053 0.43
Grade 3 Advanced 0.2998 0.8045 0.43
Grade 3 Fluent Control Control 0.43
Grade 4 Beginning 10.2690 <.0001 0.35 10.5289 <.0001 0.34
Grade 4 Intermediate 1.0041 0.5294 0.35 2.4685 0.1267 0.34
Grade 4 Advanced 0.4218 0.7578 0.35 0.7523 0.5872 0.34
Grade 4 Fluent Control Control 0.35 Control Control 0.34
Grade 5 Beginning 7.5111 0.0089 0.33
Grade 5 Intermediate 1.1028 0.5607 0.33
Grade 5 Advanced -1.6313 0.2554 0.33
Grade 5 Fluent Control Control 0.33
Grade 6 Beginning
Grade 6 Intermediate
Grade 6 Advanced
Grade 6 Fluent
Grade 7 Beginning 8.3020 0.0236 0.33 10.1481 0.0007 0.39
Grade 7 Intermediate -0.7115 0.7553 0.33 3.6765 0.0502 0.39
Grade 7 Advanced -1.9668 0.2938 0.33 3.7656 0.0145 0.39
Grade 7 Fluent Control Control 0.33 Control Control 0.39
Grade 8 Beginning 11.1267 0.0034 0.31
Grade 8 Intermediate 0.5285 0.8587 0.31
Grade 8 Advanced -0.5931 0.7786 0.31
Grade 8 Fluent Control Control 0.31
Grade 9 Beginning
Grade 9 Intermediate
Grade 9 Advanced
Grade 9 Fluent
Grade 10 Beginning
Grade 10 Intermediate
Grade 10 Advanced
Grade 10 Fluent
Grade 11 Beginning 8.9664 0.0228 0.21 -1.8829 0.6280 0.41 5.7297 0.1030 0.23
Grade 11 Intermediate 0.7160 0.7558 0.21 -2.3623 0.2240 0.41 5.3729 0.008 0.23
Grade 11 Advanced -4.9445 0.0404 0.21 4.7558 0.0212 0.41 4.5657 0.0292 0.23
Grade 11 Fluent Control Control 0.21 Control Control 0.41 Control Control 0.23
Total Category * Language
(Estimate received by Spanish Speakers per Total Proficiency Category)
Math Reading Science
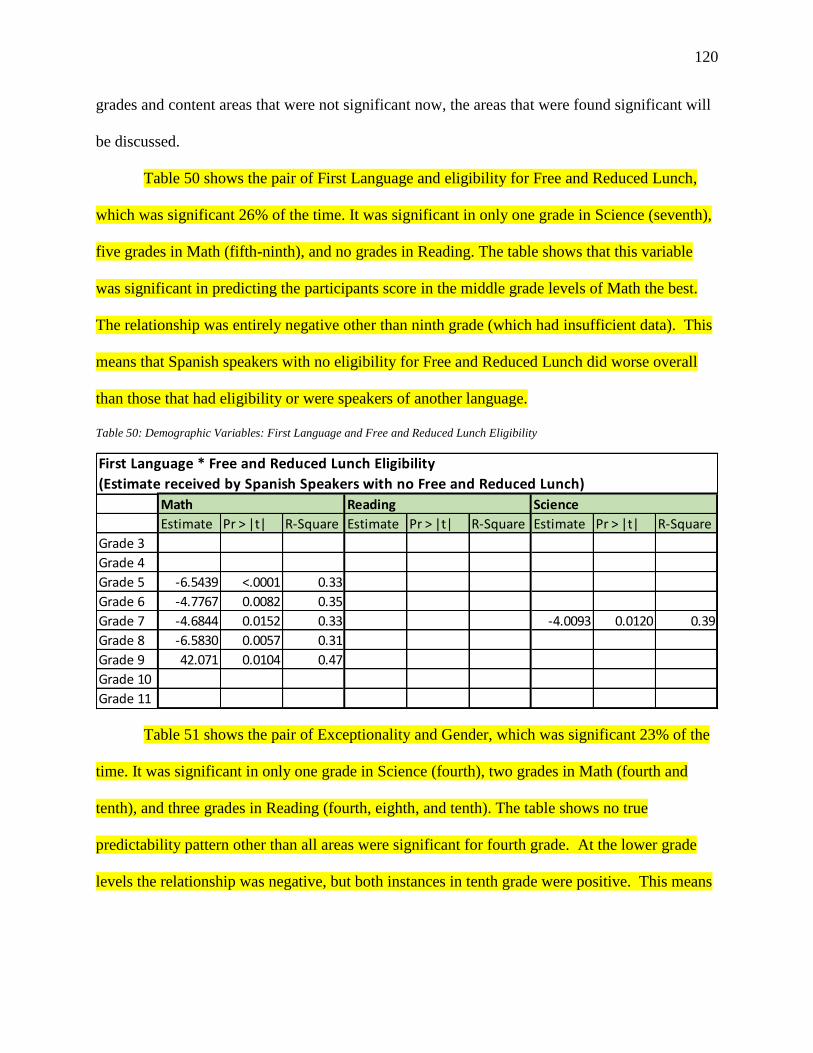
120
grades and content areas that were not significant now, the areas that were found significant will
be discussed.
Table 50 shows the pair of First Language and eligibility for Free and Reduced Lunch,
which was significant 26% of the time. It was significant in only one grade in Science (seventh),
five grades in Math (fifth-ninth), and no grades in Reading. The table shows that this variable
was significant in predicting the participants score in the middle grade levels of Math the best.
The relationship was entirely negative other than ninth grade (which had insufficient data). This
means that Spanish speakers with no eligibility for Free and Reduced Lunch did worse overall
than those that had eligibility or were speakers of another language.
Table 50: Demographic Variables: First Language and Free and Reduced Lunch Eligibility
Table 51 shows the pair of Exceptionality and Gender, which was significant 23% of the
time. It was significant in only one grade in Science (fourth), two grades in Math (fourth and
tenth), and three grades in Reading (fourth, eighth, and tenth). The table shows no true
predictability pattern other than all areas were significant for fourth grade. At the lower grade
levels the relationship was negative, but both instances in tenth grade were positive. This means
Estimate Pr > |t| R-Square Estimate Pr > |t| R-Square Estimate Pr > |t| R-Square
Grade 3
Grade 4
Grade 5 -6.5439 <.0001 0.33
Grade 6 -4.7767 0.0082 0.35
Grade 7 -4.6844 0.0152 0.33 -4.0093 0.0120 0.39
Grade 8 -6.5830 0.0057 0.31
Grade 9 42.071 0.0104 0.47
Grade 10
Grade 11
First Language * Free and Reduced Lunch Eligibility
(Estimate received by Spanish Speakers with no Free and Reduced Lunch)
Math Reading Science
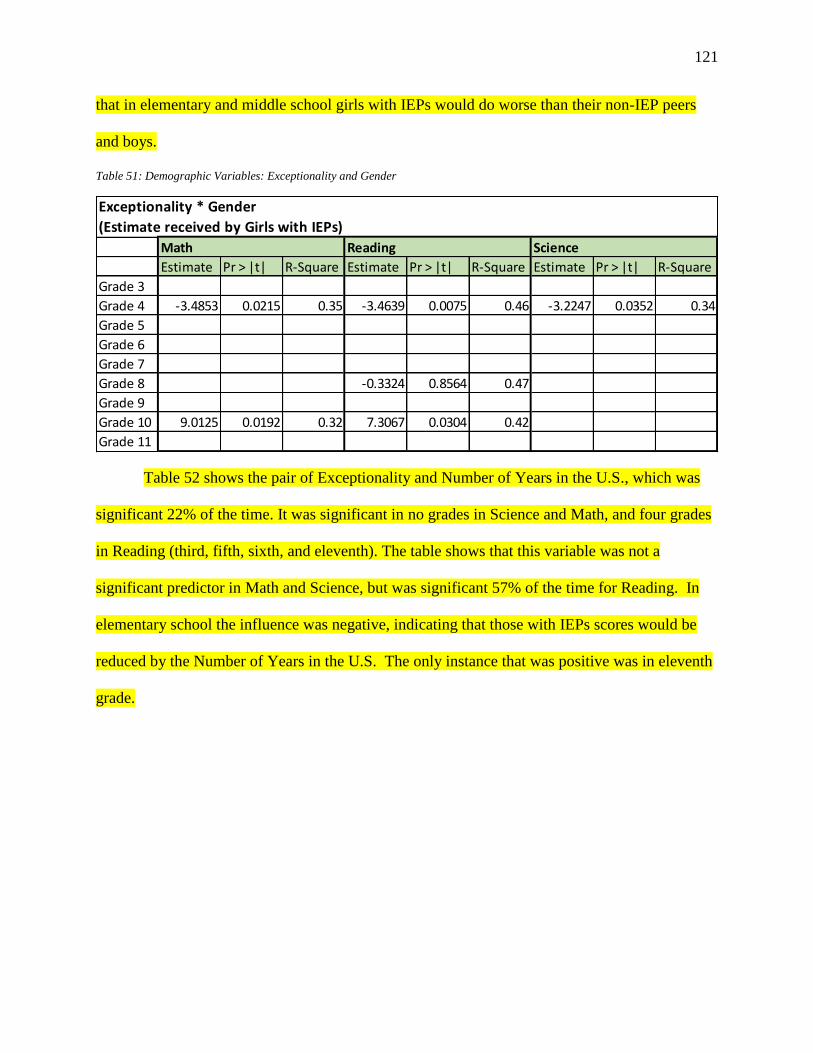
121
that in elementary and middle school girls with IEPs would do worse than their non-IEP peers
and boys.
Table 51: Demographic Variables: Exceptionality and Gender
Table 52 shows the pair of Exceptionality and Number of Years in the U.S., which was
significant 22% of the time. It was significant in no grades in Science and Math, and four grades
in Reading (third, fifth, sixth, and eleventh). The table shows that this variable was not a
significant predictor in Math and Science, but was significant 57% of the time for Reading. In
elementary school the influence was negative, indicating that those with IEPs scores would be
reduced by the Number of Years in the U.S. The only instance that was positive was in eleventh
grade.
Estimate Pr > |t| R-Square Estimate Pr > |t| R-Square Estimate Pr > |t| R-Square
Grade 3
Grade 4 -3.4853 0.0215 0.35 -3.4639 0.0075 0.46 -3.2247 0.0352 0.34
Grade 5
Grade 6
Grade 7
Grade 8 -0.3324 0.8564 0.47
Grade 9
Grade 10 9.0125 0.0192 0.32 7.3067 0.0304 0.42
Grade 11
Exceptionality * Gender
(Estimate received by Girls with IEPs)
Math Reading Science
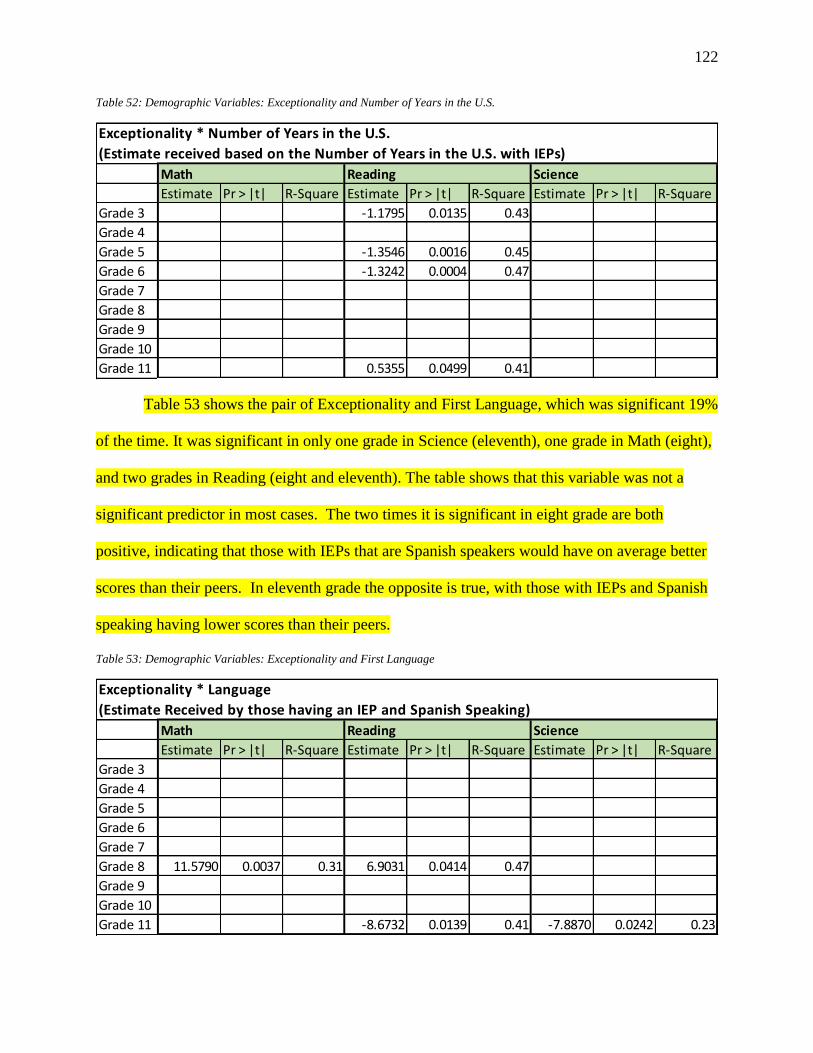
122
Table 52: Demographic Variables: Exceptionality and Number of Years in the U.S.
Table 53 shows the pair of Exceptionality and First Language, which was significant 19%
of the time. It was significant in only one grade in Science (eleventh), one grade in Math (eight),
and two grades in Reading (eight and eleventh). The table shows that this variable was not a
significant predictor in most cases. The two times it is significant in eight grade are both
positive, indicating that those with IEPs that are Spanish speakers would have on average better
scores than their peers. In eleventh grade the opposite is true, with those with IEPs and Spanish
speaking having lower scores than their peers.
Table 53: Demographic Variables: Exceptionality and First Language
Estimate Pr > |t| R-Square Estimate Pr > |t| R-Square Estimate Pr > |t| R-Square
Grade 3 -1.1795 0.0135 0.43
Grade 4
Grade 5 -1.3546 0.0016 0.45
Grade 6 -1.3242 0.0004 0.47
Grade 7
Grade 8
Grade 9
Grade 10
Grade 11 0.5355 0.0499 0.41
Exceptionality * Number of Years in the U.S.
(Estimate received based on the Number of Years in the U.S. with IEPs)
Math Reading Science
Estimate Pr > |t| R-Square Estimate Pr > |t| R-Square Estimate Pr > |t| R-Square
Grade 3
Grade 4
Grade 5
Grade 6
Grade 7
Grade 8 11.5790 0.0037 0.31 6.9031 0.0414 0.47
Grade 9
Grade 10
Grade 11 -8.6732 0.0139 0.41 -7.8870 0.0242 0.23
Exceptionality * Language
(Estimate Received by those having an IEP and Spanish Speaking)
Math Reading Science
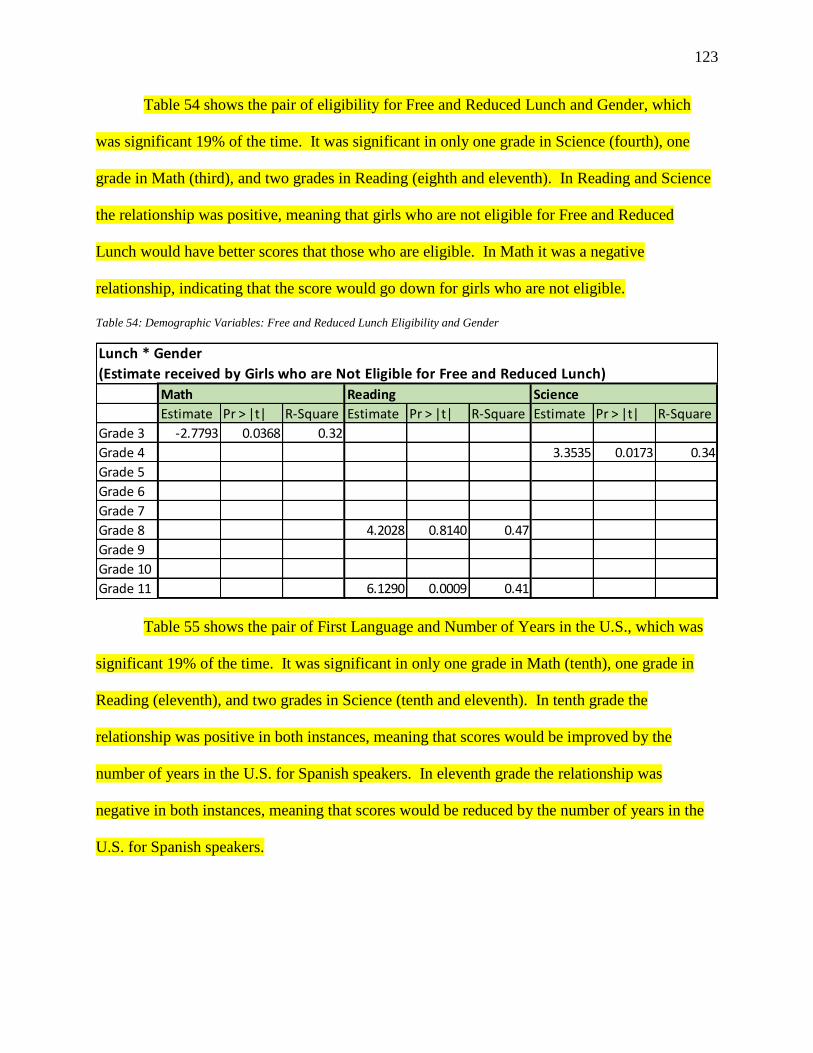
123
Table 54 shows the pair of eligibility for Free and Reduced Lunch and Gender, which
was significant 19% of the time. It was significant in only one grade in Science (fourth), one
grade in Math (third), and two grades in Reading (eighth and eleventh). In Reading and Science
the relationship was positive, meaning that girls who are not eligible for Free and Reduced
Lunch would have better scores that those who are eligible. In Math it was a negative
relationship, indicating that the score would go down for girls who are not eligible.
Table 54: Demographic Variables: Free and Reduced Lunch Eligibility and Gender
Table 55 shows the pair of First Language and Number of Years in the U.S., which was
significant 19% of the time. It was significant in only one grade in Math (tenth), one grade in
Reading (eleventh), and two grades in Science (tenth and eleventh). In tenth grade the
relationship was positive in both instances, meaning that scores would be improved by the
number of years in the U.S. for Spanish speakers. In eleventh grade the relationship was
negative in both instances, meaning that scores would be reduced by the number of years in the
U.S. for Spanish speakers.
Estimate Pr > |t| R-Square Estimate Pr > |t| R-Square Estimate Pr > |t| R-Square
Grade 3 -2.7793 0.0368 0.32
Grade 4 3.3535 0.0173 0.34
Grade 5
Grade 6
Grade 7
Grade 8 4.2028 0.8140 0.47
Grade 9
Grade 10
Grade 11 6.1290 0.0009 0.41
Lunch * Gender
(Estimate received by Girls who are Not Eligible for Free and Reduced Lunch)
Math Reading Science

124
Table 55: Demographic Variables: First Language and Number of Years in the U.S.
Table 56 shows the pair of Gender and Total Proficiency Category, which was significant
17% of the time. It was significant in only one grade in Reading (eleventh), one grade in Science
(seventh), and two grades in Math (third and fifth). For all Beginning level students the
relationship was positive, meaning that girls’ scores were improved compared to the Fluent
students. In all but Science the Advanced girls’ scores were reduced compared to the Fluent
students.
Estimate Pr > |t| R-Square Estimate Pr > |t| R-Square Estimate Pr > |t| R-Square
Grade 3
Grade 4
Grade 5
Grade 6
Grade 7
Grade 8
Grade 9
Grade 10 1.0667 0.0023 0.32 0.8448 0.0338 0.19
Grade 11 -0.4944 0.0229 0.41 -0.5283 0.0171 0.23
Language * Number of Years in the U.S.
(Estimate received by Spanish Speakers based on the Number of Years in the U.S.)
Math Reading Science
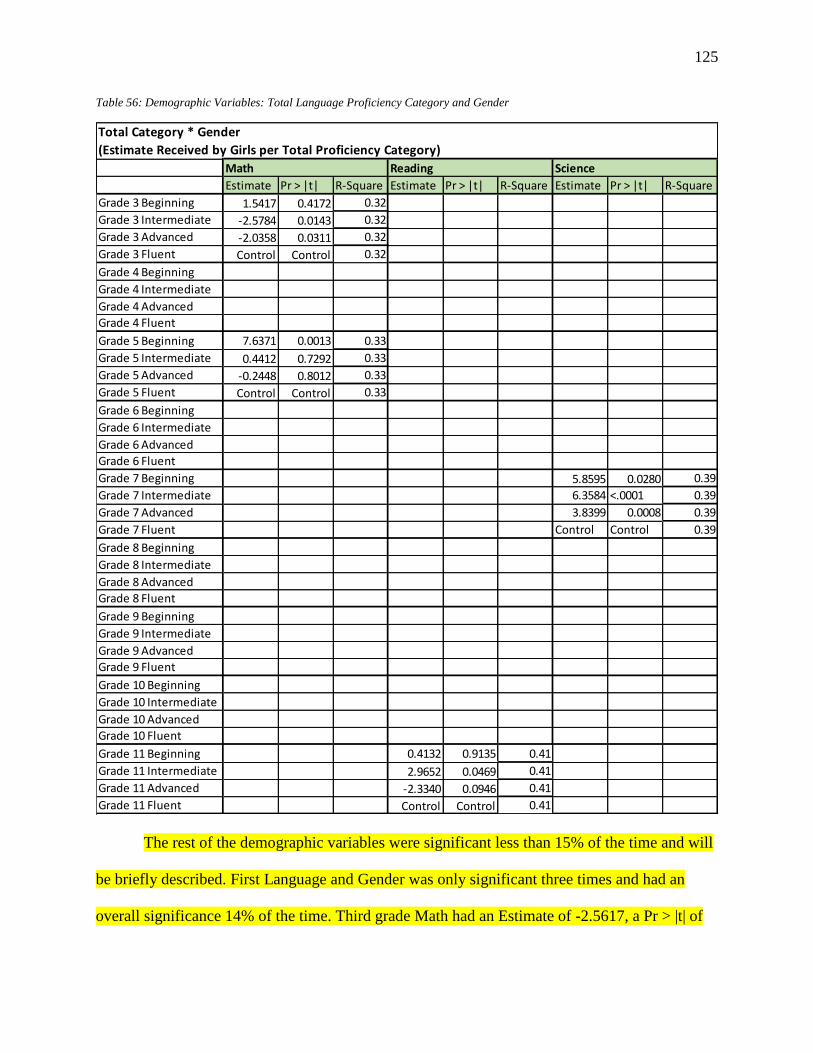
125
Table 56: Demographic Variables: Total Language Proficiency Category and Gender
The rest of the demographic variables were significant less than 15% of the time and will
be briefly described. First Language and Gender was only significant three times and had an
overall significance 14% of the time. Third grade Math had an Estimate of -2.5617, a Pr > |t| of
Estimate Pr > |t| R-Square Estimate Pr > |t| R-Square Estimate Pr > |t| R-Square
Grade 3 Beginning 1.5417 0.4172 0.32
Grade 3 Intermediate -2.5784 0.0143 0.32
Grade 3 Advanced -2.0358 0.0311 0.32
Grade 3 Fluent Control Control 0.32
Grade 4 Beginning
Grade 4 Intermediate
Grade 4 Advanced
Grade 4 Fluent
Grade 5 Beginning 7.6371 0.0013 0.33
Grade 5 Intermediate 0.4412 0.7292 0.33
Grade 5 Advanced -0.2448 0.8012 0.33
Grade 5 Fluent Control Control 0.33
Grade 6 Beginning
Grade 6 Intermediate
Grade 6 Advanced
Grade 6 Fluent
Grade 7 Beginning 5.8595 0.0280 0.39
Grade 7 Intermediate 6.3584 <.0001 0.39
Grade 7 Advanced 3.8399 0.0008 0.39
Grade 7 Fluent Control Control 0.39
Grade 8 Beginning
Grade 8 Intermediate
Grade 8 Advanced
Grade 8 Fluent
Grade 9 Beginning
Grade 9 Intermediate
Grade 9 Advanced
Grade 9 Fluent
Grade 10 Beginning
Grade 10 Intermediate
Grade 10 Advanced
Grade 10 Fluent
Grade 11 Beginning 0.4132 0.9135 0.41
Grade 11 Intermediate 2.9652 0.0469 0.41
Grade 11 Advanced -2.3340 0.0946 0.41
Grade 11 Fluent Control Control 0.41
Total Category * Gender
(Estimate Received by Girls per Total Proficiency Category)
Math Reading Science
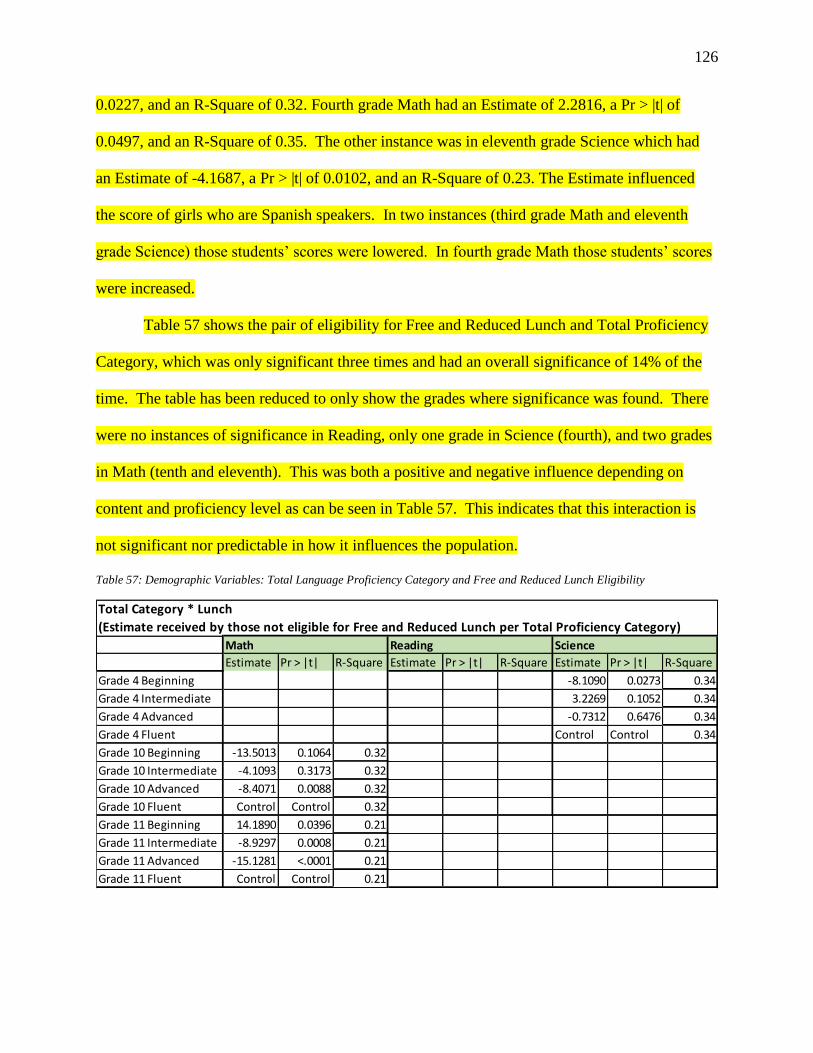
126
0.0227, and an R-Square of 0.32. Fourth grade Math had an Estimate of 2.2816, a Pr > |t| of
0.0497, and an R-Square of 0.35. The other instance was in eleventh grade Science which had
an Estimate of -4.1687, a Pr > |t| of 0.0102, and an R-Square of 0.23. The Estimate influenced
the score of girls who are Spanish speakers. In two instances (third grade Math and eleventh
grade Science) those students’ scores were lowered. In fourth grade Math those students’ scores
were increased.
Table 57 shows the pair of eligibility for Free and Reduced Lunch and Total Proficiency
Category, which was only significant three times and had an overall significance of 14% of the
time. The table has been reduced to only show the grades where significance was found. There
were no instances of significance in Reading, only one grade in Science (fourth), and two grades
in Math (tenth and eleventh). This was both a positive and negative influence depending on
content and proficiency level as can be seen in Table 57. This indicates that this interaction is
not significant nor predictable in how it influences the population.
Table 57: Demographic Variables: Total Language Proficiency Category and Free and Reduced Lunch Eligibility
Estimate Pr > |t| R-Square Estimate Pr > |t| R-Square Estimate Pr > |t| R-Square
Grade 4 Beginning -8.1090 0.0273 0.34
Grade 4 Intermediate 3.2269 0.1052 0.34
Grade 4 Advanced -0.7312 0.6476 0.34
Grade 4 Fluent Control Control 0.34
Grade 10 Beginning -13.5013 0.1064 0.32
Grade 10 Intermediate -4.1093 0.3173 0.32
Grade 10 Advanced -8.4071 0.0088 0.32
Grade 10 Fluent Control Control 0.32
Grade 11 Beginning 14.1890 0.0396 0.21
Grade 11 Intermediate -8.9297 0.0008 0.21
Grade 11 Advanced -15.1281 <.0001 0.21
Grade 11 Fluent Control Control 0.21
Total Category * Lunch
(Estimate received by those not eligible for Free and Reduced Lunch per Total Proficiency Category)
Math Reading Science

127
Number of Years in the U.S. and eligibility for Free and Reduced Lunch was only
significant three times and had an overall significance 14% of the time. There were no instances
of significance in Math. Eighth grade Reading had an Estimate of 0.6426, a Pr > |t| of 0.0374,
and an R-Square of 0.47. Tenth grade Science had an Estimate of 1.2587, a Pr > |t| of 0.0003, and
an R-Square of 0.19. The other instance was in eleventh grade Science which had an Estimate of
-0.6876, a Pr > |t| of 0.0047, and an R-Square of 0.23. The Estimate influenced the score of those
that have no eligibility for Free and Reduced Lunch based on the Number of Years in the U.S.
Eleventh grade was the only grade to have a negative influence, meaning that those with no Free
and Reduced Lunch would have lower scores than their peers.
The following two pairs had 9% overall significance. Number of Years in the U.S. and
Gender was only significant two times. Eighth grade Math had an Estimate of -0.6751, a Pr > |t|
of 0.0046, and an R-Square of 0.31. The other instance was in fifth grade Reading which had an
Estimate of 0.5156, a Pr > |t| of 0.0270, and an R-Square of 0.45. Overall, this was not a good
predictor of student scores. Eligibility for Free and Reduced Lunch and Exceptionality was only
significant two times as well. The first instance was fourth grade Math with an Estimate of
6.1466, a Pr > |t| of 0.0118, and an R-Square of 0.35. The other instance was in eleventh grade
Reading, which had an Estimate of 10.6283, a Pr > |t| of 0.0007, and an R-Square of 0.41. This
was a positive relationship for both instances, meaning those students with IEPs and no Free and
Reduced Lunch eligibility did better than their peers. This interaction was not a good predictor
of student performance.
Summary of Findings
Statistical analysis were performed on the test data with the purpose of determining what
areas influenced or could predict an individual’s scores on their content assessments (Math,
128
Reading, and Science). Four research questions guided the data analysis. The statistical measures
used were ANOVAs, proportions, and simple linear regressions.
In the following and final chapter, these findings will be discussed in relation to the
literature review and theoretical framework. The limitations of the present research will also be
presented as well as suggestions for future studies. Finally, implications will be discussed and
how they could influence future research.

129
Chapter 5: Discussion
In an effort to comply with the federal government’s accountability requirements (Title I
and Title III), English Language Learners (ELLs) in Kansas must display progress in academic
English language proficiency (as measured by the KELPA), and in academic content area
achievement (as measured by the CETE), through skill-specific tests for Math, Reading, and
Science.
This study evaluated the relationship between the performance of ELLs on the KELPA
and their grade-required content assessments, and evaluated the predictive power of the language
proficiency of the students, their grade level, their exceptionality or disability qualification, the
number of years they have been in the U.S., their eligibility for the Free and Reduced Lunch
program, their Native Language or first language, their Gender, and all the various two-way
combinations of these demographic variables. To accomplish this, multiple ANOVAs, simple
linear regressions, and basic proportions were performed on an extent dataset from the entire
state of Kansas during the 2009–2010 school year (testing was conducted in the spring of 2010).
All students who took the KELPA were part of the original dataset, but only pairs containing a
KELPA score and a content (Math, Reading, or Science) score were analyzed.
Key findings suggest that student performances on the KELPA have a significant
relationship with the students’ performance during the same year on their Reading, Math, and
Science content assessments. Each grade had to be individually analyzed, as the original tests
were not equated, but similar patterns are seen across the grade levels. In addition, many of the
demographic variables (Number of Years in the U.S., Total Language Proficiency Category,
Total Language Proficiency Category and Exceptionality Code, Number of Years in the U.S. and
130
Total Language Proficiency Category, and First Language and Total Language Proficiency
Category) were found to have predictive power in content area scores.
To illustrate how important it is to view ELLs performance through the lens of language
proficiency, if we were to take the total number of those who met standards and compared them
to those who did not meet standards, 66% met standards for Math and 62% met standards for
Reading. This does not show the great fluctuation within this group based on proficiency.
Therefore, it is important to remember to view the results through the lens of language
proficiency when possible. For Kansas, this means having four different lenses (Beginning,
Intermediate, Advanced, and Fluent) rather than grouping all ELLs as a single subgroup.
The discussion of the findings begins with a description of the ELLs who were part of the
study, the outcomes for the Math, Reading, and Science assessments for the ELLs, the KELPA’s
predictive power on content assessment scores, the effects of proficiency level on content scores
across grade levels, and then the role of demographic variables on content assessments.
Implications of the validity of testing are discussed. Recommendations for interested and
involved parties will be made, followed by a discussion of the limitations of this study. Finally,
the findings are discussed in relation to previous literature and future research.
Discussion of Findings
The ELLs who were part of this study were students in grades three through eleven in the
state of Kansas and had taken the KELPA and at least one content assessment (Math, Reading,
and/or Science) during the 2009–2010 school year. Table 58 shows the number of students at
each grade level who were administered the KELPA as well as a column for each of the content
areas (Math, Reading, and Science).

131
Table 58: Number of students that were administered a test 2009-2010
Grade KELPA Math Reading Science
Third
4300 4191 4103 N/A
Fourth 4109 3991 3915 3991
Fifth 3619 3518 3438 N/A
Sixth 3174 3104 3032 N/A
Seventh 2662 2577 2515 2586
Eighth 2390 2315 2242 N/A
Ninth 2263 112 26 577
Tenth 1638 990 990 799
Eleventh 2508 2068 2121 2084
Totals 26663 22866 22382 10037
All ELLs have to take the KELPA every year of their attendance, including their first
year. They are also expected to take the content assessments every year (or every required year),
which are reported for accountability. The only exception is during the first year, where students
take the Math and Science assessments, but the scores do not count for accountability. After the
first year, they take all grade-required tests and the scores do count toward AYP. The total size
of this population who took the KELPA in grades three through eleven for the 2009–2010 school
year was 26,663 students. There were 22,866 who took the KELPA and the Math assessment of
the state, 22,382 who took the KELPA and the Reading assessment of the state, and 10,037 who
took the KELPA and the state’s Science assessment.
For Math, there were 1,130 students at the Beginning level. Of those students, 310 met
standards and 820 did not meet standards for Math, which is equivalent to 27% of all Beginning
level students meeting standards in Math. For the Intermediate level, there were 5,692 students.
Of those students, 2,623 met standards and 3,069 did not meet standards for Math, which is
equivalent to 48% of all Intermediate level students meeting standards in Math. For the
Advanced level, there were 8,396 students. Of those students, 5,704 met standards and 2,692 did
not meet standards, which is equivalent to 68% of all Advanced students meeting standards in
132
Math. For the Fluent level, there were 7,648 students. Of those students, 6,387 met standards and
1,261 did not meet standards for Math, which is equivalent to 84% of all Fluent level students
meeting standards in Math. The students were analyzed based on their grade level and their
language proficiency, but it is clear that language proficiency makes a difference in a students’
ability to meet the standards for their level in Math.
For Reading, there were 836 students at the Beginning level. Of those students, 204 met
standards and 632 did not meet standards for Reading, which is equivalent to 32%of all
Beginning level students meeting standards in Reading. For the Intermediate level, there were
5,492 students. Of those students, 1,795 students met standards and 3,697 students did not meet
standards for Reading, which is equivalent to 33% of all Intermediate level students meeting
standards in Reading. For the Advanced level, there were 8,327 students. Of those students,
5,351 met standards and 2,976 did not meet standards for Reading, which is equivalent to 64% of
all Advanced level students meeting standards in Reading. For the Fluent level, there were 7,711
students. Of those students, 6,593 students met standards and 1,118 did not meet standards,
which is equivalent to 86% of all Fluent students meeting standards on Reading. The students
were analyzed based on their grade level and language proficiency level, but it is clear that
language proficiency makes a difference in a student’s ability to meet the standards for their
level in Reading.
Results for Science are difficult to discuss in this way, as there is no data on how high
school students performed against the standards. The only grades that have that data are fourth
and seventh. For the two grades, there were 384 Beginning level students. Of those, 110 met
standards and 274 did not meet standards, which is equivalent to 29% of all fourth and seventh
grade Beginning level students meeting standards in Science. For the Intermediate level, there
133
were 1,816 students. Of those, 891 met standards and 925 did not meet standards for Science,
which is equivalent to 49% of all fourth and seventh grade Intermediate level students meeting
standards in Science. For the Advanced level, there were 2,530 students. Of those, 1,847 met
standards and 683 did not meet standards for Science, which is equivalent to 73% of all fourth
and seventh grade Advanced level students meeting standards in Science. For the Fluent level,
there were 1,845 students. Of those, 1,720 met standards and 125 did not meet standards for
Science, which is equivalent to 93% of all fourth and seventh grade Fluent level students meeting
standards in Science.
The other piece of information that we have about this population is related to the
demographic variables that were looked at in the fourth research question. It is important to note
that the demographic variables should be interpreted with caution. There were not equal
amounts of participants in each grade and proficiency level, which created difficulties in
interpretation. The way the demographic variables were coded for analysis was also not ideal.
Some had to be grouped together to try to make the analysis more statistically meaningful (First
Language and Exceptionality Code). The single variables are their Exceptionality Code or IEP
classification, the Number of Years they have been in the U.S., their eligibility for the Free and
Reduced Lunch program, their Native Language or first language, their Gender, and their Total
Language Proficiency Category. For Exceptionality, 2,098 or 7.7% of the population was
indicated as learning disabled, 78 or 0.3% was indicated as gifted, 749 or 2.8% was indicated as
some other disability code (see Table 37 for a complete list of all other coded options), and the
last group of 23,738 or 89% of the students had no indicated exceptionality code at all. For this
analysis all those identified as having an IEP (learning disabled, gifted, or other disability code)
were grouped together. The group of students with an IEP had 2,925 students or about 10.8% of
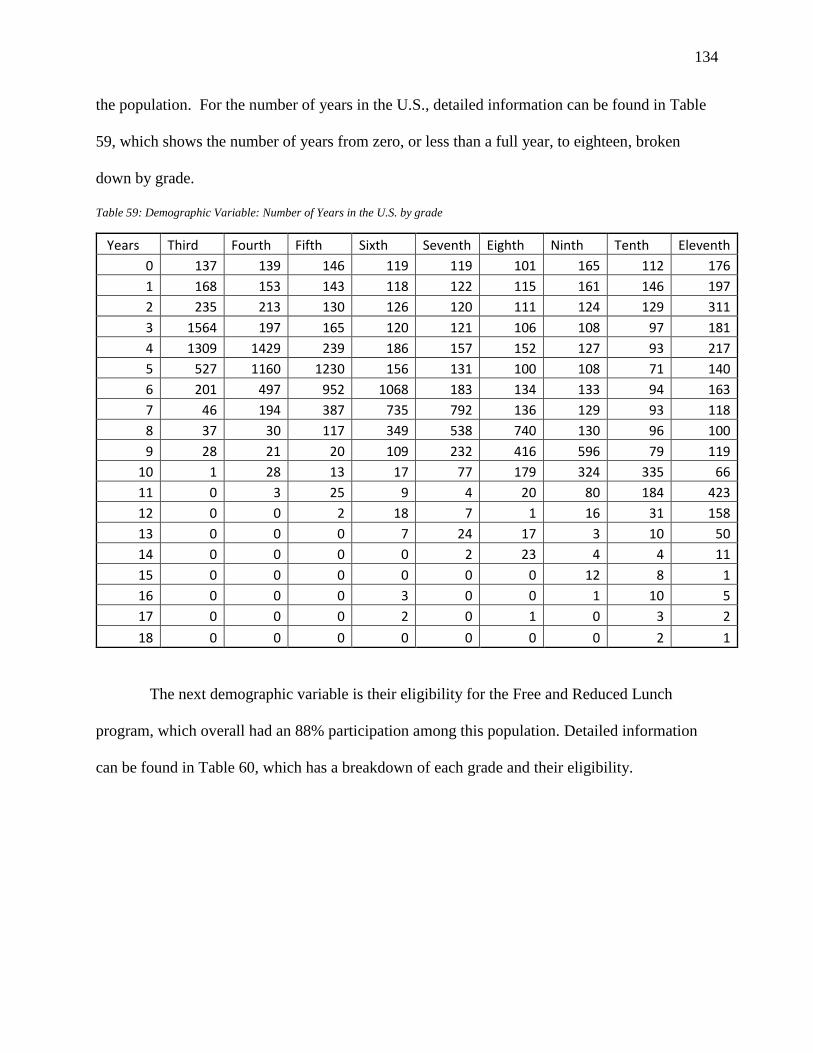
134
the population. For the number of years in the U.S., detailed information can be found in Table
59, which shows the number of years from zero, or less than a full year, to eighteen, broken
down by grade.
Table 59: Demographic Variable: Number of Years in the U.S. by grade
Years Third Fourth Fifth Sixth Seventh Eighth Ninth Tenth Eleventh
0 137 139 146 119 119 101 165 112 176
1 168 153 143 118 122 115 161 146 197
2 235 213 130 126 120 111 124 129 311
3 1564 197 165 120 121 106 108 97 181
4 1309 1429 239 186 157 152 127 93 217
5 527 1160 1230 156 131 100 108 71 140
6 201 497 952 1068 183 134 133 94 163
7 46 194 387 735 792 136 129 93 118
8 37 30 117 349 538 740 130 96 100
9 28 21 20 109 232 416 596 79 119
10 1 28 13 17 77 179 324 335 66
11 0 3 25 9 4 20 80 184 423
12 0 0 2 18 7 1 16 31 158
13 0 0 0 7 24 17 3 10 50
14 0 0 0 0 2 23 4 4 11
15 0 0 0 0 0 0 12 8 1
16 0 0 0 3 0 0 1 10 5
17 0 0 0 2 0 1 0 3 2
18 0 0 0 0 0 0 0 2 1
The next demographic variable is their eligibility for the Free and Reduced Lunch
program, which overall had an 88% participation among this population. Detailed information
can be found in Table 60, which has a breakdown of each grade and their eligibility.

135
Table 60: Demographic Variable: Eligibility for Free and Reduced Lunch
Grade Number of Students Eligible Percentage of Population
Third 3,805 ~88%
Fourth 3,659 ~89%
Fifth 3,217 ~89%
Sixth 2,829 ~89%
Seventh 2,357 ~89%
Eighth 2,139 ~89%
Ninth 1,977 ~87%
Tenth 1,329 ~81%
Eleventh 2,066 ~82%
First language has already been described in detail in Chapter 3 in the “discussion of the
participants” section. The single largest group was the Spanish speakers, which accounted for
about 81% of the total population. This study looked specifically at Spanish speakers and then
grouped all other languages into an ‘other’ category. The last demographic variable was the
Gender of the participants. Overall, there was a little over half the population that was male
(53%). Table 61 shows the exact information as well as the percentage of the population that is
male for each grade, as well as overall.
Table 61: Demographic Variable: Gender by grade
The demographic information allowed the research to look at how these different
variables performed during testing to see if there were any differences. The scores were analyzed
using this demographic information as well as the grade level and total language proficiency
level of the students. Pairs were also made of the different demographic variables, and were
analyzed to see if having membership in both demographic groups influenced scores differently
than not having membership.
Third Fourth Fifth Sixth Seventh Eighth Ninth Tenth Eleventh Total all Grades
Male 2212 2173 1900 1651 1378 1279 1263 922 1357 14135
Female 2088 1936 1719 1523 1284 1111 1000 716 1151 12528
Total 4300 4109 3619 3174 2662 2390 2263 1638 2508 26663
% of Male 51% 53% 53% 52% 52% 54% 56% 56% 54% 53%
136
The outcomes of Kansas content area assessments for Mathematics, Reading, and Science
for ELLs
The general outcomes of the ELLs that took content assessments were that language
proficiency made a difference in a students’ ability to meet standards on their content
assessments. The language proficiency category was significant at all grade levels in all content
areas (Pr > F <.0001), except ninth grade Reading, which was 0.0040 and still significant. There
were only three times when language proficiency was not an indicator of overall student
performance (ninth grade Math, fourth grade Science, and ninth grade Science). Overall, the
Beginning level students did the worst on their content assessments, and the scores for the
students went up on their content assessment scores as their language proficiency level went up,
with Fluent students performing the best on their content assessments. Interestingly, standard
deviations also were influenced by the language proficiency. In all but eighth, ninth, and tenth
grade Reading, and ninth grade Math and Science, the standard deviations were highest for
Beginning level students and got lower as the levels went up with Fluent students performing the
most similarly (having the lowest standard deviations).
The largest Estimate value was the category of Beginning to Fluent in all but ninth grade
in all content areas. The next largest estimate values were Beginning to Advanced (twelve times)
and then Intermediate to Fluent (eleven times). The lowest estimates were in Advanced to Fluent
(nine times) and Beginning to Intermediate (nine times). This data supports the original
hypothesis that larger differences would be present in the high-to-low combinations (Beginning
to Advanced, Beginning to Fluent, and Intermediate to Fluent) and the smaller differences would
be the categories next to each other (Beginning to Intermediate, Intermediate to Advanced, and
Advanced to Fluent).

137
The extent the KELPA predicts students’ scores on content assessments
The KELPA score was found to have predictive qualities for all the content assessments.
In the fourth grade Science assessment, there was a 64% difference in the number of students not
meeting the standard. In seventh grade Science, that went up to a 71% difference. In Math, in
third grade, there was a 58% difference, in fourth, 60%, in fifth, 64%, in sixth, 72%, in seventh,
69%, in eighth, 60%, in ninth, 22%, in tenth, 53%, and in eleventh, 36%. This shows a
substantial difference between the numbers of students not meeting standards based just on their
language proficiency level. In Reading, similar results were found. In third grade, there was a
62% difference in the number of students not meeting standards, in fourth, 68%, in fifth, 71%, in
sixth, 74%, in seventh, 70%, in eighth, 71%; there were no Beginning students in ninth grade, in
tenth, 62%, and 39% in eleventh. Reading shows the highest influence of proficiency on content
score.
The effects of proficiency level on content assessment scores across grade levels
Overall, the ELLs who took the content assessments were influenced by the language
proficiency category they were in. Those categories were Beginning, Intermediate, Advanced,
and Fluent. At all grade levels, p = <.0001 and was found to be significant. This means that the
null hypothesis has been rejected and the proficiency level does play a role in the all areas
content score. The R-Square for these grades was not always the same, so differing amounts of
the score are attributed to the fitness of this model. The model fit the best for Reading and
overall the worst for Science. In general, the model fit the lower grades better than the higher
grades. Ninth grade was an issue for all the content areas due to the low number of participants.
Higher grades could have more linguistically demanding tests (Wolf & Leon, 2009), which could
explain some of the variance and model fit issues.
138
The role of demographic variables (such as exceptionality, Free and Reduced Lunch, first
language, number of years in U.S., Gender, or total language proficiency category) on
content assessment scores
There were six individual variables (exceptionality, Free and Reduced Lunch, first
language, number of years in the U.S., Gender, or total language proficiency category) and
fifteen two-way pairs (total language proficiency category and exceptionality, first language and
years, Gender and exceptionality, total language proficiency category and language, first
language and Gender, total language proficiency category and Free and Reduced Lunch, number
of years in the U.S. and exceptionality, total language proficiency category and Gender, Free and
Reduced Lunch eligibility and Gender, Free and Reduced Lunch eligibility and first language,
Free and Reduced Lunch eligibility and number of years in the U.S., Free and Reduced Lunch
eligibility and exceptionality, Gender and number of years in the U.S., total language proficiency
category and number of years in the U.S., first language and exceptionality) that were analyzed.
Some demographic variables were found to have high predictability of students’ scores. The best
predictor was the students’ Total Proficiency Category, which was significant in all but ninth
grade Reading. This area was found to be significant 96% of the time. The next best predictors
were Exceptionality and Total Proficiency Category, Number of Years in the U.S. and Total
Proficiency Category, First Language and Total Proficiency Category, and the Number of Years
in the U.S. These areas were found significant between 57% and 32% of the time. The rest of the
variables were found to have low significance (below 30%). They were not as good at predicting
the content area assessment scores in general. There were some demographic variables that were
able to predict well for one content area, such as for Math, eligibility for Free and Reduced
Lunch and First Language was significant about half the time (56%), Gender was significant a

139
little less than half the time (46%), and First Language was significant over half the time (57%);
for Science, the Number of Years in the U.S. and First Language were significant a little under
half the time (43%) and Number of Years in the U.S. and eligibility for Free and Reduced Lunch
was significant over a third of the time (40%); and for Reading, Exceptionality code was
significant about half the time (56%) and Number of Years in the U.S. and Exceptionality code
was significant over half the time (57%). Interestingly, there were no combinations of
demographic variables that were not significant at all. In the following discussion specific
demographic variables estimates will be discussed. The estimate reflects the estimated
difference that demographic variable has on the score of the test taker and has to be used to
provide the amount of score influence that demographic variable represents. All variables except
Number of Years in the U.S. and Total Proficiency Category are binomial variables. Total
Proficiency Category is ordinal and represents the language proficiency category as determined
by the KELPA. The number of years is a number from 0-18 based on the number of years the
student has been in the U.S. All estimates for this variable would have to be multiplied by the
actual number of years.
It is important to note that of the top five demographic variables and their interactions,
Total Proficiency Category was involved four times. It is clear from this that Total Proficiency
Category is significant in predicting students’ scores on their content assessments. Total
Proficiency Category showed that Beginning students did the worst, while Fluent students did
the best on their content assessments. The example from seventh grade showed that a Beginning
student in Reading would subtract 51 points from what a Fluent student would perform (if all
things were kept equal except the language proficiency level). The difference was the most
pronounced in Reading; Math and Science seemed to be less influenced by proficiency. Math

140
and Science, though less influenced, were still significant. In the seventh grade example, in
Math, 42 points would be removed from a Beginning student from what a Fluent student
performed, and for Science, 39 points would be removed.
Exceptionality and Total Proficiency Category was the next most significant interaction.
This interaction was found significant 13 times. Overall for Beginning students the relationship
was positive with only two instances of scores going down (seventh grade Science and Tenth
grade Reading). It is interesting to note that as proficiency went up those with IEPs tended to do
worse. An example from fourth grade is that a Beginning student in Math would add 12 points
over what a Fluent student scored, in Reading they would add 17 points, and in Science they
would add 10 points. It is interesting to note that if that same example were done with an
Advanced student in Math they would add 1 point, in Reading they would subtract 1 point, and
in Science they would subtract 2 points. While these are small numbers they still show that those
students with IEPs do better at the lower proficiency levels
Number of Years in the U.S. and Total Proficiency Category was the next most
significant interaction. This interaction was found significant 10 times. Overall for Beginning
students the relationship in Reading is positive. In Math and Science it is much more mixed
between positive and negative. This interaction was not significant in any one grade in all three
content areas.
First Language and Total Proficiency Category also had 10 interactions that were
significant. In all but one grade (eleventh grade Reading) the Beginning students had a positive
influence from their language proficiency for speakers of Spanish. There were only 7 instances
total that had negative influence (fifth grade Math, Advanced proficiency, seventh grade Math,
Intermediate and Advanced proficiencies, eighth grade Math, Advanced proficiency, and
141
eleventh grade Math, Advanced proficiency; eleventh grade Reading, Beginning and
Intermediate proficiency). For an eleventh grade example at the Beginning proficiency level a
Spanish speaker would add 9 points to Math, lose 2 points in Reading, and add 6 points in
Science compared to a Fluent proficiency student.
The Number of Years in the U.S. variable showed a negative influence on Math scores. In
Math it was significant three times, with all three instances being negative. In Reading, it was
only significant one time and had a positive influence. In Science, this variable was significant
three times, twice it was a negative influence and once was positive. This demographic variable
had the most influence on Math and Science scores, and it was a negative one (other than
eleventh grade Science).
Based on these results, it is clear that students’ performance on content assessments can
be influenced by these demographic variables. The pair variables took elements from both the
single variables and their pair relationship. Anytime a student’s score can be significantly altered
by membership in a group, it might be time to look more carefully at what we are testing, how
we are testing, and what we are doing with the scores.
Total Language Proficiency Category is clearly a very strong predictor of student
performance. This is clear from this analysis as well as the analysis of earlier research questions.
This has validity implications for using these tests with the ELL population, especially at the
lower proficiency levels.
Validity
Validity theory requires that a test measures what it is supposed to, therefore claims, to
measure. This is complicated when the language of the assessments is not part of the construct
but has a bearing on the results, such as with the population of students learning English. The
142
content assessments are administered in English in Kansas unless the language of instruction was
not English, in that case, a test can be administered in the language of instruction. The need to
ensure that the tests measure what they claim to measure is an issue of equitable results. The
results need to be accurate to the individual no matter their group membership (La Celle-
Paterson & Rivera, 1994). A potential solution to this issue for the ELL population would be to
include a minimum English language proficiency requirement as part of the test construct. This
would improve the validity of using these tests with ELLs. This would also have to be addressed
in the accountability of test scores as well to improve the validity of test score use.
In 2008, Rabinowitz suggested three questions as part of the Category I studies of
validity. “How strong should the relationship be between ELP level and content mastery?” as
proficiency goes up, content test scores should also go up. This study found that to be true.
Tables 25 through 29 show the relationship for Math, Tables 30 through 34 show the relationship
for Reading, and Tables 35 and 36 show the relationship for Science. It is clear from looking at
the tables that the higher proficiency levels do better on their content tests. This is grade-
dependent, with the lower grades having the clearest connection. This could be, in part, due to
the increased content requirements as the standards go up.
The second question Rabinowitz (2008) posed was, “Should the relationship between
ELP levels and content mastery differ by content area?” (p. 24), i.e. Reading would be more
influenced by language proficiency than Math. Again, this study found this to be true. More
students did not meet standards in Reading at the lower proficiency levels than they did Math.
Tables 29 and 34 illustrate the percentages of students not meeting standards for Reading and
Math. Science is more difficult, since not all the grades took the Science assessment. However, a
143
comparison of just the fourth and seventh grades would show that Reading was still the most
closely linked to language proficiency groups.
The third question Rabinowitz (2008) posed was, “Should the relationship between ELP
levels and content mastery differ by language group (or other demographic indicators)?” (p. 24).
This study found that several demographic variables were significant in determining placement.
Total Language Proficiency Category was the most important, with the interaction of Total
Language Proficiency Category and Exceptionality Code next, as can be seen in Tables 39 and
40.
Findings related to previous research
The findings of this study support much of the previous research in the field. It is
important to note that a difference between this and a number of other previous studies is that the
ELL population was categorized by proficiency level rather than treated as a single subgroup.
(Wolf et al., 2008a) This study also considered demographic variables. Pappamihiel and Walser
(2009) advocate the inclusion of demographic variables including the number of years in the
U.S., English language proficiency, and socioeconomic status (SES) among others. While there
is no real direct measure of SES, we can use the eligibility for Free and Reduced Lunch as a tool
to view SES. Abedi (2001) indicated the inclusion of demographic variables as well, including
Gender, Free and Reduced Lunch eligibility, and the student’s disability status, or exceptionality
code in this dataset. These demographic variables were included in the study to determine if they
accounted for any score discrepancies among students.
The major findings of this study are that language proficiency influences a student’s
content assessment score. The proportion of students meeting standards and not meeting
standards depends on language proficiency; language proficiency can be used to predict student
144
performance on their content assessments, so can certain demographic variables. Overall, this
illustrates a clear picture of the power of language proficiency in student test scores. Baker
(2011) found similar results in Georgia, where performance on the language assessment showed
positive relationships with Reading, and Math.
The idea that language proficiency influences the content assessment scores of students is
not new (Neill, 2005; Giambo, 2010; La Celle-Paterson & Rivera, 1994; Young, 2009;
McNamara, 2011; Menken, 2010; Abedi, 2004; Abedi, 2008; Abedi & Gandara, 2006). One
necessity in testing is comparability of participants’ results. This use of comparability, or
comparative validity, is implying that students should perform similarly on their content
assessments regardless of their inclusion in a subgroup (Young 2009). If students are of different
proficiency levels, then that comparability is diminished (Katz, Low, Stack, & Tsang, 2004;
Rabinowitz, 2008). If we are not able to compare ELLs and non-ELL assessment scores (which
has been found through the extensive research on the proficiency gap between ELLs and non-
ELLs (Abedi, Hofstetter, & Lord, 2004; Abedi, Lord, Boscardin, & Miyoshi, 2001; Butler, Orr,
Bousquet Gutierrez, & Hakuta, 2000; McNamara, 2011; Menken, 2010; O’Conner, Abedi, &
Tung, 2012)), and we can’t compare ELLs to each other–as this research has found,–where does
that leave us? Students that are ELLs are likely to underperform compared to their non-ELL
peers on standardized tests of content (Abedi, 2001; Giambo, 2010; McNamara, 2011; Menken,
2010; Rabinowitz, 2008). The results from this study conform to this idea by indicating that the
groups with higher ELP will perform better on their standardized content assessments.
Rabinowitz (2008) also indicates that English language arts should be more difficult for ELLs
than Math tests. The data supports this, but not as much as one would expect. Overall, the extent
of influence of content areas was uniform. There was increased difficulty in Science and Math as
145
the grades went up, which corresponds to the increase in content knowledge required to
accomplish the tasks.
The proportion of students meeting standards and that of students not meeting standards
depends on their language proficiency. This is contrary to Thakkar’s (2013) findings, which
suggested that the scores were “not significantly related” (p. 114). This could be, in part, due to
the design of the tests. If academic English is being accurately taught and tested, then higher
language proficiency scores should mean higher content assessment scores. This study found that
the higher the language proficiency, the better chance a student has of meeting standards in their
content assessments. Abedi and Gandara (2006) found that ELLs performed well below the 50th
percentile in Reading and Math, while non-ELLs performed at the 50th percentile. If a student is
higher in language proficiency, then their odds of meeting standards also goes up. Fry (2007)
found that ELL students were well behind their non-ELL peers in Reading and Math. An
interesting finding of this research was that not all interactions of the Total Language Proficiency
Category were very significant in the prediction of test scores. Gender and Total Language
Proficiency Category, which was significant 17% of the time, and eligibility for Free and
Reduced Lunch and Total Language Proficiency Category, which was significant 14% of the
time. The results of this section of the research are in some ways the most interesting and unique.
Despite searching for similar studies, no other research study with similar implications was
found.
Language proficiency can be used to predict the content assessment scores of students.
This is reflected well in the first two research questions in this study. If a student’s score goes
down because of his or her language proficiency, then the possibility to predict scores based on
their language proficiency is higher. Rabinowitz (2008) suggests that Math and Reading content
146
scores have a certain amount of predictability based on language proficiency. This predictability
is higher in Reading than Math. Abedi (2001) supports the idea that Reading would be more
influenced by language proficiency, because it has a higher demand on the language skills of the
test taker. He found that the ELL status of students is connected with their test scores by carrying
out multiple regressions. This supports the idea suggested by Menken (2010) and Solano-Flores
(2008) that all tests administered to ELLs are, in a way, tests of their language proficiency. In
this analysis, multiple linear regressions were conducted for each grade level, content area, and
language proficiency group. While the results do indicate an opportunity for prediction, there
was extreme variance in the population. This led to inflated Mean Square Errors (MSEs), and
inhibited the value of the results. Where predictability was found, Reading had the highest R-
square values indicating that the largest portion of the variance was explained with the language
proficiency group.
Demographic variables can be used to predict students’ content assessment scores as
well. Young (2009) discusses the idea of “differential validity” (p. 123), which is testing for
validity in different subgroups. In this research, the different groups are based on demographic
variables and combinations of demographic variables. Abedi (2001) found that ELL students
identified as having disabilities did not perform as well as those who did not have disabilities in
tenth and eleventh grade. In this study, interestingly, the single demographic variable that
performed the best was Total Proficiency Category, which had a great deal of impact on test
scores. The lower the proficiency, the more points would be removed from the score. The
number of years in the U.S. had a mostly negative impact on student performance in Math and
Science, but positive in Reading which supports the findings of Thakkar (2013). This could be
because as the years go up so do the linguistic demands. It could also be due to the content

147
knowledge difficulty level increasing as the grades increased and built across the grades. This
could explain why Reading did not experience the same negative impact. The percentage of the
test variation that this variable influenced for Math was no larger than 33%, and as low as 31%.
Those identified as having an IEP were the next variable, which included learning disabled,
gifted, and all other disabilities and disorders, in Reading (with one instance in Science at the
seventh grade). Use of disability as a demographic variable for prediction was also found in
Baker (2011); but in Thakkar (2013), no perceptible score differences appeared. Gender was not
found to be a major factor in predicating performance, and this would be supported by research
about Gender performance in general on state content assessments (CEP, 2010a p. 2). Overall,
boys performed better than the girls did in Math, which supports the results of the Baker (2011)
study. There were no obvious patterns for when Gender had an impact on student scores except
that there were more instances of significance in Math.
Recommendations to Interested Parties
Based on the data analysis in this study, it became clear that ELL students’ content
assessment scores are influenced by their language proficiency. Legal compliance with the
NCLB requires that all students be tested, but maybe how they are tested and how those scores
are used needs to be evaluated again. Forcing students to take a test that they know they will do
poorly on can increase test anxiety, which can cause students to perform poorly on tests
(Backman & Palmer, 1996; McKay, 2000; Yan & Horwitz, 2008; Zeidner, 1998). Test anxiety
can have a negative impact on test performance (Rezazadeh & Tavakoli, 2009; Backman &
Palmer, 1996); as anxiety goes up, test scores go down. The pertinent question here is whether it
is worth testing students that stand an 83% chance of failing. Is there something that can be done
to the tests to improve these odds? Is there something to be done about how the tests are used

148
that can help this situation? The next sections provide recommendations to interested parties,
such as the federal department of education, states, schools, and teachers, and suggest some
potential answers to the aforementioned questions. Some of the recommendations in the
following sections are not directly connected with the analysis done in this study. While not
directly connected teachers and test scores are connected in terms of accountability. This allows
connections between how the students are performing and teacher preparation for working with
this population to be made. Abedi and Herman (2010) indicate that the ELL population is the
most likely to have unqualified teachers. If we accept that this is the case, a portion of the
problems with improving proficiency might be solved by improving the teacher training.
Recommendations for the federal government. The federal government passed the
NCLB legislature originally to ensure that students were given equal opportunities to learn and
grow. It has implications far beyond that, especially for a population like ELLs. The federal
government needs to be the first to evaluate research in this area and advocate for more research
to be conducted. They should want to get the clearest picture of this population and then
reevaluate how to test, when to test, and how to use the scores. In the United States, there is a
claim that we educate everyone (Equal Educational Opportunities Act of 1974), including ESL
students. We need to show that. The section that deals specifically with ELLs is 1703(f) and it
might be time to review and add to this section. Right now there is no specific language program
requirements but rather the act requests the use of “sound educational theory” (Civil Rights
Division Educational Opportunities Discrimination page) which is rather vague. It might be time
to be more specific about how this population will be taught, tested, and how the teachers should
be prepared. It might also be time to consider a federal standard for all teachers who work with
ELLs in school.

149
The current research shows that it is not valid to include all English proficiency levels in
schools assessments and accountability. English proficiency should be a factor in deciding
whose test scores count towards accountability for the school. Beginning students performed
poorly in all grades and contents, and not including their scores in accountability would be a
positive step in policy change. More studies need to be conducted to determine if Intermediate
students should be included for accountability or not. More studies need to be conducted looking
at ELLs based on their language proficiency, and then comparing them to Native speakers across
grade levels to see if there are proficiencies that should not be used for accountability, due to
validity concerns. It is clear that there is a link between English proficiency and content
assessment performance. This needs to be included in future federal education acts and
decisions about this population.
Currently, states can apply for waivers of accountability. Kansas was granted a first
round Waiver (CEP, 2012). Waivers modify requirements, and can be renewed if desired. It is
important to note that obtaining a waiver does not mean that students are not tested, but it refers
to the process that occurs when their test scores are used for accountability. The current waiver is
set to expire this year in 2015, and with the advent of the Common Core State Standards, testing
may be redesigned (CEP, 2012). As the curriculum is codified, it seems logical that assessments
would also be standardized, which could make studies across states easier. Based on the findings
in this research, it is clear that a more unified approach to ELL education and assessment is
needed to ensure that this population is being treated equitably.
Recommendations for states. The first recommendation for the state of Kansas is to
amend 91-1-209(f) (2) in the Regulations and Standards for Kansas Educators (p. 26) and add
ESOL. This would require all teachers to complete coursework to receive an ESOL
150
endorsement. Requiring coursework in methodology and theory for working with ELLs would
help prepare teachers who are expected to show that their students have made progress in
English language proficiency (Title III). Another recommendation would be to have states
collaborate more with the federal government. As we move toward a unified federal education
outline, it makes sense to move to a federal system for testing, rather than relying on states to
create or purchase their own. Having all tests administered in the same manner and with the
same accommodations and timeline would help with consistency, especially for the transient
ELL population. It is also important for the states to be aware of the size of the ELL population,
and to locate where it is concentrated in the state. As funding decisions can be based off student
test scores, it is important not to discriminate against a school that is primarily ELL if they have
lower test scores. State educational agencies (SEAs) are required to work with school districts to
ensure that the language proficiency of ELLs does not prevent them from participating equally in
school programs (U.S. Department of Justice). Section 1703(f) specifically deals with ELLs and
with the expectations of the government.
Recommendations for schools. Schools face the challenge of accountability. They have
the responsibility to test and report all the students. They also have to manage all the teachers. It
is important that teachers have the proper training and credentials, for both their content area and
ESL education. Schools should ensure that they hire qualified candidates. This might mean
requiring coursework in ESOL rather than accepting a state endorsement alone. For those
teachers who are already employed by the school, they should be offered training and
development, to ensure they are qualified, both in their content as well as ESL theory and
methodology. Téllez and Waxman (2006) indicate that teachers should receive appropriate
professional development from their schools. This is not easy, but all students have the right to

151
quality education. The lack of teachers with the proper qualifications fails to offer quality
education to those who need these services. As this population is growing, it cannot be ignored in
the hiring and development offerings of schools. This may have the most profound impact in
high school. The data from this study suggests that there is a difference between students at the
elementary and high school levels regarding meeting standards, with more elementary and
middle grade level students meeting standards. Part of this difference might be because the
content is harder at the high school level. Part of the difference might be because elementary
teachers are better prepared to work with ELLs, having had coursework in sheltered instruction
and content-based instruction. This is an area that will require more research to explain.
Recommendations for teachers. Teachers face the difficult job of carrying out the
testing required for NCLB. They know the abilities of their students the best, and they know their
students’ mindsets better than anyone in the school does. The teachers could be allowed more
time for testing and test preparations, to help lower the anxiety level of the students. This might
mean making individual accommodations for low proficiency students, such as additional time
for taking tests or having additional help during the testing window to assist with testing and
teaching. Teachers need to be properly trained to work with the ELL population. Title III is
designed to ensure that students are improving their English language ability. Teachers are the
first contact that students have and they are the ones that help and guide them on their path to
acquiring English. In order to claim that ELLs are being given the opportunity for learning,
English teachers need to understand best practices and the theory behind them. Currently in
Kansas to qualify for an ESOL teaching endorsement, all a candidate has to do is pass the ESOL
Praxis test and have a valid teaching license for the state (J. Ewing, personal communication,
October 8, 2015). Having the proper training in their content area positively correlates with

152
students’ test scores (Hayes et al., 2002). Teachers who go through ESOL teacher education
programs understand the content-based instruction and sheltered instruction methodologies,
which prepare students to be better aligned with the content tested through development of
academic language and content knowledge. Teachers who work with this population should take
classes and receive proper training in ELLs as well as their content area licensure. This should
also not be limited to content area teachers. All teachers need training in ESL methods and
theory, if they are going to work with ELLs. In addition, if ELLs are being pulled out and taught
in ESL classrooms, then those teachers need to have credentials in the content that they teach.
Having qualified teachers working with this population could improve students’ scores and
preparations. The research in this study shows that low proficiency students performed poorly
on their content assessments fairly uniformly. The teachers that work with these students should
advocate for alternative testing of low English proficiency students as well as how the scores
from this population are used. They should be part of the solution by working on alternative
testing methods that will reflect a student’s content knowledge rather than as a reflection of their
English language ability.
Limitations of the study and future research
This study had a number of limitations. As a quantitative study, the first limitation is that
this study can only tell part of the story. It can tell a limited version of what happened. It cannot
answer the bigger questions of why it happened. Students’ performance on the KELPA and the
content assessments are just a couple of instances of their learning at one set point in time, and
may not necessarily reflect their knowledge of English or their actual academic knowledge. This
research only provides this one view of the situation. A future approach would be to include a
longitudinal study, and include other test data (both from other norm referenced tests, as well as

153
student classroom assessments and formative assessments). Another limitation is that the data
represents only one state, in this case, Kansas. The data from one state may not be wholly
generalizable to any other state or area. This dataset also only represents one years’ worth of data
(2009–2010) and may have anomalies that would not exist in other years, or with multiple years
making up the dataset. The positive aspect to using data from 2010 is that all students were
required to take the test; there were no options to choose against participating offered to students.
A potential solution to these issues for future research would be to include multiple states in the
analyses, and to move to a longitudinal analysis.
Another limitation was the amount of variance in the data itself. Young, Holtzman, and
Stinberg (2011) found that, “ELLs had the largest score variability” (p.9), therefore, a portion of
the score variance might come from the ELLs themselves. Since this is a very large dataset, there
was a great deal of variance. This could be because of the language ability, but it could also be
from any number of non-analyzed variables not limited to the students’ interest, such as how
they were feeling on the test day, how the test was administered, what time of day, to name a
few. This is controlled for in reliability testing, Peyton conducted reliability measures on the test
in 2009, and found that the coefficients ranged from 0.61 for the Listening domain to 0.92 for the
Speaking domain across all forms (Peyton et al., 2009). The variance could not be controlled for
in the regression, which created difficulties with the analysis and interpretation of results. More
time needs to be spent to study if there was an additional variable that could help control for
some of the variance, such as district, school, testing dates, and duration of time in school, time
spent with the same teacher or any other variables that might have decreased the variance. The
recommendation for the future would be to test variables, and see if they help with the variance.
The most logical place to start would be with district information (which was not included in the
154
dataset received for this study). This poses its own challenge, as that information is often
difficult to obtain from a state agency, as it could potentially identify the participants. A variety
of variables should be tried to attempt to diminish the variance in the dataset. If this is not
possible, then an attempt to explain why there is so much variance would be a possible direction.
Another suggestion for future research involves the inclusion of native speaking students
content test scores. In order to determine the proficiency levels of ELLs that are valid to assess,
it is important to compare the proportions of students that are meeting standards and those that
are not to the same grades native speaking students. From this analysis it is clear that the
Beginning level is not being assessed validly, but the other proficiency levels are more difficult
to address with just one years’ worth of data from only ELLs. It would be best to get a few
years’ worth of data from ELLs and native speaking students across the grade levels. Do the
analysis in this study of all the data (looking at the proportion of native speaking students that
meet standards and don’t meet standards) and then using the proportions from the native
speaking group, find the proficiency levels of ELLs that are performing similarly. Any group
that is performing similarly or better than the native speaking students would be tested and used
for accountability.
The final major limitation to this study is a limitation to validity theory itself, since
English knowledge can affect content assessment scores, it is possible that the scores reported for
the content assessments will not reflect the current knowledge of the students (Abedi, 2008;
Cook, 2011; Winter, 2011). This study attempted to look at the relationship between content
assessments and the language proficiency assessment, but assessments do not always accurately
indicate the knowledge of the participants. According to La Celle-Paterson and Rivera (1994),
some ELLs have the content knowledge, but are unable to convey this knowledge through their
155
limited English speaking or writing skills. The findings of this study also show that English
language proficiency is a major factor in content test performance. That is not to say that low
English proficiency means low Math content knowledge, but low English proficiency makes it
difficult or even impossible to show Math content knowledge in testing. Various factors are
responsible for the development of language proficiency and content knowledge in ELLs
(Lindholm-Leary & Borsato, 2006). It would be very difficult to include all the factors in any
testing situation, as it would be difficult to include all aspects of the test usefulness model
(Bachman & Palmer, 1996). The goal is to include as many factors in the testing situation as
possible and clearly English language proficiency needs to be a factor.
Final Thoughts
The research presented in this paper shows that English language proficiency had a
significant influence on content assessment scores for the 2009-2010 school year in the state of
Kansas. As the grade level went up, the percent of students not meeting standards also went up.
Students who were considered Fluent performed the best on all content assessments. Students
who were considered Beginning performed the poorest on all content assessments. Like in
previous research, Reading was the most influenced skill, but Math and Science were also
impacted. This research shows a clear relationship between English language proficiency and
content assessment scores for all three content areas examined (Reading, Math, and Science).
When constructing future tests, it would be worth thinking about how we could lower the amount
of linguistic demand in content assessments that should be separate from English language
ability, such as Math and Science. In addition to how tests are constructed, how they are
administered and interpreted must be taken into consideration. All tests that assess ELLs need to
have English language ability as a part of the construct, clearly indicating the relationship with
156
the content measure. All teachers that work with ELLs should receive training in how to work
with this population, and the state of Kansas should consider changing its practice of accepting
the Praxis test results as the only requisite for obtaining a valid ESOL endorsement. The only
way to accurately measure what these students know is to find a way to look beyond their
English knowledge. It is the responsibility for everyone involved in the measurement of this
group to make sure they are treated fairly.

157
References
Abedi, J. (2001). Validity considerations in the assessment of LEP students using standardized
achievement tests. Paper presented at the Annual Meeting of the American Educational
Research Association (Seattle, WA, April 10–14, 2001). Retrieved from
http://files.eric.ed.gov/fulltext/ED455293.pdf [Accessed March 4, 2013]
Abedi, J. (2004). The No Child Left Behind Act and English Language Learners: Assessment
and accountability issues. Educational Researcher, 33 (1), 4–14.
Abedi, J. (2005). Issues and consequences for English Language Learners. Yearbook of the
National Society for the Study of Education, 104(2), 175–198.
Abedi, J. (2007). High-stakes tests, English Language Learners, and Linguistic Modification.
Sunshine State TESOL Journal, 6(1). Retrieved from
http://sstesoljournal.org/Abedi%20SPR%202007.html [March 2, 2012]
Abedi, J. (2008). Measuring Students’ Level of English Proficiency: Educational Significance
and Assessment Requirements. Educational Assessment, 13(2), 193–214.
Abedi, J., Bailey, A., Butler, F., Castellon-Wellington, M., Leon, S., & Mirocha, J. (2005). The
validity of administering large-scale content assessments to English language learners:
An investigation from three perspectives. (CSE Technical Report 663). Los Angeles:
University of California, National Center for Research on Evaluation, Standards, and
Student Testing (CRESST). Retrieved from http://files.eric.ed.gov/fulltext/ED492891.pdf
[Accessed March 5, 2011]
Abedi, J., & Gandara, P. (2006). Performance of English Language Learners as a subgroup in
large-scale assessment: Interaction of research and policy. Educational Measurement:
Issues and Practices, 26(5), 36–46.
158
Abedi, J., & Herman, J. (2010). Assessing English Language Learners’ opportunity to learn
mathematics: Issues and limitations. Teachers College Record, 112(2), 723–746.
Abedi, J., Hofstetter, C., & Lord, C. (2004). Assessment accommodations for English language
learners: Implications for policy-based empirical research. Review of Educational
Research, 74(1), 1–28.
Abedi, J., Leon, S., & Mirocha, J. (2000/2005). Examining ELL and non-ELL student
performance differences and their relationship to background factors: Continued analyses
of extant data. In The validity of administering large-scale content assessments to English
language learners: An investigation from three perspectives (CSE Rep. No. 663, pp. 1–
45). Los Angeles: University of California, National Center for Research on Evaluation,
Standards, and Student Testing (CRESST). Retrieved from
http://files.eric.ed.gov/fulltext/ED492891.pdf [Accessed March 5, 2011].
Abedi, J., Lord, C., Boscardin, C. K., & Miyoshi, J. (2001). The effects of accommodations on
the assessment of limited English proficient (LEP) students in the National Assessment of
Educational Progress (NAEP). Los Angeles: University of California, Los Angeles,
National Center for Research on Evaluation, Standards, and Student Testing, Center for
the Study of Evaluation, Graduate School of Education and Information Studies.
Albus, D., Klein, J. A., Liu, K., & Thurlow, M. (2004). Connecting English language
proficiency, statewide assessments, and classroom proficiency (LEP Projects Report 5).
Minneapolis, MN: University of Minnesota, National Center on Educational Outcomes.
Aud, S., Hussar, W., Planty, M., Snyder, T., Bianco, K., Fox, M., Frohlich, L., Kemp, J., &
Drake, L. (2010). The Condition of Education 2010 (NCES 2010–028). National Center
159
for Education Statistics, Institute of Education Sciences, U.S. Department of Education.
Washington, DC.
American Educational Research Association, American Psychological Association, and the
National Council on Measurement in Education. (1999). Standards for educational and
psychological testing. Washington, DC: American Educational Research Association.
Bachman, L. F. (2004). Statistical Analysis for Language Assessment. Cambridge: The
Cambridge University Press.
Bachman, L. F. (2005). Building and supporting a case for test use. Language Assessment
Quarterly, 2(1), 1–34.
Bachman, L. F., & Palmer, A. S. (1996). Language testing in practice: designing and developing
useful language tests. Oxford: Oxford University Press.
Bailey, A. L. (2000/2005). Language analysis of standardized achievement tests: Considerations
in the assessment of English language learners. In The validity of administering large-
scale content assessments to English language learners: An investigation from three
perspectives (CSE Rep. No. 663, pp. 79–100). Los Angeles: University of California,
National Center for Research on Evaluation, Standards, and Student Testing (CRESST).
Retrieved from http://files.eric.ed.gov/fulltext/ED492891.pdf [Accessed March 5,, 2011]
Bailey, A. L., Butler, F. A., & Abedi, J. (2005). General discussion and recommendations. In The
validity of administering large-scale content assessments to English language learners:
An investigation from three perspectives (CSE Rep. No. 663, pp. 101–109). Los Angeles:
University of California, National Center for Research on Evaluation, Standards, and
Student Testing (CRESST). Retrieved from http://files.eric.ed.gov/fulltext/ED492891.pdf
[Accessed March 5, 2011]

160
Bailey, A. L., & Huang, B. H. (2011). Do current English language development/proficiency
standards reflect the English needed for success in school? Language Testing, 28(3),
343–365.
Baker, M. (2011). A critical examination of the relationship between student performance on
assessments of English language proficiency and academic achievement. Dissertations,
Thesis and Capstone Projects. Paper 474. Retrieved from
http://digitalcommons.kennesaw.edu/etd [Accessed September 22, 2014]
Beal, C., Adams, N., & Cohen, P. (2010). Reading proficiency and mathematics problem solving
by high school English language learners. Urban Education, 45(1), 58–74.
Brown, H. D., & Abeywickrama, P. (2010). Language assessment: Principles and classroom
practices. White Plains, NY: Pearson Education Inc.
Bunch, G., Shaw, J., & Geaney, E. (2010). Documenting the language demands of mainstream
content-area assessment for English learners: Participant structures, communicative
modes and genre in science performance assessments. Language and Education, 24(3),
185–214.
Butler, F., & Castellon-Wellington, M. (2000/2005). Students’ concurrent performance on tests
of English language proficiency and academic achievement. In The validity of
administering large-scale content assessments to English language learners: An
investigation from three perspectives (CSE Rep. No. 663, pp. 47–77). Los Angeles:
University of California, National Center for Research on Evaluation, Standards, and
Student Testing (CRESST). Retrieved from http://files.eric.ed.gov/fulltext/ED492891.pdf
[Accessed March 5,, 2011]

161
Butler, Y. G., Orr, J. E., Bousquet Gutierrez, M., & Hakuta, K. (2000). Inadequate conclusions
from an inadequate assessment: What can SAT-9 scores tell us about the impact of
Proposition 227 in California? Bilingual Research Journal, 24(1/2), 1–14.
Cakir, M. (2012). Epistemological dialogue of validity: Building validity in educational and
social research. Education, 132(3), 664–674.
Center on Education Policy (CEP). (2011a). State test score trends through 2008–09, Part 4: Is
achievement improving and are gaps narrowing for title I students? Washington, DC:
Author. Retrieved from dc.org/publications/index.cfm?selectedYear=2011[Accessed
June 17, 2015]
Center on Education Policy (CEP). (2011b). State test score trends through 2008–09, Part 4: Is
achievement improving and are gaps narrowing for title I students? Kansas. Washington,
DC: Author. Retrieved
http://www.cep-dc.org/publications/index.cfm?selectedYear=2011 [Accessed June 17,
2015]
Center on Education Policy (CEP). (2010a). State test score trends through 2007–08, Part 5: Are
there differences in achievement between boys and girls? Washington, DC: Author.
Retrieved from http://www.cep-dc.org/publications/index.cfm?selectedYear=2010
[Accessed June 17, 2015]
Center on Education Policy (CEP). (2010b). State test score trends through 2007–08, Part 6:
Has progress been made in raising achievement for English language learners?
Washington, DC: Author. Retrieved from http://www.cep-
dc.org/publications/index.cfm?selectedYear=2010 [Accessed June 16, 2015]

162
Center on Education Policy (CEP). (2012). What impact will NCLB waivers have on the
consistence, complexity and transparency of state accountability systems. Washington,
DC: Author. Retrieved from
http://www.cepdc.org/publications/index.cfm?selectedYear=2012 [Accessed June 16,
2015]
Civil Rights Division Educational Opportunities Discrimination page. (n.d.). Washington, DC:
Author. The United States Department of Justice. Retrieved from
http://www.justice.gov/crt/about/edu/types.php [Accessed June 7, 2015]
Cook, H. G. (2011). On ELP assessments, content assessments, and ELP development.
AccELLerate! 3(2), 6–8. Retrieved from www.ncela.gwu.edu [Accessed March 5, 2011]
Cummins, J. (1980). The construct of language proficiency in bilingual education. In J. E., Alatis
(Ed.), Georgetown University Round Table on Languages and Linguistics. Washington
DC: Georgetown University Press.
Cummins, J. (1984). Wanted: A theoretical framework for relating language proficiency to
academic achievement among bilingual students. In C. Rivera (Ed.), Language
Proficiency and Academic Achievement. Clevedon: Multilingual Matters.
Cummins, J. (2008). Volume 2: Literacy. In B. Street, & N. H. Hornberger (Eds.), Encyclopedia
of language and education (2nd ed.) (pp.71–83). New York: Springer Science+Business
Media LLC.
Diamond, J. (2012). Accountability policy, school organization, and classroom practice: Partial
recoupling and educational opportunity. Education and Urban Society, 44(2), 151–182.
Giambo, D. (2010). High-Stakes testing, high school graduate, and limited English proficient
students: A case study. American Secondary Education, 38(2), 44–56.

163
Hakuta, K., Goto, Y., & Witt, D. (2000). How long does it take English learners to attain
proficiency? (Policy Report No. 2000–1). Santa Barbara, CA: The University of
California Linguistic Minority Research Institute.
Hayes, K., Salazar, J. & Vukovic, C. (2002). Evaluation of the structured English immersion
program: (Year 2, Final report), Los Angeles city schools. Los Angeles, CA: Program
Evaluation Branch Publishing.
Irwin, P., Kingston, N., Skorupski, W., Glasnapp, D., & Poggio, J. (2009). Kansas Assessments
in Science 2008 Technical Manual for the Kansas General Assessments. Center for
Educational Testing and Evaluation: The University of Kansas, Lawrence, K. S.
Retrieved from
http://cete.ku.edu/sites/cete.drupal.ku.edu/files/docs/Technical_Reports/2009/irwin2009_
science.pdf [Accessed June 15, 2015]
Irwin, P., Poggio, A., Yang, X., Glasnapp, D., & Poggio, J. (2007). Kansas Assessments in
Reading and Mathematics 2006 Technical Manual for the Kansas General Assessments,
Kansas Assessments of Multiple Measures (KAMM), and Kansas Alternative Assessments
(KAA). Center for Educational Testing and Evaluation: The University of Kansas,
Lawrence, KS. Retrieved from
http://cete.ku.edu/sites/cete.drupal.ku.edu/files/docs/Technical_Reports/2007/irwin2007_
math.pdf [Accessed June 15, 2015]
Kane, M. (2008). Current concerns in validity theory. Journal of Educational Measurement,
38(4), 319–342.
Kansas State Department of Education (KSDE). (2011). Kansas Accommodation Guidelines.
(2011). Retrieved from

164
https://www.google.com/url?q=http://www.ksde.org/LinkClick.aspx%3Ffileticket%
[Accessed October 20, 2012]
Kansas State Department of Education (KSDE). (2011). Kansas Curricular Standards for
English for Speakers of Other Languages (ESOL). Topeka, KS: Author, Kansas State
Department of Education. Retrieved from
http://www.swprsc.org/vimages/shared/vnews/stories/4e6e327c97a4c/KS%20Curr%20St
nds%20for%20ESOL.pdf [Accessed June 15, 2015]
Kansas State Department of Education (KSDE). (2014). English for Speakers of Other
Languages (ESOL) Frequently Asked Questions 2014–2015. Topeka, KS: Author, Early
Childhood, Special Education, and Title Services. Retrieved from
http://www.ksde.org/Portals/0/ECSETS/FactSheets/FactSheet-ESOLFAQ.pdf [Accessed
June 15, 2015]
Kansas State Department of Education (KSDE). (2015a). English Language Proficiency
Assessment. Topeka, KS: Author, Kansas State Department of Education. Retrieved
from http://www.ksde.org/Default.aspx?tabid=460 [Accessed June 15, 2015]
Kansas State Department of Education (KSDE). (2015b). English Learners and State Content
Assessments 2014–2015 Fact Sheet. Topeka, KS: Author, Kansas State Department of
Education. Retrieved from
http://www.ksde.org/Portals/0/CSAS/CSAS%20Home/Standards_&_Fact_Sheets/Englis
h_Learners_and_State_Content_Assessments_Fact_Sheet.pdf [Accessed June 15, 2015]
Kansas State Department of Education (KSDE). (2015c). Kansas English Language Proficiency
Assessment (KELPA-P) Materials and Instructions. Topeka, KS: Author, Career
Standards and Assessment Services. Retrieved from
165
http://www.ksde.org/Portals/0/CSAS/Content%20Area%20%28A-
E%29/English_Language_Proficiency/Assessments/2015%20KELPA%20Admin%20lett
er.pdf [Accessed June 15, 2015]
Kansas State Department of Education (KSDE) (2015). Regulations and Standards for Kansas
Educators: Teacher Licensure and Accreditation. Topeka, KS: Author, Kansas State
Department of Education. Retrieved from http://ksde.org/Default.aspx?tabid=389
[Accessed October 8, 2015]
Kansas State Department of Education (KSDE) (n.d.). Kansas English Language Proficiency
Assessment (KELPA) Performance Category Definitions for Total Score. Topeka, KS:
Author, Kansas State Department of Education. Retrieved from
http://www.ksde.org/LinkClick.aspx?fileticket=jZEr0RPSkTA%3D&tabid=350
[Accessed June 15, 2015]
Kato, K., Albus, D., Liu, K., Guven, K., & Thurlow, M. (2004). Relationship between a
statewide language proficiency test and academic achievement assessments (LEP
Projects Report 4). Minneapolis: University of Minnesota, National Center on
Educational Outcomes. Retrieved from
http://education.umn.edu/NCEO/OnlinePubs/LEP4.html [Accessed October 5, 2012]
Katz, A., Low, P., Stack, J., & Tsang, S. (2004). A study of content area assessment for English
language learners. Office of English Language Acquisition and Academic Achievement
for Limited English Proficient Students, U.S. Department of Education. ARC Associates,
Inc. 1212 Broadway, Suite 400; Oakland, CA, 94612.
Kim, J., & Herman, J. L. (2009). A three-state study of English learner progress (CRESST
166
Report 764). Los Angeles: University of California, National Center for Research on
Evaluation, Standards, and Student Testing (CRESST).
La Celle-Paterson, M., Rivera, C. (1994). Is it real for all kids? A framework for equitable
assessment policies for English language learners. Harvard Educational Review, 64(1),
55–75.
Lindholm-Leary, K., & Borsato, G. (2006). Academic achievement. In F. Genesee, K. Lindholm-
Leary, W. M. Saunders, & D. Christian, (Eds.), Educating English language learners: A
synthesis of research evidence (pp. 176–222). New York: Cambridge University Press.
McNamara, T. (2011). Applied linguistics and measurement: A dialogue. Language Testing,
28(4), 435–440.
McKay, P. (2000). On ESL standards for school-age learners. Language Testing, 17, 185–214.
Menken, K. (2008). English learners left behind: Standardized testing as language policy.
Clevedon, England: Multilingual Matters.
Menken, K. (2010). NCLB and English language learners: Challenges and consequences.
Theory Into Practice, 49, 121–128.
Menken, K., & Antunez, B. (2001). An overview of the preparation and certification of teachers
working with limited English proficient (LEP) students. Washington, DC: National
Clearinghouse for Bilingual Education.
Messick, S. (1993). Foundations of validity: Meaning and consequences in psychological
assessment (RR-93-51). Retrieved from
http://www.ets.org/research/policy_research_reports/publications/report/1993/hxne
[Accessed June 3, 2015]
167
Mislevy, R. (1994). Test theory and language learning assessment. Language Testing, 12(3),
241–369.
Natalicio, D. (1979). Repetition and dictation as language testing techniques. The Modern
Language Journal, 63(4), 65–176.
National Clearinghouse for English Language Acquisition and Language Instruction Educational
Programs. (2011). The growing numbers of English learner students 1998/99–2008/09.
Washington, DC: National Clearinghouse for English Language Acquisition and
Language Instruction Educational Programs. Retrieved from
http://www.ncela.gwu.edu/files/uploads/9/growingLEP_0809.pdf. [Accessed June 20,
2011]
National Center for Education Statistics, Institute of Education Sciences. (2012). English
Language Learners in Public Schools. Retrieved from
http://nces.ed.gov/programs/coe/indicator_ell.asp [Accessed December 12, 2012]
Neill, M. (2005). Assessment of ELL students under NCLB: Problems and solutions. FairTest
presentation paper prepared for Iowa Department of Education—July 2005.
No Child Left Behind Act, Pub. L. No. 107–110. (2001). Retrieved from
http://www2.ed.gov/policy/elsec/leg/esea02/107–110.pdf
O’Conner, R., Abedi, J., and Tung, S. (2012). A descriptive analysis of enrollment and
achievement among English language learner students in Delaware. (Issues and
Answers Report, REL 2012-No. 132). Washington, DC: U.S. Department of Education,
Institute of Educational Sciences, National Center for Education Evaluation and
Regional Assistance, Regional Educational Laboratory Mid-Atlantic. Retrieved from
http://ies.ed.gov/ncee/edlabs.
168
Pappamihiel, N. E., Walser, T. M. (2009). English language learners and complexity theory:
Why current accountability systems do not measure up. The Educational Forum, 73,
133–140.
Peyton, V. (2009). Kansas State Assessments and English Language Learners [PowerPoint
Slides]. Center for Educational Testing and Evaluation: University of Kansas, Lawrence,
KS. Retrieved from
https://cete.ku.edu/sites/cete.drupal.ku.edu/files/docs/Presentations/2008/peyton200811_l
earners.pdf [Accessed April 19, 2011]
Peyton, V., Kingston, N., Skorupski, W., Glasnapp, D., & Poggio, J. (2009). Kansas English
Language Proficiency Assessment (KELPA) Technical Manual. Center for Educational
Testing and Evaluation: The University of Kansas, Lawrence, KS. Retrieved September
from
http://cete.ku.edu/sites/cete.drupal.ku.edu/files/docs/Technical_Reports/2009/peyton2009
_KELPA.pdf [Accessed 15, 2011]
Pitoniak, M., Young, J., Martiniello, M., King, T., Buteux, A., & Ginsburgh, M. (2009).
Guidelines for the Assessment of English-Language Learners. Educational Testing
Services. Princeton: New Jersey.
Rabinowitz, S. (2008). Assessment of English language learners under Title I and Title III: How
one testing program can inform the other. Washington, DC: George Washington
University Center for Equity and Excellence in Education, The National Center for the
Improvement of Educational Assessment, WestEd, and the Assessment and
Accountability Comprehensive Center. Retrieved from
http://www.ncela.us/files/uploads/11/rabinowitz.pdf [Accessed June 20, 2014]
169
Rabinowitz, S., Ananda, S., Bell, A. (2004). Strategies to assess the core academic knowledge of
English language learners. Journal of Applied Testing Technology, 7(1), 1–12.
Rezazadeh, M., & Tavakoli, M. (2009). Investigating the relationship among test anxiety,
gender, academic achievement and years of study: A case of Iranian EFL university
students. English Language Teaching, 2(4), 68–74.
Samson, J., & Lesaux, N. (2009). Language-minority learners in special education: Rates and
predictors of identification for services. Journal of Learning Disabilities, 42(2), 149–162.
Solano-Flores, G. (2008). Who is given tests in what language by whom, when, and where? The
need for probabilistic views of language in the testing of English language learners.
Educational Researcher, 37(4), 189–199.
Solórzano, R. (2008). High stakes testing: Issues, implications, and remedies for English
language learners. Review of Educational Research, 78(2), 260–329.
Téllez, K., & Waxman, H. (2006). A meta-synthesis of qualitative research on effective teaching
practices for English Language Learners. In J. M. Norris, & L. Ortega (Eds.),
Synthesizing research on language learning and teaching (pp. 245–277). Philadelphia:
John Benjamins Publishing.
Thakkar, D. (2013). The relationship between English language learners’ language proficiency
and standardized test scores. Dissertation. Retrieved from
http://gradworks.umi.com/35/58/3558238.html [Accessed September 22, 2014]
Tsang, S. L., Katz, A., & Stack, J. (2008). Achieving testing for English language learners, ready
or not? Education Policy Analysis Archives, 16(1). Retrieved from
http://epaa.asu.edu/epaa/v16n1/v16n1.pdf [Accessed 29 April 2008]

170
Van der Walt, J. L., & Steyn, F. (2008). The validation of language tests. Stellenbosch Papers in
Linguistics, 38, 191–204.
Winter, P. C. (2011). Building on what we know-some next steps in assessing ELP.
AccELLerate! 3(2), 9–11. Retrieved from
http://www.ncela.us/files/uploads/17/Accellerate_3_2.pdf [Accessed June 15, 2015]
Wolf, M. K., Herman, J. L., Bachman, L. F., Bailey, A. L., Griffin, N. (2008a).
Recommendations for assessing English language learners: English language proficiency
measures and accommodation uses—Recommendations report (CRESST Rep. No. 737).
Los Angeles: University of California, National Center for Research on Evaluation,
Standards, and Student Testing (CRESST).
Wolf, M. K., Kao, J., Herman, J. L., Bachman, L. F., Bailey, A. L., Bachman, P. L., Farnsworth,
T., & Chang, S.M. (2008b). Issues in assessing English language learners: English
language proficiency measures and accommodation uses—Literature review (CRESST
Tech. Rep. No. 731). Los Angeles: University of California, National Center for
Research on Evaluation, Standards, and Student Testing (CRESST).
Wolf, M. K., Herman, J. L., & Dietel, R. (2010). Improving the validity of English
language learner assessment systems (CRESST Policy Brief No. 10 – Full Report). Los
Angeles, CA: University of California, National Center for Research on Evaluation,
Standards, and Student Testing (CRESST).
Wolf, M. K., & Leon, S. (2009). An investigation of the language demands in content
assessments for English language learners. Educational Assessment, 14, 139–159.

171
Yan, J., & Horwitz, E. (2008). Learners’ perceptions of how anxiety interacts with personal and
instructional factors to influence their achievement in English: A qualitative analysis of
EFL learners in China. Language Learning, 58(1), 151–183.
Young, J. (2009). A framework for test validity research on content assessments taken by
English language learners. Educational Assessment, 14, 122–138.
Young, J., Holtzman, S., & Steinberg, J. (2011). Score Comparability for Language Minority
Students on the Content Assessments Used by Two States. Princeton, NJ: Educational
Testing Services.
Young, J., Steinberg, J., Cline, F., Stone, E., Martinello, M., Ling, G., & Cho, Y. (2010).
Examining the validity of standards-based assessments for initially fluent students and
former English language learners. Educational Assessment, 15, 87–106.
Zehr, M. (2006). Scholars Seek Best Ways to Assess English-Learners. Education Week:
Editorial Projects in Education Inc. 25(18), 10.
Zeidner, M. (1998). Test anxiety: The state of the art. New York, NY: Plenum.