an investigation of consumer preferences towards store...
TRANSCRIPT
AN INVESTIGATION OF CONSUMER
PREFERENCES TOWARDS STORE BRANDS
PURCHASE IN MADURAI DISTRICT
A THESIS
Submitted by
C. R. MATHURAVALLI
Register No: 200702205
In partial fulfillment for the award of the degree of
DOCTOR OF PHILOSOPHY
Under the Supervision of
Dr. S. SAKTHIVEL RANI
Head of the Department
Department of Business Administration
Kalasalingam University
DEPARTMENT OF BUSINESS ADMINISTRATION
KALASALINGAM UNIVERSITY
KALASALINGAM ACADEMY OF RESEARCH AND EDUCATION
ANAND NAGAR
KRISHNANKOIL – 626 126
JUNE 2013
ii
CERTIFICATE
This is to certify that all corrections and suggestions pointed by the
Indian/Foreign Examiner(s) are incorporate in the thesis title “AN
INVESTIGATION OF CONSUMER PREFERENCES TOWARDS STORE
BRANDS PURCHASE IN MADURAI DISTRICT” submitted by Mr./Ms
……C.R.MATHURAVALLI……………………………………..
Place:Krishnankoil Dr. S. SAKTHIVEL RANI
Date:22.04.2015 SUPERVISOR
Head of the Department,
Department of Business
Administration,
Kalasalingam University,
Krishnankoil,
Tamil Nadu, India.

iii
iv
KALASALINGAM UNIVERSITY
KRISHNANKOIL - 626 126
BONAFIDE CERTIFICATE
This is to certify that the thesis titled “An Investigation on Consumer
Preferences towards Store Brands Purchase in Madurai District” is the
bonafide work of Mrs.C.R.MathuraValli, who carried out the research under
my supervision. Certified further, that to the best of my knowledge the work
reported here in has not been part of any other thesis or dissertation on the
basis of which a degree or award was conferred on an earlier occasion on this
title by any other scholar.
Dr. S. SAKTHIVEL RANI
SUPERVISOR
Head of the Department,
Department of Business Administration,
Kalasalingam University,
Krishnankoil,
Tamil Nadu, India.

v
ABSTRACT
The retail industry has seen a tremendous growth in the size and
market dominance of larger players, with greater store size, increased retail
concentration, and utilization of a range of formats. With the inception of
retailing recent years, various types of sophisticated and complex formats
have originated in the retailing scenario of India. Each type of retailer is
trying to survive and prosper by satisfying a group of customers` needs and
expectations more effectively than its competitors. As a result a greater
emphasis is on how to ensure complete consumer engagement and
convenience which result in maximum footfalls on this emphasis. The
retailers have succeeded in their endeavor to a great extent. The growth of an
organized retailing is predominant across the globe. Organized retail is on the
threshold of a boom in India. Branding is an important element in the retailing
industry to influence customer perceptions and to drive store choice and
loyalty. With the manifold increase of organized retailing in the urban and
semi-urban areas, there is a necessity for the retailers to brand their retail
outlet. Whether the retailers are textile or grocery or mobile phone sector, it is
unavoidable for them to brand the services. Even many multinational
companies are waiting to get the Government nod for FDI to enter into Indian
market. In such a scenario, the competing retail outlets are going to
differentiate the services towards the consumers, only by branding. The
worldwide observation shows that, as retailers become more powerful, they
have increasingly focused on their own brands at the expense of manufacturer
brands. Store brand label goods and services are available in a wide range of
industries from food and cosmetics to web hosting. Store brands, also called
private labels, are made by the retailer or a third-party supplier to the retailer's
specifications. They are those owned and sold by the retailers in stores
typically at a lower price because of minimal marketing and advertising
vi
expenses. Historically, store brands are seen as low-priced and low-quality
products. In recent years, however, companies have started using store brands
to market higher quality items, and many believe that high-quality store brand
will increase their present market. The battle is likely to change the face of the
industry between the manufacturer brands and the retail chains’ store brands.
Consequently, the progress of store brands is in a rapid pace.
The retailing business is greatly affected by the patronage
behaviour orientations of shoppers. One important factor affecting consumer
choice is the store image, an image shaped by store attributes. Due to the
rapid growth of store brand market shares, researchers have looked into
different influential factors, attempting to find out the reasons behind the
success of these store products. There is a growing need to evaluate the
drivers of retail store choice behavior in the Indian context. The study of
consumer helps the retail outlets to improve the marketing strategies by
understanding, how consumers consider different attributes and make
purchase decision that differ among various retail outlets, based on the level
of importance and interest.
It is imperative to study the consumers’ perceptions towards store
brands of various retail formats. This research work is an attempt to identify
the consumers’ perception and the store choice behaviour towards stores,
store brands and store loyalty in the Madurai district. The research also aims
at finding various parameters that influences consumer’s purchase decisions
on the store brand products. The research finds the correlation between the
satisfied customers with the stores and the reflection of store brands loyalty
towards stores. The purpose of this study is to ascertain the linkages between
store image, customer satisfaction, store brand factors and customer loyalty
towards stores especially in Madurai district.
vii
This study is an attempt to address issues related to store attributes
and their relevance in the store selection process. Identified factors and
recommendations in the research work would be of use to the retailers in
designing their outlets with store attributes that would meet the expectations
of shoppers thereby motivate them towards store patronage decisions. Then it
focuses on the insight of consumers on store brands and the various
perceptual factors that influence them to select retail brand.
The study is descriptive in nature and is well structured. Self-
administered questionnaire is developed on the basis of review of the
literature and the store –intercept has been conducted. The data has been
collected from 488 respondents of four major retail outlets in Madurai city.
The percentage analysis, ANOVA Test and Independent t-Test are used to
analyze the data and to examine the relationship between store image, store
brand factors, consumer satisfaction and store loyalty. Finally, structural
equation modeling using partial disaggregation method is performed to test
the whole structured model. The results from structural equation modeling
method confirm significant relationships among the constructs in the model.
All major fit indices from structural equation modeling analysis show
satisfactory results for both the measurement models and the structural model.
The results indicate that perceived risk and attitude determinants such as
quality variability; price consciousness; price-quality association and
convenience influence significantly on consumers’ propensities to buy store
brands.
The research identified that value for money, wide range of
promotional offers and extensive varieties of products are the important store
choice attributes. Finally, the research work implies that the positive
association exists in store image, consumer satisfaction and store loyalty but
not with store brands. The research has implications for organized retailers in
terms of store choice and store brand strategy which also have impact on
viii
consumer satisfaction and loyalty towards store brands in future time period.
The retailers should specifically consider aspects of store image that are
relevant to the store brands they offer, when designing activities to develop
and enhance strategies to promote their own brand and unique store
positioning.
Keywords: Store brand, store attributes, customer satisfaction and store
loyalty.
ix
ACKNOWLEDGEMENTS
My sincere thanks to our Chairman Kalvivallal
Mr. T. Kalasalingam, Illayavallal Mr. K. Sridharan Chancellor,
Dr. S. Saravana Sankar, the Vice-Chancellor Kalasalingam University, for
having permitted me to undertake the research work.
Dr. S. Sakthivelrani, my mentor and supervisor has extended her
valuable guidance and motivation throughout this research. She has been an
inspiration to me from the very beginning. Her approach and kindness
motivated me to execute this research lively. Only because of her extreme
care, trust and offered liberty, I was able to maintain quality throughout my
research. I extend my sincere thanks to her who has provided all moral
support behind the screen.
I place my deep sense of gratitude to my husband and other family
members who supported me in all efforts and for the pain they have taken in
this regard. My heartful thanks to my dear friends, and well wishers, who
have helped to finish this work successfully. I thank the Almighty for the
blessing, grace and mercy. He has showered on me and for leading me
successfully through the various stages of this work.
I acknowledge my gratitude to the respondents who readily
responded to my questionnaire for the study. I whole heartedly thank the
persons who have helped me directly and indirectly to complete this research.
C.R.MATHURAVALLI
x
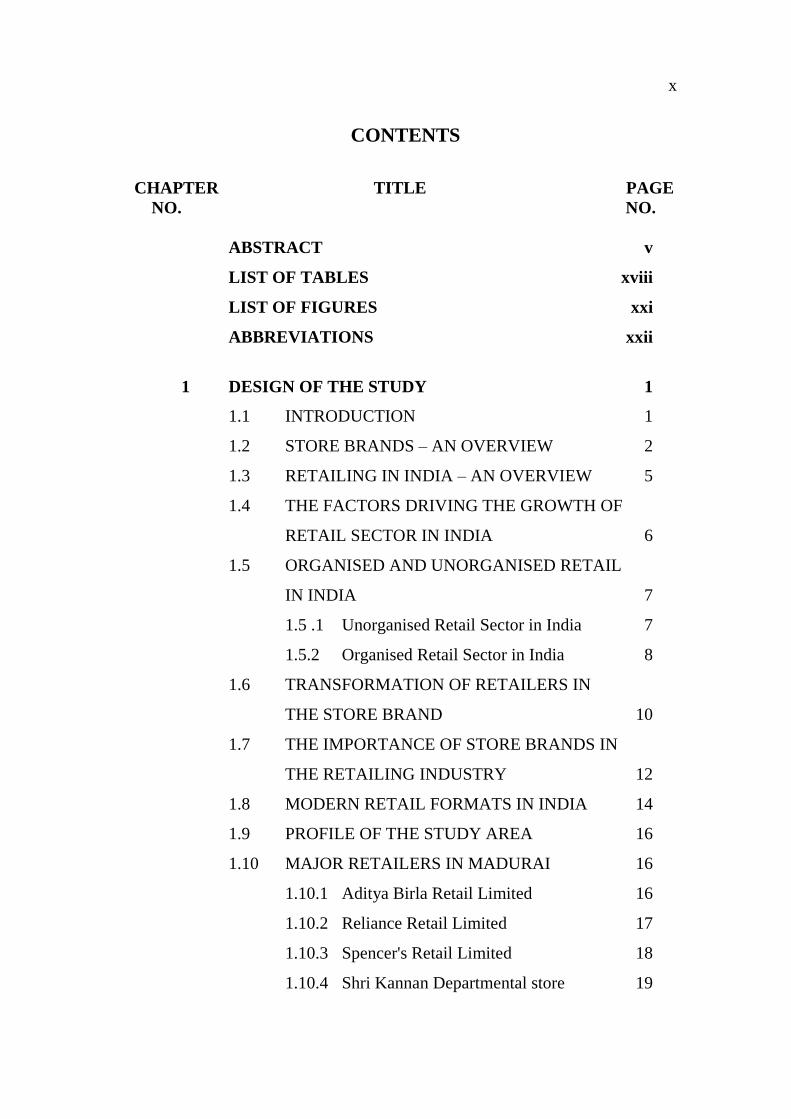
CONTENTS
CHAPTER TITLE PAGE
NO. NO.
ABSTRACT v
LIST OF TABLES xviii
LIST OF FIGURES xxi
ABBREVIATIONS xxii
1 DESIGN OF THE STUDY 1
1.1 INTRODUCTION 1
1.2 STORE BRANDS – AN OVERVIEW 2
1.3 RETAILING IN INDIA – AN OVERVIEW 5
1.4 THE FACTORS DRIVING THE GROWTH OF
RETAIL SECTOR IN INDIA 6
1.5 ORGANISED AND UNORGANISED RETAIL
IN INDIA 7
1.5 .1 Unorganised Retail Sector in India 7
1.5.2 Organised Retail Sector in India 8
1.6 TRANSFORMATION OF RETAILERS IN
THE STORE BRAND 10
1.7 THE IMPORTANCE OF STORE BRANDS IN
THE RETAILING INDUSTRY 12
1.8 MODERN RETAIL FORMATS IN INDIA 14
1.9 PROFILE OF THE STUDY AREA 16
1.10 MAJOR RETAILERS IN MADURAI 16
1.10.1 Aditya Birla Retail Limited 16
1.10.2 Reliance Retail Limited 17
1.10.3 Spencer's Retail Limited 18
1.10.4 Shri Kannan Departmental store 19
xi
CHAPTER TITLE PAGE
NO. NO.
1.11 OPERATIONAL DEFINITIONS 20
1.11.1 Retail 20
1.11.2 Retailing 20
1.11.3 Organized Retailing 21
1.11.4 Unorganized Retailing 21
1.11.5 Brand 21
1.11.6 Store Brands 22
1.11.7 Perceived Risk 23
1.11.8 Quality Variable 23
1.11.9 Price Consciousness 23
1.11.10 Price-Quality Association 23
1.11.11 Search Experience attribute 23
1.11.12 Store Image 24
1.11.13 Store Loyalty 24
1.11.14 Brand Loyalty 24
1.11.15 Customer Satisfaction 24
1.12 BACKGROUND OF THE RESEARCH 25
1.13 THE RESEARCH PROBLEM 26
1.14 OBJECTIVES OF THE RESEARCH 26
1.15 JUSTIFICATION OF THE RESEARCH 27
1.16 METHODOLOGY 30
1.17 CHAPTERISATION OF THE RESEARCH
WORK 31
1.18 SUMMARY 31
xii
CHAPTER TITLE PAGE
NO. NO.
2 LITERATURE REVIEW 33
2.1 INTRODUCTION 33
2.2 STORE BRAND 33
2.3 DETERMINANTS AND CONSUMER
ATTITUDES TO STORE BRANDS 34
2.3.1 Perceived Risk 36
2.3.2 Quality Variable 39
2.3.3 Price Consciousness 42
2.3.4 Price-Quality Association 44
2.3.5 Search Experience 48
2.3.6 Convenience 50
2.4 STORE IMAGE 51
2.4.1 The store image constructs 51
2.4.2 The effect of store brands on store image 54
2.4.3 The effect of store image on store brands 55
2.5 RELATIONSHIP BETWEEN STORE IMAGE
WITH CUSTOMER SATISFACTION AND
LOYALTY 57
2.5.1 Customer Satisfaction 57
2.5.2 Store Loyalty 57
2.5.3 Brand Loyalty 58
2.6 THE RESEARCH GAP 60
2.7 SUMMARY 62
3 METHODOLOGY OF THE STUDY 64
3.1 INTRODUCTION 64
3.2 RESEARCH METHODOLOGY 64
3.3 RESEARCH DESIGN OF THE STUDY 65
xiii
CHAPTER TITLE PAGE
NO. NO.
3.3.1 Justification for the research design 65
3.4 RESEARCH METHODS 66
3.4.1 Scale development 66
3.4.2 Questionnaire design 70
3.4.3 Pre-testing of the questionnaire 72
3.4.4 Sampling frame work and design 73
3.4.5 Data collection 74
3.4.6 Reliability test 75
3.5 DATA ANALYSIS 76
3.5.1 Factor analysis 76
3.5.2 Multiple Regression Analysis 77
3.5.3 Analysis of Variance 78
3.5.4 Independent t- test 79
3.5.5 Measures of central tendency 79
3.5.6 Structural Equation Model 81
3.6 SUMMARY 83
4 ANALYSIS OF DATA 84
4.1 INTRODUCTION 84
4.2 PRELIMINARY EXAMINATION OF
THE DATA 84
4.2.1 Response rate 84
4.2.2 The distribution and profile of the
respondents in each retail outlet 85
4.2.3 Profile of the respondents 86
4.3 STORE CHOICE BEHAVIOUR AMONG THE
CONSUMERS 88
xiv
CHAPTER TITLE PAGE
NO. NO.
4.3.1 Attributes leading to choose the store
among gender wise classification 91
4.3.2 Attributes considered choosing the
Store among the different age group of
the consumers 92
4.3.3 Attributes considered to choose the store
among the occupational level of the
consumers 94
4.3.4 Expenditure for monthly grocery
purchase and store choice
attributes 96
4.3.5 Frequency of consumer visit to store
based on store choice attributes 99
4.3.6 Attributes considered choosing the
store with frequency of purchase 100
4.3.7 Preference of grocery items and
store choice attributes 102
4.3.8 Frequency of store brand purchase and
store choice attributes 104
4.3.9 Consumer preference on store choice
attributes of retail outlets 105
4.4 ASSOCIATION BETWEEN PROFILE OF
CONSUMER AND THE ATTITUDE
TOWARDS THE IMPORTANCE OF
PURCHASE PARAMETERS OF STORE
BRANDS 107
xv
CHAPTER TITLE PAGE
NO. NO.
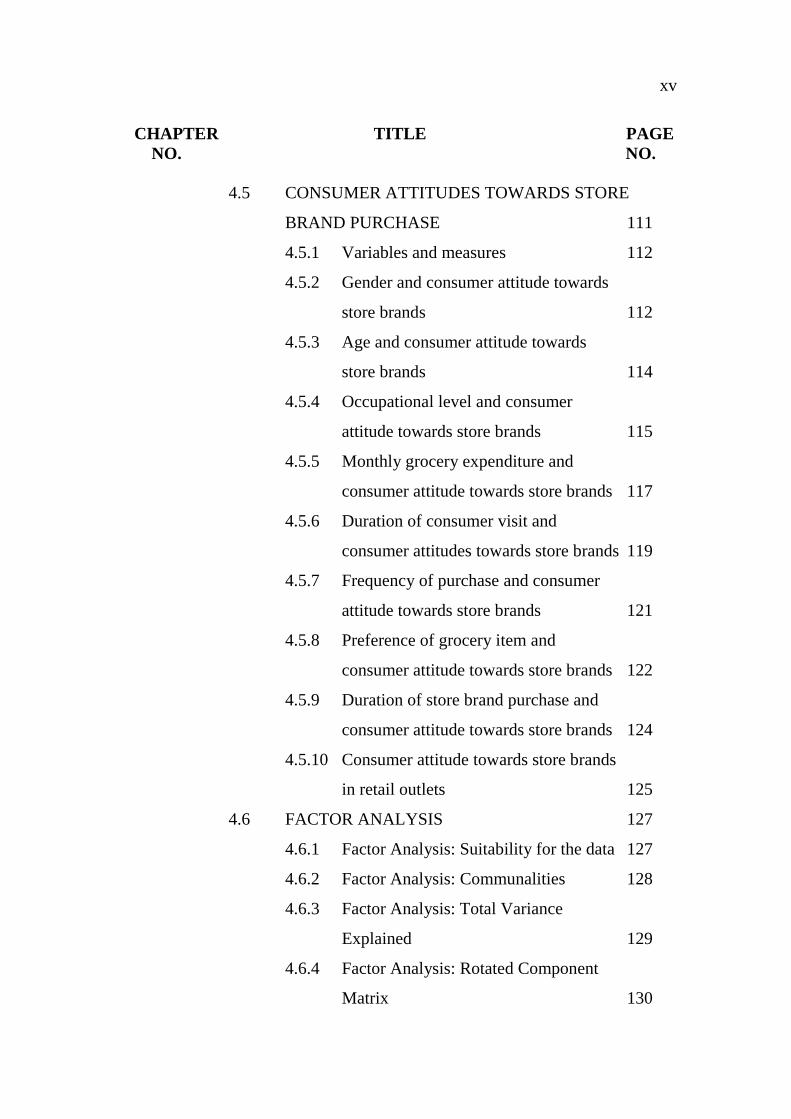
4.5 CONSUMER ATTITUDES TOWARDS STORE
BRAND PURCHASE 111
4.5.1 Variables and measures 112
4.5.2 Gender and consumer attitude towards
store brands 112
4.5.3 Age and consumer attitude towards
store brands 114
4.5.4 Occupational level and consumer
attitude towards store brands 115
4.5.5 Monthly grocery expenditure and
consumer attitude towards store brands 117
4.5.6 Duration of consumer visit and
consumer attitudes towards store brands 119
4.5.7 Frequency of purchase and consumer
attitude towards store brands 121
4.5.8 Preference of grocery item and
consumer attitude towards store brands 122
4.5.9 Duration of store brand purchase and
consumer attitude towards store brands 124
4.5.10 Consumer attitude towards store brands
in retail outlets 125
4.6 FACTOR ANALYSIS 127
4.6.1 Factor Analysis: Suitability for the data 127
4.6.2 Factor Analysis: Communalities 128
4.6.3 Factor Analysis: Total Variance
Explained 129
4.6.4 Factor Analysis: Rotated Component
Matrix 130
xvi
CHAPTER TITLE PAGE
NO. NO.
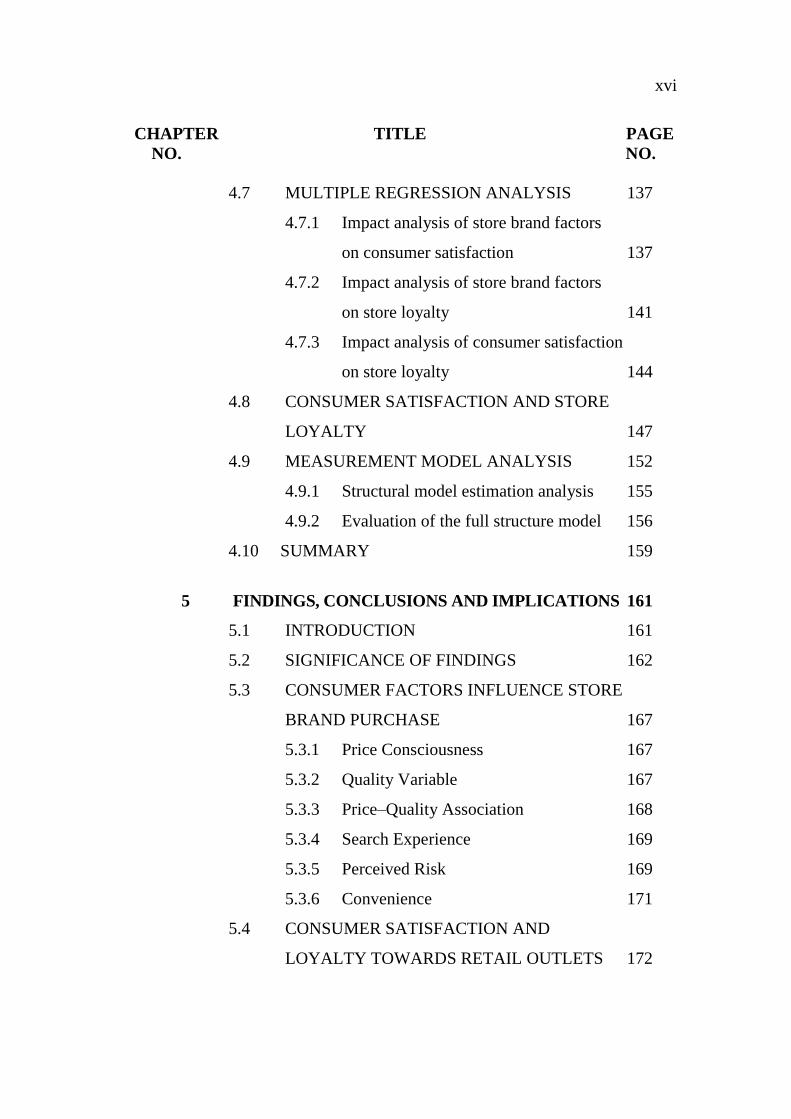
4.7 MULTIPLE REGRESSION ANALYSIS 137
4.7.1 Impact analysis of store brand factors
on consumer satisfaction 137
4.7.2 Impact analysis of store brand factors
on store loyalty 141
4.7.3 Impact analysis of consumer satisfaction
on store loyalty 144
4.8 CONSUMER SATISFACTION AND STORE
LOYALTY 147
4.9 MEASUREMENT MODEL ANALYSIS 152
4.9.1 Structural model estimation analysis 155
4.9.2 Evaluation of the full structure model 156
4.10 SUMMARY 159
5 FINDINGS, CONCLUSIONS AND IMPLICATIONS 161
5.1 INTRODUCTION 161
5.2 SIGNIFICANCE OF FINDINGS 162
5.3 CONSUMER FACTORS INFLUENCE STORE
BRAND PURCHASE 167
5.3.1 Price Consciousness 167
5.3.2 Quality Variable 167
5.3.3 Price–Quality Association 168
5.3.4 Search Experience 169
5.3.5 Perceived Risk 169
5.3.6 Convenience 171
5.4 CONSUMER SATISFACTION AND
LOYALTY TOWARDS RETAIL OUTLETS 172
xvii
CHAPTER TITLE PAGE
NO. NO.
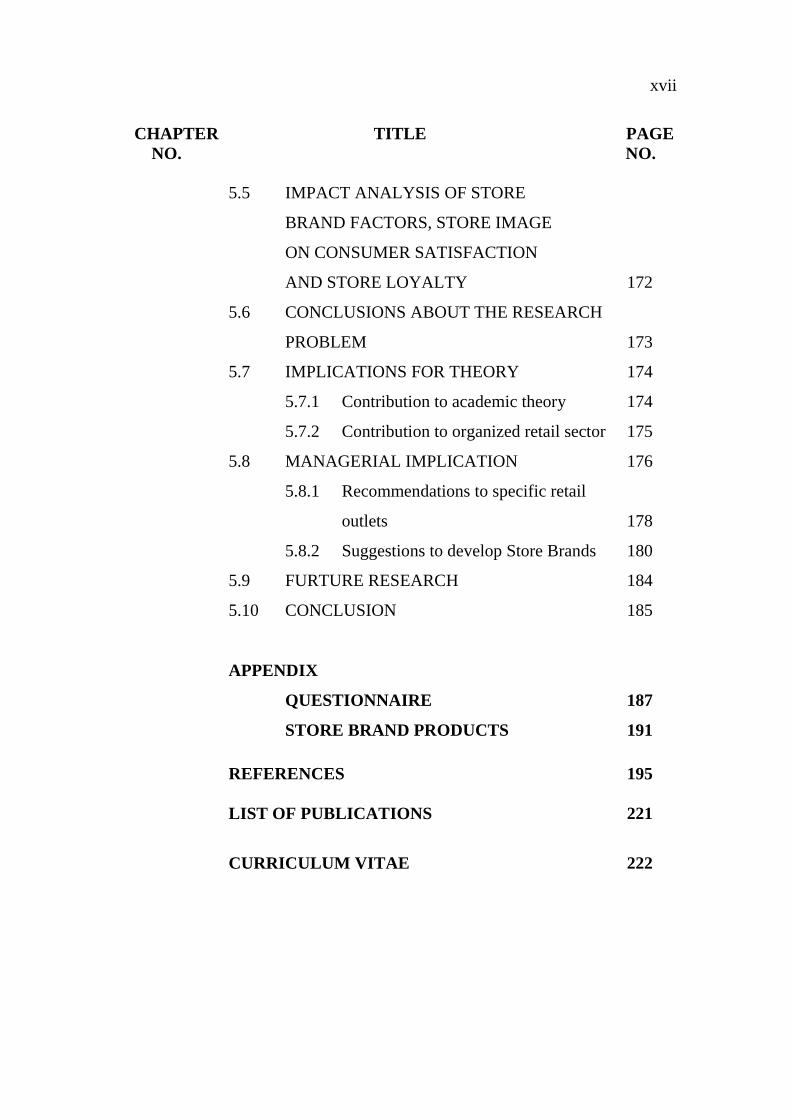
5.5 IMPACT ANALYSIS OF STORE
BRAND FACTORS, STORE IMAGE
ON CONSUMER SATISFACTION
AND STORE LOYALTY 172
5.6 CONCLUSIONS ABOUT THE RESEARCH
PROBLEM 173
5.7 IMPLICATIONS FOR THEORY 174
5.7.1 Contribution to academic theory 174
5.7.2 Contribution to organized retail sector 175
5.8 MANAGERIAL IMPLICATION 176
5.8.1 Recommendations to specific retail
outlets 178
5.8.2 Suggestions to develop Store Brands 180
5.9 FURTURE RESEARCH 184
5.10 CONCLUSION 185
APPENDIX
QUESTIONNAIRE 187
STORE BRAND PRODUCTS 191
REFERENCES 195
LIST OF PUBLICATIONS 221
CURRICULUM VITAE 222
xviii
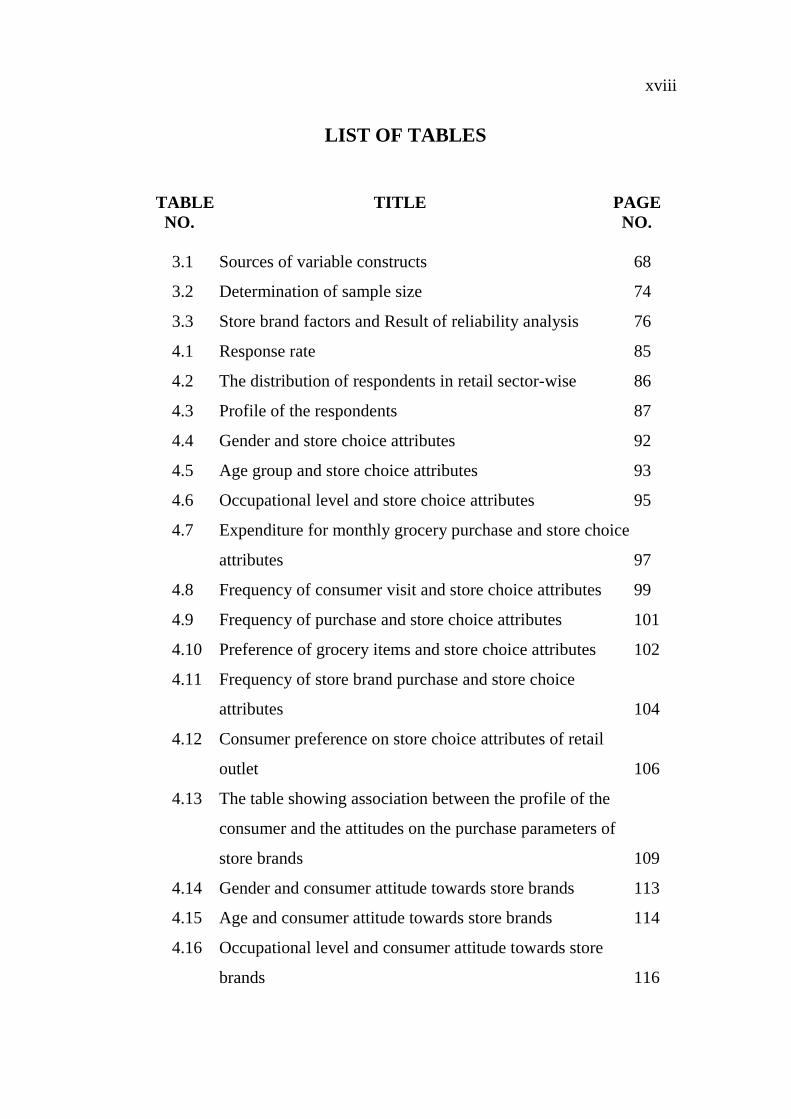
LIST OF TABLES
TABLE TITLE PAGE
NO. NO.
3.1 Sources of variable constructs 68
3.2 Determination of sample size 74
3.3 Store brand factors and Result of reliability analysis 76
4.1 Response rate 85
4.2 The distribution of respondents in retail sector-wise 86
4.3 Profile of the respondents 87
4.4 Gender and store choice attributes 92
4.5 Age group and store choice attributes 93
4.6 Occupational level and store choice attributes 95
4.7 Expenditure for monthly grocery purchase and store choice
attributes 97
4.8 Frequency of consumer visit and store choice attributes 99
4.9 Frequency of purchase and store choice attributes 101
4.10 Preference of grocery items and store choice attributes 102
4.11 Frequency of store brand purchase and store choice
attributes 104
4.12 Consumer preference on store choice attributes of retail
outlet 106
4.13 The table showing association between the profile of the
consumer and the attitudes on the purchase parameters of
store brands 109
4.14 Gender and consumer attitude towards store brands 113
4.15 Age and consumer attitude towards store brands 114
4.16 Occupational level and consumer attitude towards store
brands 116
xix
TABLE TITLE PAGE
NO. NO.
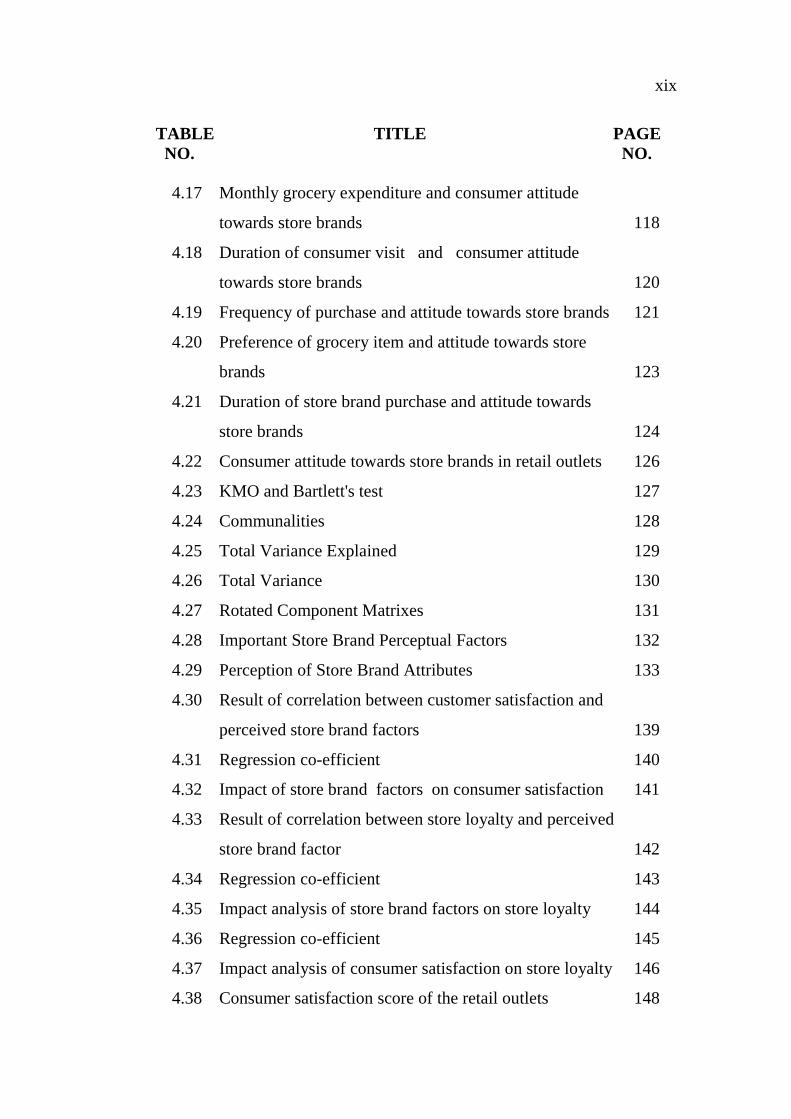
4.17 Monthly grocery expenditure and consumer attitude
towards store brands 118
4.18 Duration of consumer visit and consumer attitude
towards store brands 120
4.19 Frequency of purchase and attitude towards store brands 121
4.20 Preference of grocery item and attitude towards store
brands 123
4.21 Duration of store brand purchase and attitude towards
store brands 124
4.22 Consumer attitude towards store brands in retail outlets 126
4.23 KMO and Bartlett's test 127
4.24 Communalities 128
4.25 Total Variance Explained 129
4.26 Total Variance 130
4.27 Rotated Component Matrixes 131
4.28 Important Store Brand Perceptual Factors 132
4.29 Perception of Store Brand Attributes 133
4.30 Result of correlation between customer satisfaction and
perceived store brand factors 139
4.31 Regression co-efficient 140
4.32 Impact of store brand factors on consumer satisfaction 141
4.33 Result of correlation between store loyalty and perceived
store brand factor 142
4.34 Regression co-efficient 143
4.35 Impact analysis of store brand factors on store loyalty 144
4.36 Regression co-efficient 145
4.37 Impact analysis of consumer satisfaction on store loyalty 146
4.38 Consumer satisfaction score of the retail outlets 148
xx
TABLE TITLE PAGE
NO. NO.
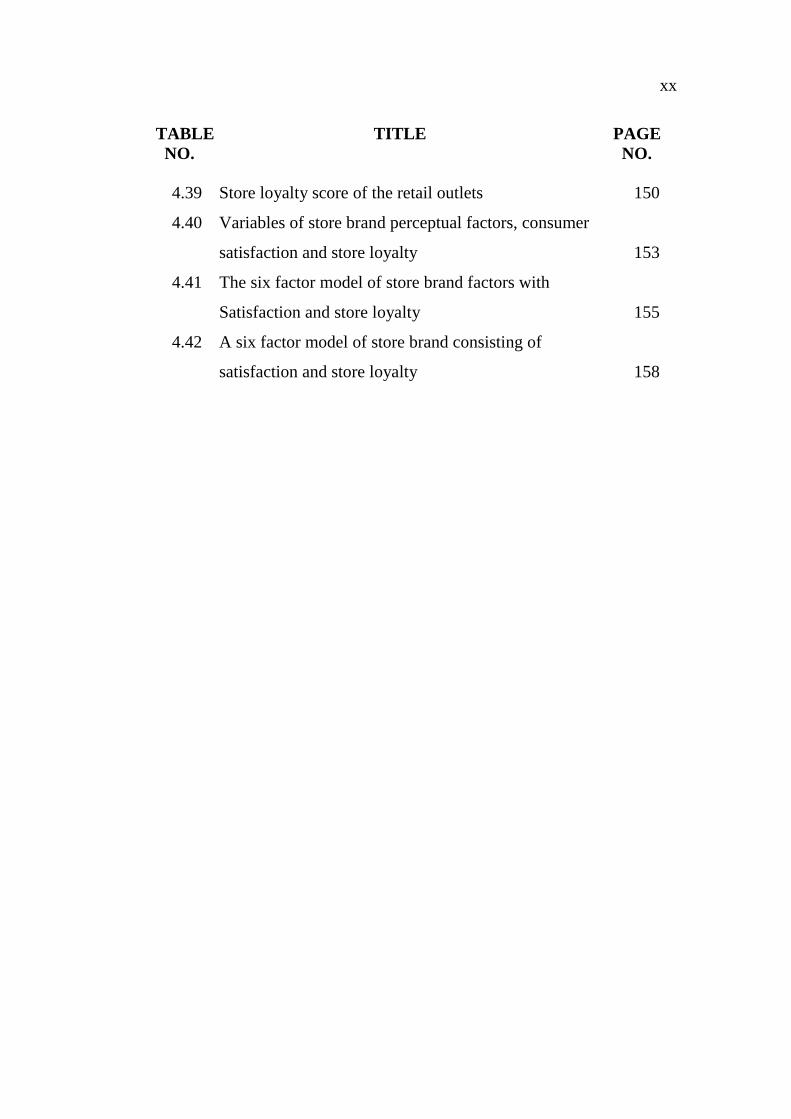
4.39 Store loyalty score of the retail outlets 150
4.40 Variables of store brand perceptual factors, consumer
satisfaction and store loyalty 153
4.41 The six factor model of store brand factors with
Satisfaction and store loyalty 155
4.42 A six factor model of store brand consisting of
satisfaction and store loyalty 158
xxi
LIST OF FIGURES
FIGURE TITLE PAGE
NO. NO.
1.1 Research model 62
4.1 The Measurement Model 154
4.2 The Structural Model 157
xxii
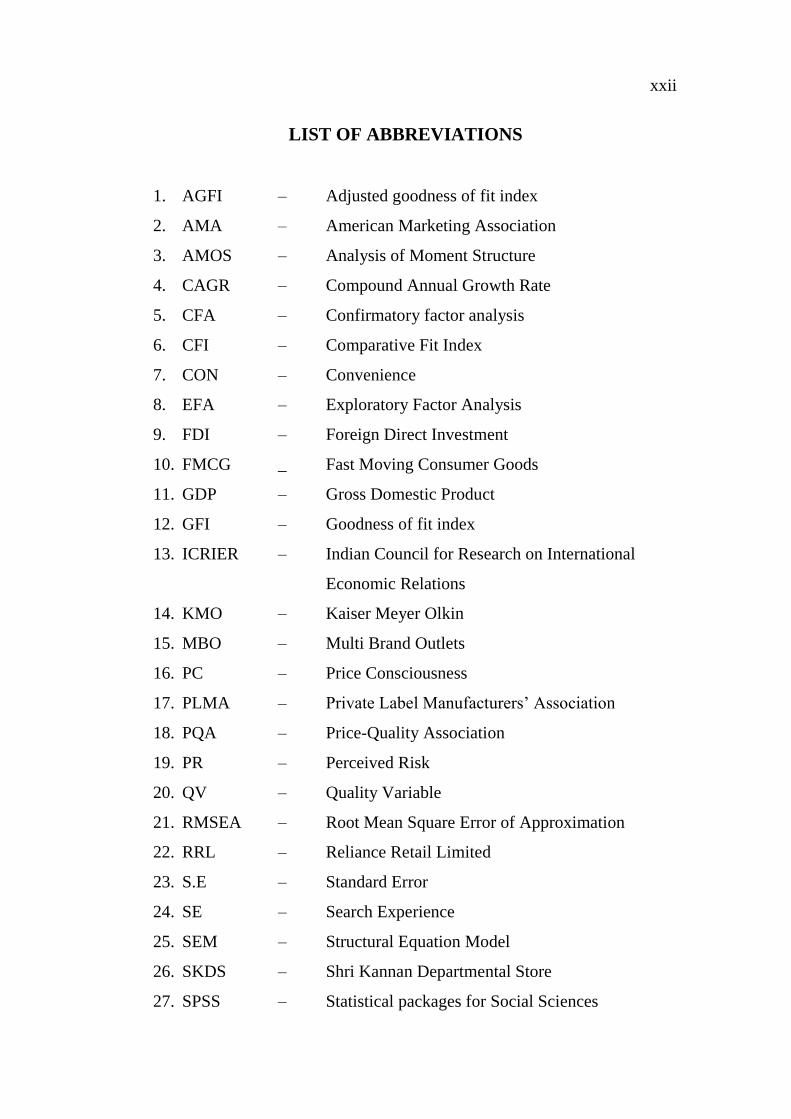
LIST OF ABBREVIATIONS
1. AGFI – Adjusted goodness of fit index
2. AMA – American Marketing Association
3. AMOS – Analysis of Moment Structure
4. CAGR – Compound Annual Growth Rate
5. CFA – Confirmatory factor analysis
6. CFI – Comparative Fit Index
7. CON – Convenience
8. EFA – Exploratory Factor Analysis
9. FDI – Foreign Direct Investment
10. FMCG _ Fast Moving Consumer Goods
11. GDP – Gross Domestic Product
12. GFI – Goodness of fit index
13. ICRIER – Indian Council for Research on International
Economic Relations
14. KMO – Kaiser Meyer Olkin
15. MBO – Multi Brand Outlets
16. PC – Price Consciousness
17. PLMA – Private Label Manufacturers’ Association
18. PQA – Price-Quality Association
19. PR – Perceived Risk
20. QV – Quality Variable
21. RMSEA – Root Mean Square Error of Approximation
22. RRL – Reliance Retail Limited
23. S.E – Standard Error
24. SE – Search Experience
25. SEM – Structural Equation Model
26. SKDS – Shri Kannan Departmental Store
27. SPSS – Statistical packages for Social Sciences

1
CHAPTER I
DESIGN OF THE STUDY
1.1 INTRODUCTION
The organized retail sector is growing at a faster pace. Organized
retail sector in India is at the nascent stage and has tremendous potential with
respect to all the types of formats. The competition in the organized retail
sector is increasing day by day. To keep up the competition, retail marketers
find out various ways and methods to survive in today’s cut-throat
competition. Enhancing the effectiveness of retail organization is possible
with a differentiating factor. Store brands give an edge to create a favorable
impact on consumers. Every retailer today wants to capitalize on its product
offering. Store brand is a strategic tool which every retailer in the organized
sector capitalizes. In the retail competitive or world, store brand is emerging
as a new business concept and is gaining momentum. Many of the large
retailers have a wide range of store brands, irrespective of the product
category that they deal in retail marketers. Now-a-days they are managing
their proprietary brands with the same combination of care and innovation as
manufacturers of national brands. Currently, retailers have been liberating
themselves from the traditional definition of store brand marketing as poor
compared to the national brand consumer goods and thus opening up large
opportunities for store brands branding. These opportunities require adoption
of different set of marketing and branding practices to support and propel the
retailers’ business and marketing ideas for store brands.
2
1.2 STORE BRANDS – AN OVERVIEW
Store brand products are typically those manufactured or provided
by one company for offer under another company's brand. Store brand goods
are available in a wide range of industries from food to cosmetics to car care.
Now-a-days major supermarkets, hypermarkets, drug stores and discounters
offer many products under the retailer's brand.
For the store brand owners advantages are very significant and
numerous. Some of the benefits are full control over the brand and its
positioning, increased freedom in pricing strategy, more flexibility and shorter
time-to-market for innovative products, reduced producer domination in the
marketplace, improved control over stock levels, increased client dependence
and customer loyalty, deduced supplier dependence, increased sales
possibilities, opportunity to differentiate and provide variety, positive image
building and marketing efforts. These are the benefits to oneself, not to that of
competitors. For the end-user, storebrands represent the choice and
opportunity to regular purchase quality products in savings, compared to
manufacturer brands, without waiting for promotional pricing. Store brands
items consist of the same or better ingredients than the manufacturer’s brands.
As the vendor’s name or symbol is on the package, the end-user is assured
that the product meets the vendor’s quality standards and specifications.
The American Marketing Association describes store brands as “a
brand that is owned by the product's reseller rather than by its manufacturer”
(p.33). In rare instances, the reseller may be the manufacturer as well. The
term is often associated with advertised brand versus unadvertised brand, a
private brand which is unadvertised and national brand versus regional brand
3
or local brand, a private brand which is usually less than national. These
distinctions have become clouded by large retail and wholesale organizations
like Sears, Kroger, Kmart, Ace, who advertise their private brands and market
them nationally and internationally. A brand name or label name is attached
to or used in the marketing of a product other than by the product
manufacturers usually by a retailer.
Store brands are called by different names in different context such
as store brands, own brands, own labels, private brands, retailer’s brands and
home brands as stated by Pedro Galvan Guijo (2007). Baltas (1997) defines
store brands as “brands owned, controlled, and sold exclusively by a retailer”
(p.3). Store brands are products that are developed by retailers and made
available for sale only through retailers.
The store brand revolution was first observed in Europe and
Canada. Store brands that were first introduced over 100 years ago in few
product categories had tremendous growth over a period of time as stated by
Tarzijan (2004). One of the early motivations for retailers to introduce store
brands was to improve retailer’s gross margins. Hoch and Banerji (1993)
have observed that retailer’s gross margins on store brands were 20 to 30 %
higher than on national brands. Raju (1995) has found that store brands add
diversity to the product line in a retail category.
Another key motivation for retailer is to create competitive
advantage through store differentiation by offering products’ uniqueness to
the store. Store differentiation in turn is expected to increase store patronage
and to create store loyalty as described by Quelch and Harding (1996). By
introducing store brands, retailers strengthen their bargaining power with
manufacturers. Store brands are often designed to compete against branded
products, offering customers a cheaper alternative to national brands. Through
the actual or potential threat of store brands the retailers take share from
4
national brands, and so negotiate lower wholesale prices was found by
Narasimhan and Wilcox (1998).
Fernie et al. (2003) have identified various advantages to retailers
for the development of a store brand which includes, increased profitability
through cost saving and increased margins; increased store loyalty and
creation of a distinct corporate identity; opportunities to seize new market
ventures and increased bargaining leverage with suppliers.
The proliferation of store brands of grocery products reflects a
major shift in the product mix offered by retailers. Store brands provide
consumers with a competitive alternative to national brands. Store brands
offer lower prices owing to their lower manufacturing costs, inexpensive
packaging, minimal advertising and lower overhead costs. For retailers, store
brands offer an opportunity to increase store traffic and to build store loyalty.
Although store brands are generally priced lower than national brands, the
higher margins earned on the products enable retailers to expand into lower
volume categories for which success is greater per unit contribution margins.
More importantly, the availability of proprietary brands not sold elsewhere
encourage store loyalty and increase store traffic.
Store brands offer several benefits to both retailers and customers,
driving the segment's rising popularity. For retailers margins on store brand
goods are an average of 10% higher than those on similar branded products.
Customers benefit from store brands' lower prices, which are often
significantly lower than those of national brands. While both retailers and
consumers are benefited, substantial pressure is put on the manufacturers of
branded goods, who have to compete against their own customers, especially
the retailers, for market share. Though the public generally see them as low-
cost imitations of branded products, store brands have overcome this
5
disreputation and have achieved significant growth in recent years.
Department stores, electronics stores, and office supply retailers offer store
brand products or services.
1.3 RETAILING IN INDIA – AN OVERVIEW
India is one of the largest emerging markets, with a population of
over a billion. It is one of the largest economies in the world in terms of
purchasing power. Retailing in India is at a nascent stage of its evolution.
Within a short period of time certain trends are clearly emerging which are in
line with the global experiences. Organized retailing has become more
popular in big cities in India. Most of the metropolitan cities and other big
cities are flooded with modern organized retail stores. Many semirural areas
have also witnessed entry of such organized retail outlets.
India's retail sector is estimated to touch US$ 833 billion by 2013
and US$ 1.3 trillion by 2018, with a Compound Annual Growth Rate (CAGR)
of 10%, which is quite lucrative. Retailing as a whole contributes almost 10%
of India’s Gross Domestic Product (GDP), and employs almost 8% of India’s
employable population. The McKinsey’s report 'The rise of Indian Consumer
Market', estimates that the Indian consumer market is likely to grow four
times by 2025 as described in Tazyn Rahman (2012).
As an emerging market with high growth rates, consumers’
spending has risen sharply as the youth population, which is more than 33 %
of the country has seen a significant increase in its disposable income.
Consumer spending has risen up to 75% in the past four years. The organized
sector accounts for mere 5% indicating a huge potential market opportunity
and the purchasing power of Indian urban consumers is also growing.
Branded merchandise in categories like apparels, cosmetics, shoes, watches,
beverages, food and jewellery are slowly becoming lifestyle products that are
widely accepted by the urban Indian consumers.
6
In the past few years, retailing has emerged as one of the most
important sectors of the Indian economy in terms of its contribution to the
Gross Domestic Product (GDP) and employment creation. The lucrative
growth of the Indian retail has prompted many corporate giants such as
Reliance, ITC, Aditya Birla group to enter into the retail market in the last
few years. At present, many foreign players are also observing the Indian
retail arena keenly. This has further increased the competition in the retailing
sector. Although a major chunk of the Indian retail sector is accounted by the
unorganized market, a tremendous growth is witnessed in the organized retail
sector.
1.4 THE FACTORS DRIVING THE GROWTH OF RETAIL
SECTOR IN INDIA
Indian economy is growing at the rate of 8%, indicating a
prosperous future. The consistent economic growth has resulted in a decent
rise in the income level of the middle class. The wealth of the consumer has
resulted in a revolution of the retail industry. Many international brands have
entered the market. With the growth in organized retailing, unorganized
retailers have brought drastic changes in the business models. Many factors
which are responsible for the growth of retail sector are as follows:
1. Increasing disposable income: Rise in disposable incomes, in middle
class and lower middle class with increase in employment
opportunities for young adults in IT, and IT enabled sectors is the
major cause of retail growth in India.
2. Increasing number of dual income in nuclear families: In India, hefty
pay packets, nuclear family along with increasing working women
population and dual income family are the factors contributing to the
prosperous retail sector.
7
3. Changing lifestyle and consumer behavior: Due to increasing working
population comfortable life, travel and leisure are given importance.
These key factors are growth drivers of retail sector in India which
boast retailing in almost all the preferences of life such as apparel and
accessories, appliances, electronics, cosmetics and toiletries etc.
4. Experimentation with formats: Due to the competition in the market,
retailing is still evolving and the sector is witnessing a series of
experiments with new formats.
5. Store design: Shopping malls and super markets are growing at a very
faster rate. Improvements in infrastructure and enhanced availability of
retail space, store design are the factors that increase the share of the
organized retail and thereby contributing to the growth of Indian retail
sector.
1.5 ORGANISED AND UNORGANISED RETAIL IN INDIA
The Indian retail industry is the fifth largest in the world,
comprising of organized and unorganized sectors. It is one of the fastest
growing industries in India, especially over the last few years. Initially, the
retail industry in India was mostly unorganized. With the change of tastes and
preferences of the consumers, the industry is getting more popular these days
and is being well organized. With growing market demand, the industry is
expected to grow at a pace of 25-30% annually.
1.5 .1 Unorganised Retail Sector in India
India’s retail is dominated by a large number of small retailers
consisting of the local kirana shops, owner manned general stores, chemists,
footwear shops, apparel shops, paan and beedi shops, hand-cart hawkers,
pavement vendors etc. They together make up the so-called unorganized
retail. Vidushi Handa (2012) state that undeniably, around 96% of Indian
retail sector is unorganized and majority of sales take place through
8
unorganized stores popularly known as kirana or mom-and-pop stores. The
unorganized retail sector is expected to grow at about 10% per annum with
sales rising from 309 billion in 2006-07 to reach US $ 596 billion in 2011-13.
Despite the steady expansion of organized retailers, it is growing at a faster
rate. Unorganized sectors are still preferred by the customers as they are
more convenient and easy to approach. The kirana shop owner knows that the
buyer prefers place first and utility next. The total number of traditional
retailers is estimated to be 13 million by Technopak Advisers Pvt. Ltd.
1.5.2 Organized retail sector in India
Organized retail is reflected in sprawling shopping centers,
multiplex-malls and huge complexes which offer shopping, entertainment and
food under one roof. The last 3-4 years have witnessed the entry of a number
of organized retailers by opening stores in various modern formats in metros
and other important cities. Organized retailing has begun to capture the
enormous market but its share is small. A number of large business houses
have entered the retail business with ambitious expansion plan.
However, opinions are divided on the impact of the growth of
organized retail in the country. Concerns have been raised that growth of
organized retail will have an adverse impact on retailers in the unorganized
sector. It has also been that growth of organized retailing will yield
efficiencies in supply chain; enable better success to markets and to producers
including farmers and enable higher prices on the one hand and lower prices
to consumers, on the other. In India, organized retail contributed roughly 4%
of the total Indian retail from 2006 to 07, which is very small compared to
most of the emerging market economics. It has been projected to grow at a
compound rate of 40-45 % per annum and is estimated to contribute 16% to
the total Indian retail from 2011 to 12. According to the study conducted by
ICRIER (Indian Council for Research on International Economic Relations),

9
annually total retail business in India has grown at 13% , from US $322
billion in 2006-07 to US $590 billion in 2011-12 and in future it will increase
up to US $1 trillion by 2016-17. The regulatory controls on Foreign Direct
Investment (FDI) have been relaxed considerably in recent years. Currently
the government allows 51% FDI in single brand retailing and 100% in cash-n-
carry business. However, the government’s plan to further open up the retail
sector has hit the road block after facing strong political opposition and
nationwide protests by small traders against the proposal to allow FDI in
multiband retailing. The Government is also apprehensive about the uncertain
future of this sector considering the vote bank attached to retail. The political
environment is quite willing to take 100% risk FDI in retail. The major
challenge facing the organized sector is competition from unorganized sector.
The traditional retailing has been established in India for some centuries and it
is a low cost structure, mostly owner-operated, negligible real estate, labour
costs and payment of little or no taxes.
The Indian retail sector is highly fragmented, consisting
predominantly of small, independent, and owner managed shops. The
domestic organized retail industry is at a nascent stage. India has got started
with organized chain retailing just a few years ago. There are just very few
categories, the most prominent being apparel, where organized retail chains
have had a significant presence. Indian retailers have done very well
particularly after taking into account the various obstacles and hindrances like
real estate costs, lack of trained manpower etc. Growth of organized sector of
retailing will yield efficiencies in the supply chain, enabling better access to
markets, to producers and to customers. The strength of organized retail lies
in resource availability. It is translated into efficient supply chain
management, leading to faster inventory turnaround, resulting in improved
bottom lines. India’s organized sector is all set to explode, while the existing
players such as Future group, Bharti, Reliance Retail, Essar, Shopper’s Stop

10
and Aditya Birla group are endeavoring to consolidate their markets and
others such as Mahindra and Mahindra, Parsavnath and India bulls have
announced plans to enter the retail sector.
1.6 TRANSFORMATION OF RETAILERS IN THE STORE
BRAND
In the past, the retail companies were able to add only little value to
the customers. The retailers were simply seen as intermediaries who just
enabled the flow of goods and services between suppliers and consumers. At
the advent of modernization in retailing, which has been visible in developed
and emerging economies, the retailers become active agents with their own
rights within the value chain. The growth of larger firms and concentration of
retail ownership has led to the growth of buyers’ power, integration of supply
chain, consistent supply and availability of wider range of goods including
store brands. It has also led to the development of new retail formats in new
locations. From the marketer’s point of view it is observed that the retailers
are closer to the consumers than to suppliers. The significant flow of money,
people and goods through the retail supply chain has made the sector’s
businesses as the influential corporate players in the developed economics.
Store brand is a hot concept today and retailers are introducing
store brands to gain market share. For instance, Pantaloon's Food Bazaar has
introduced its store brand as Tasty treat, in the snacks category which has
gained a significant share in the market today. Retailers today have store
brands because of the following reasons:
• Manufacturing cost in the case of store brands is less because of the
elimination of the middlemen.
• The bargaining power of the retailer is enhanced.
• Since a large proportion of the store brands is mostly sold in the
retailer's own stores, it creates a sustainable competitive advantage for
the retailer and also helps to win customers’ loyalty.
11
• The pricing of the store brands is more competitive as compared to the
manufacturers’ brand.
• One of the main reasons for the wide introduction of the store brands is
the conflict between the retailers and the manufacturers. Many times,
manufacturers supply low quality products to the retailers in a bid to
earn extra profits. Azad (2010) has stated that, retailers prefer to have
their own in-store brands to ensure that the customers are satisfied and
are not supplied with low quality products.
Manufacturers and supermarkets have a long strong relationship as
member’s dependence. However, many situations have led supermarkets to
change the balance in the relationship with manufacturers and to re-design
their store brand programs. As reported by different authors, there are several
factors that motivated supermarkets to boost store brand and contribute to the
growth of organized retailing. The factors are as follows:
First, an excessive price increase by national brand manufacturers:
The 1980s was a decade that saw substantial increase in prices of the
suppliers as stated by Nandan and Dickinson (1994).
Second, the rising of retailing power: Wileman and Jary (1997)
state that the producer brands have dominated the consumer goods industry
for most of the last century. Nevertheless retailers have become large-scale,
concentrated, centralized, and sophisticated due to mergers and acquisitions
Thirdly, the smart consumers are mostly educated people who
tend to be among the most conscientious consumers: Nandan and Dickinson
(1994) have stated that the consumers have noticed the discrepancy in value
when price differences become very large. In general, consumers have
become more astute in the judgment of value and are less influenced by the
12
assumed social status of purchasing a certain brand and value-oriented
consumers demand value for money.
Fourth, the excess production capacity: Peles (1976) has reported
the excessive capacity production of manufacturers as a factor that facilitated
the store brand introduction. Consequently, Patty and Fisk (1982) have
reported that store brands have emerged as a key weapon and have started to
play an important role in the battle for control of the distribution channel and
consumer loyalty.
Mills (1995) indicates in the article that “The net effect of store
brand marketing is to improve the performance of supermarket distribution
channels.”(p.509) and also reported that store brands are the instruments that
retailers used to capture more profit out of the distribution channel.(p.513)
Supermarkets believe that manufacturers have a high profit margin and want
to increase the profit margin by considering distribution channel.
In addition supermarkets want to create consumers’ dependence on
them and reduce dependence on manufacturers of national brands. Lewison
and Balderson (1999) have identified that through a store brand program
supermarkets enhance store loyalty and brand loyalty. The majority of the
retailers focus on the store brand strategy especially on the price by
attention to low quality. However, retailers have recently started to pay more
attention to store brand’s quality.
1.7 THE IMPORTANCE OF STORE BRANDS IN THE
RETAILING INDUSTRY
Store brands are an important source of profits for retailers and are
formidable sources of competition for national brand manufacturers as stated
by Hoch and Banerji (1993). The success of store brands is seen as a
consequence of cleverly designed branding strategies employed by the
13
retailers described by Keller (1998). Dunne and Narasimhan (1999) have
stated that store brands have been claimed by the manufacturers as category
killers, which are cheap, me-too products taking profits out of a market by
making consumers more price-sensitive. Some marketing researchers like
Hoch (1996) and Verhoef et al. (2002) have investigated how branded
manufacturers respond effectively to the competition of store brand.
Ailawadi (2001) states that the importance of store brand success
for retailers has been evident in several ways. For instance, store brands bring
greater profits to retailers; increase retailers’ market power and bargaining
power; generate store loyalty and differentiate the retail outlets from other
chain stores
In addition, a successful store brand strengthens the negotiating
position of retailers in relation to national-brand manufacturers. Retailers have
the advantage of controlling shelf space which results in increased bargaining
power over manufacturers. This is particularly the case for those retailers who
have had some degree of market power. Mills (1995) states that store brands
are substitutes for popular national brands in an attempt to capture more
profits from the vertical structures to share with the manufacturers.
Narasimhan and Wilcox (1998) have shown that a credible store brand
competition allows the retailers to gain better terms of trade from the
manufacturers, such as higher margins on national brands.
Ailawadi (2001) and Steiner (2004) stated that high store brand
share enables retailers to obtain significantly higher profit margins on national
brands by negotiating with manufacturers for a lower price on the national
brands.. Furthermore some researchers like Dick et al. (1995), Miranda and
Joshi (2003), Steenkamp and Dekimpe (1997) also state that a successful
store brand potentially increases customers’ traffic, generates store loyalty
and even distinguishes the store from others by virtue of the fact that, such
14
products are unique to the sponsoring store but different from manufacturer
brands or other store brands.
Corstjens and Lal (2000) indicate that store brands of high quality
are instruments for retailers to generate store differentiation and store loyalty,
thus improving profitability. The empirical results also show that store loyalty
is positively related to store brand use. To summarize, store brands enable
retailers to gain higher margins, to improve their ability to negotiate with their
channel partners, to compete with other rival retailers, and to generate higher
store loyalty.
1.8 MODERN RETAIL FORMATS IN INDIA
The face of Indian retail sector is changing. New and innovative
business models are being adopted. The formats prevalent in retail sector are:-
1. Malls: Mall is the largest form of organized retailing today. Located
mainly in metro cities, in proximity to urban outskirts they range from
60,000 sq ft to 7,00,000 sq ft and above. They lend an ideal shopping
experience with an amalgamation of product, service and
entertainment, all under a common roof. Examples include Shoppers
Stop, Pyramid and Pantaloon.
2. Specialty stores: Focus on specific market segments and have
established themselves strongly in their sectors. Chains such as the
Bangalore based Kids Kemp, the Mumbai books retailer Crossword,
RPG's Music World and the Times Group's music chain Planet M are a
few examples.
3. Discount Stores: As the name suggests, discount stores or factory
outlets, offer discounts on the MSRP (Manufactured Suggested Retail
Price) through selling in bulk reaching economies of scale or excess
stock left over at the season. The product category ranges from a
15
variety of perishable/ non perishable goods. Discount Circuit is one
such example.
4. Department Stores: These are the large stores ranging from 20,000-
50,000 sq. ft, catering to a variety of consumer needs. Further they are
classified into localized departments such as clothing, toys, home,
groceries, etc.
5. Hyper marts/Supermarkets: Large self service outlets, catering to
varied shopper needs are termed as Supermarkets. These are located in
or near residential high streets. These stores today contribute to 30% of
all food and grocery organized retail sales. Super Markets are further
classified into mini supermarkets typically 1,000 sq ft to 2,000 sq ft
and large supermarkets ranging from of 3,500 sq ft to 5,000 sq ft.
having a strong focus on food and grocery and personal sales.
6. Convenience Stores: These are relatively small stores ranging from
400-2,000 sq. ft located near residential areas. They stock a limited
range of high-turnover convenience products and are usually open for
extended periods during the day as well as, seven days a week. The
prices are slightly higher due to the convenience premium.
7. MBO’s: Multi Brand outlets, also known as Category Killers, offer
several brands across a single product category. These usually do well
in busy market places and Metros.
8. E-trailers: These are the retailers providing online buying and selling
of products and services
1.9 PROFILE OF THE STUDY AREA
Madurai city is situated in south-west of Chennai at a distance of
498 kilometers Madurai city lies on the flat and fertile plain of the river
Vaigai which runs in the north-south direction through the city dividing it
almost into two equal halves. The 2011 census showed that the expanded city
corporation had a population of 25,78,201. In Madurai, males constitute
16
50.56% of the population and females 49.44%. The city has an average
literacy rate of 68%, which is higher than the national average of 64.5%. Male
literacy rate is 76%, and female literacy is 61%.
1.10 MAJOR RETAILERS IN MADURAI
1.10.1 Aditya Birla Retail Limited
Aditya Birla Retail Limited is the retail arm of Aditya Birla Group,
a USD 28 billion Corporation. The Company ventured into food and grocery
retail sector in 2007 with the acquisition of a south based supermarket chain
“Trinethra”. Subsequently Aditya Birla Retail Ltd. expanded its presence
across the country under the brand "MORE" with 2 formats: Supermarket and
Hypermarket.
Supermarket More for you - Conveniently located in
neighborhoods. More supermarkets cater to the daily, weekly and monthly
shopping needs of consumers. The product offerings include a wide range of
fresh fruits and vegetables, groceries, personal care, home care, general
merchandise and a basic range of apparels. Currently, there are over 640
MORE supermarkets across the country. The Hypermarket MORE
MEGASTORES, is one stop shopping destination for the entire family.
Besides a large range of products across fruits and vegetables, groceries and
FMCG (Fast Moving Consumer Goods) products, MORE MEGASTORE also
has a strong emphasis on general merchandise and apparels. Currently, eight
hypermarkets are operated under the brand MORE MEGASTORE in Mysore,
Vadodara, Aurangabad, Indore, Bengaluru, Mumbai, New Delhi and
Hyderabad. The Aditya Birla Retail Ltd provides customers a wide choice of
products under its own labels like Feasters, Kitchen's Promise, Enriche,
Germex and Best of India.
17
1.10.2 Reliance Retail Limited
Reliance Retail Limited (RRL), is a subsidiary of Reliance Limited.
Since its inception in 2006, RRL has grown into an organization that caters to
millions of customers, thousands of farmers and vendors. Based on its core
growth strategy of backward integration, RRL has made rapid progress
towards building an entire value chain starting from the farmers to the end
consumers. More than 3 years into operation, RRL has now expanded its
presence in more than 85 cities across 14 states in India. RRL has forged
ahead with its expansion plans and runs stores across the country. RRL’s
footprint now spans a network of more than 1,000 stores. RRL operates
several ‘Value’ and ‘Speciality’ formats. The ‘Value’ formats that RRL
operates are: ‘Reliance Fresh’, a neighborhood concept, ‘Reliance Mart’, an
all under one roof supermarket concept and ‘Reliance Super’, a mini-mart
concept. The ‘Value’ formats offer a wide range and assortment of products
required for daily household needs. The ‘Speciality’ formats are: ‘Reliance
Digital’, a consumer durables and information technology concept,‘ Reliance
Trends’, an apparel and accessories concept, ‘Reliance Wellness’, a health,
wellness and beauty concept, ‘iStore by Reliance Digital’, an exclusive
Apple products concept, ‘Reliance Footprint’, a footwear concept; ‘Reliance
Jewels’, a jewellery concept, ‘Reliance Time Out’, a books, music and
entertainment concept, ‘Reliance AutoZone’, an automotive products and
services concept and ‘Reliance Living’, a home ware, furniture, modular
kitchens and furnishings concept. RRL has rapidly expanded the stores
network and it operates through strategic partnerships with world-class
companies such as Marks and Spencer and Pearl Europe. RRL has also
entered into an exclusive distribution arrangement with Asics Corporation,
Japan, to market Asics brands of shoes and accessories in India. RRL has
recently opened its flagship store under its franchise agreement with Hamleys
18
and plans to expand the store network in the forthcoming years. RRL has also
expanded its presence in business-to business office supplies through its joint
venture with Office Depot. In Madurai it has established its retail outlet in
2005. It has expanded with 18 branches in various areas with an average of
150 customers visiting per day till now.
1.10.3 Spencer's Retail Limited
Spencer's Retail Limited is a Flagship Company of RPG
Enterprises. Spencer's Retail Limited is one of the largest and fastest growing
multi-format retailers in India with footage of approximately 1 million square
feet with, 220 stores, including 30 large format stores across 35 cities in India.
Spencer's focuses on verticals like fresh fruit and vegetables, food and
grocery, personal care, garments and fashion accessories, home and office
essentials, electrical and electronics items. Established in 1996, Spencer's has
become a popular destination for shoppers in India with hypermarkets and
convenient stores catering to various shopping needs of its large consumer
base. The Spencer's Hyper stores are destination stores, with more than
15,000 sq. ft. They offer everything under one roof. The merchandise ranges
includes fruits and vegetables, processed foods, groceries, meat, chicken, fish,
bakery, chilled and frozen foods, garments and fashion accessories, consumer
electronics and electrical products, home decor and needs, office stationeries
and soft toys. The Spencer's stores are neighborhood stores ranging from
1,500 sq. ft. to 15,000 sq. ft. These stores stock the necessary range and
assortment in fruit and vegetables, FMCG (Fast Moving Consumer Goods)
food and non-food, staples and frozen foods and cater to the daily and weekly
top-up shopping needs of the consumers. Music World is India's largest chain
of music stores retailing the widest range of music & home video products
both National and International. Music World's product portfolio comprises of
audio CDs, DVDs and VCDs, CD-ROMs, gaming consoles and software of
all the leading brands, and other music accessories. The company is an
19
important player in the home video market. Music World has successfully
forayed into high end 'personal audio' gadgets of several top brands. The
company also offers DVD players, home theatre systems, speakers and
headphones. In Madurai it has established its retail outlet in 2001. It has
expanded with 4 branches in various areas with an average of 200 customers
visiting per day till now.
1.10.4 Shri Kannan Departmental store
Shri Kannan Departmental store was started in 1985 as a
Departmental Store in Erode named as Sangeetha Shopping Centre. It was
encouraged by the response of the public a Mega Departmental Store was
started in the year 1999 under the name as "Shri Kannan Departmental Store
(P) Ltd.," as SKDS. And it has strong and committed human resource of
around 2500 employees. Shri T. Thanushgaran is Chairman cum Managing
Director of this Company. He actively engaged as a Executive Committee
Member in Tamilnadu Chamber of Commerce & Industry – Madurai and he
got vocational excellence award by Lions Club of Coimbatore. SKDS has
been selected as the best Departmental Store for the Region for the year 2010
by The Ministry of Food Processing Industries (MOFPI) jointly with the Food
Forum of India and will also strive to keep up the same momentum in the
years to come.
SKDS has many branches in all parts of Tamilnadu and presently
22 Departmental Stores were in various districts like Coimbatore, Erode,
Trichy, Salem, Nammakal and Palani. SKDS Group’s annual Turnover in the
last financial year is around Rs. 370 Cores. In Madurai its first branch was
started in the year 2008 which is located in K.Salaipudhur Bypass Road and
subsequently 2 more branches were started in Kamarajar salai
and Theppakulam in 2010 and 2012 respectively.
20
These are large stores ranging from 20000-50000 sq. ft, catering to
a variety of consumer needs. Further they are classified into localized
departments such as clothing, toys, home, groceries, etc. SKDS has stocks of
store brands in food categories including processed food, staples, sauces,
jams, pickles, tea, noodles and others. SKDS uses the name—Kannan—for its
store brand products. SKDS focuses on verticals like fresh fruit and
vegetables, food and grocery, personal care, garments and fashion accessories,
home and office essentials, electrical and electronics.
1.11 OPERATIONAL DEFINITIONS
1.11.1 Retail
The word ‘retail’ is derived from the French word ‘retailer’,
meaning ‘to cut a piece off’ or ‘to break bulk’. In simple terms, it implies a
first-hand transaction with the customer. Retail is the sale of goods and
services from individuals or businesses to the end-user. Retailers are part of
an integrated system called the supply chain. A retailer purchases goods or
products in large quantities from manufacturers directly or through a
wholesale, and then sells smaller quantities to the consumers for a profit.
1.11.2 Retailing
Retailing can be defined as an activity that ensures that customers
derive maximum value from the buying process. This includes the steps
needed to place the merchandise, made elsewhere into the hands of customers
or to provide services to the customers. Retailing is defined as the buying and
selling of goods and services. It is also defined as the timely delivery of goods
and services demanded by consumers at prices that are competitive and
affordable.
21
1.11.3 Organized Retailing
Organized retailing refers to trading activities undertaken by
licensed retailers, who have registered for sales tax, income tax, etc. It
includes the retail chains, corporate backed hyper markets and privately
owned large retail business. Organized retailing is comprised of shopping
malls and huge complexes that offer a large variety of products in terms of
quality and value for money and gives a shopping experience.
1.11.4 Unorganized Retailing
Unorganized retailing refers to the traditional formats of low-cost
retailing like the local kirana shops (mom-n-pop stores); owner manned
general stores; paan/beedi shops; convenience stores; hand cart and pavement
vendors’ etc. Unorganized retailing is defined as an outlet run locally by the
owner or caretaker of a shop that lacks technical and accounting
standardization. The supply chain and sourcing are also done locally to meet
the local needs. Its organized counterpart does not obtain its supplies from
local sources.
1.11.5 Brand
According to American Marketing Association (1996): “A Brand is
a distinguishing name and or symbol, such a logo, trademark or package
design, intended to identify the goods or services of either one seller or a
group of sellers and to differentiate these goods or services from competitors”
(p.536).
According to the Private Label Manufacturers’ Association
(PLMA): “Private label products encompass all merchandise sold under a
retailer’s brand” (p.206). That brand will be the retailer’s own name or a name
created exclusively by that retailer. In some cases, a retailer may belong to a
wholesale group that owns the brands that are available only to the members
22
of the group. In general, private labels are defined as those products owned,
controlled and sold exclusively by a retailer as stated by Raju et al. (1995a);
Mittelstaedt (1992). Dhar and Hoch (1997), Dekimpe (1997) have stated that
the retailer has to accept all responsibility of developing, sourcing,
warehousing and merchandising to marketing such as branding, packaging,
promoting and even advertising.
Fitzell (1992 and 1998) states that the distinction of ownership and
the exclusivity of distribution give the private label its identity. That identity
has been called by several different names in literature. Store products
meeting the definition of private labels are also called house brands; store
brands; private brands; retail brands; retail own brands; own labels or
controlled labels/ control brands; retailer-controlled brands; white labels; own
labels or own brands and premium labels.
1.11.6 Store Brands
Store brands are products that are owned and or licensed
exclusively by retailers, wholesalers, restaurant operators, foodservice
distributors, or suppliers for distribution in their respective segments of the
marketplace.
Retail Branding is a strategy based on the brand concept which
transfers it to a retail company. A retailer’s products are his or her stores that
are marketed in a way similar to branded goods. A retail brand is then a group
of the retailer’s outlets which carry a unique name, symbol, logo or
combination of words. The term ‘Retail Brand’ has to be distinguished from
the ‘Store Brand’. While retail brand refers to store, the term store brand
refers to the product label and is used synonymously with ‘Private Label’.
Often, the retail brand is also used to label the store brand, though it does not
have universal characteristics.
23
1.11.7 Perceived Risk
Perceived risk is most often defined as risk in terms of consumer
perceptions of the uncertainty and adverse consequences of buying a product
In other words, perceived risk is regarded as the “expected negative utility” or
the “expected penalty” associated with the purchase of a particular product or
brand. When purchasing a product a consumer feels that he/she is taking a
functional or psychosocial risk.
1.11.8 Quality Variable
Quality is defined as the totality of feature and characteristics of a
product or service that bears its ability to satisfy stated or implied needs.
1.11.9 Price Consciousness
It means the degree to which the consumer focuses exclusively on
paying lower prices.
1.11.10 Price-Quality Association
It is defined as the generalized belief across product categories that
the level of a price cue is related positively to the level of product quality.
1.11.11 Search Experience Attribute
The Search attributes refers to the tangible features that are verified
before purchase through direct inspection or through readily accessible
sources such as colour, look, packaging, or ingredient content, quality
standards, or other written description on product packaging. The experience
attributes refers to the untouchable, not-easily-described features that are
confirmed only by using the product, for instance, aroma, reliability, or
endurance.
24
1.11.12 Store Image
It means the ‘personality’ of a store or the way in which the store is
defined in the shopper's mind, partly by its functional qualities and partly by
an aura of psychological attributes.
1.11.13 Store Loyalty
It is as the behavioural response as a function of psychological
process. Store loyalty is the operational zed primary store where the consumer
does his or her daily shopping. It also refers to the tendency to repeat
purchase at the same store for similar or other products.
1.11.14 Brand Loyalty
In the branding literature, a consumer is said to be brand loyal,
when consumer consistently purchases a single brand. A consumer who is
loyal to a particular store brand, demonstrates a high level of brand recall. It
has been constructed both as related to store patronage dimension and repeat
purchase of the same brand over time which indicates loyalty and attitudes
resulting in purchase behavior.
1.11.15 Customer Satisfaction
Oliver (1980) defines customer satisfaction as “Customer
satisfaction is a summary of psychological state when emotions surrounding
disconfirmed expectations are coupled with the consumer’s prior feelings
about consumption experience” (p.62).
The following sections outline the background of the research,
research problem and objectives together with the major bodies of theory that
are reviewed. This is followed by a justification for the research and an
overview of the methodology used in the study. Subsequent sections provide
25
an outline of the research work, and prove the definitions adopted and the
final section provides a summary of the chapters.
1.12 BACKGROUND OF THE RESEARCH
Store Brand products have become a global phenomenon and are of
increasing interest to practitioners and academics alike. Ailawadi, Pauwels
and Steenkamp (2008) state that store brands have gained a sizeable share of
global grocery sales and further growth is predicted for the future. These
brands, owned and controlled by retailers, have become a significant threat to
national brand manufacturers as the quality gap between the two closes.
Quelch and Harding (1996) viewed as from the retailer‘s perspective, store
brands are seen as a strategy to improve profitability and store image. The
image of a store in turn is regarded as critical to retail success given the
impact on store patronage, loyalty and profitability is considered by Herstein
and Gamliel; Hansen and Solgaard (2004).
This research work examines the link between store brands and
store choice. Many considerable research works by Baltas and Argouslidis
(2007), Bellizzi and Krueckeberg , Hamilton and Martin (1981) Dick, Jain
and Richardson (1995) have been done to investigate consumers’ perceptions
of store brands as well as the correlation of store preference and loyalty.
Similarly in the research by Baker, Parasuraman, Grewal and Voss (2002),
Mazursky and Jacoby (1986), and Martineau (1958), store image has been the
subject of academic research for over fifty years. The relationship between
store image and attitudes to the brands carried by the store has also been
investigated. The relationship between store image and store brands has been
investigated by some researchers, but mainly in terms of the effect of store
brands on store choice; studies on the opposite causal relationship, the effect
of store image on store brands Collins-Dodd and Lindley (2003), Lee and
26
Hyman (2008), Semeijn, Van Riel and Ambrosini (2004), are common and
have provided varied evidences.
1.13 THE RESEARCH PROBLEM
In line with some researches indicated above, the research problem
addressed in this study is: How does a consumer factor influence a store brand
purchase and how consumer satisfaction leads to store loyalty. The research
work replicates and extends Collins-Dodd and Lindley‘s (2003) and Chen
(2005) study on the influence of store brand on store image and identifies the
impact of store image on overall satisfaction leading to store loyalty.
The research work proves that store choice attributes have effect on
store loyalty. It affects the attitudes to store brands, although the extent of the
effect depends on the satisfaction of store brands on the store image. The
research work further proves that the quality of the products carried by the
store is a key determinant of attitudes to specific store brands. There are some
supports for the original study conclusion that attitudes to store brands are
influenced by the unique positioning of stores. Thus store choice has link
between store image and brand image and more recent theoretical constructs
relevant to store image are also briefly covered.
1.14 OBJECTIVES OF THE RESEARCH
The objectives developed to investigate the research problem are:
• To understand the socio-demographic profile of the customers.
• To examine the factors to be considered to select a retail outlet.
• To identify the consumer attitude towards the importance of
purchase parameters of store brands.
• To examine the consumer factors influence towards store brands in
retail outlets.

27
• To identify the impact of store image on overall satisfaction which
leads to store loyalty.
• To find out the relationship among store brand factors, satisfaction
and store loyalty.
The purpose of this study is to ascertain the linkages between store
brand perception and customer satisfaction towards store loyalty especially in
Madurai city. It explores the relationship between store brand factors and
consumer satisfaction with store brand loyalty and store image attributes, as
well as the relationship between consumer satisfaction and store loyalty. It
identifies the factors that contribute to select particular retail to increase the
number of brand loyal customer. This study is justified by considering its
significance. It also has the potential to contribute the knowledge about store
brands that leads to understanding the consumers and retailers need, to adopt
strategies for creating loyal customers. The review of literature reveals that
there are very few studies addressing the problems related to store brand,
store loyalty and satisfaction. This research work focuses on the assessment of
consumer factors on store brand purchase and consumer satisfaction leading
to store loyalty. It determines the factors influencing the success of store
brands in the market.
. 1.15 JUSTIFICATION OF THE RESEARCH
In many countries, store brands have become a common brand
choice for shoppers; an important strategy for retailers and a significant
concern to national brand manufacturers. Historically, store brands have been
as low-priced and low-quality products. In recent years, however companies
have started using store brands to market higher quality items and many
believe that high-quality store brands will increase in the present scenario.
This has been a significant increase of store brands worldwide. In Europe,
store brand goods account for about 45% of products sold in supermarkets
28
compared to 25% in the USA. Wal-Mart for instance, has a 40% store brand
representation in the stores. The survey shows that 50 % of Indian retail will
be occupied by store brands within the next 10 to 15 years. The business
media predicts rapid growth for store brands in the future, as the world’s
major grocery retailers intensify the store brand penetration as stated by
Ailawadi et al. (2008).
First, there is a need to conduct more research on store brands in
India compared to other countries. There has been a smaller number of store
brand products in the Indian organized retail market, although store brands in
this country are growing in a slowly. The experience of other countries
suggests that retail consolidation is the key driver of store brand growth.
Morris (2002) states that although Indian retailers are consolidating, they are
still in the early stages of developing successful store brand programmes.
Another motivation for this thesis is that, there is a need to conduct
more category-level studies in store brand purchase. An interesting
phenomenon of store brand success is that its growth has been highly uneven
across different product categories as suggested by Batra and Sinha (2000).
For example, in India store brands value share is 46% in the category of fresh
milk and cream, whilst only 8% in the biscuit range as explored by
AC Nielsen (2003). Inter-category differences have been used as the most
important sources of variation in store brands share across markets, retailers
and categories.
Retailers motivations and strategies for store brands have been
developed over the years. Retailers initially viewed store brands as means to
improve profitability, through higher retail margins and increased bargaining
power with national brand manufacturers (Steiner 2004). While store brands
are generally positioned below national brands in terms of price and quality,
from the mid 1970s retailers have started to view them as means to achieve
29
retailer differentiation and have begun to upgrade the quality. By the mid
1990s, store brands in the food sector had been growing faster than national
brands and had become a significant threat to national brand manufacturers as
stated by Herstein and Gamliel (2004). The same time Laaksonen and
Reynolds (2002) also narrated that retailers had begun to view store brands as
one of the most dynamic forces in food retailing especially in developed
markets characterized by stagnant growth and intense competition.
The growth of store brands is seen by industry as the most
important indicator, as grocery retailers have moved away from the role of
merchants to become marketers (PLMA 2006). Now-a-days, retailers
continue to view store brands as critically important, ranking them sixth out
of the top ten critical issues declared by Baltas and Argouslidis (2007).
Reflecting this changing focus, Semeijn et al. (2004) says that store brands are
now regarded as brands in their own right, with similar characteristics and
advantages to brands in general. This is included as a base for brand
extension. Store brands are becoming major brands in own right with
identities and quality images.
Despite the increasing interest in store brands by academics, some
areas have been relatively neglected, but many researches like Anselmsson
and Johansson (2007); Collins-Dodd and Lindley (2003); Zielke and
Dobbelstein (2007) have proved that there is potential growth for store
brands. First, the majority of studies have focused on the United States and
European markets where store brands are well established, whereas there has
been relatively little research of non-traditional markets such as New Zealand.
Second, most studies have examined generalized consumers attitudes to store
brands rather than attitudes to specific store brands which are more important.
Finally, few empirical studies have examined the effect of store image on
attitudes to store brands. As explained by Porter and Claycomb (1997), the
30
relationship between brand image and store image is clearly interdependent.
Research of the link between store image and store brands in the several
markets is intended to provide further insights for researchers and
practitioners in terms of both retailer and store brands positioning.
This research is also essential in practical aspect where it could be
used to develop guideline for the newly developed company to market the
store brand. Furthermore, the findings of this study will be used by other
organization to solve problems which occur in the future resulting from
aggressive competition in the market. They will improve the performance by
providing the best products or services to customers. Besides, this study
ensures that the attributes of customer loyalty strategies and customer loyalty
programs will be implemented in the store brand business.
1.16 METHODOLOGY
This section provides a brief overview of the methodology used in
the present study. More detailed information on the methodology and research
procedures is provided in chapter three. The research design is based on the
replicated study done by Batra and Sinha (2000), Collins-Dodd & Lindley
(2003), Chen (2005). In line with the quantitative methodology used in that
study, relationship will be tested through statistical analysis of collected data.
The data are collected from shoppers at four retail outlets in Madurai city. The
desired sample is 520. A structured questionnaire is used to compare the store
choice of different retail outlets and attitudes to respective retailer’s store
brands. Multiple regression analysis is used to examine the relationship
between store image and attitudes to store brand with consumer satisfaction
and store loyalty.
31
1.17 CHAPTERISATION OF THE RESEARCH WORK
The research work is presented in five chapters. The introductory
chapter is followed by review of the literature in chapter two. The literature
review begins an in-depth discussion of consumers’ attitudes to store brands
and of the determinants of those attitudes. The review focuses on store image
pertaining to store brands and identifies the research gap on which this
research work is based.
Chapter three develops and discusses the relationship of the study.
It identifies the retail outlets and its store brands that have been selected for
the study. It explains and justifies the proposed methodology and research
procedures in detail. The discussion of the methodology covers the
development of the scales and the survey instrument; collection of the data;
estimation of the sample size and data analysis.
Chapter four presents the results of the data analysis and discusses
the findings in respect to the objectives. The response rate and a profile of
respondents are provided. Before the relationships are tested a preliminary
examination of the data including reliability and validity of the scales are
examined.
The final chapter discusses the significance of the findings of the
research, and its place it in the context of the wider literature. Conclusions are
drawn for the research problem and implications for researchers and
practitioners are discussed with suggestions for further research.
1.18 SUMMARY
This chapter sets out basis for the research work. It provides a brief
background to the broad field of study and has introduces the research
problem and examines the relationship among store choice, store brands
32
factors, consumer satisfaction and store loyalty. The major arena of theory to
be reviewed are outlined, together with the contributions that the research
work make. The research is justified and the methodology relevant to the
study is briefly described and justified. An outline of the research work is
provided and definitions were explained.
33
CHAPTER 2
LITERATURE REVIEW
2.1 INTRODUCTION
The purpose of the chapter is to review the store brands literature
related to the role of store image of consumers’ attitudes to store brands. To
contextualize the discussion, the first section reviews consumers’ perceptions
of store brands and determinants of consumer attitudes to store brands factors
respectively. The second section consists of discussion on the review which
focuses on store image and it discusses the effect of store image and store
brand on each other in general. Finally the focus is on the link between
customer satisfaction, store image, store brands in the aspect of loyalty.
2.2 STORE BRAND
According to the ownership there are two types of brands.
Manufacturer brand also called as producer brand or national brand which is
owned and coordinated by a producer, whereas the store brand which is also
a retailer’s brand or own label is owned and coordinated by a retailer or a
buying group. It is produced by a contracted manufacturer as viewed in
Berthon et al. (1999). The store brands are increasing rapidly. They are the
major factors in the developed food market place and act as a significant
threat to producers brands and manufacturers profitability as discussed by
Baltas (1997), Guerrero et al. (2000).
Kumar and Steenkamp (2007) have defined store brand as any
brand that is owned by the retailer or the distributor and is sold only in its own
outlets. Retailer-owned brands, often called store brands have seen enormous
34
growth in the last couple of decades in many countries and many product
categories. This has been examined in the research work by Connor et al.
(1996), AC Nielsen (2005), Berges Sennou et al. (2003).
The next section focuses on how consumers perceive store brands
and the effect of store image on store brands.
2.3 DETERMINANTS AND CONSUMER ATTITUDES TO
STORE BRANDS
The section briefly summarizes the findings of studies related to
consumer attitudes to store brands; spanning the factors determining these
attitudes and the examination of preferences.
Earlier studies have offered mixed evidences about consumers’
perceptions of store brands price and quality. A few indicate that users of
store brands have more favorable perceptions than non-users. In Myers’s
(1967) study nearly one half of respondents have considered store brands to
have lower prices and lower quality than national brands, but regular store
brands users consider store brands to be the same quality as national brands.
And the second strand of several literatures of Baltas and Argouslidis (2007),
Cunningham et al. (1982), Gamliel and Herstein (2007), Belonda and Wysing
(2007) make an attempt at understanding the drivers of consumer preferences
for store brands, the preferences and perceptions as the linkage between store
brand personality and its impact on consumer perceptions and consumer
willingness to buy store brands.
Numerous researches have aimed to discern consumer attitude
determinants toward store brands. Store brand consumers are better classified
according to perceptual variables rather than by demographic characteristics
or personality features. Baltas (2003) has proved empirically that age, family
size, working time and sensibility to promotions do not improve purchase
35
proneness of store brands. Therefore, variables such as perceived risk, quality
variable and price consciousness are taken into consideration in multiple
researches to detect the preferences and attitude to store brands.
Research on store brands has been of substantial interest to
marketing scholars for more than four decades particularly from the 1990’s to
the present. Narasimhan and Wilcox (1998), Hoch and Banerji (1993) have
stated that consumers, retailers and manufacturers are three sets of players
whose expectations and actions interact to influence the success of store
brands. Among studies of consumer-level factors, those in the 60s and the 70s
have focused more on examining the influencing factors to purchase store
brand.
The section explores the determinants of attitudes to store brands.
Store Brands attitude is “a predisposition to response in a favorable or
unfavorable manner due to product evaluations, purchase evaluations, and/or
self-evaluations associated with store brands grocery products” as stated by
Burton, Lichtenstein, Netemeyer and Garretson, (1998, p.17). These
researchers have reported that consumers, with highly favorable attitudes to
store brands purchase fifty percent more store brand products than those who
give low ratings to store brands. This indicates that favorable store brands
attitude is translated to purchase behaviour. This section examines the
determinants of consumer attitudes to store brands with respect to two of the
commonly studied positioning variables like quality and price. The other
studies have examined the effects of consumer factors on store brand
purchase. The review consequently focuses on six important factors namely
search experience, perceived risk, price–quality association, price
consciousness, quality variable and convenience.
36
Batra and Sinha (2000) have broken this construct into three
different determinants in an attempt to use them to explain the variations of
store brand purchase across different product categories. They have examined
the influences of three determinants of perceived risk on store brand purchase.
These three determinants include consequences of making a mistake in a
purchase; quality variability in a category and the ‘search’ versus
‘experience’. These three determinants of perceived risk have significant
influences on store brand proneness.
2.3.1 Perceived Risk
Among the various consumer-level factors examined in prior
studies, perceived risk is highlighted as a critical factor that greatly influences
consumer intentions to buy store brand products.
Dowling and Staelin (1994) have identified that perceived risk is
most often defined as risk in terms of consumer perceptions of the uncertainty
and adverse consequences of buying a product (p.15). In the words of
Narasimhan and Wilcox (1998), Dunn et al. (1986) and Dick et al. (1995)
perceived risk is regarded as the “expected negative utility” or the “expected
penalty” associated with the purchase of a particular product or brand. This
expected negative utility or penalty is reflected in a variety of ways. For
example, consumers fear that a product cannot possess desirable attributes.
They are uncertain about a products performance and sense that the purchase
of a particular brand will invite social disapproval and emotional or
psychological risks.
Dunn et al. (1986) have noted that perceived risk is an important
explanatory construct for supermarket product decisions. Perceived risk has
been recognized as a multidimensional phenomenon. However, the most store
brand studies have chosen to use ‘perceived risk’ as a variable to predict
37
consumer preferences for store brand products. It also indicates that
consumers perceive that national brands are associated with lower
performance risk and higher financial risk than store brands. It is, indicated
later that, consumers perceive national brands as least risky on the
performance measurement in relation to store brand and generic products. It
also shows consumers preference to buy store brand products rather than
national brand items when perceive higher financial risk in a category.
Narasimhan and Wilcox (1998) have reported that it is important to
investigate how important the perceived outcomes of an expected penalty
would be on consumers when considered buying a store brand product. For
example consumer purchases in categories such as cosmetics are more risky
than the purchases in other categories such as toilet tissues where the
consequences of making a mistake will be lower. Therefore perceived risk is
described as the expected penalty associated with a purchase.
Ever since Bauer (1967) quoted in Stone and Gronhaug (1993)
Rozano Go´ mez and Dı´az (2009), Gonza´ lez, Diaz and Trespalacios (2006)
have introduced the notion of ‘Perceived risk’ in the area of marketing, a
large number of empirical studies have centered around different areas of
research, including store brands. In fact, the relationship between a
consumer’s perceived risk and the choice of store brands over national brands
has been the object of numerous studies in the last two decades.
Numerous studies by Dick, Jain and Richardson (1995); Semeijn,
Van Riel and Ambrosini (2004), Rozano, Go´ mez, and Dı´az (2009) have
pointed out that the risk may manifest itself in a variety of ways. Primarily
the areas of generic and store brands are subjected to two types of perceived
risk like functional and financial risk associated with the product and
psychosocial risk associated with the individual. Batra and Sinha (2000) state
that functional and financial risk refers to the physical performance of the

38
product and the quality variance that occurs within a product category. The
category of social risk has sufficient psychological aspects to rename it as
psychosocial risk as discussed by Semeijn, Van Riel, and Ambrosini (2004).
The psychosocial risk of a brand is associated with the consumption of the
product and its symbolic aspects. This risk exists to the extent that the
consumer believes that he/she will be negatively evaluated due to his or her
brand choice. The researchers Garretson, Fisher and Burton (2002),
Richardson, Jain and Dick (1996), Semeijn, Van Riel and Ambrosini (2004)
and Gonza´ lez, Dı´az and Trespalacios (2006) have found a negative effect
between perceived risk and store brand attitude.
Several studies have confirmed the importance of perceived risk in
store brand purchase. The perceptions of uncertainty and danger associated
with store brand purchase are key variables. They differentiate store brand
prone from national brand buyers Bettman (1973). Consumers with high
income find that generic products are risky contrary to national brands. The
purchase of store brands increases when consumer perceives less risk and
when a negative correlation exists between perceived risk and store perceived
quality. Familiarity with store brands and confidence in extrinsic attributes of
the product as discussed in Yelkur (2000), Meyers et al. (2006), Lilijander
et al. (2009).
Dowling and Staelin (1994) have proposed an extended model of
risk which is also relevant to store brands. In their model, consumers assess
their overall perceived risk based on prior knowledge, involvement, purchase
goals and usage and uncertainty and consequences relating to relevant product
attributes. The product attributes in turn are linked to functional, monetary,
social, and psychological risks. Zielke and Dobbelstein (2007) describes
these risks in terms of potential loss: functional risk is the potential loss which
results from inadequate product quality; financial or monetary risk is the
39
potential financial loss which results from a bad purchase. Social risk is the
potential loss of image or prestige resulting from the purchase or use of a
product, especially if used in public. Psychological risk of a brand is
associated with the consumption of the product and its symbolic aspects. This
risk exists to the extent that the consumer believes that he /she will be
negatively evaluated due to his or her brand choice.
DelVecchio (2001) finds store brands quality perceptions to be
higher in categories where functional risk is low. This is specifically present,
where consumers believe products are less complex to produce, and where
perceived there is little variation in functional quality or product performance
across brands. Similarly, Zielke and Dobbelstein (2007) have found that
consumers are more willing to buy new store brands in categories with low
perceived risk and conversely less willing in categories with high perceived
risk. Premium store brands are preferred over “classic” store brands and
generics where social risk is high. Méndez, Oubiña and Rubio (2008) have
reported that a larger price differential, between store brands and
manufacturer brands, leads to higher market shares for store brands in most
categories. It has no effect on store brands market share in categories
involving high levels of functional, psychological or social risk. This finding
suggests that consumers avoid store brands in high-risk categories regardless
of their price advantage.
2.3.2 Quality Variable
Quality is considered to be critical to achieving competitive
advantage. It is used by both practitioners and researchers to analyze key
business indicators such as competitiveness, image and customer loyalty as
viewed by Hansen and Solgaard (2004). It is acknowledged, however, that
there is a lack of clarity about the concept. Firstly, researchers offer many
different definitions and interpretations of quality. For example, perceived
40
product quality is defined by Zeithaml (1988) Hansen (2001) as ‘consumers
judgements regarding a product’s overall excellence or superiority’ (p.3) or
‘its ability to satisfy the expectations and needs of customers’ (p.282).
Secondly, the measurement of perceived quality is problematic because it is
subjected to the consumer’s own interpretation of its meaning.
According to Burt (2000), from a producer’s perspective the
product quality is defined on the basis of eight dimensions: performance,
feature, reliability, conformance, durability, serviceability, aesthetics, and
perceived quality. Sebastianelli and Tamimi (2002) have identified from
consumer’s perspective, product quality refers to the extent to which a
product meets or exceeds the consumer’s expectations.
With respect to store brands, quality is at the heart of the
competition between store brands and national brands. In terms of both, the
consumer’s desire for quality and the retailer’s ability is to deliver quality on
a par with that provided by national brands was found by Hoch (1996). This
view is supported by Veloutsou et al. (2004), who have reported that quality
is an equally important choice criterion for consumers when buying both
national brands and store brands. Some studies by Hoch and Banerji (1993),
Miranda and Joshi (2003), Sethuraman (2003) have found that quality is more
important than price in terms of consumer satisfaction with store brands; the
decision to purchase store brands and increase of store brands market share.
Rosen (1984) has examined three quality perceptions of grocery
products, including overall quality; quality consistency over repeat purchases,
and quality similarity across stores. The results show that store brands are
perceived as better than generics but as poorer than national brands in all
three quality areas. Dick et al. (1996) and Richardson (1997) have suggested
that store brands are undifferentiated in consumers’ minds, however, to the
41
extent that consumers use extrinsic cues to judge product quality. Therefore
store brands are at a disadvantage compared to national brands. Store brands
are less well known than national brands and lack a distinct identification with
a particular manufacturer. Sethuraman (2000) and Cunningham et al. (1982)
have identified that national brands provide hedonic utility and quality
whereas store brands are generally lower priced; poorly packaged; lack strong
brand recognition and are rarely advertised at the national level. Ailawadi
(2001) found that the national brands enjoy a level of equity and image, over
and above quality, that is not offset by the lower price of store brands. It is
generally recognized that consumer preferences for national brands are strong.
The competitive national brand assortment is critical for retail profitability
although store brands do provide leverage to retailers and allow retailers to
improve margins.
Harcar et al. (2006), Vahie and Paswan (2006) have explored that
the perceived quality is more important than the perceived price even in the
case of store brands. Perceived quality of store brands influences positively
the purchase decision of brands through the improvement of perceived values.
Lilijander et al. (2009) have found that store image improves perceived
quality and it also influences positively the perceived value of store brands,
which decreases the functional risk .The atmosphere within the store and the
quality of the store improve the perceived quality of store brands. The
congruence between national brands and store image influences negatively
perceived quality of store brand.
Abhishek and Koshy Abraham (2008) have examined how retailers
can influence the quality perceptions for store brands by providing additional
cues to the customers. The nature of additional cues will have differential
impact on quality perceptions of store brands vis-a-vis national brands. If the
retailer decides to push the store brands, the consumers will respond
42
depending on the underlying quality and other actions by the retailer that
equates national brands coincidently. The retailer generally pushes the store
brands by in-store promotions and allocating greater shelf space for store
brands. Retailers who carry store brands must develop high-quality store
brands and not just low priced brands. Low price image of store brands is
followed by stores through Every Day Low Price (EDLP) strategy. EDLP
made the normal price difference between national brands and store brands
more apparently with facilitated parity comparison. The distinct gap in the
level of quality between store brand and national brands has narrowed. Store
brands quality levels are much higher than ever before and they are more
consistent. One of the ways to improve quality perceptions of store brands is
through the use of feature differentiation that is the degree to which products
have different forms, sizes or packaging.
2.3.3 Price Consciousness
In addition to the influence of quality variable, it has long been
assumed that the lower price of store brands related to national brands is one
of the main factors affecting consumer attitudes towards store brands. A
number of researchers have investigated the effect of the price differential and
its related constructs such as price – quality associations. This section outlines
the findings of relevant price related studies.
Miranda and Joshi (2003) have described “Price Consciousness is
the degree to which consumers use price in its negative role as a decision-
making criterion” (p.23). Consumers’ perceptions of price are central in
influencing the purchase behavior. Though many definitions are offered by
Lichtenstein et al. (1993) and other authors towards ‘Price Consciousness’,
the study defines it as: “the degree to which the consumer focuses exclusively
on paying low prices” (p.19). The general consensus in research is that price
43
is the most important reason for purchasing store brands as stated by Burger
and Schott (1972); Burton et al. (1998); Sinha and Batra (2000).
Studies of store brands have often used ‘Price Consciousness’ as
one of the attitudinal characteristics describing store brand buyers. Batra and
Sinha (2000) have found that price consciousness is the strongest of all
variables studied, which significantly affects consumers’ propensity to buy
store brands. The results indicated that store brand purchase rises significantly
in product categories where consumers have higher price consciousness.
Batra and Sinha (2000) have found data from 12 different product
categories indicating that price consciousness directly increases store brand
purchase and it is the strongest predictor. Monroe and Krishnan (1985) have
reported that consumer price consciousness differs by product category and
some consumers are more or less price conscious toward a particular product
category because of perceived risk or personal importance. Sinha and Batra
(1999) have discovered that consumers are more price conscious in a product
category where they perceive greater risk and price unfairness by national
brands. In addition, it is found that purchase of store brand increases, as the
consequences of making a purchasing mistake decline.
Baltas (1997) has found that customers looking for the cheapest
brand, buy store brands because of lower prices or higher preferences. They
have a high frequency of shopping in that category and they are satisfied with
the available brands, are they more likely to buy store brands. The common
assumption is a store brand product is purchased on price basis. Some
researchers like Baltas and Doyle (1998) argue that consumers’ proneness to
store brands are due to other factors apart from price, such as preference.
Raju, Sethuraman and Dhar (1995b) and Burton et al. (1998) have
found that the important basis for selling store brand products are typically

44
lower in price compared to national brand products. The increase in the
market share of store brands has generally been linked to issues associated
with the prices. Ashley (1998) has also indicated that an increase in the price
of a store brand lowers the share of that store brand. For instance, Dhar and
Hoch (1997) have found that price gap between store brands and national
brands have an important and positive effect on store brand performance in a
category. These findings have implied that the low price of store brands is a
strong indicator enticing consumer purchase of the store brands.
Hoch and Banerji (1993) do not agree with the view that consumers
buy store brands merely because of the cheaper price. They argue that quality
is much more important than price. Miranda and Joshi (2003) have also
suggested that the consumer satisfaction with store brand quality and
performance is more important than satisfaction with a lower price.
Consistently, later studies also suggest that the economic benefit and cost-
related characteristics are the strongest correlates of store brands usage.
Ailawadi et al. (2001), Burton et al. (1998) Batra and Sinha (2000)
Raju et al. (1995) have also showed that consumers with favorable attitudes
towards store brands tend to focus on paying low price. By and large, findings
from most of the store brand studies illustrate a consistent pattern. This
pattern showed that consumers who opt for store brand products are
apparently sensitive to price. Store brands do well in product classes where
consumers are particularly price conscious in mind.
2.3.4 Price-Quality Association
Another determining factor in the store brand attitude is regarding
price and quality. Rao and Monroe (1989) have found that in certain
situations where customers use price as a quality cue, the relationship between
price and purchase willingness becomes weaker or even the reverse.
45
The association of price and quality has been widely studied in
analyzing consumers’ purchase decisions towards store brand. The research
by Lambert (1981), Rao and Monroe (1988) have suggested that consumer
perceived product quality and price inferences are often examined in the
literature within the context of price-quality association and store brand
attitude. Lichtenstein et al. (1993) states that Price-Quality Association is
defined as the generalized belief across product categories that the level of a
price cue is related positively to the level of product quality.
According to Go´mez and Fe´rnandez (2009) the relationship is
explained by two concepts called price consciousness and value
consciousness. Previous studies have used the concept of price consciousness
defined by Lichtenstein, Netemayer, and Burton (1972). Batra and Sinha
(2000) define Price –quality association “as the degree to which a consumer
focuses only on low prices to determine the relationship between price and
store brand attitude” (p.519). Using this definition, previous studies by Burton
et al. (1998), Batra and Sinha (2000), Ailawadi and Neslin et al. (2005), Jin
and Suh (2005) have found a significant positive direct relationship between
Price –Quality and store brand attitude.
Lichtenstein, Netemayer and Burton (1990), Dick, Jain and
Richardson (1995), Burton et al. (1998), Garretson, Fisher and Burton (2002),
Jin and Suh (2005) also supported the view that value consciousness has been
defined as “concern for paying low prices subjected to some quality
constraint” (p.44). The consumers who are aware of value show a positive
attitude towards store brands, taking into account the price-quality
relationship in which the price is considered in a broader sense.
The studies by Lichtenstein et al. (1993), Zeithaml (1988) have
described the value consciousness as “the quality one gets for the price one
46
pays” (p.23). Value consciousness implies consideration of quality not in
absolute terms, but in relation to the price of a particular brand. Contrary to
common perception is price becomes the premier factor of store brand
success. Hoch and Banerji (1993) have found that quality of store brand is
much more important than the level of price discount in determining the store
brand category share. This indicates that perceived quality is an equally
important factor of store brand success.
Cue utilization theory conceptualizes products as an array of
extrinsic and intrinsic cues that serve as quality indicators. Extrinsic cues are
peripherally related to the product like price and packaging, whereas intrinsic
cues are the characteristics of the core product like ingredients, taste, smell,
texture. The inferences of quality made from extrinsic and intrinsic attributes
will affect store brands attitudes negatively. This has been inferred by
Richardson, Jain and Dick (1996), Burton et al. (1998), Garretson, Fisher and
Burton (2002), Collins-Dodd and Lindley (2003).
Empirical research by Burton et al. (1998), Richardson et al. (1996)
have confirmed that value-related measures are positively related to store
brand attitude. Recently Garretson et al. (2002) has provided further evidence
that value consciousness is positively related to attitudes toward both store
brands and national brands.
Prior research by Wheatley, Chiu and Allen (1982), Burton et al.
(1998), Garretson et al. (2002) describe that high prices are positively related
to high quality perceptions, whereas low prices are positively associated with
low quality perceptions. Based on this definition, a lower priced product in a
category is viewed less favorably. This is because consumers apply low price
to some problematic attributes of the product, and perceive the product as
inferior in overall quality. Following this perspective, Burton et al. (1998)
have also found that consumers associate the low price of store brand
47
products with low quality. Consumers who are afraid of purchasing low-
quality products choose high-price brands to reduce purchase risk.
Burton et al. (1998), Garretson et al. (2002) have found that the
perception of price-quality association has a negative influence on store brand
attitude and purchase. Earlier research by Wolinsky (1987) indicates that a
positive relationship between price and quality relates consumer attitude
towards store brand purchase negatively. Later studies have also shown that
stronger belief of price-quality association increases consumers’ unfavorable
attitude to store brands and thus reduces the proneness to the purchase of
these products. Richardson et al. (1994) stated that although retailers set low
prices to encourage the purchase of store brands, the purchase encouragement
will not be effective. This is particularly the case for consumers who rely on
the factor that price are the quality assessment. The low prices of store brands
serve to exacerbate further unfavorable quality perceptions of store brand
products.
In general, prior studies by Erickson and Johansson, (1985) and
Lichtenstein and Burton (1989) have considered the perception of price as an
indicator of quality. They have stated that price-quality perceptions appear to
be a function of general schemas. Consumers easily generalize the association
of price with quality to other situations. Therefore, consumers who have
strong price-quality association will have a negative attitude towards low-
priced products including store brands.
Sckokai and Soregaroli (2006) have researched whether consumers
are benefited from private label development. Quality as a factor will lead to
an increase in national brand prices, as a response to private label
development. If national brand manufacturers react further differentiating
their products, they will increase the quality, leading to an increase in national

48
brands prices. Consumers are benefited in terms of price -quality, with respect
to private label development.
2.3.5 Search Experience
In addition to quality levels and quality consistency, consumer
reliance on search criteria or extrinsic cues to assess product quality has been
found to impact on perceptions of store brands and on perceived risk.
According to cue utilization theory, consumers often rely heavily on extrinsic
cues – attributes that are not part of the product, for example, brand name,
packaging and price – to assess product quality and evaluate brands. Batra
and Sinha (2000) have found that extrinsic and intrinsic cues are similar to
search and experience attributes respectively. Search attributes of a product
are assessed before purchase, for example ingredients information on the
package, whereas experience attributes or intrinsic cues are only
‘experienced’ through actual use for example, taste and aroma. The researcher
found that store brands purchase is higher in ‘search’ categories where quality
is assessed from the information on product labels. For example an over-the-
counter standard drug, and lower in more risky ‘experience‘ category like
coffee, a product trial is needed to assess product quality.
There is mixed evidence from other researches like Dhar and Hoch
(1997) about the effect of consumer reliance on extrinsic cues. One of the
major extrinsic cues - use of the store name for store brands responsible for
variation in store brands penetration across retailers has also been studied.
Veloutsou et al. (2004) have stated that consumers also consider other
extrinsic cues namely price and packaging, to be the most important choice
criteria while buying store brands. Other studies however by Mieres et al.
(2006), Richardson et al. (1994), Sprott and Shimp (2004) have found that
consumers rely on extrinsic cues namely brand name, packaging and price
rather than intrinsic cues. This leads to unfavorable perceptions of the quality

49
of store brands. The store brands prone consumers place significantly less
emphasis on extrinsic cues to assess product quality. Mieres et al. (2006)
similarly have reported that greater familiarity reduces the reliance on
extrinsic cues to assess the whole quality and it increases perceived quality.
Drawing on Erdem and Swait’s (1998) study, Batra and Sinha
(2000) have suggested that the search versus experience nature of the product
attributes is considered as one of the determinants of category-specific
perceived risk. Search-type attributes refer to the tangible features that are
verified before buying the product either through direct inspection or through
sources such as color, look, packaging, or ingredient content, which are
readily accessible to the purchasers. Experience-type attributes refer to the
untouchable, not-easily-described features that are confirmed only through
using the product, for instance, aroma, reliability, or endurance. It is verified
only by using it or by tasting it. As found by Batra and Sinha (2000) and
Nelson(1970) consumers tend to rely more on extrinsic cues such as a brand
name when confronted with ambiguous product attributes.
Batra and Sinha have found that consumers prefer national brands
to store brands in product categories where they cannot rely on the written
information provided by the product packaging, to assess accurately the
quality of important product attributes. In other words, this finding implies
that consumer proneness to store brands rises in categories where consumers
easily make purchase decisions based on searching accessible product
features. Other studies by Omar (1996) and Rothe and Lamont (1973) have
also shown that national-brand buyers rank usage experience as an important
criterion of brand choice more highly than store brand users.
Results from Batra and Sinha’s (2002) work indicate that
experience characteristics are more ambiguous than search attributes. The
consumers perceive lower quality variability and consequence of making a
50
purchase mistake in categories, where the products have more search than
experience attributes. Therefore, sufficient search attributes of store brand
products, which serve to compensate for the ambiguity and uncertainty
created by experience attributes, are helpful to increase consumer proneness
towards them. Consumers buy more store brands, if a category’s benefit is
judged objectively through package label information instead of the
requirements of actual using experiences.
2.3.6 Convenience
Some studies by Applebaum (1966) Hubbard (1978) Gautschi
(1981) assume that convenience is the primary reason for loyalty. Most work
in this area stems from a model proposed by Huff (1964). The Huff Model
states that customer patronage is directly proportional to utility factors given
by square feet and inversely proportional to disutility factors given by
physical distance. The benefit sought is convenience, where the factors such
as case in selection and packaging sizes to match consumers’ specific
requirements are identified. The limits to enhance loyalty is essentially seen
as the limited centripetal pull of a store/shopping centre. Location-related
variables are given importance in analyzing both trade areas and retail
patronage behavior. These studies most often count the benefits of locating a
store in a shopping centre/mall to increase the store ‘destination’ traffic rather
than to stay with the convenience pull. In fact, these studies determine
shopping centre traffic more accurately than single store traffic.
Within a given trade area, the studies by Arnold et al. (1983), Craig
et al. (1984), Louviere and Gaeth (1987) emphasize the ‘Uniqueness of
Assortment’ as a way of influencing store loyalty and patronage. In consumer
priorities, assortment and variety come after convenience and price. Given
that consumers are favorably inclined to revisit a store where they have had
positive shopping experiences. These studies suggest that competing stores
51
need to differentiate themselves based on type and quality of assortment. The
emphasis here is then on tailoring the environmental cues using retail mix
elements to foster loyalty. One often used strategy is developing own their
store brands. Consumers have distinct perceptions of national and local
brands vis-à-vis the retail store brands. It is observed that there are certain
product categories where ‘quality believability’ of national brands is far too
strong for store brands to make any impact on consumer loyalty.
2.4 STORE IMAGE
The review has so far examined the literature on the determinants
of consumer attitudes towards store brands. This next section is a discussion
on store image, its role and attitudes to brands in general and the link between
store image and store brands perception with reference to consumer
satisfaction.
Store image in the sense of the store as a brand is usually measured
in terms of consumers’ perceptions towards store performance. According to
Hartman and Spiro (2005) and Dimitriadis and Langeard (1990), the store
image is defined as the way that consumers view the store which means the
impression or perception of the store. The store image offers recognition,
familiarity, confidence, and other associations that make it easier for
consumers to make decision to try the product.
2.4.1 The store image construct
Businesses and business media and the previous studies by Hansen
and Solgaard (2004) and Martinea (1958) regard store image as critical to
retail success. This is because of the influence it has on store patronage
behavior and profitability. Store image, the subject of academic research for
many years, is defined fifty years ago as the ‘personality’ of a store or “the
52
way in which the store is defined in the shopper's mind, partly by its
functional qualities and partly by an aura of psychological attributes”.
Many researchers like Kapferer (1986), Sethuraman (2003),Hansen
and Solgaard (2004) have proposed that retailers need to differentiate
themselves from competitors not only in terms of functional attributes like
price and own brands but also with respect to consumer attitudes. Consumer
attitude has enhanced the personality of the store, which should be
communicated in a coherent way to give the store a singular identity. Because
consumers form images about a store by comparing to the images of other
stores. The consumers differentiate stores on various attributes such as
service, price and quality. The image and positioning of a store is have
become more important in a competitive environment. Image more than
quality also explains why consumers are prepared to pay a premium for
national brands over store brands.
According to Richards et al. (2007, p.1), “retailers now regard
horizontal competition with other retailers as perhaps, the most pressing
problem”. Reflecting the debate on the store image construct, researchers
have identified a variety of store image dimensions. Chowdhury et al. (1998)
have produced on a comprehensive review of the store image literature to
develop and test a “Superset” of store image items, after analyzing to identify
the most effective measures of shopping behavior. The scale developed by
Alhemoud (2004) comprising certain dimensions of store image used to
measure store choice attributes. The researchers have concluded that
structured scales measuring store image are more effective than non-
structured scales in predicting shopping behavior. Ailawadi and Keller’s
(2004) review of past research of store image focus on location, atmosphere,
price and promotion and assortment. Hansen and Solgaard (2004) have
mapped the images and position of a grocery retail chain store by measuring
53
customer perceptions of other store attributes including quality, variety, price,
service and atmosphere.
As indicated above, store image is linked with consumer
perceptions of the price and quality of the brands which are sold in the store.
An empirical study by Baker et al. (2002) identifies that favorable store
atmosphere in terms of store design, results in more favorable perceptions of
merchandise quality. It also leads consumers to believe that merchandise
prices are higher. The later study by Porter and Clay Comb (1997) identifies
that perceived merchandise value is driven strongly by perceptions of
merchandise price and quality but not by other store image factors such as
perceptions of service. The interdependent nature and relationship between
brand image and store image is summed up and are inextricably linked to one
another.
Dawar and Parker (1994) on the other hand have found that while
consumers do use store name as a signal of product quality, they rely much
more on other signals like brand name and price. This is because store name
or retailer’s reputation is not specific to product quality, since retailers sell
competing products over a broad quality range. This outcome and explanation
are extremely different for store brand, though they are generally exclusive to
particular retailers and even carry the store name.
Other studies have specifically examined the effects of store image,
or aspects of it, on consumer responses to brands and products. Iyengar and
Lepper (2000) have confirmed that store reputation is a cue to product quality.
Kahn and Wansink (2004) and Sayman and Raju (2004) have found that
corporate image also has a positive influence on consumer responses to
brands and store name. On the basis it is assumed to be a cue to store image
and influences consumer product evaluations. Out of it the store name
54
positively affects store image and it affects purchase intentions for a product.
The research on corporate identity-image-reputation by Barnett et al. (2006)
has suggested that stores with favorable store image create customer
satisfaction which in turn leads to store loyalty.
2.4.2 The effect of store brands on store image
Dawson, Findlay and Sparks (2008) have found that store image
plays a role in attitudes towards store brands. The complex relationship in
the retailer brands will also have an important role in positioning the retailer
in consumers’ minds. Dawson et al. (2008) have explained that the retailer
encompasses not only store brands but all aspects of the retailer’s operations
including employee service and store format, in order to portray certain image
of the store.
Previous research by Patti and Fisl (1982) examine that store
brands also enhance store differentiation. The store brand cannot be bought
elsewhere and therefore is not directly substitutable by switching to another
store. The store brand ultimately differentiates the retailer from competitors
and helps to create customer franchise, traffic and loyalty. The store brands
not only give higher profits through better margins, but also have an indirect
effect on store profitability by enhancing store image, creating customer
loyalty and additional turnover. Strong store brand lines also strengthen the
retailer’s position in the distribution channel.
Burt (2000) has associated the adoption of the retailer as a brand in
grocery retailing, where retailers gain greater buying power and become more
centralized. This leads to a greater recognition of the importance of trade
name and corporate identity in developing image. Retailers have also begun to
appreciate the customer perceptions of the store associated with the store
name which would transfer to perceptions of the retail brands. This
55
development has seen the repositioning of retail brands over time, from the
first generation generics which are unbranded to fourth generation premium
store brands as analyzed by Laaksonen and Reynolds (2002).
Dhar and Hoch (1997) have found that the use of the store name
on store brands products is a positive factor in explaining variances in store
brands penetration across retailers. They have indicated that this branding
strategy is likely to have an impact on retailer image. Later studies by
Anselmsson and Johansson (2007), Giraldi, Spinelli and Merlo (2003), Hoch
and Lodish (1998), Corstjens and Lal (2000) Esbjerg et al. (2004), Sudhir
and Talukdar (2004) confirm that store brands are important to build store
image and to enhance retail store differentiation. Collins Dodd and Lindley
(2003) have suggested that there will be reciprocal effects between store
image and store brands. For example, a weak store image resulting from
inconsistent positioning could be strengthened by a strong store brands
programme. Anselmsson and Johansson (2007) have reported that store
brands build store image and in general the perceived value of store brands
increases the perceived value of the store‘s products .
2.4.3 The effect of store image on store brands
As the above discussions suggest, a number of researchers have
highlighted the role of store brands contribution to store image and retailer
differentiation. Few studies have investigated the effect of perceived store
image on consumer attitudes to store brands. Dick et al. (1995) have
suggested that as the consumers still doubt the quality of store brands,
retailers need to pay attention to store brands quality and cues that signal
quality such as packaging, brand image and store image. Ailawadi and Keller
(2004) have suggested that providing high quality national brands enhances
consumer perceptions of the retailer’s overall image, which in turn improves
perceptions of the retailer’s store brands.
56
Semeijn et al. (2004) have found that consumer judgements of store
brands are influenced by the perceptions of store image. The store image acts
as a “Risk Reducer” by reducing functional and psychosocial risk associated
with buying store brands in certain categories. Adding to these findings,
Vahie and Paswan (2006) have reported that consumer perceptions of the
quality of store brands in the apparel market are influenced by the store image
dimensions of store atmosphere and store quality. Liu and Wang (2008) have
found that store image is a strong predictor of general attitudes to store brand,
while it does not affect attitudes towards national brands. Looking specifically
at service, Huang (2009) has found that the quality of service offered by
retailers is a strong predictor of the perceived quality of store brand. Guerrero
et al. (2000) has found that the perception of store brand quality depends on
the store and have proved further that store image plays a role in store brand
attitudes.
Collins-Dodd and Lindley (2003) have found cue utilization theory
and the brand extension construct to posit that consumer perceptions of stores
can be generalized to specific store brand. The study confirms the hypothesis
that consumers’ perceptions towards store image and specific store brand are
positively associated. The authors also posit that as retailers are positioned
differently in consumers’ minds, perceptions of specific store brand also
differ across stores. The hypothesis is not confirmed, as store brand is
perceived most favorably by consumers who shop most at the store. The
authors conclude that familiarity plays an important role. Collins-Dodd and
Lindley conclude that store brand plays an important role in retail
differentiation.
57
2.5 RELATIONSHIP BETWEEN STORE IMAGE WITH
CUSTOMER SATISFACTION AND LOYALTY
2.5.1 Customer Satisfaction
Oliver (1980) defines customer satisfaction as “Customer
satisfaction is a summary of psychological state when emotions surrounding
disconfirmed expectations are coupled with the consumer’s prior feelings
about consumption experience” (p.62). Johnson and Fornell (1991) have
pointed out that the assessment made by customers after a specific purchase
leads to transaction of specific customer satisfaction, whereas the overall
satisfaction results from the customers rating the brand, based on all
encounters and experiences.
Fornell (1992) opines that customer satisfaction increases customer
loyalty and reduces the operating costs by increasing the number of
customers; improving the effectiveness of advertising and enhancing business
reputation. Howard and Sheth (1969) have stated that customer satisfaction is
the buyer’s cognitive state of being rewarded adequately or inadequately for
the sacrifices he has undergone.
According to Anderson and Fornell (1994) “Customer satisfaction
is central to assessing past performance and predicting future financial
success and then it is an urgent need to transcend old ways of doing business
and find new ways to effectively acquire and retain customers”. According to
Ostrom and Lacobucci (1995) customer satisfaction is a relative judgments
made by the customer, which reflects the benefits as well as quality obtained
through the purchase.
2.5.2 Store Loyalty
In the branding literature is a favorable brand image will have a
positive impact on consumers behavior towards the brand, such as

58
opportunity to command premium prices; buyers who are more loyal and
more positive word of mouth. The store loyalty is operationalized as the
primary store at which the respondent does his or her daily shopping. It
should be positively associated with store brand equity. Rao (1969) has
already found that when store brand purchasers switched stores, they are
prone to buy the own label of the new store. Similarly, East et al. (2000) have
inferred that a positive attitude towards the store and its brands is the outcome
of loyal behavior. Consumers, who use a store proportionately more and over
longer periods of time, will exhibit a more positive attitude towards the store
and its brands. Store-loyal consumers trust their chosen store and become
familiar with its store brands.
2.5.3 Brand Loyalty
In the branding literature, a consumer is said to be brand loyal,
when consumer consistently purchases a single brand. A consumer who is
loyal to a particular store brand, demonstrates a high level of brand recall. In
addition it is likely that this particular store brand enjoys a favorable brand
image. Knox and Walker (2001) and Ailawadi et al. (2001) have
demonstrated empirically that the store brand focused customer segment
mainly contains store-loyal customers. This implies that once a consumer is
store loyal, he/she is more inclined to value and purchase the store brand of
that particular store.
Dick et al. (1996) have found that the retailer has transferred
loyalty to the store preference for premium priced products carrying the
store’s brand. This strategy allows retailers to challenge the dominance of
national and international brands in particular markets. There is a relationship
between the store’s brand and the retailer’s brand that the store sells, as a
retailer, is a critical element in the development of the store brand.
59
Loyalty is a critical element of brand equity and it is an area where
retailers have a degree of advantage. The consumers remain loyal to a given
retailer even when the retailer stops selling a brand to which the consumers
have been loyal. The retailer is willing to exercise his power to gain
advantage from the greater degree of loyalty. Moreover, Krishnamurthi and
Raj (1991) have showed that few brand loyal consumers are price sensitive,
and support brand equity. A store brand enjoys brand equity among
consumers who are already loyal to the store brand. Brand equity is present
when consumers are loyal to the store carrying the store brand. It is
commonly accepted that store brands create store loyalty. Consumers who are
loyal to one of the store brands exhibit a strong level of brand equity of the
store brand.
The rise of the retailer as a brand is considered to be one of the
most important trends in retailing. In this context, a favourable store image
increases satisfaction with the store which in turn increases store loyalty. A
number of earlier researchers namely Osman (1993) and Blomer and
De Ruyter (1998) have identified that consumers’ perceptions of the retailer;
the role of consumer trust and satisfaction with the brand and the relationship
between retailer trust and satisfaction ultimately results in retailer repurchase
intention. Repurchase intentions along with loyalty; willingness to pay a price
premium; word-of-mouth; quality products and service of employees
represent the behavioral intentions described by Zeithaml et al. (1996). Oliver
(1997) suggests that loyalty and repurchase intentions aspects of the
taxonomy are most similar in nature. Furthermore, Delgado-Ballester and
Munuera-Aleman (2001) and Macintosh and Lockshin (1997) use repurchase
intention as an element of loyalty in brand and store contexts respectively.

60
Taking this concept further, Grewal et al. (2004) have developed a
conceptual model depicting store image as a combination of manufacturer
brands, store brands and the store itself as a brand. If consumers like retailers’
operation as a retailer and the choice of brands in the store, they are satisfied
with the store and the satisfied customers are assumed to be loyal customers.
An empirical research by Martenson (2007) has investigated the impact of
store image on customer satisfaction and loyalty and emphasized the fact that
the store offering store brands is relevant to store image. Customers view
“Store as a Brand” which is measured by relationships with customers, store
aesthetics, assortment and price to be more important. Manufacturer brands
are the least important determinant of store image, which suggests that they
do not play a role in store differentiation, as they are found in many stores.
The ultimate goal of most retailers is to have loyal customers.
Loyalty is the outcome of customer satisfaction as studied by Oliver (1997).
Szymanski and Henard (2001) study has proved that, there is a positive
significant correlation between satisfaction and repeat-purchase. It implies
that satisfied customers will be more loyal to the main store.
2.6 THE RESEARCH GAP
A plethora of studies by Corstjen and Lal (2000), Labeaga et al.
(2007) has taken into consideration the different effects of store brands entry
in markets. The several research studies by Collins-Dodd. C and Lindley
(2003), Sayman and et al. (2002), Scott Morton and Zettllmeyer (2004)
Ailwadi and Harlam (2004) have identified that the ability of the store brands
to develop consumer store loyalty; role of these brands to differentiate the
retailer and the positioning of store brands which emphasize the retailers to
generate high margins on store brands. Past studies by Anselmsson and

61
Johansson (2007) on store brands have mostly examined the research of
conventional markets where store brands are not so well established and as
they are in the earlier stages of development. Perhaps in response to this gap,
a number of more recent studies have examined store brands in different
countries and the studies have found that consumers in different countries
have different perceptions of store brands, and that, in more established
markets, quality also plays a key role. However, past studies by Medina,
Mendez and Rubio (2002), Rondan Navarro and Phau (2006) and Mendez
Oubina and Rubio (2008) have not included a conceptualization of store
brand loyalty. Yet store brands are slowly gaining consumer loyalty. Indeed,
store brands establish consumer loyalty to such a degree that the price gap
between store brands and national brands has been eroded.
The focus of this research to establish the relationship among store
choice, store brand factors, satisfaction and store loyalty. The store brand
perception and store choice attributes are the independent variables and
consumer satisfaction and store loyalty are the dependent variables. The
independent variables of store brand perceptions which include factors like
Perceived Risk, Quality Variability, Search Experience, Price consciousness,
Price & Quality Association and Convenience. The independent variables of
store choice attributes are considered as latent variables which includes
Attractive display, Value for money, Good brand name, Availability of
specific products, Prices are affordable, Products are trust worthy, Best
service by employees, Extensive varieties of products, Wide range of
promotions and offer, Nearness to residence.

62
Perceived Risk
Quality Variability
Search Vs. Experience
Price Consciousness
Price &Quality Association
Convenience
Store
Choice
Attributes
Consumer Satisfaction
Store Brand Perception
Store Loyalty
Figure 1.1Research model
2.7 SUMMARY
This chapter has reviewed studies relevant to consumers attitudes
towards store brands and to identifies the link among store image and store
brands, satisfaction store loyalty. Consumer perceptions and determinants of
attitudes to store brands are discussed in this chapter. Studies relating to the
effect of store image on brands and on store brands in particular are also
examined. More importantly, this chapter has reviewed a number of studies
that have investigated consumer-level factors influencing consumer
preference for store brands and their purchase. In particular, this chapter has
discussed Batra and Sinha’s (2000) and Shaoshan Chen (2005) study in detail.
Based on their study, some additional consumer factors are discussed. These
factors include consequences of making a mistake in a purchase; quality
variability; the search versus experience nature of product features; price
consciousness; price-quality association; convenience, store loyalty and brand
loyalty. Findings of extant studies have shown that these important factors
have different degrees of influences on consumer preference for store brand
products.
63
Store image and retailer differentiation are considered by both
practitioners and researchers to be critical to retail success, although there is
debate in the literature on the conceptualization and operationalization of the
store image construct. Studies show a clear link between store image and
attitudes to brands sold in the store in terms of price, quality, value, image and
assortment, although the relationship is interdependent. Similarly, store
brands influence store image and there are evidences to prove that store image
influences attitudes to store brands. Through this review, knowledge gaps are
highlighted. In this the researcher has to examine the relationship among store
image, store brand factors consumer satisfaction and store loyalty.
64
CHAPTER 3
METHODOLOGY OF THE STUDY
3.1 INTRODUCTION
This chapter discusses the constructs based on the literature
review, and describes the design of research methodology underlying the
examination of the relationships and it aims to provide assurance that
appropriate procedures are followed. As reviewed in chapter two, a number of
consumer-level constructs are under investigation in the current study. These
constructs include determinants of consumers’ attitude towards store brand
purchase. In addition, the influences of demographic characteristics on store
brand attitude, consumer preference for store choice and purchase parameters
of store brands are also investigated.
This chapter is organized in five sections. It starts with research
methodology, research design and justifications for the research design used
in the current study. This is followed by the details of the research methods
scale development, questionnaire design, pre-testing of the questionnaire,
sample design, data collection and reliability of the data. Finally, the
procedures and tools used for analyzing data are provided and the locations
where the multiple regressions are employed to examine the relationships are
also discussed.
3.2 RESEARCH METHODOLOGY
The research methodology enlightens the methods to be followed in
research activities starting from investigation to presentation.
65
3.3 RESEARCH DESIGN OF THE STUDY
Research design is the arrangement of conditions for collection and
analysis of data in a manner that aims to combine relevance to the research
purpose with economy in procedure. It illustrates that descriptive studies
discover answer to the questions who, what, when, where and sometime how
the research is being carried over. The present study is a descriptive research
in nature since the study describes the consumers’ perception of store brands
in retail sector and preferences of various retail outlets.
3.3.1 Justification for the research design
Batra and Sinha’s (2000) study has adopted a quantitative research
design to investigate relationships and determinants to store brand purchase.
The major purpose of researches by Chen (2005) and Fraser (2009) is to re-
examine the hypotheses. With respect to these previous studies, the
constructs are developed based on the format of Batra and Sinha’s (2000) and
together with other extant studies. Since this study attempts to test or verify
the relationships between these previously developed constructs it also
generates new variables, a positivist and quantitative research methodology
which are appropriate. Within the quantitative disciplines, the research
process of this study is objective rather than subjective and the measurement
scales for the constructs are adopted from prior studies.
In addition, the current research replicates and extends Batra and
Sinha’s (2000) and Chen’s (2005) studies which describe the characteristics
of the consumer with the help of demographic profile, factors which
influence store choice, various parameters of store brand purchase in retail
outlets, the factors which measure store brand and identification of the effect
of relationship between consumer satisfaction, store choice and store loyalty.
Apart from this, the present study has its own predetermined objectives and
also the methodology to fulfill the objective. The data are collected through a
66
survey by using structured questions where the response options had been
predetermined and a large number of respondents are involved. The statistical
methods are used to examine the data obtained from the survey.
3.4 RESEARCH METHODS
This section presents details of the research methods used to collect
data to examine the relationship among consumer satisfaction, store image
and store loyalty and preferences of store brand purchase. It moves on to
discuss the development of measurement scales, followed by the design of the
questionnaire. The sample design and data collection are explained in the
following sections.
3.4.1 Scale development
The subsection discusses how to develop scales to measure the
consumer constructs that are examined in the current study. The Likert scales
are most widely used in measuring personality, perception, social and
psychological attitude research described by Hodge and Gillespie (2003).
Some researchers like Churchill and Iacobucci (2002) support the idea that a
positive relationship exists between the number of scale points over the
normal range and the reliability of the measurement.
The scales used to measure store choice attributes are based on
those developed by Abdulla Alhemoud (2004). The five point Likert’s scale
comprises of six dimensions of store image: product variety, product quality,
prices/value, service, atmosphere and convenience, with each dimension
consisting of three items. Consequently this research uses the variables
indicated in the original study as the main sub-scales, and the items from the
relevant dimensions in the study to make up items within each scale. The
result is a store choice scale comprising ten main variables: attractive display,
value for money, brand name, availability of specific products, affordable
67
prices, trust worthy products, best service by employees, extensive varieties
of products, wide range of promotional offers and nearness to residence.
The next section of survey is developed from previous literature on
consumer preference of meat attributes, the marketing study by Chen et al
(2002) has provided a guideline for the measurement of product purchase
parameters like cleanliness, inspection stamp and certificate, proper
packaging, purchase convenience, competitive price, food safety, easiness to
prepare, flavor, freshness and discount.
Following the research design, this study used five point Likert
scales to measure the six attitudinal constructs and their effect on consumer
satisfaction and store loyalty. With regard to the measurement of store brand
constructs, the researcher has used five items to measure search experience
and four items in each of other three determinants namely price
consciousness, quality variable and perceived risk and three items to measure
convenience and price and quality association. Churchill and Iacobucci (2002)
have noted that the reliability of the measure increases as the number of items
increases. Higher reliability is generally associated with increasing numbers
of the measuring items. As far as consumer satisfaction and store loyalty are
concerned, the four measuring items are also taken from the extant studies
done by Ailawadi et al (2001),Garretson et al (2002) and Thenmozhi (2010).
As a result, twenty-three 5-point Likert-scaled items are designed to
measure the six perceptual constructs investigated in this research. In
addition, dependent variables like store choice attributes are measured by the
5-point Likert scaled item as provided in Abdullah Alhemoud(2004) from 5 -
strongly agree to 1- strongly disagree and in Xiaoping Miao (2003)study,
from 5-extremely important to 1-not important at all to evaluate the
importance level of store brand product purchase parameters.
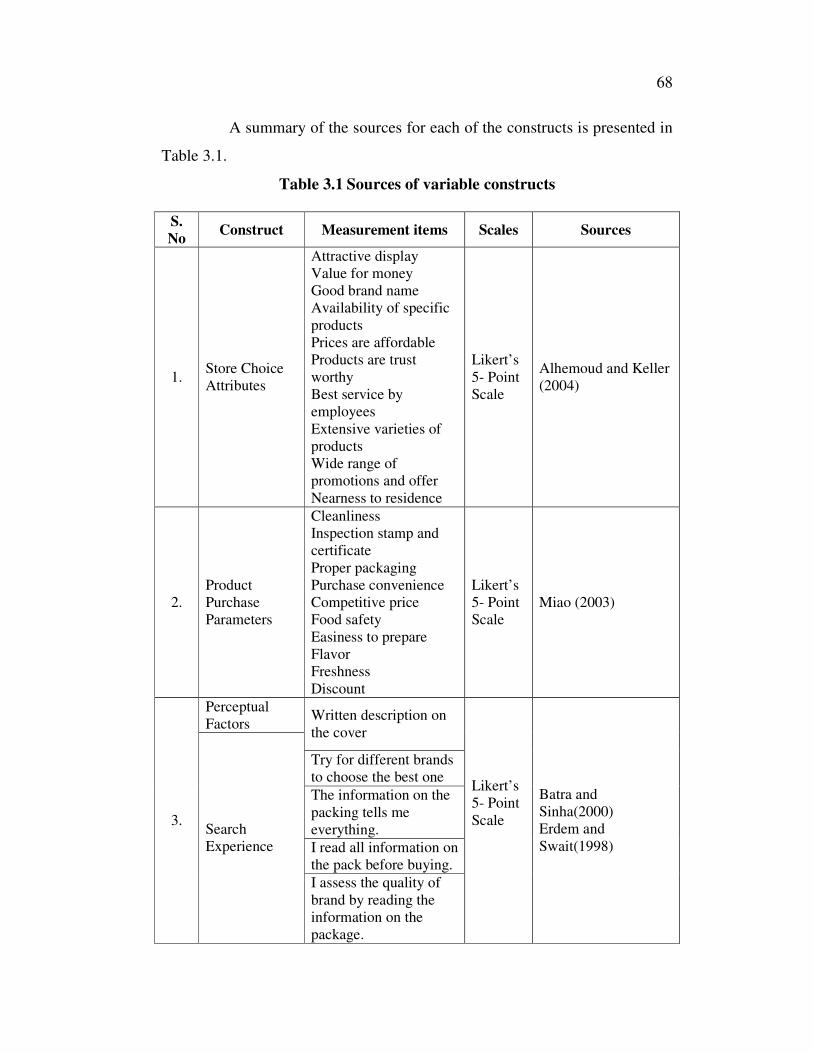
68
A summary of the sources for each of the constructs is presented in
Table 3.1.
Table 3.1 Sources of variable constructs
S.
No Construct Measurement items Scales Sources
1. Store Choice
Attributes
Attractive display
Value for money
Good brand name
Availability of specific
products
Prices are affordable
Products are trust
worthy
Best service by
employees
Extensive varieties of
products
Wide range of
promotions and offer
Nearness to residence
Likert’s
5- Point
Scale
Alhemoud and Keller
(2004)
2.
Product
Purchase
Parameters
Cleanliness
Inspection stamp and
certificate
Proper packaging
Purchase convenience
Competitive price
Food safety
Easiness to prepare
Flavor
Freshness
Discount
Likert’s
5- Point
Scale
Miao (2003)
Perceptual
Factors Written description on
the cover
Try for different brands
to choose the best one
The information on the
packing tells me
everything.
I read all information on
the pack before buying.
3. Search
Experience
I assess the quality of
brand by reading the
information on the
package.
Likert’s
5- Point
Scale
Batra and
Sinha(2000)
Erdem and
Swait(1998)
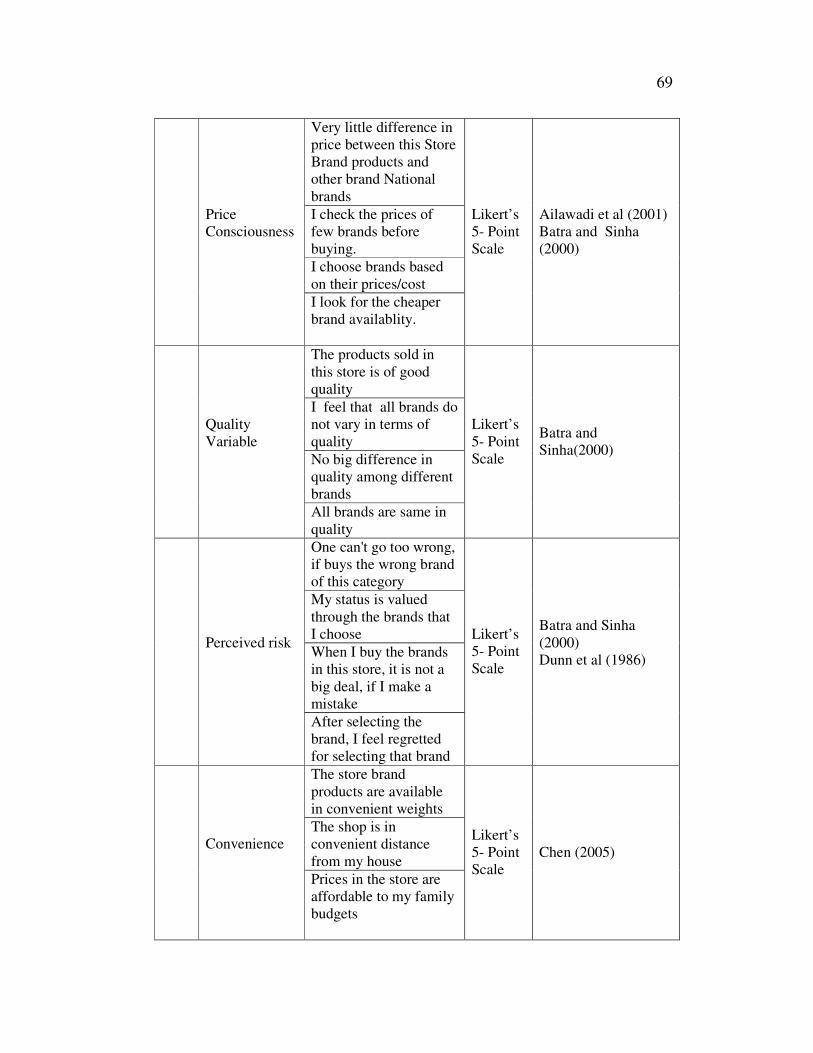
69
Very little difference in
price between this Store
Brand products and
other brand National
brands
I check the prices of
few brands before
buying.
I choose brands based
on their prices/cost
Price
Consciousness
I look for the cheaper
brand availablity.
Likert’s
5- Point
Scale
Ailawadi et al (2001)
Batra and Sinha
(2000)
The products sold in
this store is of good
quality
I feel that all brands do
not vary in terms of
quality
No big difference in
quality among different
brands
Quality
Variable
All brands are same in
quality
Likert’s
5- Point
Scale
Batra and
Sinha(2000)
One can't go too wrong,
if buys the wrong brand
of this category
My status is valued
through the brands that
I choose
When I buy the brands
in this store, it is not a
big deal, if I make a
mistake
Perceived risk
After selecting the
brand, I feel regretted
for selecting that brand
Likert’s
5- Point
Scale
Batra and Sinha
(2000)
Dunn et al (1986)
The store brand
products are available
in convenient weights
The shop is in
convenient distance
from my house
Convenience
Prices in the store are
affordable to my family
budgets
Likert’s
5- Point
Scale
Chen (2005)
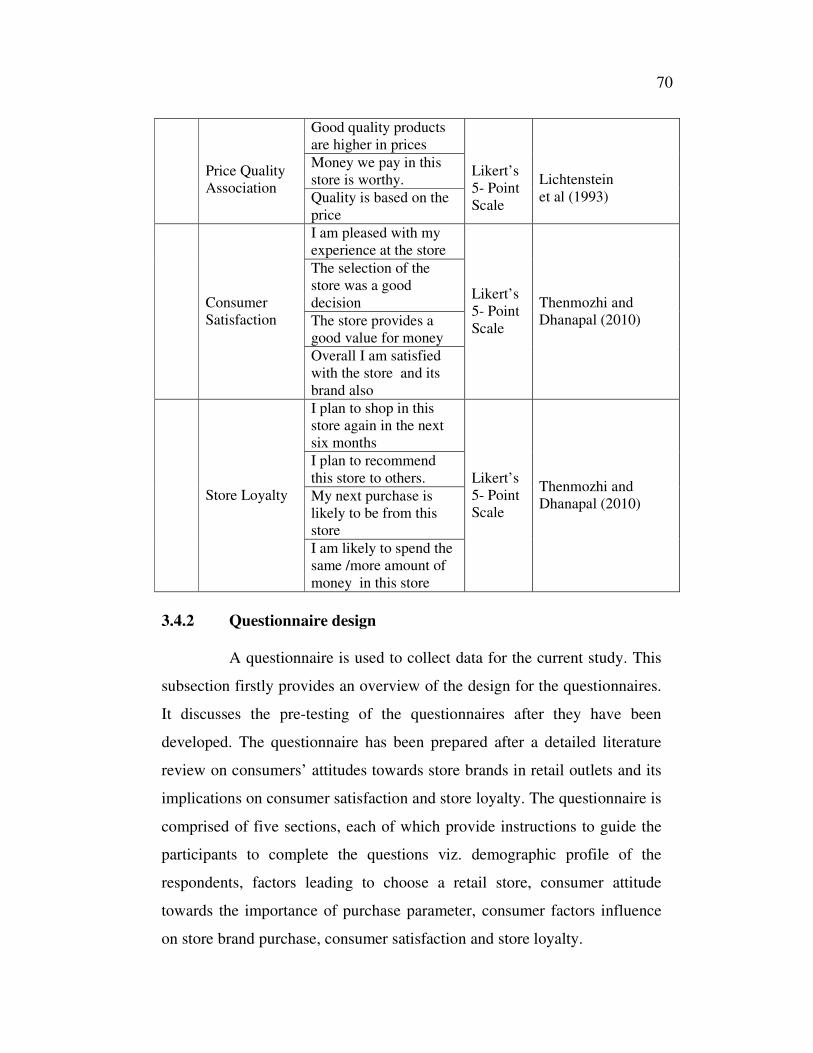
70
Good quality products
are higher in prices
Money we pay in this
store is worthy.
Price Quality
Association
Quality is based on the
price
Likert’s
5- Point
Scale
Lichtenstein
et al (1993)
I am pleased with my
experience at the store
The selection of the
store was a good
decision
The store provides a
good value for money
Consumer
Satisfaction
Overall I am satisfied
with the store and its
brand also
Likert’s
5- Point
Scale
Thenmozhi and
Dhanapal (2010)
I plan to shop in this
store again in the next
six months
I plan to recommend
this store to others.
My next purchase is
likely to be from this
store
Store Loyalty
I am likely to spend the
same /more amount of
money in this store
Likert’s
5- Point
Scale
Thenmozhi and
Dhanapal (2010)
3.4.2 Questionnaire design
A questionnaire is used to collect data for the current study. This
subsection firstly provides an overview of the design for the questionnaires.
It discusses the pre-testing of the questionnaires after they have been
developed. The questionnaire has been prepared after a detailed literature
review on consumers’ attitudes towards store brands in retail outlets and its
implications on consumer satisfaction and store loyalty. The questionnaire is
comprised of five sections, each of which provide instructions to guide the
participants to complete the questions viz. demographic profile of the
respondents, factors leading to choose a retail store, consumer attitude
towards the importance of purchase parameter, consumer factors influence
on store brand purchase, consumer satisfaction and store loyalty.
71
The first section consists of eight demographic informations to
enable the profile of the consumer namely gender, age, level of occupation,
average monthly grocery expenditure at the store, duration of consumer visit
and store brand purchase , frequency of purchase, preference of grocery items.
They have been taken from the measures adopted from Shaoshan Chen
(2005), Thenmozhi and Dhanapal (2010) and Piyali Ghosh and Anil Kumar
(2009); the aim is to establish the demographics among shoppers at the four
retail stores.
The next two sections in the questionnaire are comprised of
statements related to factors influencing store image like independent
variables and consumer attitudes towards the purchase parameters like
dependent variables. The wordings of these items have been taken from the
measures adopted by Abdulla Alhemoud (2004). The variables of store choice
attributes are attractive display; value for money, brand name, availability of
specific products, affordable prices, trust worthy products, best service by
employees, extensive varieties of products, wide range of promotional offers,
and nearness to residence and the patronage behavior. Literature basically
focuses on studying the principal attributes that influence a customer’s
shopping decisions and on investigating the interactions among these
attributes. This stream of research is guided by the presumption that the
consumer’s selection decision is not made on the basis of only one attribute;
rather, a set of attributes collectively plays a critical role, in how the customer
chooses to patronize a specific store and comprises the stores’ image.
The third section finds out the consumers’ attitude towards the
importance of purchase parameter while purchasing store brands in certain
product categories like grocery, cereals and dhal items. In this study a
consumer utility function, associated with the purchase of store brand, is
expressed in terms of relative importance level/ranking for selected store
72
brand grocery products. The specific ten store brand characteristics include
cleanliness, inspection stamp and certificate, proper packaging, purchase
convenience, competitive price, food safety, easiness to prepare, flavor,
freshness and discount as stated by Xiaoping Miao (2003).The respondents
will circle the number on the five point Likert scales to indicate the opinion
on each statement.
Section four provides twenty-three 5- point Likert scales question
items that measure the consumer factors influence on store brand purchase. It
includes 23 statements related to the study that are requested to examine the
consumers’ attitude towards store brands, which has been adopted from Chen
(2005). It is classified under six dimensions namely price consciousness,
quality variability, price and quality association, search experience, perceived
risk and convenience.
The section five of the questionnaire deals with consumer
satisfaction and store loyalty. Consumer satisfaction deals with four
statements related to the satisfaction of the consumer in relation to the store
brands offered by the retail outlets. The store loyalty deals with the four
statements related to loyalty towards the retail outlets, which consumers visit
for shopping .They are asked to rate the four variables listed on five point
scale according to their level of expectation. All the statements in the
interview schedule are in a positive note to avoid unnecessary confusion
among participants.
3.4.3 Pre-testing of the questionnaire
The purpose of questionnaire pre-testing is to ensure that item
wordings, flow of questions, suitability of measurement scales, instructions,
and other aspects of the questionnaire are understandable. Churchill and
Iacobucci (2002) stress that data collection should never begin without an
73
adequate pre-test of the instrument. Although the items used in this study are
taken from the extant studies which have established the measurement, this
step is necessary. It is because those wordings have different meanings and
connotations in different cultural contexts. Questionnaire pre-testing helps to
rectify any inadequacies beforehand.
A pre-test is conducted among 85 consumers at the organized retail
outlet and 5 academicians and 10 students of management studies, to seek the
comments based on the feedback about the questionnaire. Certain
modifications in item wordings have been made to enrich the quality of the
final draft of the questionnaire. Besides re-checking the understanding of the
items and scales and layouts, time for completion of a questionnaire is also
calculated. Respondents said that questions are clear and easily answered. It
takes approximately ten minutes to complete one questionnaire.
3.4.4 Sampling frame work and design
The sampling process includes the following steps : 1) Defining the
population, 2) Establishing the sample frame, 3) Specify sampling method
and 4) Determining the sample size. The population for this is the consumers,
visiting organized retail outlets at Madurai, who have shopped in any one of
the four major retail outlets namely Reliance, More, Spencer’s and SKDS. In
this study consumers who are holding permanent membership card for more
than two years are taken as respondents. It is ensured that the consumers who
are the card holders of the chosen retail outlets have responded well for this
study. The shoppers are contacted outside the entrance of the retail outlet so
that it will not disturb the normal business of the retail outlet.
For the purpose of developing the sample frame, Sudman (1980)
has proposed sampling procedures, to reduce sampling bias associated with
store intercept surveys. In accordance with the design, the current research has
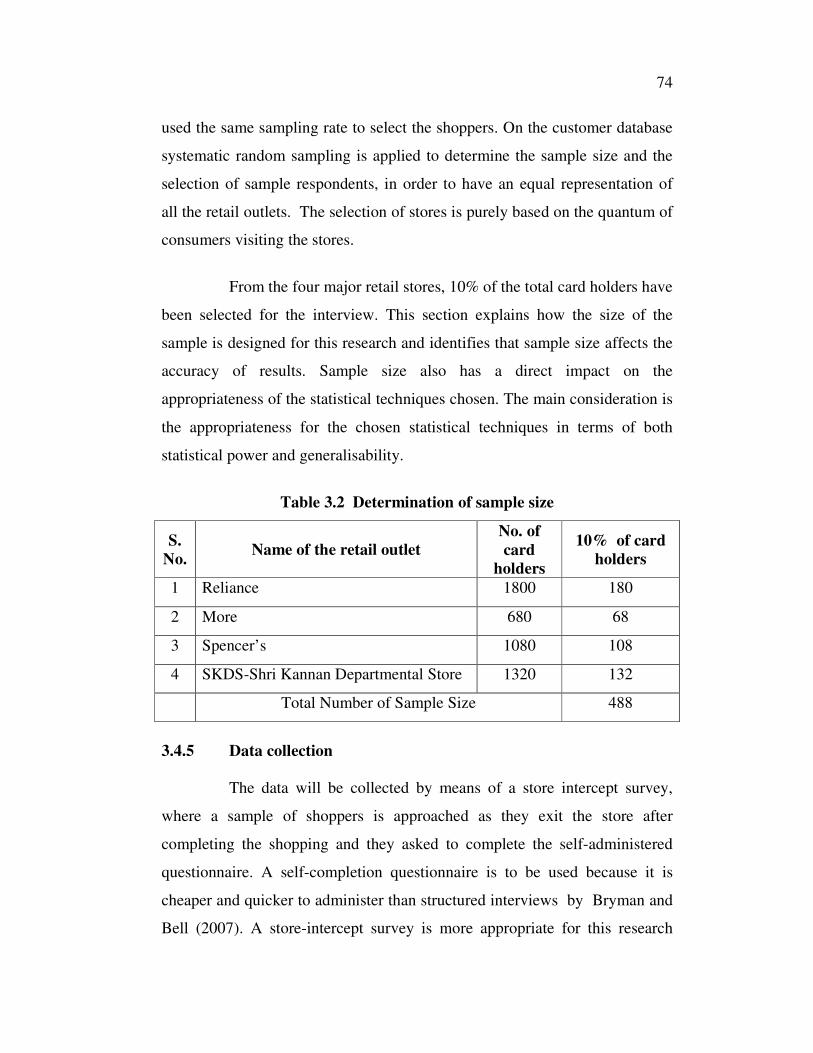
74
used the same sampling rate to select the shoppers. On the customer database
systematic random sampling is applied to determine the sample size and the
selection of sample respondents, in order to have an equal representation of
all the retail outlets. The selection of stores is purely based on the quantum of
consumers visiting the stores.
From the four major retail stores, 10% of the total card holders have
been selected for the interview. This section explains how the size of the
sample is designed for this research and identifies that sample size affects the
accuracy of results. Sample size also has a direct impact on the
appropriateness of the statistical techniques chosen. The main consideration is
the appropriateness for the chosen statistical techniques in terms of both
statistical power and generalisability.
Table 3.2 Determination of sample size
S.
No. Name of the retail outlet
No. of
card
holders
10% of card
holders
1 Reliance 1800 180
2 More 680 68
3 Spencer’s 1080 108
4 SKDS-Shri Kannan Departmental Store 1320 132
Total Number of Sample Size 488
3.4.5 Data collection
The data will be collected by means of a store intercept survey,
where a sample of shoppers is approached as they exit the store after
completing the shopping and they asked to complete the self-administered
questionnaire. A self-completion questionnaire is to be used because it is
cheaper and quicker to administer than structured interviews by Bryman and
Bell (2007). A store-intercept survey is more appropriate for this research
75
work.Furthermore, Batra and Sinha’s (2000) and Shaoshan Chen (2005) data
are collected from a mall -intercept survey. Following the research design, the
data for this study is collected from shoppers in a organized retail outlet.
In this study, the sampling frame in theory is comprised of all
consumers of the stores. The issue of sampling control arises because only
customers, shopping at the store on the designated day and times, will have a
chance of being included in the survey. With respect to cooperation, some
non-response bias is likely to occur as some shoppers will not wish to
participate.
3.4.6 Reliability test
Reliability is an assessment of the degree of consistency among
multiple measurements of a variable Hair et al (1998). The internal
consistency of measures is an indication of the homogeneity of the items
which measure the same construct. To obtain a high reliability of a measure,
the items should be highly correlated with one another to measure
independently the construct independently.
Validity is the extent to which a set of measuring variables
accurately represent the concept of interest state by Hair et al. (1998). In other
words this test confirms the statement that if the multiple variables are
developed for a construct, they rightly measure that construct.
For testing reliability, Cronbach coefficient alpha is used, as it is
the most common method used for assessing the reliability of a measurement
scale with multi–point items as stated by Peterson (1994). The co-efficient,
which reflects homogeneity among a set of items, varies from 0 to 1.
However, a good reliability should produce at least a co-efficient value of
0.07. In our study, the Cronbach alpha co-efficient value is 0.9520. So
homogeneity observed among the set of items is selected.
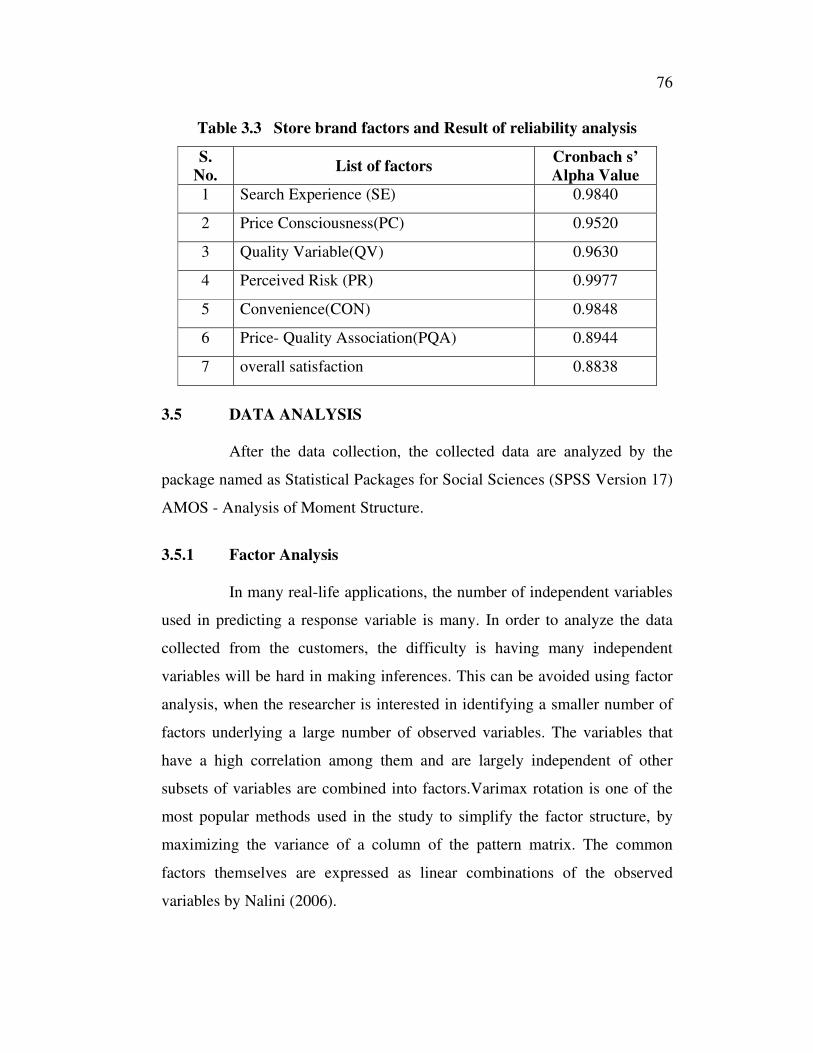
76
Table 3.3 Store brand factors and Result of reliability analysis
S.
No. List of factors
Cronbach s’
Alpha Value
1 Search Experience (SE) 0.9840
2 Price Consciousness(PC) 0.9520
3 Quality Variable(QV) 0.9630
4 Perceived Risk (PR) 0.9977
5 Convenience(CON) 0.9848
6 Price- Quality Association(PQA) 0.8944
7 overall satisfaction 0.8838
3.5 DATA ANALYSIS
After the data collection, the collected data are analyzed by the
package named as Statistical Packages for Social Sciences (SPSS Version 17)
AMOS - Analysis of Moment Structure.
3.5.1 Factor Analysis
In many real-life applications, the number of independent variables
used in predicting a response variable is many. In order to analyze the data
collected from the customers, the difficulty is having many independent
variables will be hard in making inferences. This can be avoided using factor
analysis, when the researcher is interested in identifying a smaller number of
factors underlying a large number of observed variables. The variables that
have a high correlation among them and are largely independent of other
subsets of variables are combined into factors.Varimax rotation is one of the
most popular methods used in the study to simplify the factor structure, by
maximizing the variance of a column of the pattern matrix. The common
factors themselves are expressed as linear combinations of the observed
variables by Nalini (2006).
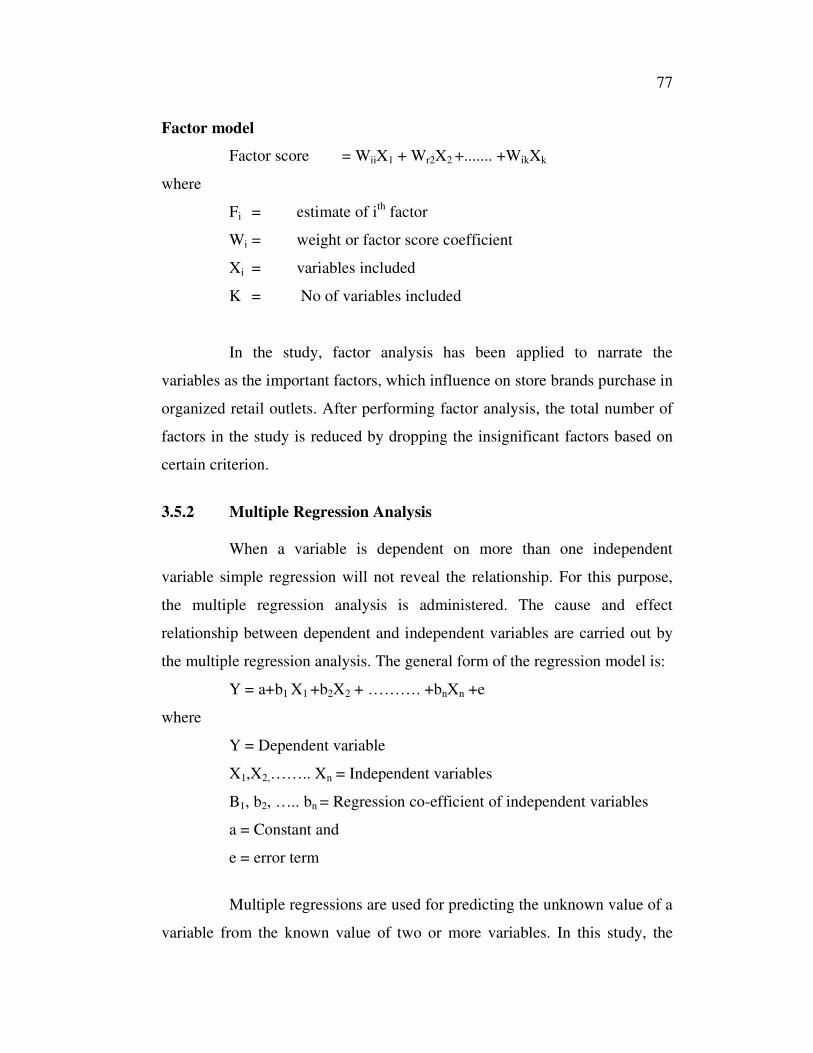
77
Factor model
Factor score = WiiX1 + Wr2X2 +....... +WikXk
where
Fi = estimate of ith
factor
Wi = weight or factor score coefficient
Xi = variables included
K = No of variables included
In the study, factor analysis has been applied to narrate the
variables as the important factors, which influence on store brands purchase in
organized retail outlets. After performing factor analysis, the total number of
factors in the study is reduced by dropping the insignificant factors based on
certain criterion.
3.5.2 Multiple Regression Analysis
When a variable is dependent on more than one independent
variable simple regression will not reveal the relationship. For this purpose,
the multiple regression analysis is administered. The cause and effect
relationship between dependent and independent variables are carried out by
the multiple regression analysis. The general form of the regression model is:
Y = a+b1 X1 +b2X2 + ………. +bnXn +e
where
Y = Dependent variable
X1,X2,…….. Xn = Independent variables
B1, b2, ….. bn = Regression co-efficient of independent variables
a = Constant and
e = error term
Multiple regressions are used for predicting the unknown value of a
variable from the known value of two or more variables. In this study, the
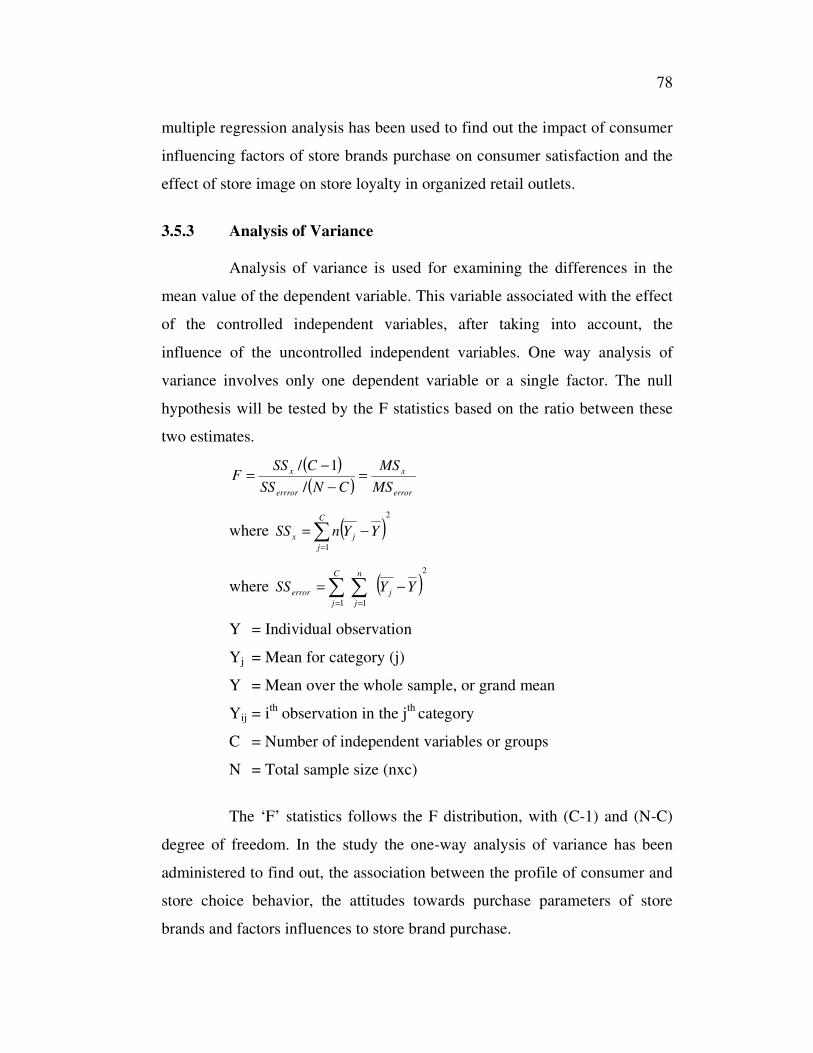
78
multiple regression analysis has been used to find out the impact of consumer
influencing factors of store brands purchase on consumer satisfaction and the
effect of store image on store loyalty in organized retail outlets.
3.5.3 Analysis of Variance
Analysis of variance is used for examining the differences in the
mean value of the dependent variable. This variable associated with the effect
of the controlled independent variables, after taking into account, the
influence of the uncontrolled independent variables. One way analysis of
variance involves only one dependent variable or a single factor. The null
hypothesis will be tested by the F statistics based on the ratio between these
two estimates.
( )
( ) error
x
errror
x
MS
MS
CNSS
CSSF =
−
−=
/
1/
where ( )2
1
∑=
−=C
j
jx YYnSS
where ( )2
1 1
∑ ∑= =
−=C
j
j
n
j
error YYSS
Y = Individual observation
Yj = Mean for category (j)
Y = Mean over the whole sample, or grand mean
Yij = ith
observation in the jth
category
C = Number of independent variables or groups
N = Total sample size (nxc)
The ‘F’ statistics follows the F distribution, with (C-1) and (N-C)
degree of freedom. In the study the one-way analysis of variance has been
administered to find out, the association between the profile of consumer and
store choice behavior, the attitudes towards purchase parameters of store
brands and factors influences to store brand purchase.
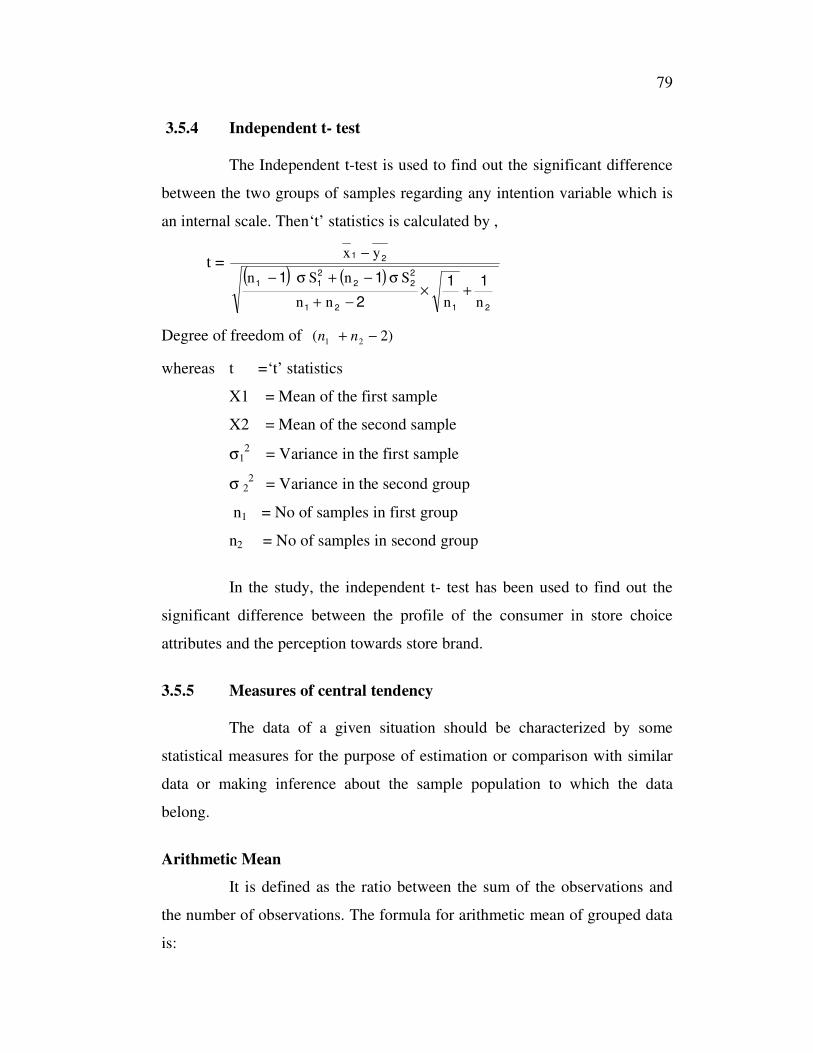
79
3.5.4 Independent t- test
The Independent t-test is used to find out the significant difference
between the two groups of samples regarding any intention variable which is
an internal scale. Then‘t’ statistics is calculated by ,
t = ( ) ( )
2121
2
22
2
11
21
11
2
11
nnnn
SnSn
yx
+×−+
σ−+σ−
−
Degree of freedom of )2( 21 −+ nn
whereas t =‘t’ statistics
X1 = Mean of the first sample
X2 = Mean of the second sample
σ12 = Variance in the first sample
σ 22 = Variance in the second group
n1 = No of samples in first group
n2 = No of samples in second group
In the study, the independent t- test has been used to find out the
significant difference between the profile of the consumer in store choice
attributes and the perception towards store brand.
3.5.5 Measures of central tendency
The data of a given situation should be characterized by some
statistical measures for the purpose of estimation or comparison with similar
data or making inference about the sample population to which the data
belong.
Arithmetic Mean
It is defined as the ratio between the sum of the observations and
the number of observations. The formula for arithmetic mean of grouped data
is:
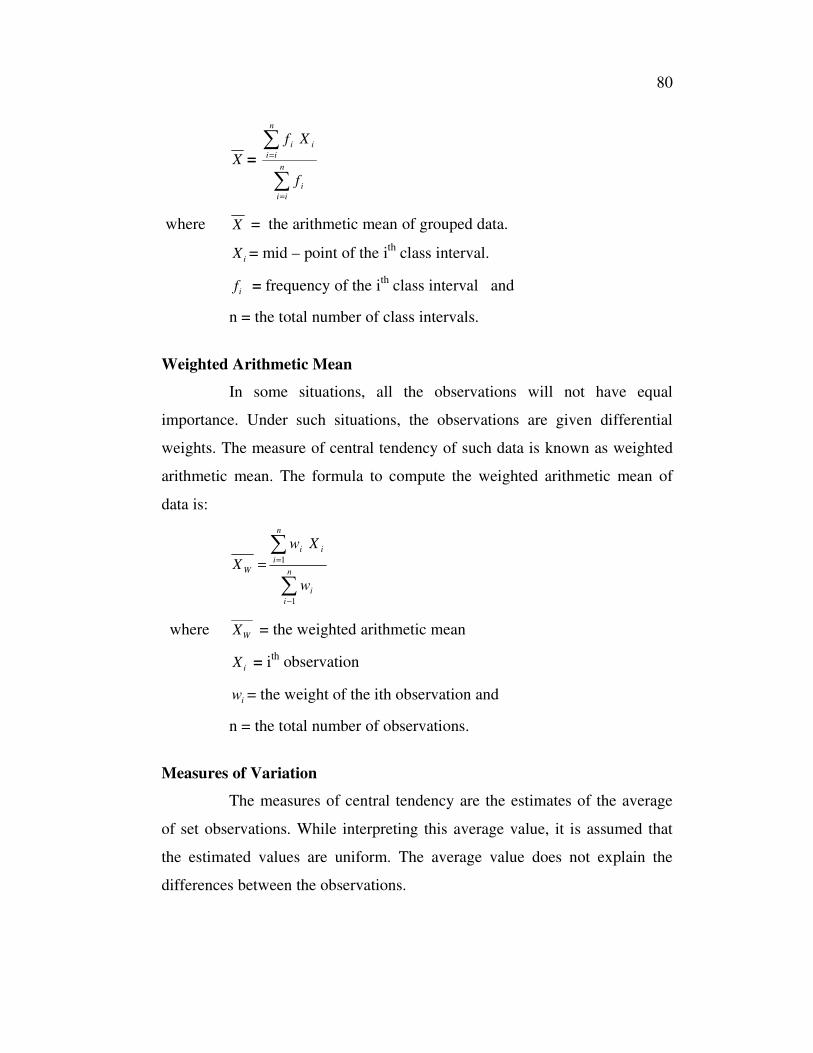
80
X =
∑
∑
=
=
n
ii
i
n
ii
ii
f
Xf
where X = the arithmetic mean of grouped data.
iX = mid – point of the ith
class interval.
if = frequency of the ith
class interval and
n = the total number of class intervals.
Weighted Arithmetic Mean
In some situations, all the observations will not have equal
importance. Under such situations, the observations are given differential
weights. The measure of central tendency of such data is known as weighted
arithmetic mean. The formula to compute the weighted arithmetic mean of
data is:
∑
∑
−
==
n
i
i
n
i
ii
W
w
Xw
X
1
1
where WX = the weighted arithmetic mean
iX = ith
observation
iw = the weight of the ith observation and
n = the total number of observations.
Measures of Variation
The measures of central tendency are the estimates of the average
of set observations. While interpreting this average value, it is assumed that
the estimated values are uniform. The average value does not explain the
differences between the observations.
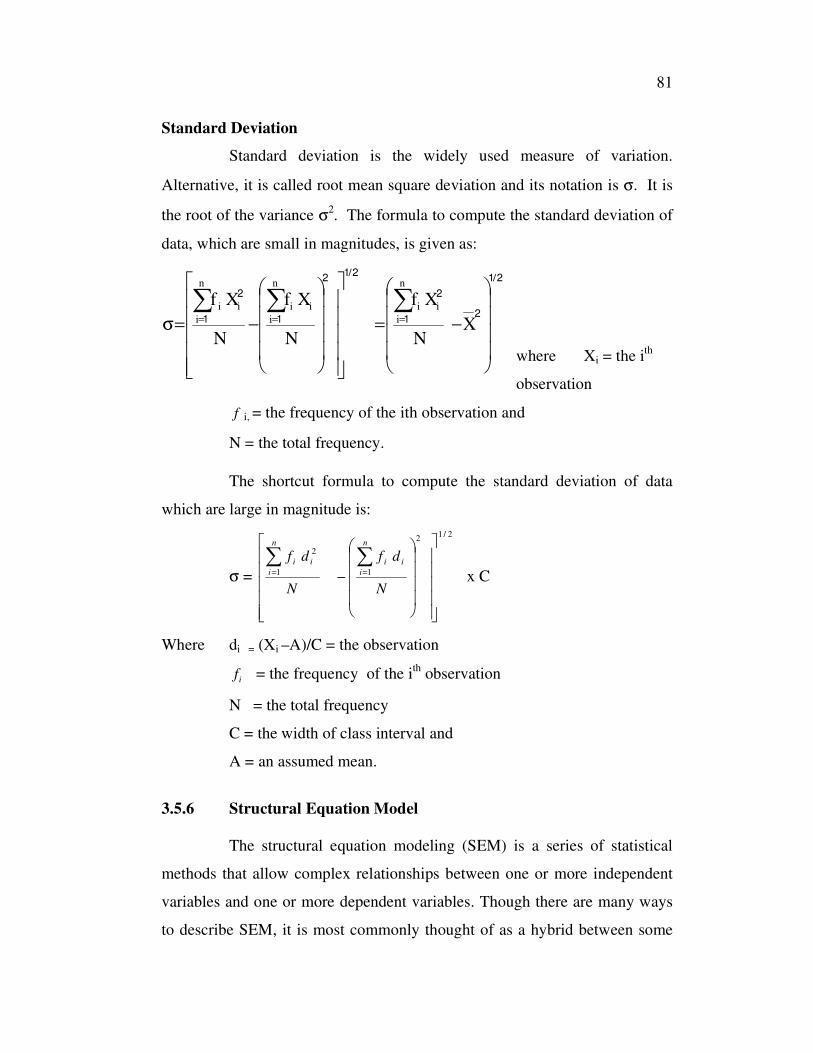
81
Standard Deviation
Standard deviation is the widely used measure of variation.
Alternative, it is called root mean square deviation and its notation is σ. It is
the root of the variance σ2. The formula to compute the standard deviation of
data, which are small in magnitudes, is given as:
where Xi = the ith
observation
f i, = the frequency of the ith observation and
N = the total frequency.
The shortcut formula to compute the standard deviation of data
which are large in magnitude is:
σ =
2/12
11
2
−
∑∑==
N
df
N
dfn
i
ii
n
i
ii
x C
Where di = (Xi –A)/C = the observation
if = the frequency of the ith
observation
N = the total frequency
C = the width of class interval and
A = an assumed mean.
3.5.6 Structural Equation Model
The structural equation modeling (SEM) is a series of statistical
methods that allow complex relationships between one or more independent
variables and one or more dependent variables. Though there are many ways
to describe SEM, it is most commonly thought of as a hybrid between some
21
21
2
212
11
2
/n
i
ii
/n
i
ii
n
i
ii
XN
Xf
N
Xf
N
Xf
−=
−=σ
∑∑∑===

82
form of analysis of variance /regression and some form of factor analysis. In
general, it can be remarked that SEM allows one to perform some type of
multilevel regression/ANOVA on factors.
The use of SEM is predicated on a strong theoretical model by
which latent constructs are defined using measurement model and these
constructs are related to each other through a series of dependence
relationships called structural model. The emphasis on strong theoretical
support for any proposed model underlies the confirmatory nature of most
SEM applications. And how the proposed structural model is translated into
structural relationships and how their estimation is interrelated are overlooked
many times. Path analysis is the process wherein the structural relationships
are expressed as direct and indirect effects in order to facilitate estimation.
The importance of understanding this process to understand the estimation
process, and also to understand how model specification and respecification
impacts the entire set of structural relationships.
3.6 SUMMARY
This chapter has presented the relationship of the study and
describes the methodology and procedures that are used to collect and analyse
the data for the research. The selected stores and store brands are identified.
The current study examines four organized retail sector companies with
respective store brands in the outlets. In line with the quantitative
methodology to be followed, relationships are developed related to store
brand attitude and store choice and to the association between consumer
satisfaction and store loyalty.
The research methods used to collect and measure the data are
examined in detail, including the development of the scales, questionnaire
design and data collection. The data is to be collected using store intercept
83
survey and a self-administered questionnaire. The desired size of the sample
as 488 shoppers is explained in terms of statistical power and generalisability.
This is followed by a description of the approach to be taken to the initial data
analysis with respect to profiling shoppers at the four retail outlets,
undertaking a preliminary examination of the data using descriptive statistics
and assessing reliability and validity. The analytical techniques such as t-tests,
ANOVA and multiple regression which are used to test the relationships are
explained.
84
CHAPTER 4
ANALYSIS OF DATA
4.1 INTRODUCTION
This chapter focuses on presenting the detailed analyses of the data
collected and the statistical results for the study. The significance of the
findings are discussed in Chapter 5, within the context of the relevant
literature. This has been done in relation to the research problem concerning
the effect of store image on attitudes towards store brands. The primary
purpose of this chapter is to present the results which are examined. It further
deals with the relationship described in the study, which are tested using t-
tests and multiple regression analysis. It also presents a profile of respondents
and together with the association of store choice, purchase parameters and
consumer factors influence store brands purchase. The goal of this research is
to provide empirical results drawn from several studies by Batra and Sinha
(2000), Shaoshen Chen (2005) and Alison Fraser (2009) and the multiple
regression analysis was adopted as the main multivariate technique which
have examined the constructs in the purchase of store brands; the consumer
satisfaction on store image and resulting store loyalty.
4.2 PRELIMINARY EXAMINATION OF THE DATA
4.2.1 Response rate
In this research, 520 shoppers are intercepted and asked to
participate in the survey. Among these shoppers, 500 accepted the survey and
20 rejected the request. The reasons for rejection are no time and
unwillingness or no interest in doing survey. Of those shoppers who have

85
participated in the survey, 488 completed most of the questions in the
questionnaires, and twelve shoppers have finished only half or less than half
of the questionnaire and are not willing to continue. Sekaran (2003) suggests
that when a substantial number of questions are unanswered, it is better not to
include the questionnaires for later analysis. On this basis the twelve
questionnaires are excluded from the dataset. As result, 488 usable
questionnaires have been retained. The response rate is 93.8% (488 / 520).
Numbers of the shoppers in the survey and the response rate are summarized
in Table 4.1.
Table 4.1 Response rate
Survey Participation Number of Shoppers
Survey participated 500
Refused to participate 20
Total shoppers intercepted 520
Questionnaire finished 488
Questionnaire not finished 12
Total questionnaires retained 488
Response Rate 93.8%
4.2.2 The distribution and profile of the respondents in each retail
outlet
Store brands have emerged as a well-defined growth strategy by
most of the Indian retailers. These store brands have high margins of retails.
They help to differentiate the retail offer of the stores and also help to bridge
the gap in manufacturers product mix. Store brands have been a roaring
success in food; consumer durables and home care segments, and garner the
most profits in apparels. According to the industrial estimates, profit margins
for store brands range between 15% and 20% in the FMCG( Fast Moving
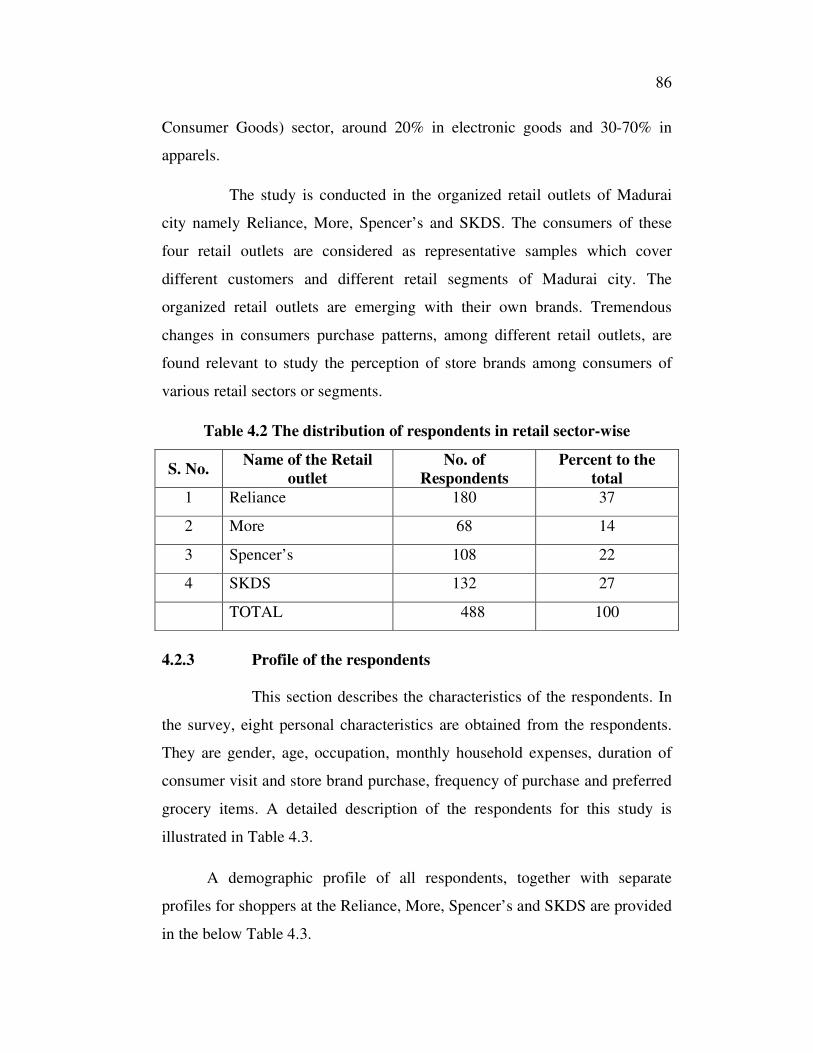
86
Consumer Goods) sector, around 20% in electronic goods and 30-70% in
apparels.
The study is conducted in the organized retail outlets of Madurai
city namely Reliance, More, Spencer’s and SKDS. The consumers of these
four retail outlets are considered as representative samples which cover
different customers and different retail segments of Madurai city. The
organized retail outlets are emerging with their own brands. Tremendous
changes in consumers purchase patterns, among different retail outlets, are
found relevant to study the perception of store brands among consumers of
various retail sectors or segments.
Table 4.2 The distribution of respondents in retail sector-wise
S. No. Name of the Retail
outlet
No. of
Respondents
Percent to the
total
1 Reliance 180 37
2 More 68 14
3 Spencer’s 108 22
4 SKDS 132 27
TOTAL 488 100
4.2.3 Profile of the respondents
This section describes the characteristics of the respondents. In
the survey, eight personal characteristics are obtained from the respondents.
They are gender, age, occupation, monthly household expenses, duration of
consumer visit and store brand purchase, frequency of purchase and preferred
grocery items. A detailed description of the respondents for this study is
illustrated in Table 4.3.
A demographic profile of all respondents, together with separate
profiles for shoppers at the Reliance, More, Spencer’s and SKDS are provided
in the below Table 4.3.
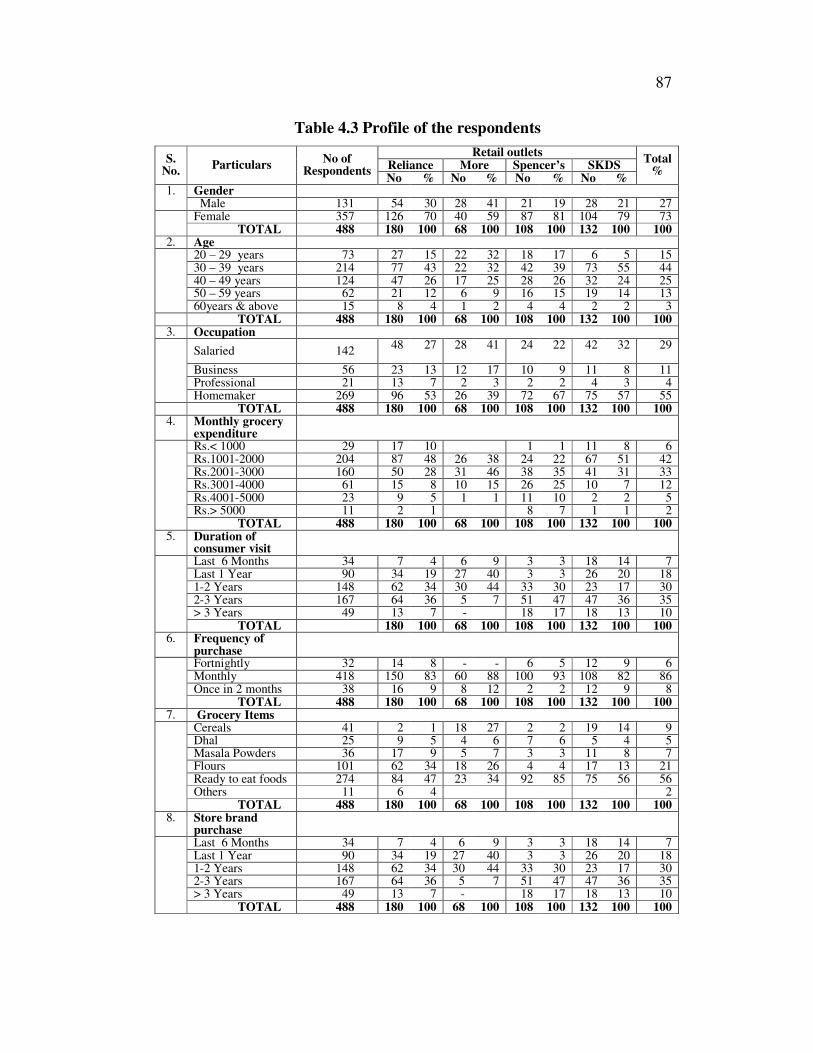
87
Table 4.3 Profile of the respondents
Retail outlets Reliance More Spencer’s SKDS
S. No.
Particulars No of
Respondents No % No % No % No %
Total %
Gender 1. Male 131 54 30 28 41 21 19 28 21 27 Female 357 126 70 40 59 87 81 104 79 73 TOTAL 488 180 100 68 100 108 100 132 100 100
2. Age 20 – 29 years 73 27 15 22 32 18 17 6 5 15 30 – 39 years 214 77 43 22 32 42 39 73 55 44 40 – 49 years 124 47 26 17 25 28 26 32 24 25 50 – 59 years 62 21 12 6 9 16 15 19 14 13
60years & above 15 8 4 1 2 4 4 2 2 3 TOTAL 488 180 100 68 100 108 100 132 100 100
3. Occupation
Salaried 142 48 27 28
41 24 22 42 32 29
Business 56 23 13 12 17 10 9 11 8 11 Professional 21 13 7 2 3 2 2 4 3 4
Homemaker 269 96 53 26 39 72 67 75 57 55 TOTAL 488 180 100 68 100 108 100 132 100 100
4. Monthly grocery expenditure
Rs.< 1000 29 17 10 1 1 11 8 6 Rs.1001-2000 204 87 48 26 38 24 22 67 51 42 Rs.2001-3000 160 50 28 31 46 38 35 41 31 33 Rs.3001-4000 61 15 8 10 15 26 25 10 7 12 Rs.4001-5000 23 9 5 1 1 11 10 2 2 5 Rs.> 5000 11 2 1 8 7 1 1 2
TOTAL 488 180 100 68 100 108 100 132 100 100 5. Duration of
consumer visit
Last 6 Months 34 7 4 6 9 3 3 18 14 7 Last 1 Year 90 34 19 27 40 3 3 26 20 18 1-2 Years 148 62 34 30 44 33 30 23 17 30 2-3 Years 167 64 36 5 7 51 47 47 36 35 > 3 Years 49 13 7 - 18 17 18 13 10
TOTAL 180 100 68 100 108 100 132 100 100 6. Frequency of
purchase
Fortnightly 32 14 8 - - 6 5 12 9 6 Monthly 418 150 83 60 88 100 93 108 82 86 Once in 2 months 38 16 9 8 12 2 2 12 9 8
TOTAL 488 180 100 68 100 108 100 132 100 100 7. Grocery Items
Cereals 41 2 1 18 27 2 2 19 14 9 Dhal 25 9 5 4 6 7 6 5 4 5 Masala Powders 36 17 9 5 7 3 3 11 8 7 Flours 101 62 34 18 26 4 4 17 13 21 Ready to eat foods 274 84 47 23 34 92 85 75 56 56 Others 11 6 4 2
TOTAL 488 180 100 68 100 108 100 132 100 100 8. Store brand
purchase
Last 6 Months 34 7 4 6 9 3 3 18 14 7 Last 1 Year 90 34 19 27 40 3 3 26 20 18 1-2 Years 148 62 34 30 44 33 30 23 17 30 2-3 Years 167 64 36 5 7 51 47 47 36 35 > 3 Years 49 13 7 - 18 17 18 13 10
TOTAL 488 180 100 68 100 108 100 132 100 100
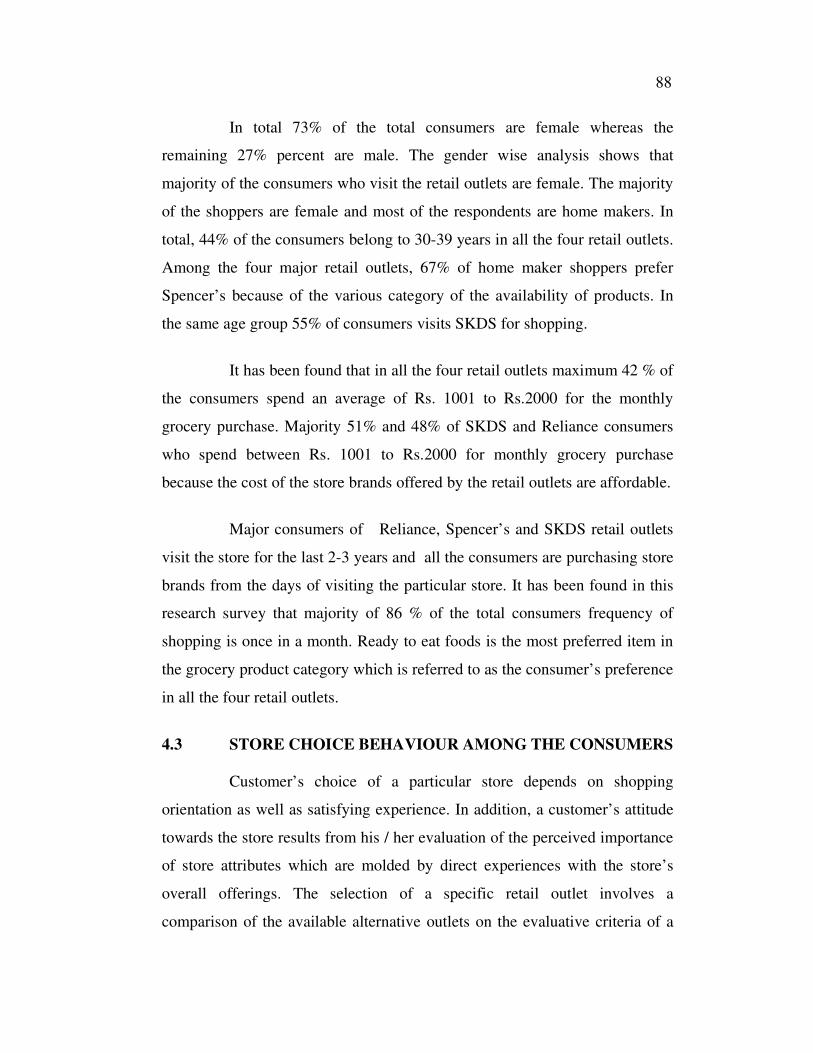
88
In total 73% of the total consumers are female whereas the
remaining 27% percent are male. The gender wise analysis shows that
majority of the consumers who visit the retail outlets are female. The majority
of the shoppers are female and most of the respondents are home makers. In
total, 44% of the consumers belong to 30-39 years in all the four retail outlets.
Among the four major retail outlets, 67% of home maker shoppers prefer
Spencer’s because of the various category of the availability of products. In
the same age group 55% of consumers visits SKDS for shopping.
It has been found that in all the four retail outlets maximum 42 % of
the consumers spend an average of Rs. 1001 to Rs.2000 for the monthly
grocery purchase. Majority 51% and 48% of SKDS and Reliance consumers
who spend between Rs. 1001 to Rs.2000 for monthly grocery purchase
because the cost of the store brands offered by the retail outlets are affordable.
Major consumers of Reliance, Spencer’s and SKDS retail outlets
visit the store for the last 2-3 years and all the consumers are purchasing store
brands from the days of visiting the particular store. It has been found in this
research survey that majority of 86 % of the total consumers frequency of
shopping is once in a month. Ready to eat foods is the most preferred item in
the grocery product category which is referred to as the consumer’s preference
in all the four retail outlets.
4.3 STORE CHOICE BEHAVIOUR AMONG THE CONSUMERS
Customer’s choice of a particular store depends on shopping
orientation as well as satisfying experience. In addition, a customer’s attitude
towards the store results from his / her evaluation of the perceived importance
of store attributes which are molded by direct experiences with the store’s
overall offerings. The selection of a specific retail outlet involves a
comparison of the available alternative outlets on the evaluative criteria of a
89
consumer. Literature suggests a range of such criteria, which makes the
selection of store a challenging task from the retailers point of view and make
store choice a matter of concern to retailers.
According to Lindquist (1974), store image consists of a
combination of tangible or functional factors and intangible or psychological
factors that consumers perceive to find in retail stores. Consumers use store
image as an evaluative criterion in the decision-making process of selecting a
retail outlet as stated by Varley (2005). Store attributes refer to the underlying
components of a store image dimension like merchandise, physical facilities,
services, atmospherics and so on. Researches on store image by Martineau
(1958) James et al (1976) Peter and Olson (1990), Wong and Yu (2003) have
yielded a large number of attributes and the store image has been found to be
linked to store loyalty and patronage decisions.
Leung and Oppewal (1999) have conducted research on the roles of
store and brand names in consumer’s choice of a retail outlet and conclude
that a high-quality brand or high-quality store is sufficient to attract the
customer to a retail store. The studies have also revealed that store names
have a larger impact on store choice than the brand names of the products.
Several studies have been done in various countries on store
attributes, commonly called store image variables in marketing literature. The
objective of these types of studies is the identification of key attributes that
influence consumers store choice. Besides, an attempt is made to identify
store attributes that drives the store selection process. Based on the literature
review, it is found that the following factors are considered by customers
while choosing a store. The factors include Attractive Display, Value for
Money, Brand name, Availability of Specific Products, Affordable Prices,
Trust worthiness products, Best Service of Employees, Extensive Varieties of
Products, Wide Range of Promotional Offers, Nearness to Residence.
90
Attractive Display: The attractive display includes modern outlook of the
store. High level of these factors signals that the retailer offers good quality
goods and services and also influences customers’ evaluation of other
intangible factors that determine the store choice.
Value for Money: Price is an important factor for shopping in a retail outlet as
customers are conscious of ‘Value for Money’ now-a-days.
Availability of Specific Products: This factor refers to the availability of
merchandise in the store which are convenient for shoppers.
Nearness to Residence: This refers to the nearness of the retail outlet for the
retail customer. Generally, people prefer retail outlets to be near to their house
for convenience and for making immediate purchases. In case of shopping in
organized outlets for the purpose of entertainment or family shopping people,
they do not mind traveling to the outlet.
Extensive Variety of Products: Variety represents the number of different
items in a merchandise category that is the depth of merchandise category.
This factor refers to the variety of items available for a given product category
in terms of price ranges, size, design, colors etc.
Best Service of Employees: Through the personal interaction with customers,
the employees in retail outlets make them feel well treated and assured.
Wide Range of Promotional Activities: This dimension tries to capture the
effect of different promotional initiatives taken by the store like discounts and
special offers for sale items and rewarding loyal customers from time to time
to build loyalty with its customers. The sales promotion here refers only to the
in-store promotional activities offered by retailers from time to time. It does
not include the advertising campaigns undertaken by the retail store.

91
Trustworthy Products: Reliability means performing the services at promised
time and solving customers’ problems.
Brand Name: A name applied by a manufacturer or organization to a
particular product or service. A brand name is used and protected as
a trademark. "According to Kapferer (2000,p.112), 'the brand's name is often
revealing of the brand's intentions.' It is a powerful source of identity and
helps to project the intended image of the product against the competition and
in the process of positioning a brand in the minds of the target audience.
Affordable Price: It means the consumers are able to pay the price and buy the
products with reasonable price in the market.
The respondents are asked to rate the attributes on a five point scale according
to the level of agreement considered for choosing the store.
4.3.1 Attributes Leading to Choose the Store Among Gender wise
Classification
A number of earlier researchers like Hyllegard et al (2005)
Ali et al (2010) have also identified that gender plays a vital role while
selecting a retail outlet. It is included as one of the variables to study the
behavior of consumers on the store choice attributes which completely
differs from male to female. By analyzing the gender wise classification, the
retailers promote the business activity by providing specialized gender based
service to the consumers. In order to find the significant difference between
the genders, the one way ANOVA has been tested and the mean score of the
various attributes is also computed. This is done to exhibit the importance on
attributes leading to choose the stores and is shown in the Table 4.4.
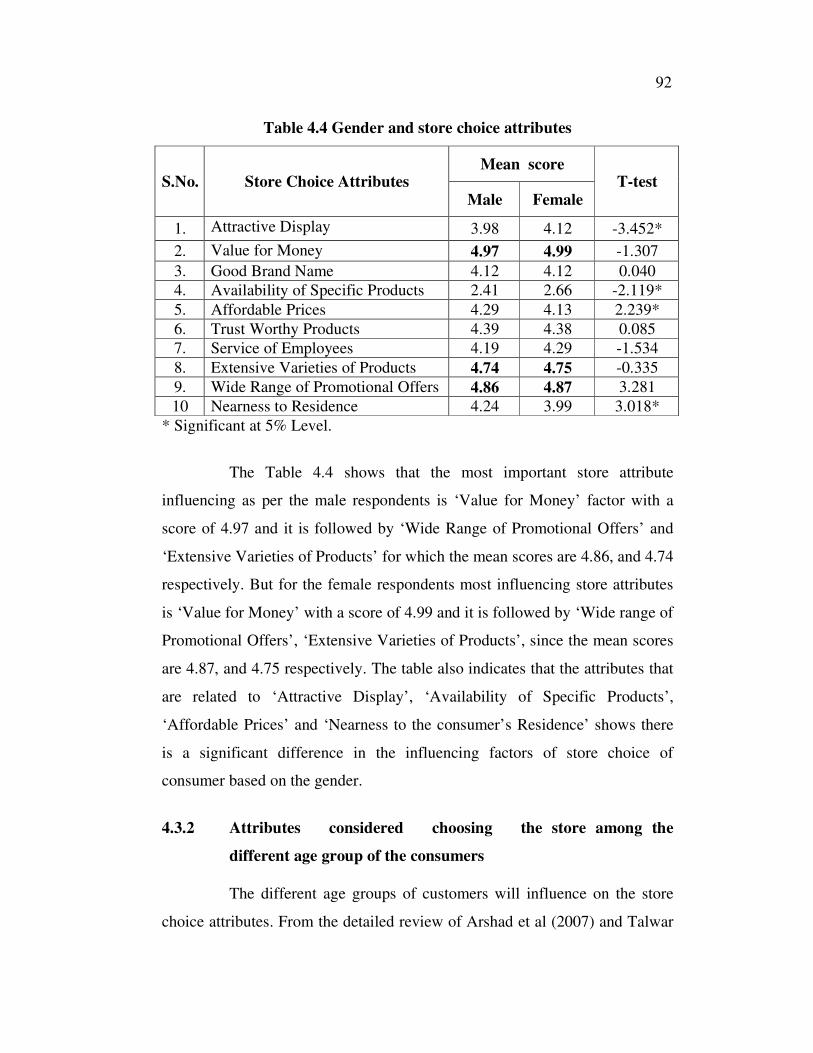
92
Table 4.4 Gender and store choice attributes
Mean score S.No. Store Choice Attributes
Male Female T-test
1. Attractive Display 3.98 4.12 -3.452*
2. Value for Money 4.97 4.99 -1.307
3. Good Brand Name 4.12 4.12 0.040
4. Availability of Specific Products 2.41 2.66 -2.119*
5. Affordable Prices 4.29 4.13 2.239*
6. Trust Worthy Products 4.39 4.38 0.085
7. Service of Employees 4.19 4.29 -1.534
8. Extensive Varieties of Products 4.74 4.75 -0.335
9. Wide Range of Promotional Offers 4.86 4.87 3.281
10 Nearness to Residence 4.24 3.99 3.018*
* Significant at 5% Level.
The Table 4.4 shows that the most important store attribute
influencing as per the male respondents is ‘Value for Money’ factor with a
score of 4.97 and it is followed by ‘Wide Range of Promotional Offers’ and
‘Extensive Varieties of Products’ for which the mean scores are 4.86, and 4.74
respectively. But for the female respondents most influencing store attributes
is ‘Value for Money’ with a score of 4.99 and it is followed by ‘Wide range of
Promotional Offers’, ‘Extensive Varieties of Products’, since the mean scores
are 4.87, and 4.75 respectively. The table also indicates that the attributes that
are related to ‘Attractive Display’, ‘Availability of Specific Products’,
‘Affordable Prices’ and ‘Nearness to the consumer’s Residence’ shows there
is a significant difference in the influencing factors of store choice of
consumer based on the gender.
4.3.2 Attributes considered choosing the store among the
different age group of the consumers
The different age groups of customers will influence on the store
choice attributes. From the detailed review of Arshad et al (2007) and Talwar
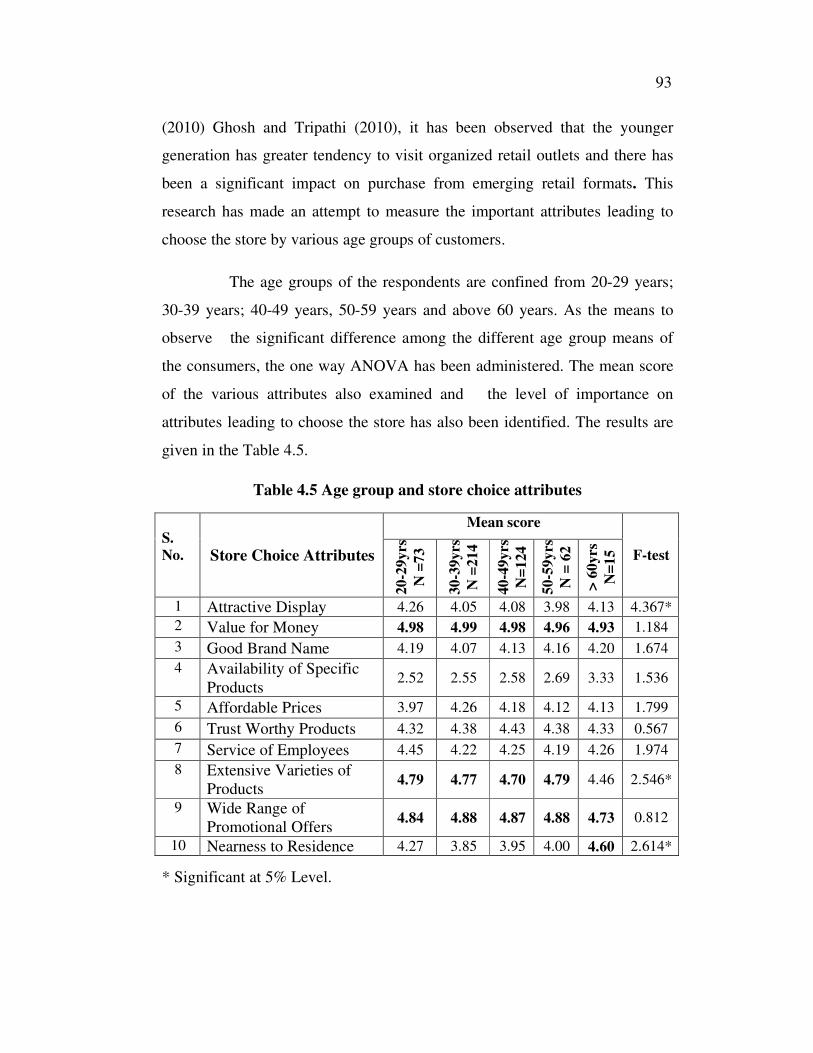
93
(2010) Ghosh and Tripathi (2010), it has been observed that the younger
generation has greater tendency to visit organized retail outlets and there has
been a significant impact on purchase from emerging retail formats. This
research has made an attempt to measure the important attributes leading to
choose the store by various age groups of customers.
The age groups of the respondents are confined from 20-29 years;
30-39 years; 40-49 years, 50-59 years and above 60 years. As the means to
observe the significant difference among the different age group means of
the consumers, the one way ANOVA has been administered. The mean score
of the various attributes also examined and the level of importance on
attributes leading to choose the store has also been identified. The results are
given in the Table 4.5.
Table 4.5 Age group and store choice attributes
* Significant at 5% Level.
Mean score S.
No.
Store Choice Attributes
20
-29
yrs
N =
73
30
-39
yrs
N =
21
4
40
-49
yrs
N=
12
4
50
-59
yrs
N =
62
> 6
0yrs
N=
15
F-test
1 Attractive Display 4.26 4.05 4.08 3.98 4.13 4.367*
2 Value for Money 4.98 4.99 4.98 4.96 4.93 1.184
3 Good Brand Name 4.19 4.07 4.13 4.16 4.20 1.674
4 Availability of Specific
Products 2.52 2.55 2.58 2.69 3.33 1.536
5 Affordable Prices 3.97 4.26 4.18 4.12 4.13 1.799
6 Trust Worthy Products 4.32 4.38 4.43 4.38 4.33 0.567
7 Service of Employees 4.45 4.22 4.25 4.19 4.26 1.974
8 Extensive Varieties of
Products 4.79 4.77 4.70 4.79 4.46 2.546*
9 Wide Range of
Promotional Offers 4.84 4.88 4.87 4.88 4.73 0.812
10 Nearness to Residence 4.27 3.85 3.95 4.00 4.60 2.614*
94
From the Table 4.5 it is inferred that as per the perception of
consumers aged below 30 years the most influencing store choice attributes is
‘Value for Money’ followed by ‘Wide Range of Promotional Offers’ and
‘Extensive Varieties of Products’, with mean scores of 4.98, 4.84 and 4.79
respectively. The consumers aged between 30 and 39 years are very much
influenced by ‘Value for Money’ followed by ‘Wide Range of Promotional
Offers’ and ‘Extensive Varieties of Products’, with mean scores of 4.99, 4.88
and 4.77 respectively. The consumers aged between 40 and 49 years are very
much influenced by ‘Value for Money’ followed by ‘Wide Range of
Promotional Offers’ and ‘Extensive Varieties of Products’, with mean scores of
4.98, 4.87 and 4.70 respectively. The consumers aged between 50 and 59
years are much influenced by ‘Value for Money’ followed by ‘Wide Range of
Promotional Offers’ and ‘Extensive Varieties of Products’, with mean scores
of 4.96, 4.88 and 4.79 respectively. The consumers aged above 60 years are
also more influenced ‘Value for Money’ followed by ‘Wide Range of
Promotional Offers’ and Nearness to Residence, with mean scores of 4.93,
4.88 and 4.79 respectively.
The table 4.5 also shows that there is a significant difference in
some factors like ‘Attractive Display’, ‘Extensive Varieties of Products’ and
‘Nearness to Residence’ based on the age of the consumer.
4.3.3 Attributes considered to choose the store among the
occupational level of the consumers
Many researchers like Joshi (2011) and Thenmozhi and Dhanapal
(2010) have identified that the occupation level of the customers will
influence on the store choice attributes. The working parents prefer to spend
as much time as possible with the children in shopping because of their busy
schedule. The occupation of individuals determines the consumers’ level of
importance on the store choice of the retail outlets. It is also influenced by
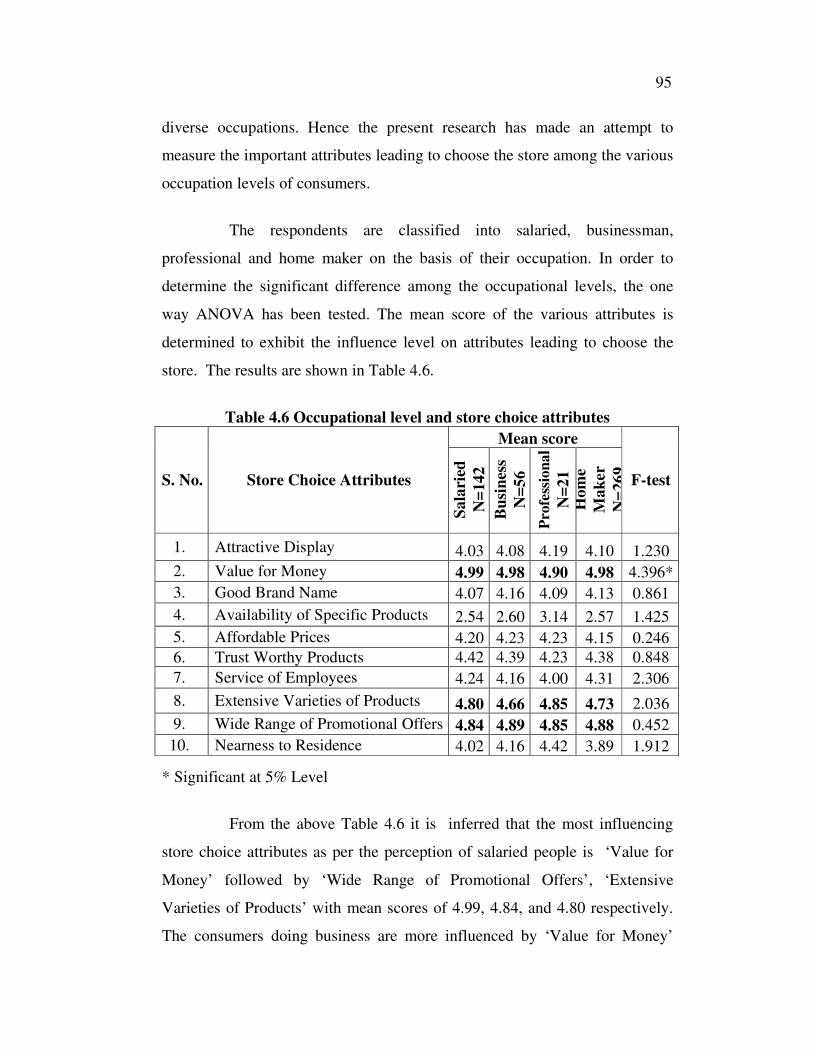
95
diverse occupations. Hence the present research has made an attempt to
measure the important attributes leading to choose the store among the various
occupation levels of consumers.
The respondents are classified into salaried, businessman,
professional and home maker on the basis of their occupation. In order to
determine the significant difference among the occupational levels, the one
way ANOVA has been tested. The mean score of the various attributes is
determined to exhibit the influence level on attributes leading to choose the
store. The results are shown in Table 4.6.
Table 4.6 Occupational level and store choice attributes
Mean score
S. No. Store Choice Attributes
Sa
lari
ed
N=
14
2
Bu
sin
ess
N=
56
Pro
fess
ion
al
N=
21
H
om
e
Ma
ker
N=
26
9
F-test
1. Attractive Display 4.03 4.08 4.19 4.10 1.230
2. Value for Money 4.99 4.98 4.90 4.98 4.396*
3. Good Brand Name 4.07 4.16 4.09 4.13 0.861
4. Availability of Specific Products 2.54 2.60 3.14 2.57 1.425
5. Affordable Prices 4.20 4.23 4.23 4.15 0.246
6. Trust Worthy Products 4.42 4.39 4.23 4.38 0.848
7. Service of Employees 4.24 4.16 4.00 4.31 2.306
8. Extensive Varieties of Products 4.80 4.66 4.85 4.73 2.036
9. Wide Range of Promotional Offers 4.84 4.89 4.85 4.88 0.452
10. Nearness to Residence 4.02 4.16 4.42 3.89 1.912
* Significant at 5% Level
From the above Table 4.6 it is inferred that the most influencing
store choice attributes as per the perception of salaried people is ‘Value for
Money’ followed by ‘Wide Range of Promotional Offers’, ‘Extensive
Varieties of Products’ with mean scores of 4.99, 4.84, and 4.80 respectively.
The consumers doing business are more influenced by ‘Value for Money’
96
followed by ‘Wide Range of Promotional Offers’ and ‘Extensive Varieties of
Products’ with mean scores of 4.98, 4.89 and 4.66 respectively. The
professionals such as doctors, lawyers, engineers and chartered accountants
are mostly influenced by ‘Value for Money’ followed by ‘Wide Range of
Promotional Offers’ and ‘Extensive Varieties of Products’, with mean scores
are 4.90, 4.85 and 4.85 respectively. The homemakers are more influenced by
‘Value for Money’ followed by ‘Wide Range of Promotional Offers’ and
‘Extensive Varieties of Products’, with mean scores of 4.98, 4.88 and 4.73
respectively.
The table 4.6 also shows that there is a significant difference in
‘Value for Money’ on the respondents’ occupational level. In all the other
attributes like ‘Attractive Display’,‘Brand Name’,‘Availability of Specific
Products’, ‘Affordable Prices’, ‘Trust Worthy Products’, ‘Services of
Employees’, ‘Extensive Varieties of Products’,‘Wide Range of Promotional
Offers’ and ‘Nearness to Residence’ there is no significance differences
found.
4.3.4 Expenditure for monthly grocery purchase and store choice
attributes
The latest study by Ali et al (2010) indicates the purchase behavior
of the consumer based on monthly expenditure. It further reveals that the
income level of a consumer is an important factor which influences the
decision for selecting a retail outlet. The average monthly expenditure
constitutes the amount spent by the consumer for grocery expenditure in a
month. The increase in spending power has resulted in choosing super
markets by minimum number of customers for the personal shopping for
variety, quality and availability of products. This happens as the amount spent
for grocery purchase by the consumers influence the selection of retail outlets.
This research has made an attempt to measure the important attributes leading
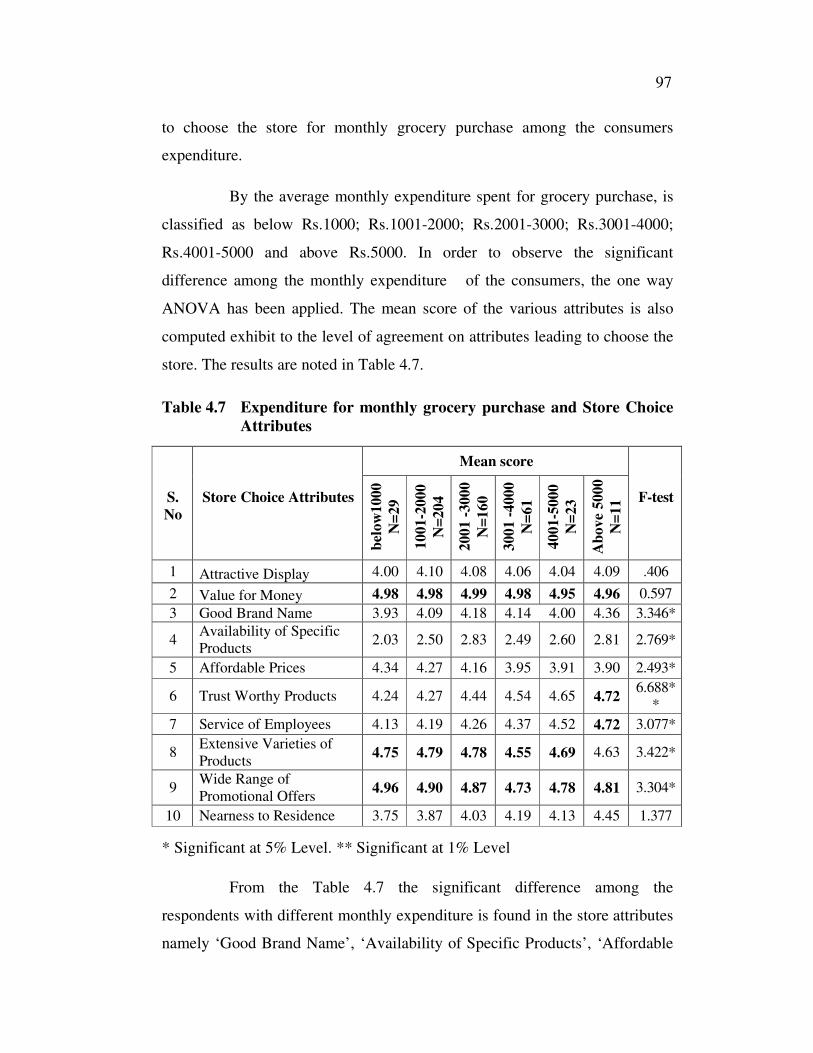
97
to choose the store for monthly grocery purchase among the consumers
expenditure.
By the average monthly expenditure spent for grocery purchase, is
classified as below Rs.1000; Rs.1001-2000; Rs.2001-3000; Rs.3001-4000;
Rs.4001-5000 and above Rs.5000. In order to observe the significant
difference among the monthly expenditure of the consumers, the one way
ANOVA has been applied. The mean score of the various attributes is also
computed exhibit to the level of agreement on attributes leading to choose the
store. The results are noted in Table 4.7.
Table 4.7 Expenditure for monthly grocery purchase and Store Choice
Attributes
* Significant at 5% Level. ** Significant at 1% Level
From the Table 4.7 the significant difference among the
respondents with different monthly expenditure is found in the store attributes
namely ‘Good Brand Name’, ‘Availability of Specific Products’, ‘Affordable
Mean score
S.
No
Store Choice Attributes
bel
ow
10
00
N=
29
10
01-2
00
0
N=
20
4
20
01
-3
00
0
N=
16
0
30
01
-4
00
0
N=
61
40
01- 5
00
0
N=
23
Ab
ov
e 5
00
0
N=
11
F-test
1 Attractive Display 4.00 4.10 4.08 4.06 4.04 4.09 .406
2 Value for Money 4.98 4.98 4.99 4.98 4.95 4.96 0.597
3 Good Brand Name 3.93 4.09 4.18 4.14 4.00 4.36 3.346*
4 Availability of Specific
Products 2.03 2.50 2.83 2.49 2.60 2.81 2.769*
5 Affordable Prices 4.34 4.27 4.16 3.95 3.91 3.90 2.493*
6 Trust Worthy Products 4.24 4.27 4.44 4.54 4.65 4.72 6.688*
*
7 Service of Employees 4.13 4.19 4.26 4.37 4.52 4.72 3.077*
8 Extensive Varieties of
Products 4.75 4.79 4.78 4.55 4.69 4.63 3.422*
9 Wide Range of
Promotional Offers 4.96 4.90 4.87 4.73 4.78 4.81 3.304*
10 Nearness to Residence 3.75 3.87 4.03 4.19 4.13 4.45 1.377
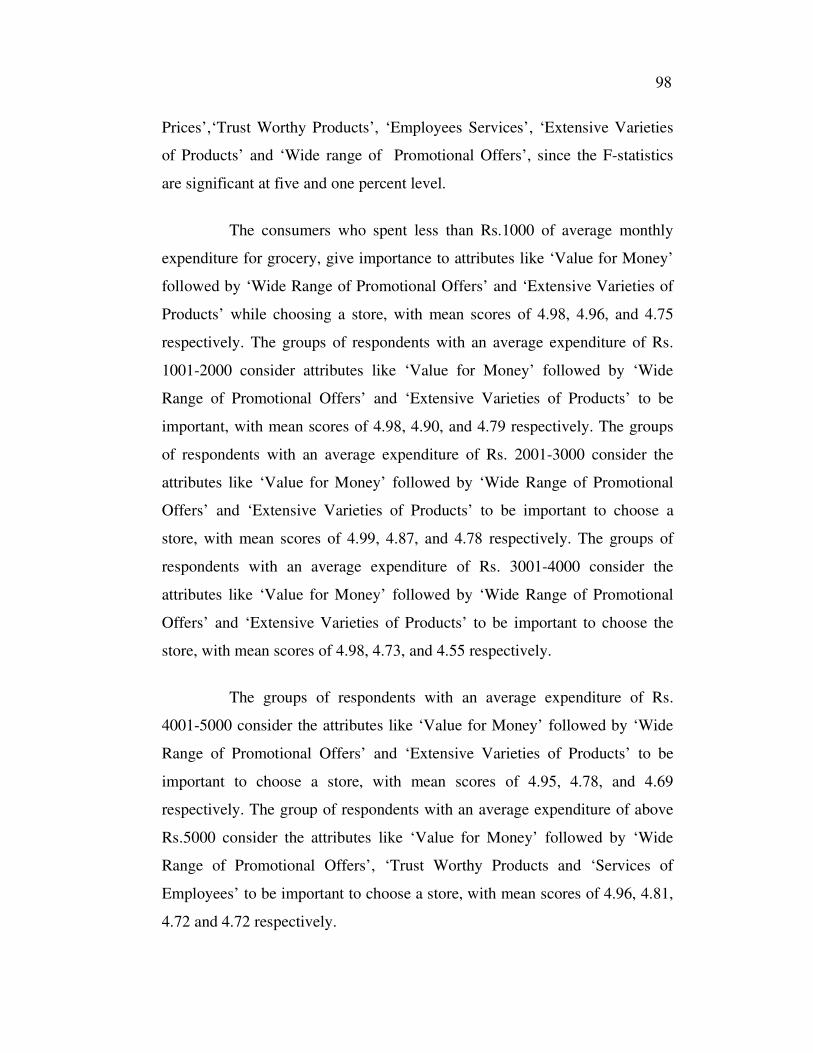
98
Prices’,‘Trust Worthy Products’, ‘Employees Services’, ‘Extensive Varieties
of Products’ and ‘Wide range of Promotional Offers’, since the F-statistics
are significant at five and one percent level.
The consumers who spent less than Rs.1000 of average monthly
expenditure for grocery, give importance to attributes like ‘Value for Money’
followed by ‘Wide Range of Promotional Offers’ and ‘Extensive Varieties of
Products’ while choosing a store, with mean scores of 4.98, 4.96, and 4.75
respectively. The groups of respondents with an average expenditure of Rs.
1001-2000 consider attributes like ‘Value for Money’ followed by ‘Wide
Range of Promotional Offers’ and ‘Extensive Varieties of Products’ to be
important, with mean scores of 4.98, 4.90, and 4.79 respectively. The groups
of respondents with an average expenditure of Rs. 2001-3000 consider the
attributes like ‘Value for Money’ followed by ‘Wide Range of Promotional
Offers’ and ‘Extensive Varieties of Products’ to be important to choose a
store, with mean scores of 4.99, 4.87, and 4.78 respectively. The groups of
respondents with an average expenditure of Rs. 3001-4000 consider the
attributes like ‘Value for Money’ followed by ‘Wide Range of Promotional
Offers’ and ‘Extensive Varieties of Products’ to be important to choose the
store, with mean scores of 4.98, 4.73, and 4.55 respectively.
The groups of respondents with an average expenditure of Rs.
4001-5000 consider the attributes like ‘Value for Money’ followed by ‘Wide
Range of Promotional Offers’ and ‘Extensive Varieties of Products’ to be
important to choose a store, with mean scores of 4.95, 4.78, and 4.69
respectively. The group of respondents with an average expenditure of above
Rs.5000 consider the attributes like ‘Value for Money’ followed by ‘Wide
Range of Promotional Offers’, ‘Trust Worthy Products and ‘Services of
Employees’ to be important to choose a store, with mean scores of 4.96, 4.81,
4.72 and 4.72 respectively.
99
4.3.5 Frequency of consumer visit to store based on store choice
attributes
It is observed from Piyali Gosh and Tripathi (2010) that the
frequency of visit denotes the number of times a consumer visits a retail
outlet. If the frequency of visits to the retail store grows higher, the consumers
expect the outlet to be nearer to the house. The shopping frequency will
increase the impact in store brands and store choice attributes of the retail
outlet. This research has made an attempt to measure the importance of factors
leading to choose the store based on the basis of the duration of consumers’
visit to the stores.
The duration of visit by the consumer are classified as Last 6
months; Last 1 year; 1-2 years; 2 - 3 years and more than 3 years of visit. The
one way ANOVA test has been executed to analyze the significant difference
among the duration of consumers’ visit and the mean score of the various
attributes has been computed and presented in Table 4.8.
Table 4.8 Frequency of consumer visit and store choice attributes
Mean score S.
No Store Choice Attributes
Last
6
Mo
nth
s
N =
34
Last
1ya
r
N=
90
1-
2yea
rs
N =
148
2 -
3yea
rs
N =
167
Mo
re
tha
n 3
yea
rs
N =
49
F-test
1 Attractive Display 4.08 4.06 4.08 4.05 4.22 1.551
2 Value for Money 4.97 4.98 4.98 4.99 4.97 0.412
3 Good Brand Name 4.11 4.02 4.14 4.13 4.20 1.902
4 Availability of Specific Products 2.76 2.22 2.27 3.10 2.42 12.795**
5 Affordable Prices 4.44 4.37 4.14 4.06 4.12 3.066*
6 Trust Worthy products 4.47 4.17 4.41 4.47 4.34 5.883**
7 Service of Employees 4.02 4.12 4.29 4.31 4.42 3.454*
8 Extensive Varieties of Products 4.82 4.66 4.75 4.77 4.79 1.334
9 Wide Range of Promotional Offers 4.94 4.98 4.89 4.79 4.77 6.757**
10 Nearness to Residence 3.47 3.87 4.16 3.92 4.20 3.016*
* Significant at 5% Level. ** Significant at 1% Level
100
From the above Table 4.8 it is inferred that the perception of
consumers who are all visiting the store for the last 6 months are mostly
influenced by ‘Value for Money’ followed by ‘Wide Range of Promotional
Offers’, ‘Extensive Varieties of Products’, with mean scores of 4.97, 4.94, and
4.82 respectively. The consumers who are all visiting the store for the last 1
year are highly influenced by ‘Value for Money’ followed by ‘Wide Range of
Promotional Offers’ and ‘Extensive Varieties of Products’, with mean scores
of 4.98, 4.98 and 4.66 respectively. The consumers who are all visiting the
store for 1 to 2 years are favorably influenced by ‘Value for Money’ followed
by ‘Wide Range of Promotional Offers’ and ‘Extensive Varieties of Products’,
with mean scores of 4.98, 4.89 and 4.75 respectively. The consumers who are
all visiting the store for 2 to 3 years are duly influenced by ‘Value for Money’
followed by ‘Wide Range of Promotional Offers’ and ‘Extensive Varieties of
Products’, with mean scores of 4.99, 4.79 and 4.77 respectively. The
consumers who are all visiting the store for more than 3 years are influenced
by ‘Value for Money’ followed by ‘Extensive Varieties of Products’ and
‘Wide Range of Promotional Offers’, with mean scores of 4.97, 4.79 and 4.77
respectively.
The above Table 4.8 also shows that there is a significant difference
between the duration of the client visit and store choice attributes which
include ‘Availability of Specific Products’,‘Affordable Prices’and‘Trust
Worthy Products’, ‘Services of Employees’, ‘Wide Range of Promotional
Offers’ and ‘Nearness to Residence’.
4.3.6 Attributes considered choosing the store with frequency of
purchase
Thenmozhi and Dhanapal (2010) and Ali et al (2010) have found
that the shopping frequency at this store has its influence on store choice
attributes among the consumers. This research has made an attempt to
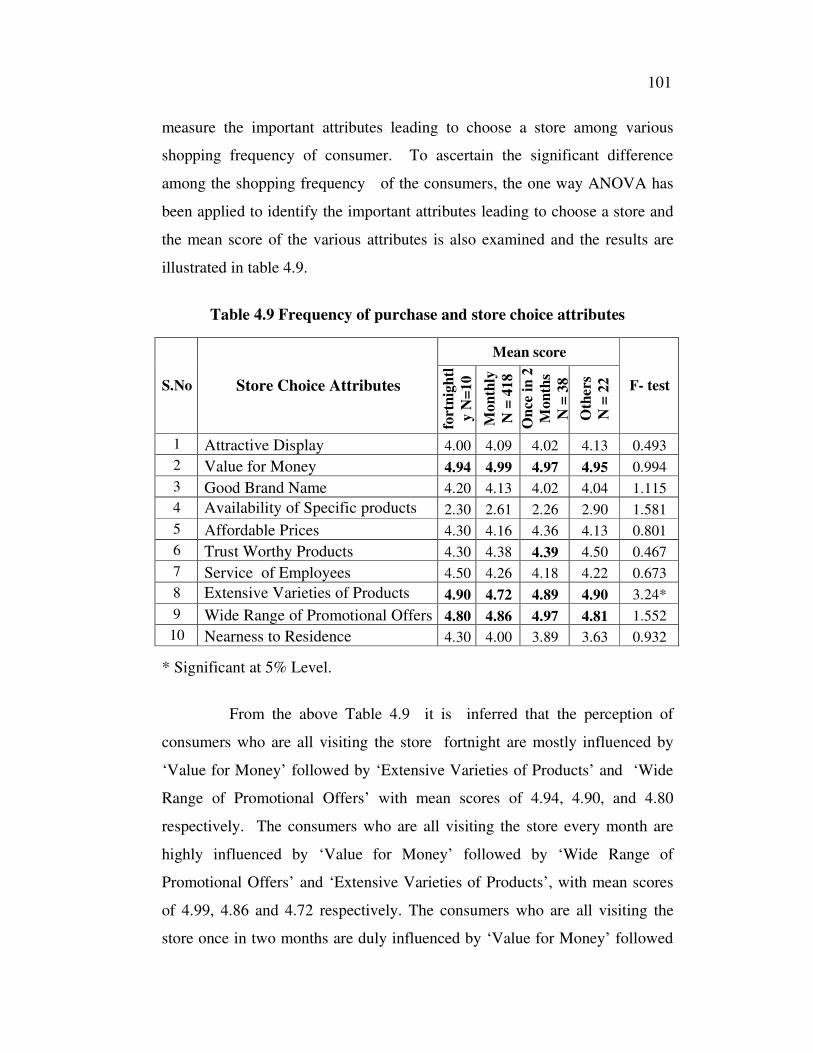
101
measure the important attributes leading to choose a store among various
shopping frequency of consumer. To ascertain the significant difference
among the shopping frequency of the consumers, the one way ANOVA has
been applied to identify the important attributes leading to choose a store and
the mean score of the various attributes is also examined and the results are
illustrated in table 4.9.
Table 4.9 Frequency of purchase and store choice attributes
* Significant at 5% Level.
From the above Table 4.9 it is inferred that the perception of
consumers who are all visiting the store fortnight are mostly influenced by
‘Value for Money’ followed by ‘Extensive Varieties of Products’ and ‘Wide
Range of Promotional Offers’ with mean scores of 4.94, 4.90, and 4.80
respectively. The consumers who are all visiting the store every month are
highly influenced by ‘Value for Money’ followed by ‘Wide Range of
Promotional Offers’ and ‘Extensive Varieties of Products’, with mean scores
of 4.99, 4.86 and 4.72 respectively. The consumers who are all visiting the
store once in two months are duly influenced by ‘Value for Money’ followed
Mean score
S.No Store Choice Attributes
fort
nig
htl
y N
=1
0
Mo
nth
ly
N =
41
8
On
ce i
n 2
Mo
nth
s
N =
38
Oth
ers
N =
22
F- test
1 Attractive Display 4.00 4.09 4.02 4.13 0.493
2 Value for Money 4.94 4.99 4.97 4.95 0.994
3 Good Brand Name 4.20 4.13 4.02 4.04 1.115
4 Availability of Specific products 2.30 2.61 2.26 2.90 1.581
5 Affordable Prices 4.30 4.16 4.36 4.13 0.801
6 Trust Worthy Products 4.30 4.38 4.39 4.50 0.467
7 Service of Employees 4.50 4.26 4.18 4.22 0.673
8 Extensive Varieties of Products 4.90 4.72 4.89 4.90 3.24*
9 Wide Range of Promotional Offers 4.80 4.86 4.97 4.81 1.552
10 Nearness to Residence 4.30 4.00 3.89 3.63 0.932
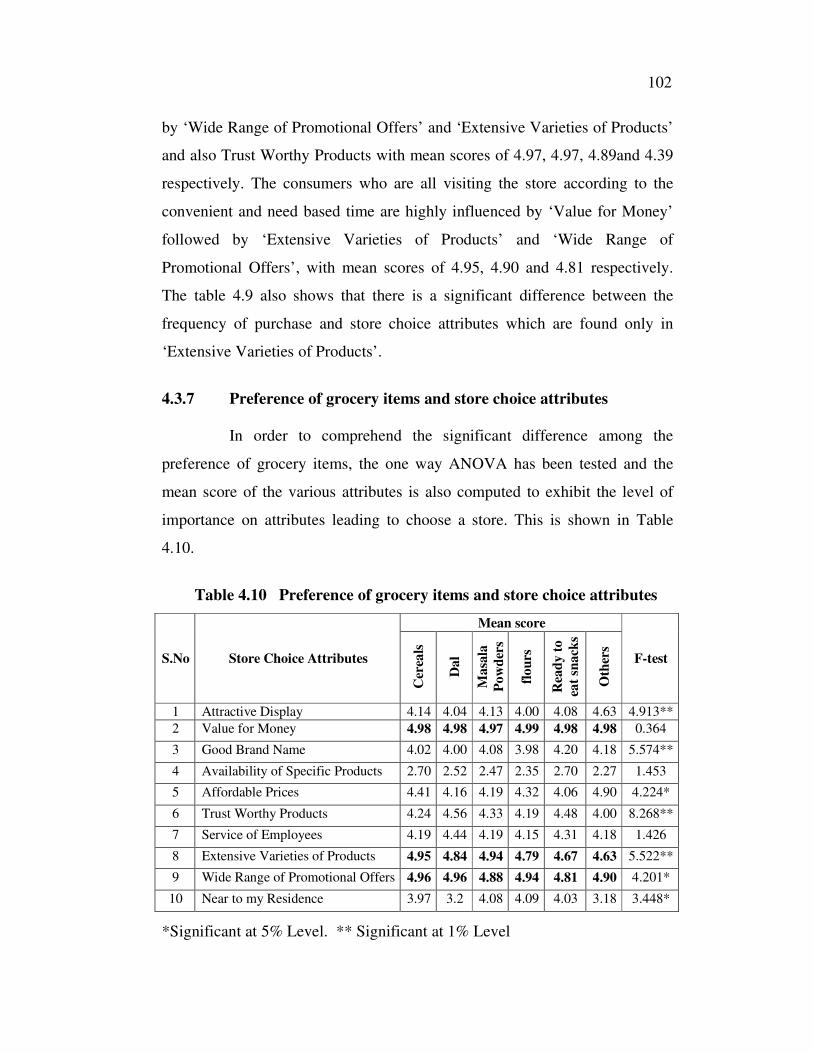
102
by ‘Wide Range of Promotional Offers’ and ‘Extensive Varieties of Products’
and also Trust Worthy Products with mean scores of 4.97, 4.97, 4.89and 4.39
respectively. The consumers who are all visiting the store according to the
convenient and need based time are highly influenced by ‘Value for Money’
followed by ‘Extensive Varieties of Products’ and ‘Wide Range of
Promotional Offers’, with mean scores of 4.95, 4.90 and 4.81 respectively.
The table 4.9 also shows that there is a significant difference between the
frequency of purchase and store choice attributes which are found only in
‘Extensive Varieties of Products’.
4.3.7 Preference of grocery items and store choice attributes
In order to comprehend the significant difference among the
preference of grocery items, the one way ANOVA has been tested and the
mean score of the various attributes is also computed to exhibit the level of
importance on attributes leading to choose a store. This is shown in Table
4.10.
Table 4.10 Preference of grocery items and store choice attributes
Mean score
S.No Store Choice Attributes
Cer
eals
Dal
Masa
la
Po
wd
ers
flo
urs
Rea
dy t
o
eat
snack
s
Oth
ers
F-test
1 Attractive Display 4.14 4.04 4.13 4.00 4.08 4.63 4.913**
2 Value for Money 4.98 4.98 4.97 4.99 4.98 4.98 0.364
3 Good Brand Name 4.02 4.00 4.08 3.98 4.20 4.18 5.574**
4 Availability of Specific Products 2.70 2.52 2.47 2.35 2.70 2.27 1.453
5 Affordable Prices 4.41 4.16 4.19 4.32 4.06 4.90 4.224*
6 Trust Worthy Products 4.24 4.56 4.33 4.19 4.48 4.00 8.268**
7 Service of Employees 4.19 4.44 4.19 4.15 4.31 4.18 1.426
8 Extensive Varieties of Products 4.95 4.84 4.94 4.79 4.67 4.63 5.522**
9 Wide Range of Promotional Offers 4.96 4.96 4.88 4.94 4.81 4.90 4.201*
10 Near to my Residence 3.97 3.2 4.08 4.09 4.03 3.18 3.448*
*Significant at 5% Level. ** Significant at 1% Level
103
The above Table 4.10 shows that there is a significant difference
between the preference of grocery items. The store choice attributes for the
same include ‘Attractive Display’,‘Good Brand Name’,‘Affordable
Prices’,‘Trust Worthy Products’; ‘Extensive Varieties of Products’; ‘Wide
Range of Promotional Offers’ and ‘Nearness to Residence’.
From the table 4.10, it is inferred that the consumers who preferred
cereals as grocery items are mostly influenced by ‘Value for Money’ followed
by ‘Wide Range of Promotional Offers’ and ‘Extensive Varieties of Products’,
with mean scores of 4.98, 4.96, and 4.95 respectively. The consumers who
prefer dal as most important grocery item are influenced by the store choice
attributes like ‘Value for Money’, ‘Wide Range of Promotional Offers’ and
‘Extensive Varieties of Products’, with mean scores of 4.98, 4.96, and 4.84
respectively The consumers who prefer to buy masala grocery items are
mainly influenced by ‘Value for Money’, ‘Extensive Varieties of Products’
and ‘Wide Range of Promotional Offers’, with mean scores of 4.97 ,4.94 and
4.88 respectively. The consumers who opt flours as the preferred store brand
grocery items are influenced by ‘Value for Money’, ‘Wide Range of
Promotional Offers’ and ‘Extensive Varieties of Products’, with mean scores
of 4.99, 4.94, and 4.79 respectively. The consumers who choose the product
category of Ready to Eat snacks are influenced by ‘Value for Money’
followed by ‘Wide Range of Promotional Offers’ and ‘Extensive Varieties of
Products’ with mean scores of 4.98, 4.81, and 4.67respectively.The consumers
opined that the other product category of store brands like cosmetics, textiles
and toiletries are most influenced by ‘Value for Money’, ‘Wide Range of
Promotional Offers’ and ‘Extensive Varieties of Products’, with mean scores
of 4.98, 4.90 and 4.62 respectively.

104
4.3.8 Frequency of store brand purchase and store choice attributes
To observe the significant difference among the duration of visit,
the consumers are classified into last 6 months, Last 1 year; 1 -2 years; 2 - 3
years; more than 3 years of visit. The one way ANOVA test has been
executed to narrate the influence level on attributes leading to choose a store
and the results are tabulated in Table 4.11.
Table 4.11 Frequency of store brand purchase and store choice attributes
Mean score
S. No Store Choice Attributes
La
st6
mo
nth
s
N=
34
La
st 1
yea
r
N=
90
1-2
yea
rs
N=
14
8
2- 3
yea
rs
N =
16
7
Mo
re t
ha
n 3
yrs
N=
49
F-test
1 Attractive Display 4.08 4.06 4.08 4.05 4.22 1.551
2 Value for Money 4.97 4.98 4.98 4.99 4.97 0.412
3 Good Brand Name 4.11 4.02 4.14 4.13 4.20 1.902
4 Availability of Specific Products 2.76 2.22 2.27 3.10 2.42 12.795**
5 Affordable Prices 4.44 4.37 4.14 4.06 4.12 3.066*
6 Trust Worthy Products 4.47 4.17 4.41 4.47 4.34 5.883**
7 Service of Employees 4.02 4.12 4.29 4.31 4.42 3.454*
8 Extensive Varieties of Products 4.82 4.66 4.75 4.77 4.79 1.334
9 Wide Range of Promotional Offers 4.94 4.98 4.89 4.79 4.77 6.757**
10 Nearness to Residence 3.47 3.87 4.16 3.92 4.20 3.016*
*Significant at 5% Level **Significant at 1% Level
From the above table 4.11, it is inferred that the perception of
consumers on duration of store brand purchase for the last 6 months are
mostly influenced by ‘Value for Money’ followed by ‘Wide Range of
Promotional Offers’, ‘Extensive Varieties of Products’, with mean scores of
4.97, 4.94, and 4.82 respectively. The consumers who are all purchasing the
store brand for the last 1 year are highly influenced by ‘Value for Money’
followed by ‘Wide Range of Promotional Offers’ and ‘Extensive Varieties of
Products’, with mean scores of 4.98, 4.98 and 4.66 respectively. The
105
consumers who are all purchasing the store brands for 1 to2 years are
favourably influenced by ‘Value for Money’ followed by ‘Wide Range of
Promotional Offers’ and ‘Extensive Varieties of Products’, with mean scores
of 4.98, 4.89 and 4.75 respectively. The consumers who are all purchasing the
store brands for 2 to 3 years are duly influenced by ‘Value for Money’
followed by ‘Wide Range of Promotional Offers’ and ‘Extensive Varieties of
Products’, with mean scores of 4.99, 4.79 and 4.77 respectively. The
consumers who are all purchasing the store brands for more than 3 years are
influenced by ‘Value for Money’ followed by ‘Extensive Varieties of
Products’ and ‘Wide Range of Promotional Offers’ with mean scores of 4.97,
4.79 and 4.77 respectively. The table 4.11 also shows that there is a significant
difference between the duration of store brand purchase and store choice
attributes which include ‘Availability of Specific Products’, ‘Affordable
Prices’ and ‘Trust Worthy Products’, ‘Services of Employees’, ‘Wide Range
of Promotional Offers’ and ‘Nearness to Residence’.
4.3.9 Consumer Preference on Store Choice Attributes of Retail
Outlets
The consumers select a particular retail store which offers the
lowest price and being convenient, to reduce the cognitive dimension in the
decision making. It is found that shoppers use a combination of the quality of
staff, low price and frequency of promotions in choosing a store. Consumers
evaluate alternative stores on a set of attributes and depending on their
preferences, they would patronize the best store as stated by Tripathi and
Sinha (2006).
The study by Goyal and Aggarwal (2009), examines the relative
importance of the various products purchased at organized retail outlets and
the choice of format, the consumer has when purchasing a product. The store
choice of consumers depends on socio-economic background, personality and
past purchase experience. Thenmozhi (2010) states that now-a-days people
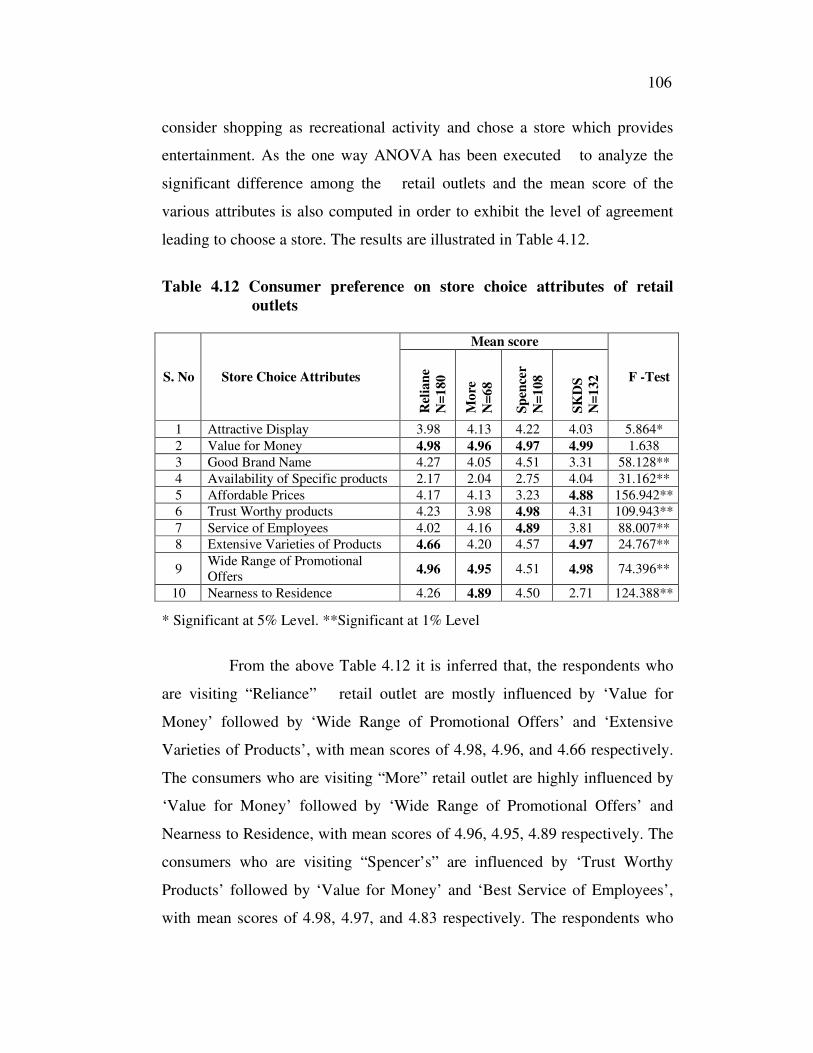
106
consider shopping as recreational activity and chose a store which provides
entertainment. As the one way ANOVA has been executed to analyze the
significant difference among the retail outlets and the mean score of the
various attributes is also computed in order to exhibit the level of agreement
leading to choose a store. The results are illustrated in Table 4.12.
Table 4.12 Consumer preference on store choice attributes of retail
outlets
Mean score
S. No Store Choice Attributes
Rel
ian
e
N=
180
Mo
re
N=
68
Sp
ence
r
N=
108
SK
DS
N=
132
F -Test
1 Attractive Display 3.98 4.13 4.22 4.03 5.864*
2 Value for Money 4.98 4.96 4.97 4.99 1.638
3 Good Brand Name 4.27 4.05 4.51 3.31 58.128**
4 Availability of Specific products 2.17 2.04 2.75 4.04 31.162**
5 Affordable Prices 4.17 4.13 3.23 4.88 156.942**
6 Trust Worthy products 4.23 3.98 4.98 4.31 109.943**
7 Service of Employees 4.02 4.16 4.89 3.81 88.007**
8 Extensive Varieties of Products 4.66 4.20 4.57 4.97 24.767**
9 Wide Range of Promotional
Offers 4.96 4.95 4.51 4.98 74.396**
10 Nearness to Residence 4.26 4.89 4.50 2.71 124.388**
* Significant at 5% Level. **Significant at 1% Level
From the above Table 4.12 it is inferred that, the respondents who
are visiting “Reliance” retail outlet are mostly influenced by ‘Value for
Money’ followed by ‘Wide Range of Promotional Offers’ and ‘Extensive
Varieties of Products’, with mean scores of 4.98, 4.96, and 4.66 respectively.
The consumers who are visiting “More” retail outlet are highly influenced by
‘Value for Money’ followed by ‘Wide Range of Promotional Offers’ and
Nearness to Residence, with mean scores of 4.96, 4.95, 4.89 respectively. The
consumers who are visiting “Spencer’s” are influenced by ‘Trust Worthy
Products’ followed by ‘Value for Money’ and ‘Best Service of Employees’,
with mean scores of 4.98, 4.97, and 4.83 respectively. The respondents who
107
are visiting “SKDS” retail outlet are more influenced by ‘Value for Money’
followed by ‘Wide Range of Promotional Offers’ and ‘Extensive Varieties of
Products’, with mean scores of 4.99, 4.98, and 4.97 respectively. The above
table also shows that there is a significant difference in factors influencing
store choice attributes among various retail outlets while selecting a particular
retail outlet as the purchase decision except the attribute like ‘Value for
Money’, is most influencing factor in all the four major retail outlets. In
consumer point of view, the retailers have to give more importance to the
value based on the consumers’ expectations towards product with reasonable
price.
4.4 ASSOCIATION BETWEEN PROFILE OF CONSUMER AND
THE ATTITUDE TOWARDS THE IMPORTANCE OF
PURCHASE PARAMETERS OF STORE BRANDS
Consumers usually compare several different brands before
deciding which option to purchase. For example, a consumer at a grocery
store compares the characteristics of different products before purchasing.
With changing consumer preferences, specific parameters of grocery
products such as colour, taste, freshness and others have become increasingly
important in influencing consumers’ purchase decision.
The Lancaster’s theory of demand for attributes provides a
theoretical framework for studying consumer’s preference towards store
brand. Lancaster (1966) has stated that goods are comprised of attributes.
Consumers purchase goods because of the account they have rather than
goods. For example, decisions to purchase store brands are based on
parameters such as freshness, food safety, price, taste, flavors, convenience
and so on. The utility is derived from the characteristics or the properties of
the products which represents the attributes rather than the nature of the
goods. In this study a consumer utility function associated with the purchase
108
of store brand is expressed in terms of the relative importance levels for
selected store brand grocery products. The review of past research by
Xiaoping Miao (2003) on consumers’ preference for meat attributes in retail
outlets focuses on characteristics, in order of importance, when purchasing
meat. This characteristics plays a substantial role in the purchase of store
brand products. On the basis ten specific store brand characteristics included
in this research are Cleanliness, Inspection Stamp and Certificate, Proper
Packaging, Purchase Convenience, Competitive Price, Food Safety, Easiness
to Prepare, Flavor, Freshness and Discount. The consumers are asked to rate
the parameters or characteristics on a five point scale as ‘1’ being ‘Not at all
Important’ and ‘5’being ‘Extremely Important’, while purchasing store brand
at the store.
Since the profile of the respondents plays an important role in level
of importance on purchase parameters of store brands, the study has made an
attempt to examine the association between these two variables with the help
of one way Analysis of Variance. The profile variables are gender, age,
occupation, average monthly grocery expenditure, frequency of consumer
visit, shopping frequency at the store, duration of store brand purchase,
product categories and specific retail outlet. The result of one way Analysis of
Variance is presented in table 4.13.
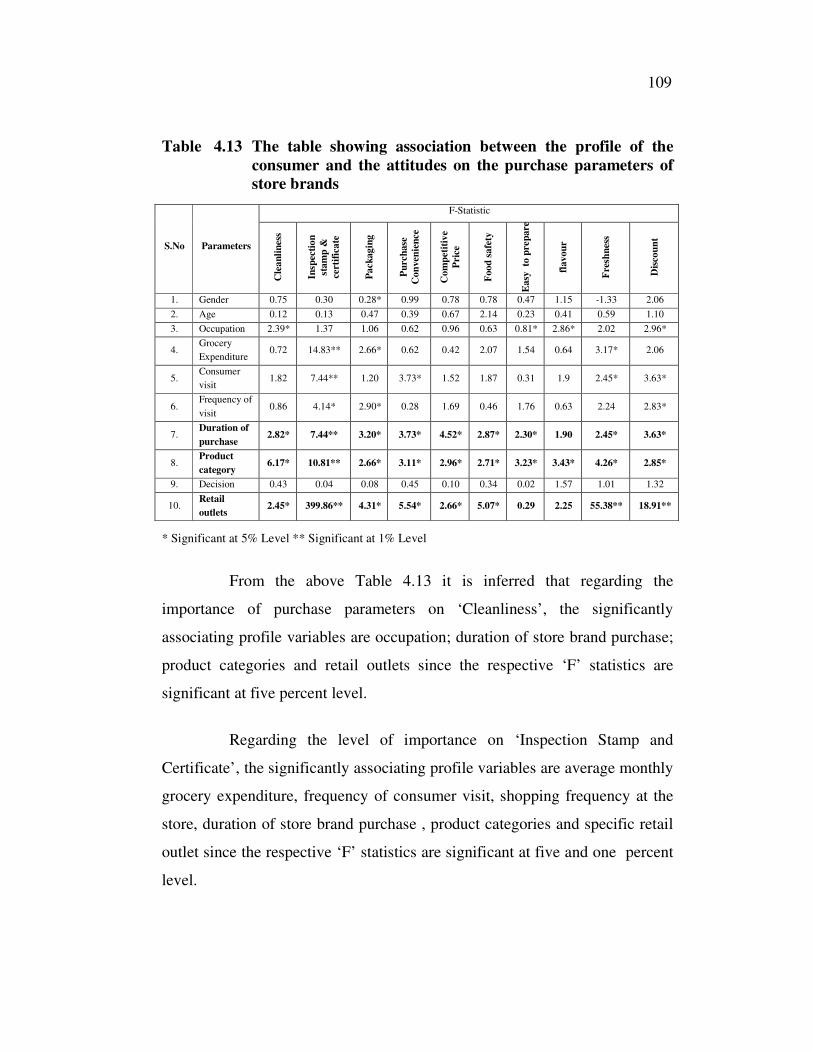
109
Table 4.13 The table showing association between the profile of the
consumer and the attitudes on the purchase parameters of
store brands
F-Statistic
S.No Parameters
Cle
an
lin
ess
Insp
ecti
on
stam
p &
cert
ific
ate
Pa
ck
ag
ing
Pu
rch
ase
Co
nven
ien
ce
Co
mp
etit
ive
Pri
ce
Foo
d s
afe
ty
Easy
to
pre
pare
flav
ou
r
Fre
shn
ess
Dis
cou
nt
1. Gender 0.75 0.30 0.28* 0.99 0.78 0.78 0.47 1.15 -1.33 2.06
2. Age 0.12 0.13 0.47 0.39 0.67 2.14 0.23 0.41 0.59 1.10
3. Occupation 2.39* 1.37 1.06 0.62 0.96 0.63 0.81* 2.86* 2.02 2.96*
4. Grocery
Expenditure 0.72 14.83** 2.66* 0.62 0.42 2.07 1.54 0.64 3.17* 2.06
5. Consumer
visit 1.82 7.44** 1.20 3.73* 1.52 1.87 0.31 1.9 2.45* 3.63*
6. Frequency of
visit 0.86 4.14* 2.90* 0.28 1.69 0.46 1.76 0.63 2.24 2.83*
7. Duration of
purchase 2.82* 7.44** 3.20* 3.73* 4.52* 2.87* 2.30* 1.90 2.45* 3.63*
8. Product
category 6.17* 10.81** 2.66* 3.11* 2.96* 2.71* 3.23* 3.43* 4.26* 2.85*
9. Decision 0.43 0.04 0.08 0.45 0.10 0.34 0.02 1.57 1.01 1.32
10. Retail
outlets 2.45* 399.86** 4.31* 5.54* 2.66* 5.07* 0.29 2.25 55.38** 18.91**
* Significant at 5% Level ** Significant at 1% Level
From the above Table 4.13 it is inferred that regarding the
importance of purchase parameters on ‘Cleanliness’, the significantly
associating profile variables are occupation; duration of store brand purchase;
product categories and retail outlets since the respective ‘F’ statistics are
significant at five percent level.
Regarding the level of importance on ‘Inspection Stamp and
Certificate’, the significantly associating profile variables are average monthly
grocery expenditure, frequency of consumer visit, shopping frequency at the
store, duration of store brand purchase , product categories and specific retail
outlet since the respective ‘F’ statistics are significant at five and one percent
level.

110
Consumers consider ‘Packaging’ as important purchase parameters
while purchasing store brand products as it is significantly associated with the
profile variables like gender, average monthly grocery expenditure, shopping
frequency at the store, duration of store brand purchase, product categories
and specific retail outlet, since the respective ‘F’ statistics are significant at
five percent level. As per the parameters when purchasing store brand
products with regard to ‘Purchase Convenience’, the significantly associating
profile variables are frequency of consumer visit, duration of store brand
purchase, product categories and specific retail outlet since the respective ‘F’
statistics are significant at five percent level.
Consumers attitude towards parameters with regard to ‘Competitive
Price’ and ‘Food Safety’ when purchasing store brand products has significant
relationship with profile variables such as duration of store brand purchase,
product categories and specific retail outlet, since the respective ‘F’ statistics
are significant at five percent level. Regarding the purchase parameters like
‘Easy to Prepare’ and ‘Flavor’, only few profile variables such as occupation,
duration of store brand purchase and product categories are statistically
significant at five percent level.
As ‘Freshness’ is one of the parameters considered to be very
important, the significantly associating profile variables are monthly grocery
expenditure, frequency of consumer visit, duration of store brand purchase,
product categories and specific retail outlet, since the respective ‘F’ statistics
are significant at five and one percent level. Regarding the importance of
purchase parameters on ‘Discount’, the significantly associating profile
variables are occupation , frequency of consumer visit, shopping frequency at
the store, duration of store brand purchase, product categories and specific
retail outlet, since the respective ‘F’ statistics are significant at five and one
percent level .
111
Finally, it is found that consumers of all retail outlets have different
attitudes towards purchase parameters of store brand products in each retail
outlets, since the consumers who purchase store brands at different outlets are
from various market segments. The study also reveals that duration of store
brand purchase and product categories are the important profile variables
which have influence on almost all the purchase parameters of store brand.
4.5 CONSUMER ATTITUDES TOWARDS STORE BRAND
PURCHASE
Many researchers like Garretson and Burton (1998), Richardson et
al (1996), Miranda and Joshi (2003) state that the consumer attitude towards
store brand purchase is an important explanatory factor determining consumer
proneness to store brands. Improving the attitude of consumers towards a
store’s store brand products will enhance the impression among the store’s
consumers as if they are provided with an expanded choice of products.
While many studies by Dick et al (1995), Ailawadi (2001) have
attempted to identify store brand buyers on the basis of demographic, socio-
economic and psychographic segmentation variables, the evidence has been
mixed and remains inconclusive. Myers (1967) states that consumer attitudes
towards store brands are more useful than segmentation studies as basis for
identifying market segments. Researchers investigating consumer attitudes
have been examined attitudes towards store brands with respect to factors
such as quality, price and value. While some researchers simply highlight
differences in consumer perceptions between these different brand types,
others have drawn the differences in an attempt to explain store brand
proneness and the success of store brands.
Guerrero et al (2000) have studied consumer attitude towards store
brands. They have found that the consumers perceive store brand products as
112
reliable; different from producer brands and good in value for money.
Cardello (1997) reports about negative stereotypes that affect store brand
purchase, however this might be dependent on the country related to the
retailer. The consumer perceptions of store brands have changed as retailers
have repositioned them over time. McGoldrick (1984) states that the reduction
in the gap between own labels and national brands in terms of price and
quality, together with the increasing promotion of retailer names and the own
brands, has changed consumer perceptions towards own labels. It reduces
perceived risk associated with the purchase. Nevertheless, studies continue to
show that store brands are perceived as inferior in quality to national brands.
Vaidyanathan and Aggrawal (2000) state that store brands suffer from a lack
of a strong, quality image.
4.5.1 Variables and measures
Mark and Chen (2009) examines the category-level differences of
both risk perception and brand loyalty effects on consumer proneness towards
buying store brands. It indicates that Quality Variability; Price
Consciousness; Price-Quality Association and Brand Loyalty influence
consumer proneness to buy store brands. Perceived Risk and perceived value
of store brands are measured based on scales developed by Harcar and
Kucukemiroglu (2006). The perceived quality is measured on Delvecchio
(2001) scale. ‘Price Consciousness’ is measured based on measures taken by
Lichtenstein, Ridgway and Netemeyer (1993). With reference to store image
it is measured on the basis of the scale used by Manolis et al (1994). And
finally, store brand attitude is measured based on the scale developed by
Burton, Lichtenstein Nettelmeyer and Garretson (1998).
4.5.2 Gender and consumer attitude towards store brands
Justin (2009), Samrat (2011) have analyzed that the demographic
variables are largely ineffective in determining an individuals’s propensity to
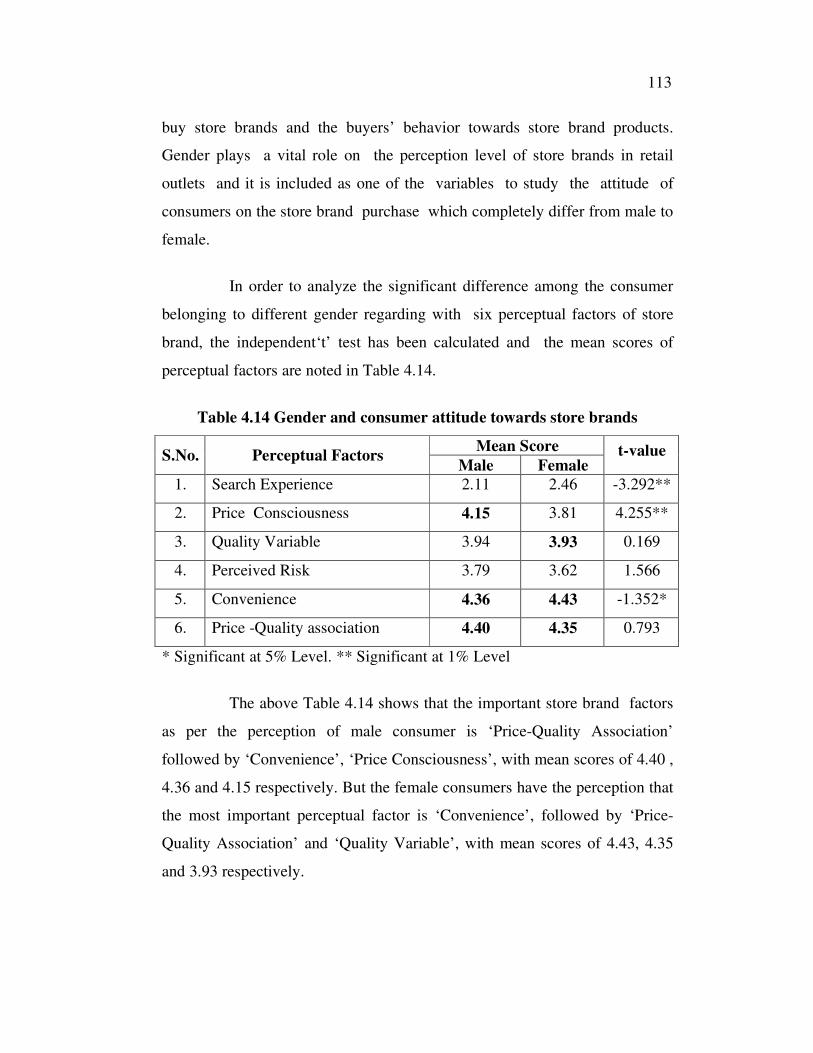
113
buy store brands and the buyers’ behavior towards store brand products.
Gender plays a vital role on the perception level of store brands in retail
outlets and it is included as one of the variables to study the attitude of
consumers on the store brand purchase which completely differ from male to
female.
In order to analyze the significant difference among the consumer
belonging to different gender regarding with six perceptual factors of store
brand, the independent‘t’ test has been calculated and the mean scores of
perceptual factors are noted in Table 4.14.
Table 4.14 Gender and consumer attitude towards store brands
Mean Score S.No. Perceptual Factors
Male Female t-value
1. Search Experience 2.11 2.46 -3.292**
2. Price Consciousness 4.15 3.81 4.255**
3. Quality Variable 3.94 3.93 0.169
4. Perceived Risk 3.79 3.62 1.566
5. Convenience 4.36 4.43 -1.352*
6. Price -Quality association 4.40 4.35 0.793
* Significant at 5% Level. ** Significant at 1% Level
The above Table 4.14 shows that the important store brand factors
as per the perception of male consumer is ‘Price-Quality Association’
followed by ‘Convenience’, ‘Price Consciousness’, with mean scores of 4.40 ,
4.36 and 4.15 respectively. But the female consumers have the perception that
the most important perceptual factor is ‘Convenience’, followed by ‘Price-
Quality Association’ and ‘Quality Variable’, with mean scores of 4.43, 4.35
and 3.93 respectively.
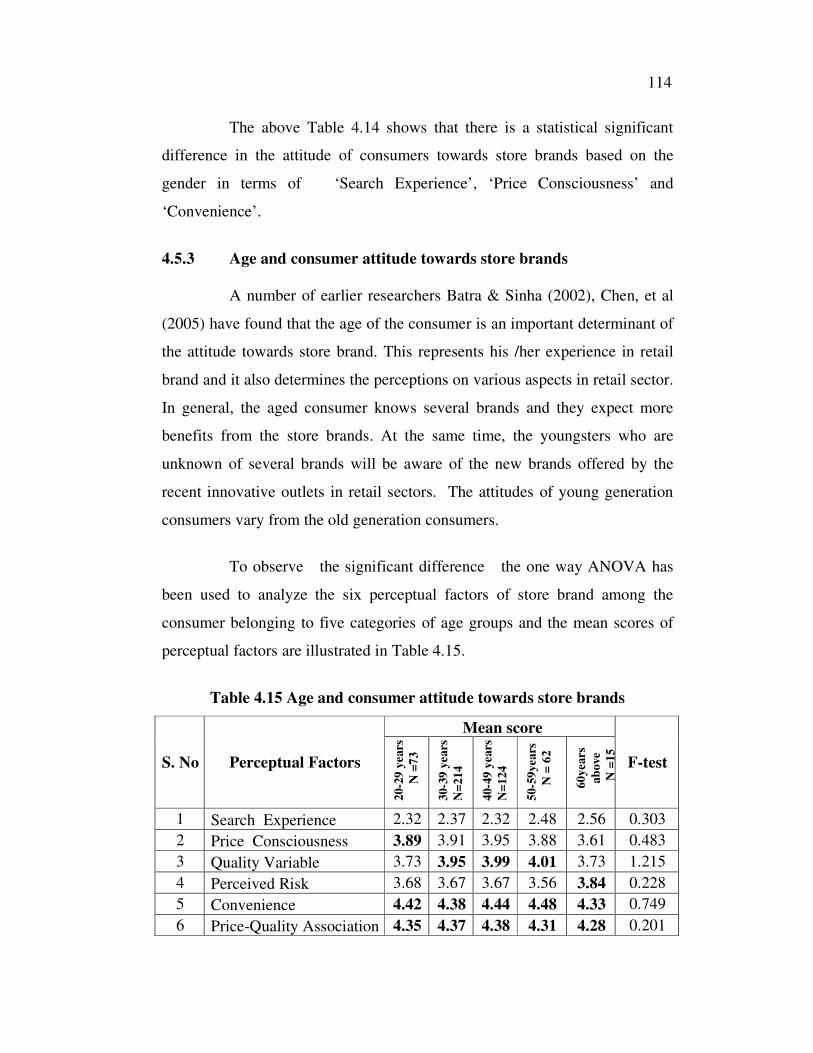
114
The above Table 4.14 shows that there is a statistical significant
difference in the attitude of consumers towards store brands based on the
gender in terms of ‘Search Experience’, ‘Price Consciousness’ and
‘Convenience’.
4.5.3 Age and consumer attitude towards store brands
A number of earlier researchers Batra & Sinha (2002), Chen, et al
(2005) have found that the age of the consumer is an important determinant of
the attitude towards store brand. This represents his /her experience in retail
brand and it also determines the perceptions on various aspects in retail sector.
In general, the aged consumer knows several brands and they expect more
benefits from the store brands. At the same time, the youngsters who are
unknown of several brands will be aware of the new brands offered by the
recent innovative outlets in retail sectors. The attitudes of young generation
consumers vary from the old generation consumers.
To observe the significant difference the one way ANOVA has
been used to analyze the six perceptual factors of store brand among the
consumer belonging to five categories of age groups and the mean scores of
perceptual factors are illustrated in Table 4.15.
Table 4.15 Age and consumer attitude towards store brands
Mean score
S. No Perceptual Factors
20-2
9 y
ears
N =
73
30-3
9 y
ears
N=
21
4
40-4
9 y
ears
N=
12
4
50-5
9years
N =
62
60years
ab
ove
N
=15
F-test
1 Search Experience 2.32 2.37 2.32 2.48 2.56 0.303
2 Price Consciousness 3.89 3.91 3.95 3.88 3.61 0.483
3 Quality Variable 3.73 3.95 3.99 4.01 3.73 1.215
4 Perceived Risk 3.68 3.67 3.67 3.56 3.84 0.228
5 Convenience 4.42 4.38 4.44 4.48 4.33 0.749
6 Price-Quality Association 4.35 4.37 4.38 4.31 4.28 0.201
115
From the above Table 4.15 it is inferred that the most important
store brand factor, as per the perception of consumers aged below 30 years is
‘Convenience’ followed by ‘Price-Quality Association’ and ‘Price
Consciousness’, with mean scores of 4.42, 4.35 and 3.89 respectively. The
consumers aged between 30-39 years have the perception that most perceptual
factor is ‘Convenience’ followed by ‘Price-Quality Association’ and ‘Quality
Variable’ with mean scores of 4.38, 4.37 and 3.95 respectively. The
consumers aged between 40-49 years have the perception that most perceptual
factor is ‘Convenience’ followed by ‘Price-Quality Association’ and ‘Quality
Variable’, with mean scores of 4.44, 4.38 and 3.99 respectively. The
consumers aged between 50-59 years have the perception that most perceptual
factor is ‘Convenience’ followed by ‘Price-Quality Association’ and ‘Quality
Variable’, with mean scores of 4.48, 4.31 and 4.01 respectively. The
consumers aged above 60 years have the perception that most perceptual
factor is ‘Convenience’ followed by ‘Price-Quality Association’ and
‘Perceived Risk’, with mean scores of 4.33, 4.28, and 3.84 respectively. The
table 4.15 also shows that there is no significant difference between consumer
attitude towards store brand factors based on the age of the consumer.
4.5.4 Occupational level and consumer attitude towards store
brands
The study by Thenmozhi and Dhanapal (2010) has proved that the
type of occupation among the consumers represents the occupational
background or ways of earning money for life. The level of perception is also
influenced by diverse occupations. In the present study, the occupation among
the consumers is grouped into salaried, business, professional and home
makers.
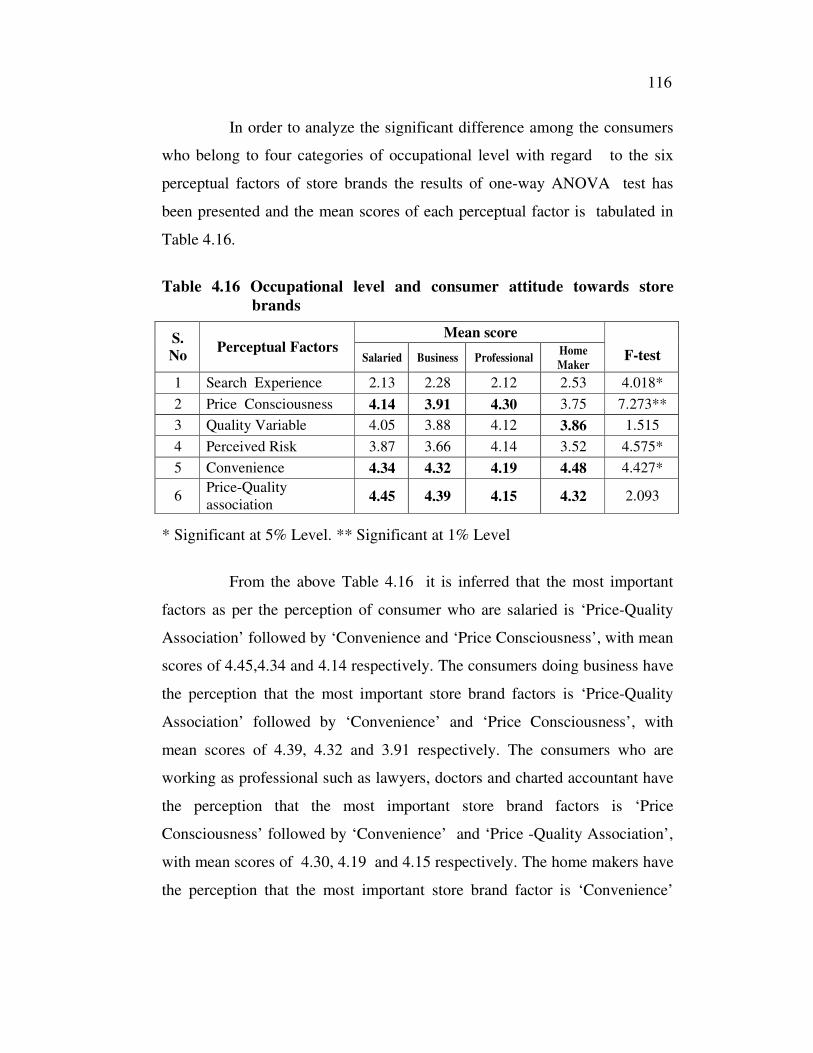
116
In order to analyze the significant difference among the consumers
who belong to four categories of occupational level with regard to the six
perceptual factors of store brands the results of one-way ANOVA test has
been presented and the mean scores of each perceptual factor is tabulated in
Table 4.16.
Table 4.16 Occupational level and consumer attitude towards store
brands
Mean score S.
No Perceptual Factors
Salaried Business Professional Home
Maker
F-test
1 Search Experience 2.13 2.28 2.12 2.53 4.018*
2 Price Consciousness 4.14 3.91 4.30 3.75 7.273**
3 Quality Variable 4.05 3.88 4.12 3.86 1.515
4 Perceived Risk 3.87 3.66 4.14 3.52 4.575*
5 Convenience 4.34 4.32 4.19 4.48 4.427*
6 Price-Quality
association 4.45 4.39 4.15 4.32 2.093
* Significant at 5% Level. ** Significant at 1% Level
From the above Table 4.16 it is inferred that the most important
factors as per the perception of consumer who are salaried is ‘Price-Quality
Association’ followed by ‘Convenience and ‘Price Consciousness’, with mean
scores of 4.45,4.34 and 4.14 respectively. The consumers doing business have
the perception that the most important store brand factors is ‘Price-Quality
Association’ followed by ‘Convenience’ and ‘Price Consciousness’, with
mean scores of 4.39, 4.32 and 3.91 respectively. The consumers who are
working as professional such as lawyers, doctors and charted accountant have
the perception that the most important store brand factors is ‘Price
Consciousness’ followed by ‘Convenience’ and ‘Price -Quality Association’,
with mean scores of 4.30, 4.19 and 4.15 respectively. The home makers have
the perception that the most important store brand factor is ‘Convenience’
117
followed by ‘Price-Quality Association’ and ‘Quality Variable’, with mean
scores of 4.48, 4.32 and 3.86 respectively.
The above Table 4.16 clearly indicates that the attitude towards the
store brand is significant statistically and is different based on the occupation
with respect to ‘Convenience’, ‘Price Consciousness’, ‘Perceived Risk’ and
‘Search Experience’.
4.5.5 Monthly grocery expenditure and consumer attitude towards
store brands
It is observed from the studies of Ravichandran and Amirta (2008),
Thenmozhi et al (2010) and Benekin Justin (2009) that the monthly amount
spent for grocery represents the expenses incurred by the consumer for
purchasing grocery products. The attitude towards store brands is fluctuating
from customer to customer based on the monthly amount spent for grocery
purchase. The amount spent for grocery purchase also determines the
affordability of the consumer to select a particular retail store brand product.
The monthly grocery expense of the consumer is one of the variables
determining the preference of store brand in grocery products. The monthly
grocery purchase will have its impact on the awareness, estimation and
attitude towards store brands offered by the retail outlets.
In the present study, the monthly amount spent for grocery
purchase among the consumers is confined to less than Rs.1000; Rs.1001 -
2000; Rs. 2001 -3000; Rs. 3001-4000; Rs. 4001–5000 and Rs. 5000 above.
The one-way ANOVA has been applied to examine the significant difference
among the consumers belonging to six categories of monthly grocery
expenditure with respect to the six perceptual factors of store brand and mean
scores are calculated. The results are shown in table 4.17.
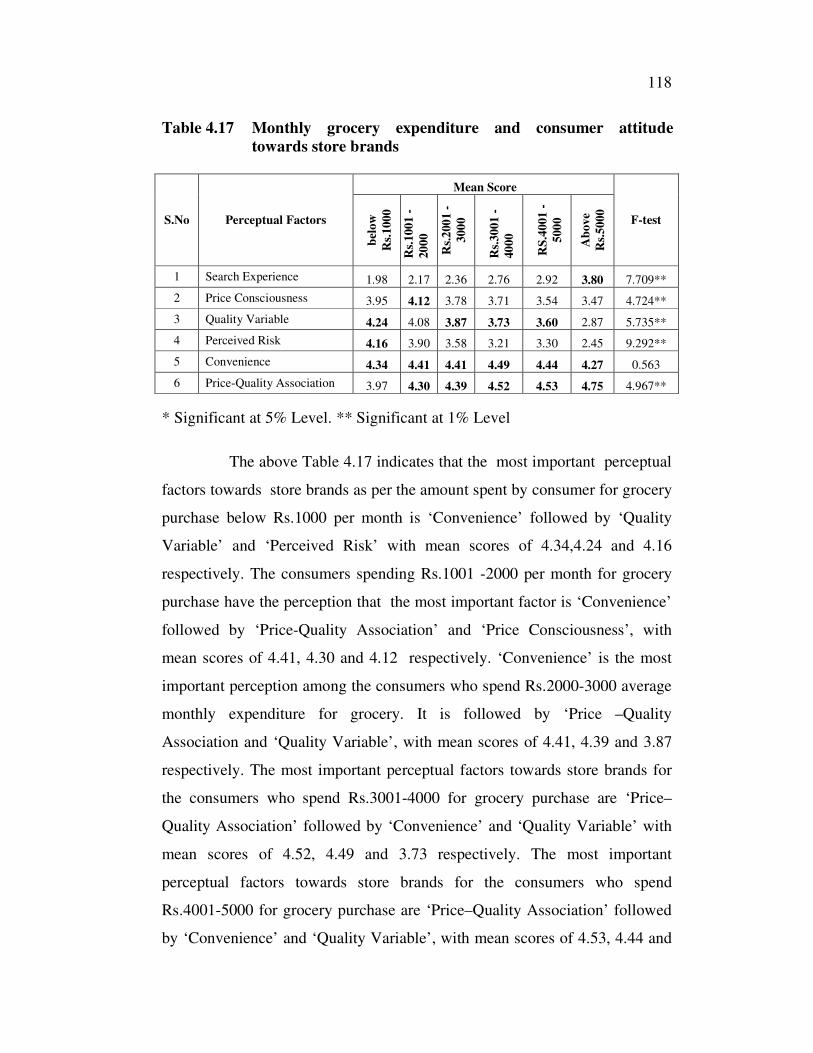
118
Table 4.17 Monthly grocery expenditure and consumer attitude
towards store brands
Mean Score
S.No Perceptual Factors
bel
ow
Rs.
1000
Rs.
1001 -
20
00
Rs.
200
1 -
300
0
Rs.
3001 -
40
00
RS
.4001 -
500
0
Ab
ove
Rs.
5000
F-test
1 Search Experience 1.98 2.17 2.36 2.76 2.92 3.80 7.709**
2 Price Consciousness 3.95 4.12 3.78 3.71 3.54 3.47 4.724**
3 Quality Variable 4.24 4.08 3.87 3.73 3.60 2.87 5.735**
4 Perceived Risk 4.16 3.90 3.58 3.21 3.30 2.45 9.292**
5 Convenience 4.34 4.41 4.41 4.49 4.44 4.27 0.563
6 Price-Quality Association 3.97 4.30 4.39 4.52 4.53 4.75 4.967**
* Significant at 5% Level. ** Significant at 1% Level
The above Table 4.17 indicates that the most important perceptual
factors towards store brands as per the amount spent by consumer for grocery
purchase below Rs.1000 per month is ‘Convenience’ followed by ‘Quality
Variable’ and ‘Perceived Risk’ with mean scores of 4.34,4.24 and 4.16
respectively. The consumers spending Rs.1001 -2000 per month for grocery
purchase have the perception that the most important factor is ‘Convenience’
followed by ‘Price-Quality Association’ and ‘Price Consciousness’, with
mean scores of 4.41, 4.30 and 4.12 respectively. ‘Convenience’ is the most
important perception among the consumers who spend Rs.2000-3000 average
monthly expenditure for grocery. It is followed by ‘Price –Quality
Association and ‘Quality Variable’, with mean scores of 4.41, 4.39 and 3.87
respectively. The most important perceptual factors towards store brands for
the consumers who spend Rs.3001-4000 for grocery purchase are ‘Price–
Quality Association’ followed by ‘Convenience’ and ‘Quality Variable’ with
mean scores of 4.52, 4.49 and 3.73 respectively. The most important
perceptual factors towards store brands for the consumers who spend
Rs.4001-5000 for grocery purchase are ‘Price–Quality Association’ followed
by ‘Convenience’ and ‘Quality Variable’, with mean scores of 4.53, 4.44 and
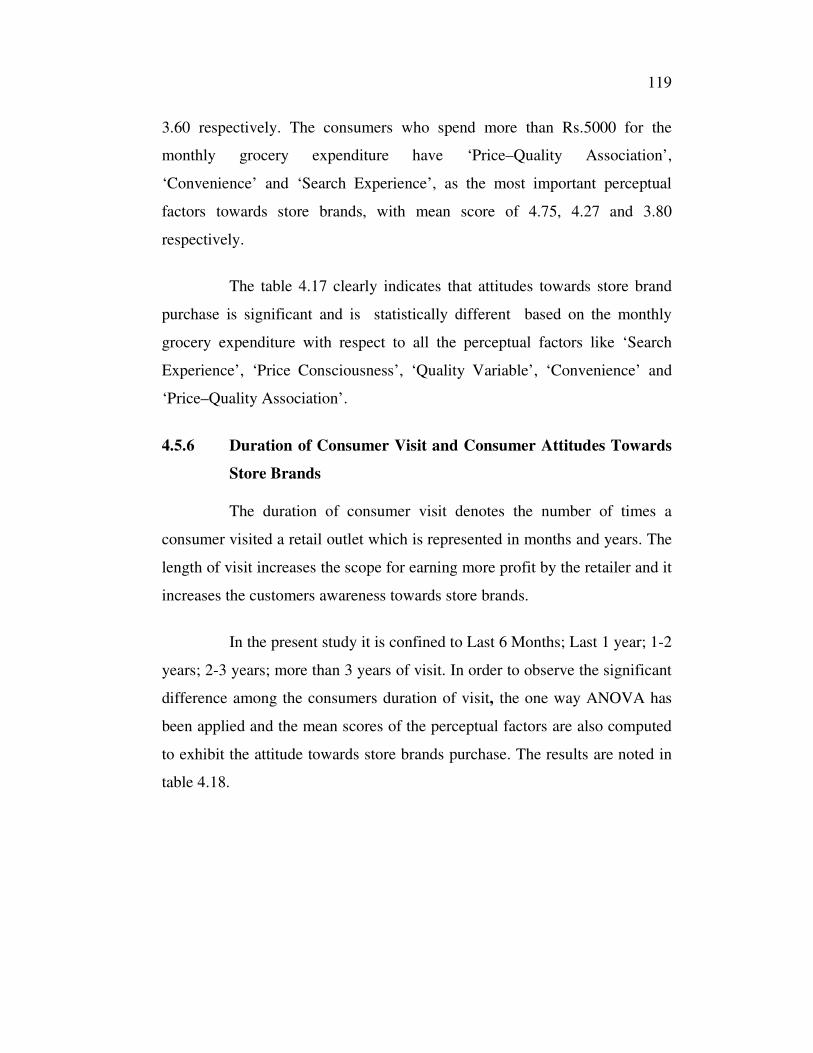
119
3.60 respectively. The consumers who spend more than Rs.5000 for the
monthly grocery expenditure have ‘Price–Quality Association’,
‘Convenience’ and ‘Search Experience’, as the most important perceptual
factors towards store brands, with mean score of 4.75, 4.27 and 3.80
respectively.
The table 4.17 clearly indicates that attitudes towards store brand
purchase is significant and is statistically different based on the monthly
grocery expenditure with respect to all the perceptual factors like ‘Search
Experience’, ‘Price Consciousness’, ‘Quality Variable’, ‘Convenience’ and
‘Price–Quality Association’.
4.5.6 Duration of Consumer Visit and Consumer Attitudes Towards
Store Brands
The duration of consumer visit denotes the number of times a
consumer visited a retail outlet which is represented in months and years. The
length of visit increases the scope for earning more profit by the retailer and it
increases the customers awareness towards store brands.
In the present study it is confined to Last 6 Months; Last 1 year; 1-2
years; 2-3 years; more than 3 years of visit. In order to observe the significant
difference among the consumers duration of visit, the one way ANOVA has
been applied and the mean scores of the perceptual factors are also computed
to exhibit the attitude towards store brands purchase. The results are noted in
table 4.18.
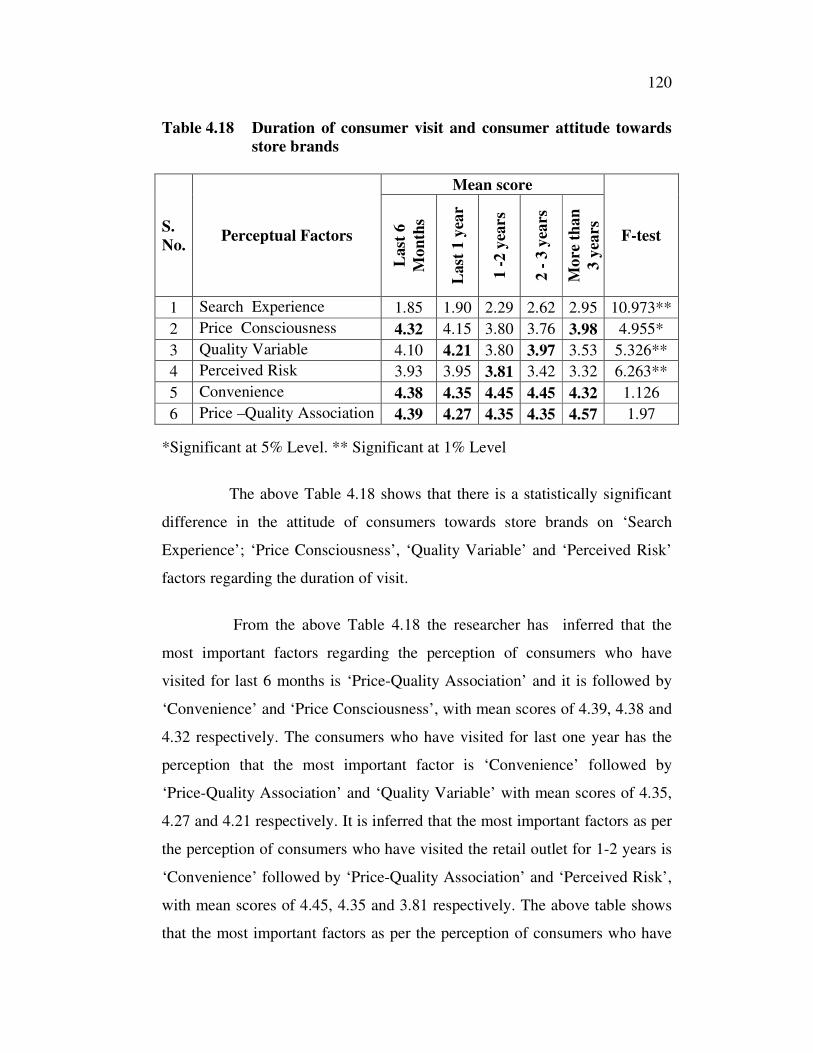
120
Table 4.18 Duration of consumer visit and consumer attitude towards
store brands
Mean score
S.
No. Perceptual Factors
Last
6
Mo
nth
s
Last
1 y
ear
1 -
2 y
ears
2 -
3 y
ears
Mo
re t
han
3 y
ears
F-test
1 Search Experience 1.85 1.90 2.29 2.62 2.95 10.973**
2 Price Consciousness 4.32 4.15 3.80 3.76 3.98 4.955*
3 Quality Variable 4.10 4.21 3.80 3.97 3.53 5.326**
4 Perceived Risk 3.93 3.95 3.81 3.42 3.32 6.263**
5 Convenience 4.38 4.35 4.45 4.45 4.32 1.126
6 Price –Quality Association 4.39 4.27 4.35 4.35 4.57 1.97
*Significant at 5% Level. ** Significant at 1% Level
The above Table 4.18 shows that there is a statistically significant
difference in the attitude of consumers towards store brands on ‘Search
Experience’; ‘Price Consciousness’, ‘Quality Variable’ and ‘Perceived Risk’
factors regarding the duration of visit.
From the above Table 4.18 the researcher has inferred that the
most important factors regarding the perception of consumers who have
visited for last 6 months is ‘Price-Quality Association’ and it is followed by
‘Convenience’ and ‘Price Consciousness’, with mean scores of 4.39, 4.38 and
4.32 respectively. The consumers who have visited for last one year has the
perception that the most important factor is ‘Convenience’ followed by
‘Price-Quality Association’ and ‘Quality Variable’ with mean scores of 4.35,
4.27 and 4.21 respectively. It is inferred that the most important factors as per
the perception of consumers who have visited the retail outlet for 1-2 years is
‘Convenience’ followed by ‘Price-Quality Association’ and ‘Perceived Risk’,
with mean scores of 4.45, 4.35 and 3.81 respectively. The above table shows
that the most important factors as per the perception of consumers who have
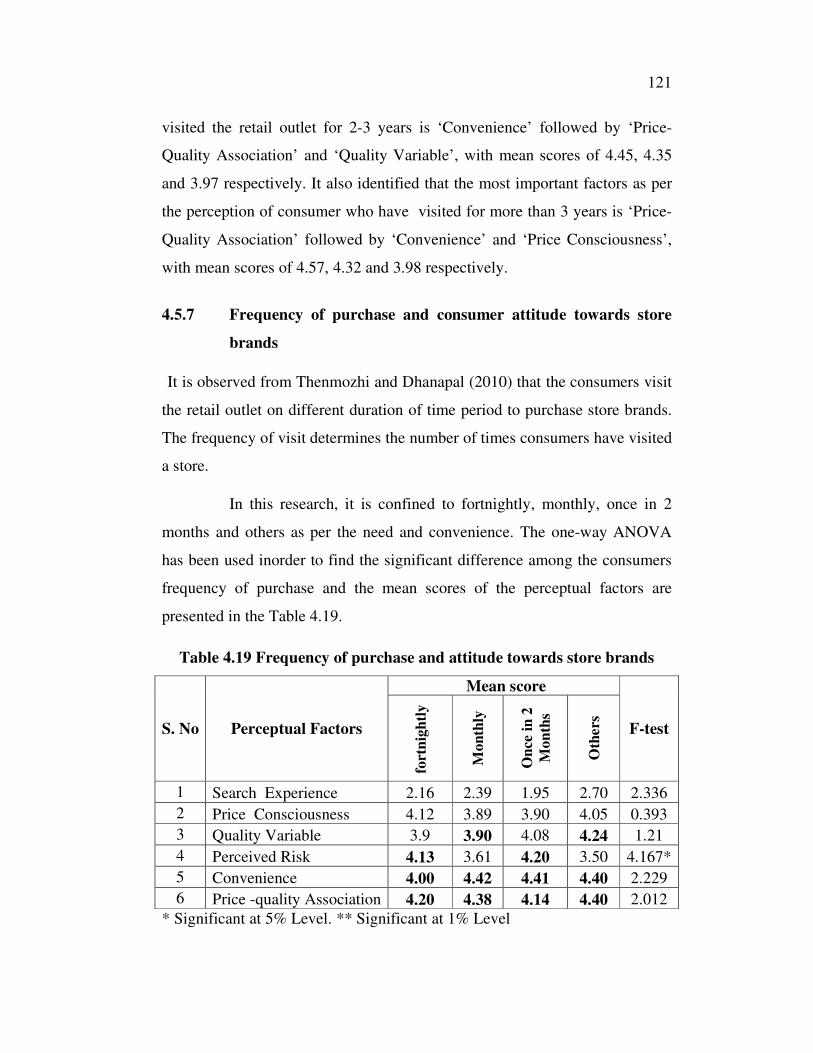
121
visited the retail outlet for 2-3 years is ‘Convenience’ followed by ‘Price-
Quality Association’ and ‘Quality Variable’, with mean scores of 4.45, 4.35
and 3.97 respectively. It also identified that the most important factors as per
the perception of consumer who have visited for more than 3 years is ‘Price-
Quality Association’ followed by ‘Convenience’ and ‘Price Consciousness’,
with mean scores of 4.57, 4.32 and 3.98 respectively.
4.5.7 Frequency of purchase and consumer attitude towards store
brands
It is observed from Thenmozhi and Dhanapal (2010) that the consumers visit
the retail outlet on different duration of time period to purchase store brands.
The frequency of visit determines the number of times consumers have visited
a store.
In this research, it is confined to fortnightly, monthly, once in 2
months and others as per the need and convenience. The one-way ANOVA
has been used inorder to find the significant difference among the consumers
frequency of purchase and the mean scores of the perceptual factors are
presented in the Table 4.19.
Table 4.19 Frequency of purchase and attitude towards store brands
Mean score
S. No Perceptual Factors
fort
nig
htl
y
Mon
thly
On
ce i
n 2
Mon
ths
Oth
ers
F-test
1 Search Experience 2.16 2.39 1.95 2.70 2.336
2 Price Consciousness 4.12 3.89 3.90 4.05 0.393
3 Quality Variable 3.9 3.90 4.08 4.24 1.21
4 Perceived Risk 4.13 3.61 4.20 3.50 4.167*
5 Convenience 4.00 4.42 4.41 4.40 2.229
6 Price -quality Association 4.20 4.38 4.14 4.40 2.012
* Significant at 5% Level. ** Significant at 1% Level
122
The above Table 4.19 shows that there is a statistical significant
difference in the attitude of consumer towards store brands on ‘Perceived
Risk’ factor regarding the frequency of visit.
From the Table 4.19 it is inferred that the most important factors as
per the perception of consumer who have visited the particular retail store
by fortnightly are ‘Price-Quality Association’ followed by ‘Perceived Risk’
and ‘Convenience’, with mean scores of 4.20 , 4.13 and 4.00 respectively.
The consumers who have visited the store monthly once have the perception
that, the most important factor is ‘Convenience’ followed by ‘Price-Quality
Association’ and ‘Quality Variable’, with mean scores of 4.42, 4.38 and 3.90
respectively. The consumers who prefer to visit the store once in two months
have the perception that the most important factor is ‘Convenience’ followed
by ‘Perceived Risk’, ‘Price-Quality Association’, with mean scores of 4.41,
4.20 and 4.14 respectively. The consumers who visit the store according to
the convenient time have the perception that the most important factors are
‘Convenience’ and ‘Price-Quality Association’ followed by ‘Quality
Variable’, with mean scores of 4.40, 4.40 and 4.24 respectively.
4.5.8 Preference of grocery item and consumer attitude towards
store brands
Nair Lakshmi (2011) Wang and Chen (2011) have developed a
study to understand fully the role of store brands in moderating the
relationship between perceptual variables and store brand attitude, with the
consideration of variety of product categories which are useful. The
importance of the determinants depends on both product category and the
store brand market share within the category. Retailers and manufacturers
need to consider the effects of store brands in relation to product category.
Brand loyalty is considered important in some categories but not so much as
price consciousness. In order to comprehend the significant difference among
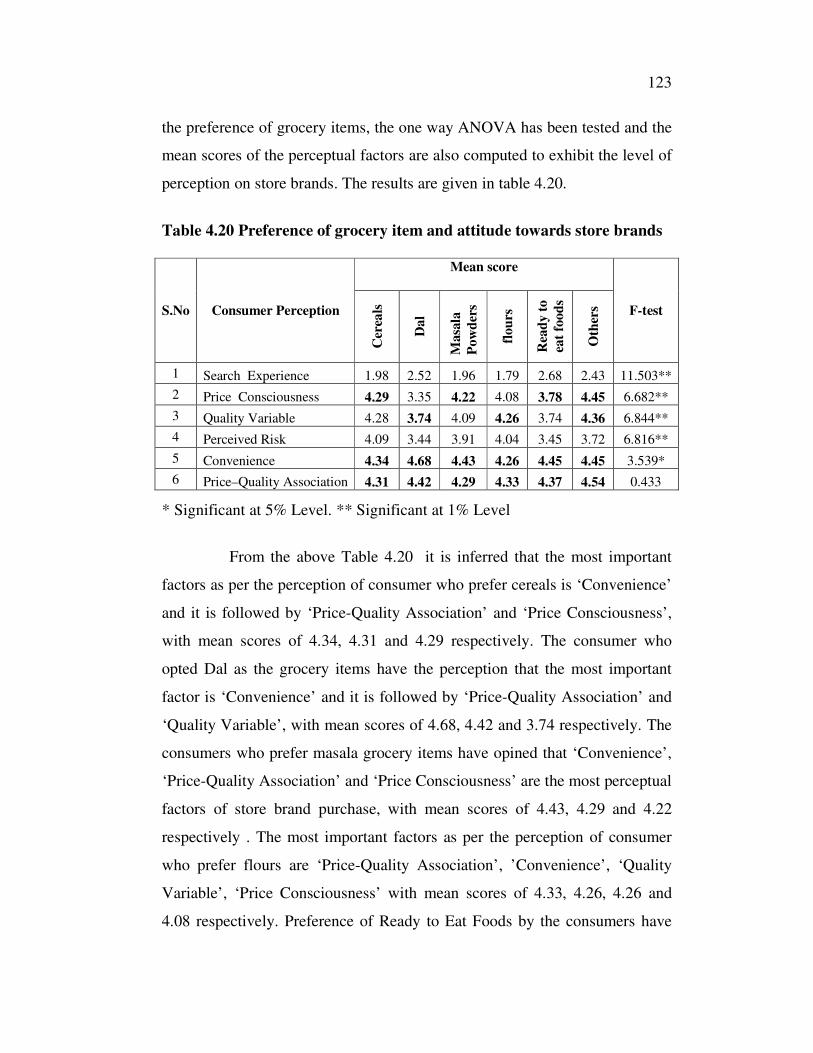
123
the preference of grocery items, the one way ANOVA has been tested and the
mean scores of the perceptual factors are also computed to exhibit the level of
perception on store brands. The results are given in table 4.20.
Table 4.20 Preference of grocery item and attitude towards store brands
Mean score
S.No Consumer Perception
Cer
eals
Dal
Masa
la
Pow
der
s
flou
rs
Rea
dy t
o
eat
food
s
Oth
ers F-test
1 Search Experience 1.98 2.52 1.96 1.79 2.68 2.43 11.503**
2 Price Consciousness 4.29 3.35 4.22 4.08 3.78 4.45 6.682**
3 Quality Variable 4.28 3.74 4.09 4.26 3.74 4.36 6.844**
4 Perceived Risk 4.09 3.44 3.91 4.04 3.45 3.72 6.816**
5 Convenience 4.34 4.68 4.43 4.26 4.45 4.45 3.539*
6 Price–Quality Association 4.31 4.42 4.29 4.33 4.37 4.54 0.433
* Significant at 5% Level. ** Significant at 1% Level
From the above Table 4.20 it is inferred that the most important
factors as per the perception of consumer who prefer cereals is ‘Convenience’
and it is followed by ‘Price-Quality Association’ and ‘Price Consciousness’,
with mean scores of 4.34, 4.31 and 4.29 respectively. The consumer who
opted Dal as the grocery items have the perception that the most important
factor is ‘Convenience’ and it is followed by ‘Price-Quality Association’ and
‘Quality Variable’, with mean scores of 4.68, 4.42 and 3.74 respectively. The
consumers who prefer masala grocery items have opined that ‘Convenience’,
‘Price-Quality Association’ and ‘Price Consciousness’ are the most perceptual
factors of store brand purchase, with mean scores of 4.43, 4.29 and 4.22
respectively . The most important factors as per the perception of consumer
who prefer flours are ‘Price-Quality Association’, ’Convenience’, ‘Quality
Variable’, ‘Price Consciousness’ with mean scores of 4.33, 4.26, 4.26 and
4.08 respectively. Preference of Ready to Eat Foods by the consumers have
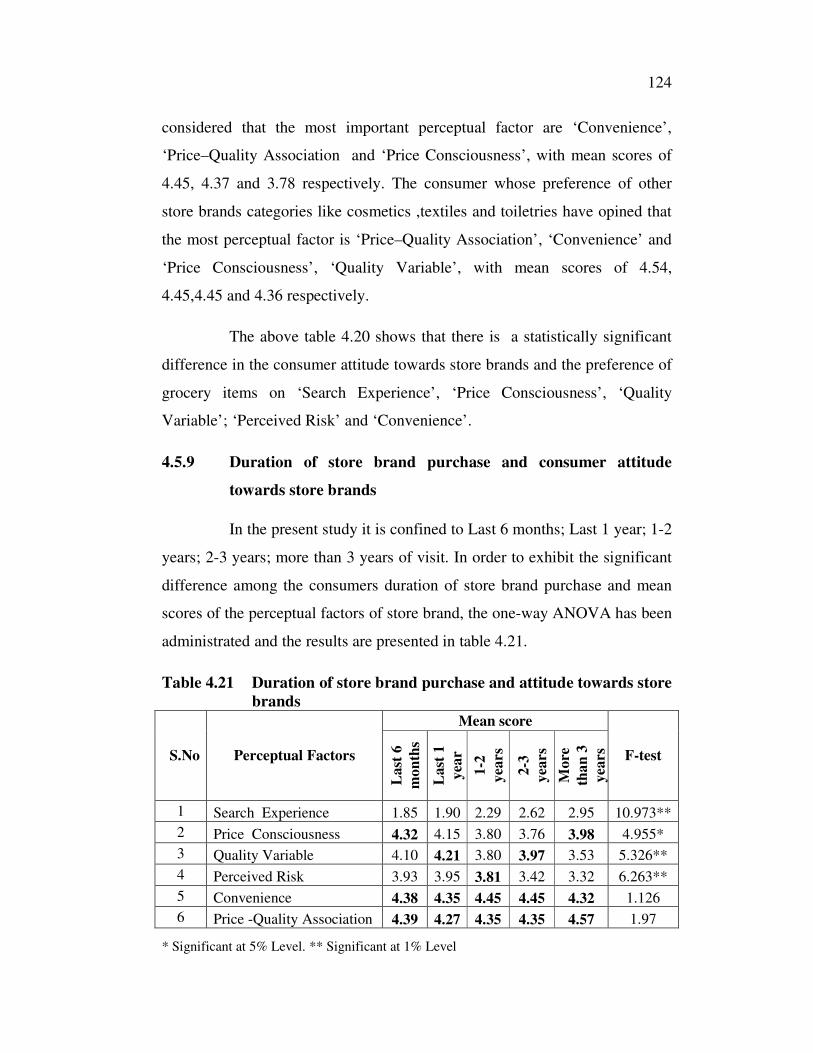
124
considered that the most important perceptual factor are ‘Convenience’,
‘Price–Quality Association and ‘Price Consciousness’, with mean scores of
4.45, 4.37 and 3.78 respectively. The consumer whose preference of other
store brands categories like cosmetics ,textiles and toiletries have opined that
the most perceptual factor is ‘Price–Quality Association’, ‘Convenience’ and
‘Price Consciousness’, ‘Quality Variable’, with mean scores of 4.54,
4.45,4.45 and 4.36 respectively.
The above table 4.20 shows that there is a statistically significant
difference in the consumer attitude towards store brands and the preference of
grocery items on ‘Search Experience’, ‘Price Consciousness’, ‘Quality
Variable’; ‘Perceived Risk’ and ‘Convenience’.
4.5.9 Duration of store brand purchase and consumer attitude
towards store brands
In the present study it is confined to Last 6 months; Last 1 year; 1-2
years; 2-3 years; more than 3 years of visit. In order to exhibit the significant
difference among the consumers duration of store brand purchase and mean
scores of the perceptual factors of store brand, the one-way ANOVA has been
administrated and the results are presented in table 4.21.
Table 4.21 Duration of store brand purchase and attitude towards store
brands
Mean score
S.No Perceptual Factors
Last
6
mon
ths
Last
1
yea
r
1-2
yea
rs
2-3
yea
rs
More
tha
n 3
yea
rs F-test
1 Search Experience 1.85 1.90 2.29 2.62 2.95 10.973**
2 Price Consciousness 4.32 4.15 3.80 3.76 3.98 4.955*
3 Quality Variable 4.10 4.21 3.80 3.97 3.53 5.326**
4 Perceived Risk 3.93 3.95 3.81 3.42 3.32 6.263**
5 Convenience 4.38 4.35 4.45 4.45 4.32 1.126
6 Price -Quality Association 4.39 4.27 4.35 4.35 4.57 1.97
* Significant at 5% Level. ** Significant at 1% Level
125
From the above Table 4.21 the researcher has inferred that the
most important factors regarding the perception of consumers who have
purchased store brands for last 6 months is ‘Price-Quality Association’
followed by ‘Convenience’ and ‘Price Consciousness’, with mean scores of
4.39, 4.38 and 4.32 respectively. The consumers who have purchased for last
one year have the perception that the most important factor is ‘Convenience’
followed by ‘Price-Quality Association’ and ‘Quality Variable’, with mean
scores of 4.35, 4.27 and 4.21 respectively. It is inferred that the most
important factors as per the perception of consumers who have purchased for
1-2 years is ‘Convenience’ followed by ‘Price-Quality Association’,
‘Perceived Risk’, with mean scores of 4.45, 4.35 and 3.81 respectively. The
above table show that the most important factors as per the perception of
consumers who have purchased store brand for 2-3 years is ‘Convenience’
followed by ‘Price-Quality Association’ and ‘Quality Variable’, with mean
scores of 4.45, 4.37 and 3.97 respectively. It is also inferred that the most
important factors as per the perception of consumers who have purchased
store brands for more than 3 year are ‘Price-Quality Association’,
‘Convenience’, Price Consciousness’, with mean scores of 4.57 ,4.32 and
3.98 respectively.
The above Table 4.21 also shows that there is a statistically
significant difference in the attitude of consumer towards store brands on
‘Search Experience’, ‘ Price Consciousness’, ‘Quality Variable’, ‘Perceived
Risk’ factors on the duration of store brand purchase.
4.5.10 Consumer attitude towards store brands in retail outlets
The one way ANOVA has been executed to analyze the significant
difference among the retail outlets and the mean scores of the perceptual
factors of store brands are also computed, in order to examine the attitude
towards store brands purchase by the consumers in four retail outlets like
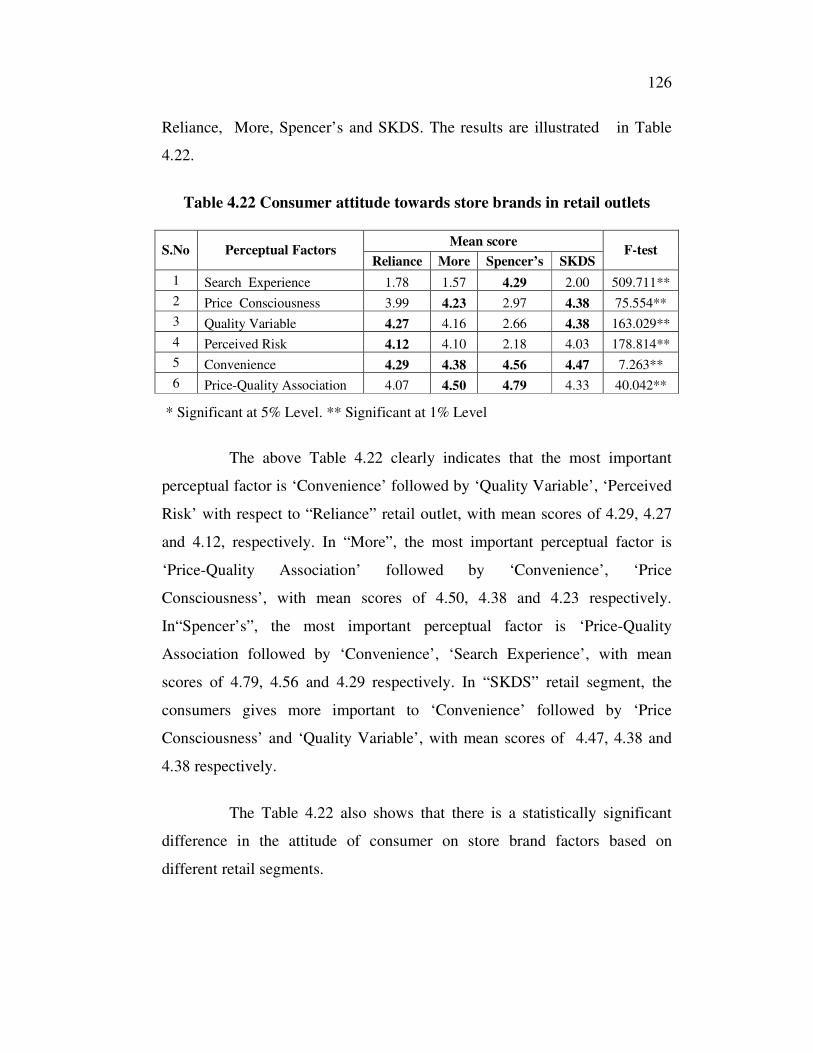
126
Reliance, More, Spencer’s and SKDS. The results are illustrated in Table
4.22.
Table 4.22 Consumer attitude towards store brands in retail outlets
Mean score S.No Perceptual Factors
Reliance More Spencer’s SKDS F-test
1 Search Experience 1.78 1.57 4.29 2.00 509.711**
2 Price Consciousness 3.99 4.23 2.97 4.38 75.554**
3 Quality Variable 4.27 4.16 2.66 4.38 163.029**
4 Perceived Risk 4.12 4.10 2.18 4.03 178.814**
5 Convenience 4.29 4.38 4.56 4.47 7.263**
6 Price-Quality Association 4.07 4.50 4.79 4.33 40.042**
* Significant at 5% Level. ** Significant at 1% Level
The above Table 4.22 clearly indicates that the most important
perceptual factor is ‘Convenience’ followed by ‘Quality Variable’, ‘Perceived
Risk’ with respect to “Reliance” retail outlet, with mean scores of 4.29, 4.27
and 4.12, respectively. In “More”, the most important perceptual factor is
‘Price-Quality Association’ followed by ‘Convenience’, ‘Price
Consciousness’, with mean scores of 4.50, 4.38 and 4.23 respectively.
In“Spencer’s”, the most important perceptual factor is ‘Price-Quality
Association followed by ‘Convenience’, ‘Search Experience’, with mean
scores of 4.79, 4.56 and 4.29 respectively. In “SKDS” retail segment, the
consumers gives more important to ‘Convenience’ followed by ‘Price
Consciousness’ and ‘Quality Variable’, with mean scores of 4.47, 4.38 and
4.38 respectively.
The Table 4.22 also shows that there is a statistically significant
difference in the attitude of consumer on store brand factors based on
different retail segments.
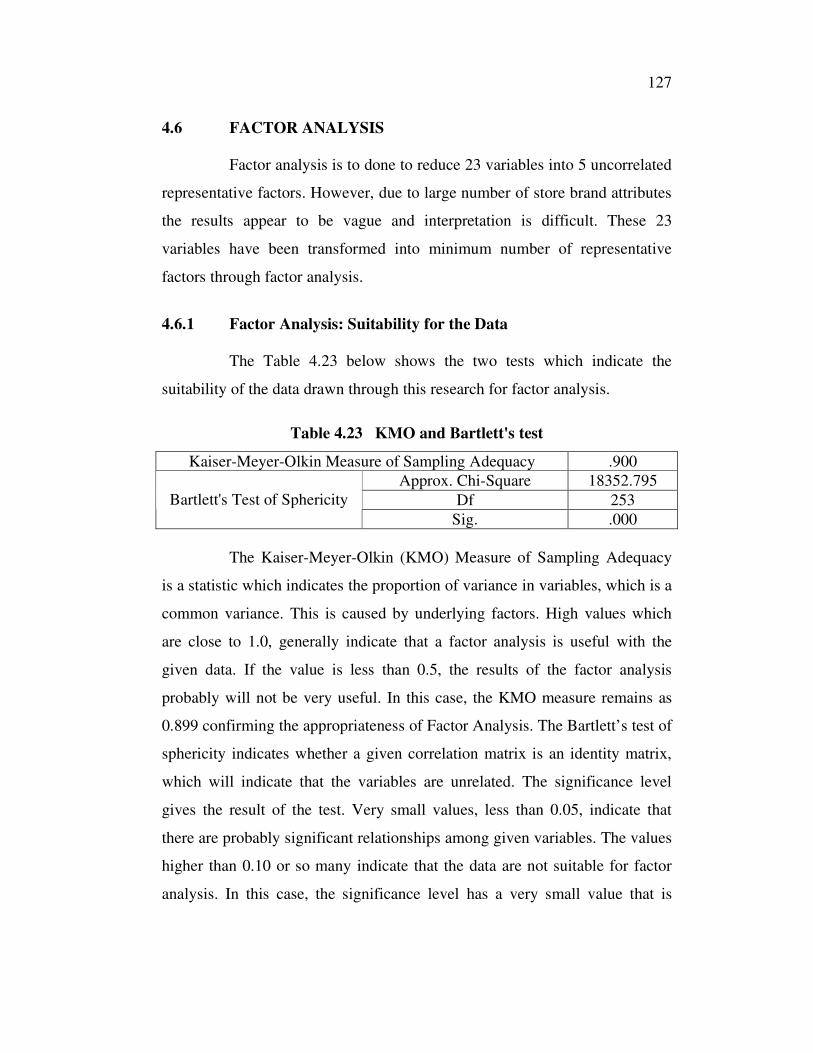
127
4.6 FACTOR ANALYSIS
Factor analysis is to done to reduce 23 variables into 5 uncorrelated
representative factors. However, due to large number of store brand attributes
the results appear to be vague and interpretation is difficult. These 23
variables have been transformed into minimum number of representative
factors through factor analysis.
4.6.1 Factor Analysis: Suitability for the Data
The Table 4.23 below shows the two tests which indicate the
suitability of the data drawn through this research for factor analysis.
Table 4.23 KMO and Bartlett's test
Kaiser-Meyer-Olkin Measure of Sampling Adequacy .900
Approx. Chi-Square 18352.795
Df 253 Bartlett's Test of Sphericity
Sig. .000
The Kaiser-Meyer-Olkin (KMO) Measure of Sampling Adequacy
is a statistic which indicates the proportion of variance in variables, which is a
common variance. This is caused by underlying factors. High values which
are close to 1.0, generally indicate that a factor analysis is useful with the
given data. If the value is less than 0.5, the results of the factor analysis
probably will not be very useful. In this case, the KMO measure remains as
0.899 confirming the appropriateness of Factor Analysis. The Bartlett’s test of
sphericity indicates whether a given correlation matrix is an identity matrix,
which will indicate that the variables are unrelated. The significance level
gives the result of the test. Very small values, less than 0.05, indicate that
there are probably significant relationships among given variables. The values
higher than 0.10 or so many indicate that the data are not suitable for factor
analysis. In this case, the significance level has a very small value that is
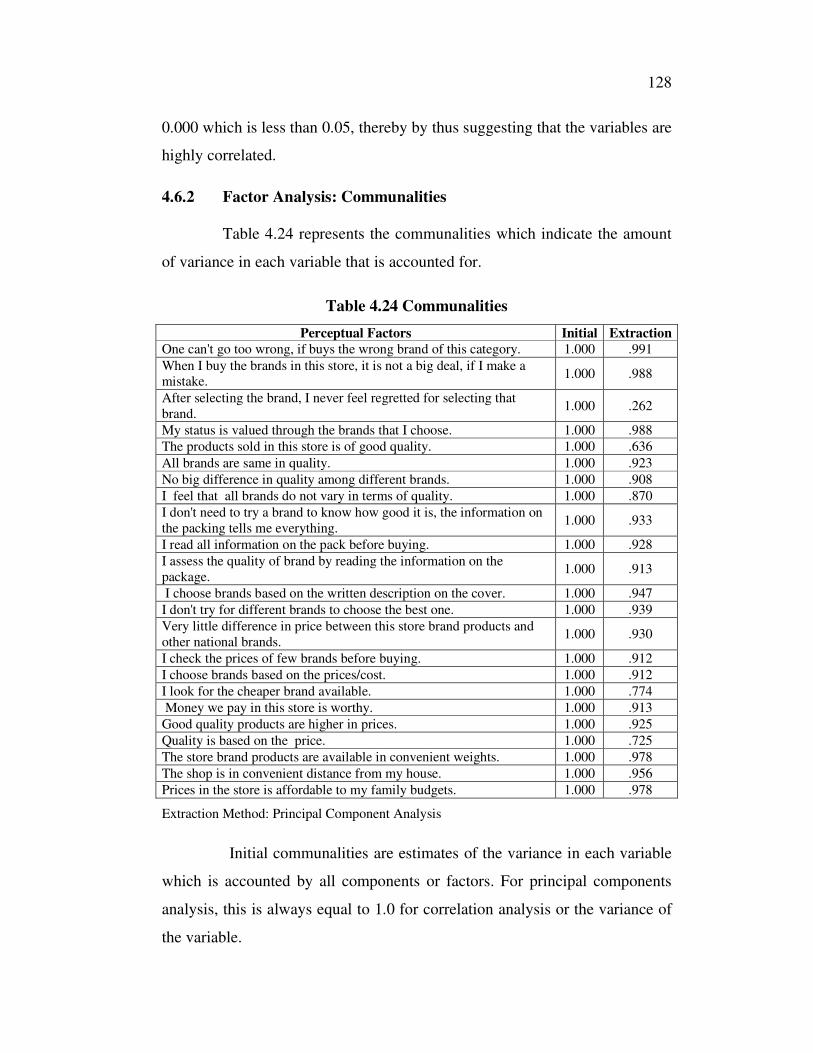
128
0.000 which is less than 0.05, thereby by thus suggesting that the variables are
highly correlated.
4.6.2 Factor Analysis: Communalities
Table 4.24 represents the communalities which indicate the amount
of variance in each variable that is accounted for.
Table 4.24 Communalities
Perceptual Factors Initial Extraction
One can't go too wrong, if buys the wrong brand of this category. 1.000 .991
When I buy the brands in this store, it is not a big deal, if I make a
mistake. 1.000 .988
After selecting the brand, I never feel regretted for selecting that
brand. 1.000 .262
My status is valued through the brands that I choose. 1.000 .988
The products sold in this store is of good quality. 1.000 .636
All brands are same in quality. 1.000 .923
No big difference in quality among different brands. 1.000 .908
I feel that all brands do not vary in terms of quality. 1.000 .870
I don't need to try a brand to know how good it is, the information on
the packing tells me everything. 1.000 .933
I read all information on the pack before buying. 1.000 .928
I assess the quality of brand by reading the information on the
package. 1.000 .913
I choose brands based on the written description on the cover. 1.000 .947
I don't try for different brands to choose the best one. 1.000 .939
Very little difference in price between this store brand products and
other national brands. 1.000 .930
I check the prices of few brands before buying. 1.000 .912
I choose brands based on the prices/cost. 1.000 .912
I look for the cheaper brand available. 1.000 .774
Money we pay in this store is worthy. 1.000 .913
Good quality products are higher in prices. 1.000 .925
Quality is based on the price. 1.000 .725
The store brand products are available in convenient weights. 1.000 .978
The shop is in convenient distance from my house. 1.000 .956
Prices in the store is affordable to my family budgets. 1.000 .978
Extraction Method: Principal Component Analysis
Initial communalities are estimates of the variance in each variable
which is accounted by all components or factors. For principal components
analysis, this is always equal to 1.0 for correlation analysis or the variance of
the variable.
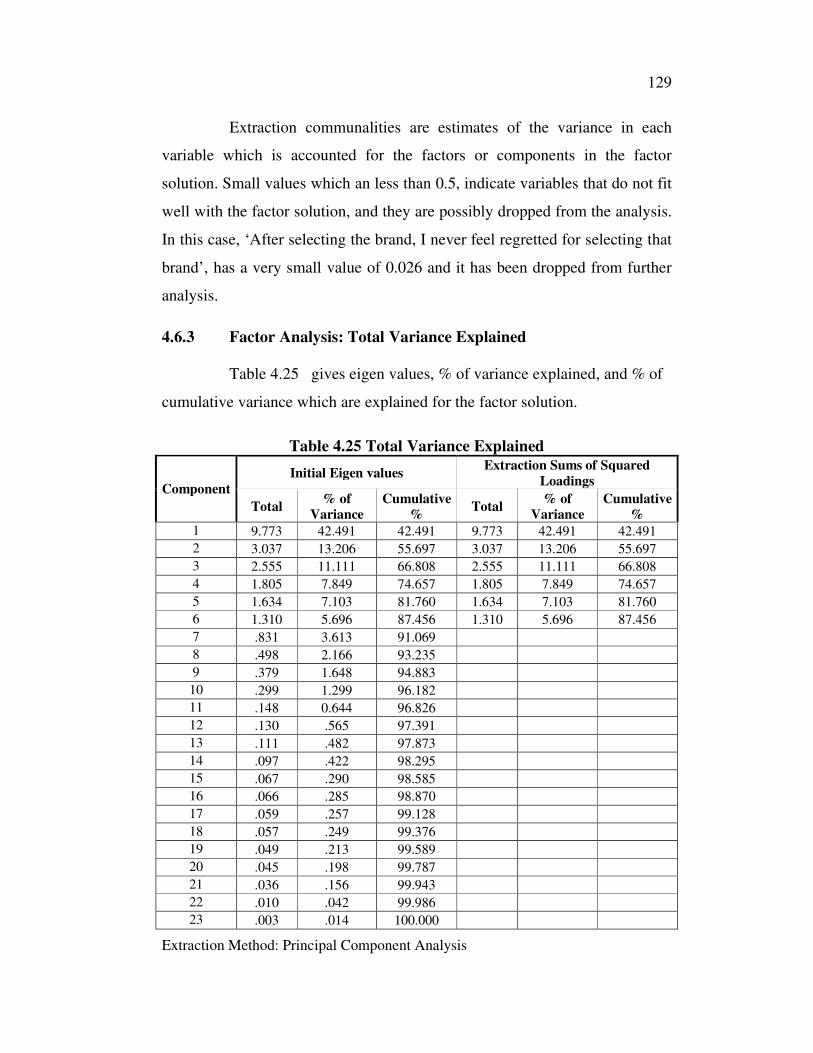
129
Extraction communalities are estimates of the variance in each
variable which is accounted for the factors or components in the factor
solution. Small values which an less than 0.5, indicate variables that do not fit
well with the factor solution, and they are possibly dropped from the analysis.
In this case, ‘After selecting the brand, I never feel regretted for selecting that
brand’, has a very small value of 0.026 and it has been dropped from further
analysis.
4.6.3 Factor Analysis: Total Variance Explained
Table 4.25 gives eigen values, % of variance explained, and % of
cumulative variance which are explained for the factor solution.
Table 4.25 Total Variance Explained
Initial Eigen values Extraction Sums of Squared
Loadings Component
Total % of
Variance
Cumulative
% Total
% of
Variance
Cumulative
%
1 9.773 42.491 42.491 9.773 42.491 42.491
2 3.037 13.206 55.697 3.037 13.206 55.697
3 2.555 11.111 66.808 2.555 11.111 66.808
4 1.805 7.849 74.657 1.805 7.849 74.657
5 1.634 7.103 81.760 1.634 7.103 81.760
6 1.310 5.696 87.456 1.310 5.696 87.456
7 .831 3.613 91.069
8 .498 2.166 93.235
9 .379 1.648 94.883
10 .299 1.299 96.182
11 .148 0.644 96.826
12 .130 .565 97.391
13 .111 .482 97.873
14 .097 .422 98.295
15 .067 .290 98.585
16 .066 .285 98.870
17 .059 .257 99.128
18 .057 .249 99.376
19 .049 .213 99.589
20 .045 .198 99.787
21 .036 .156 99.943
22 .010 .042 99.986
23 .003 .014 100.000
Extraction Method: Principal Component Analysis
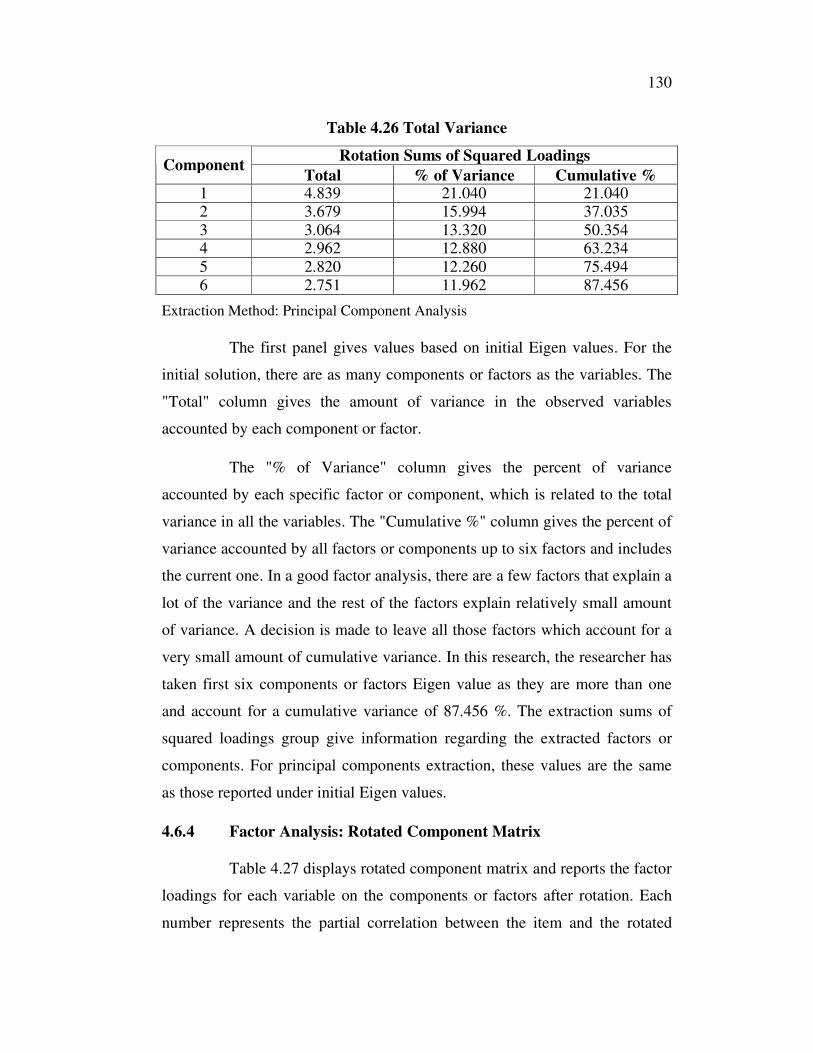
130
Table 4.26 Total Variance
Rotation Sums of Squared Loadings Component
Total % of Variance Cumulative % 1 4.839 21.040 21.040
2 3.679 15.994 37.035
3 3.064 13.320 50.354 4 2.962 12.880 63.234
5 2.820 12.260 75.494
6 2.751 11.962 87.456
Extraction Method: Principal Component Analysis
The first panel gives values based on initial Eigen values. For the
initial solution, there are as many components or factors as the variables. The
"Total" column gives the amount of variance in the observed variables
accounted by each component or factor.
The "% of Variance" column gives the percent of variance
accounted by each specific factor or component, which is related to the total
variance in all the variables. The "Cumulative %" column gives the percent of
variance accounted by all factors or components up to six factors and includes
the current one. In a good factor analysis, there are a few factors that explain a
lot of the variance and the rest of the factors explain relatively small amount
of variance. A decision is made to leave all those factors which account for a
very small amount of cumulative variance. In this research, the researcher has
taken first six components or factors Eigen value as they are more than one
and account for a cumulative variance of 87.456 %. The extraction sums of
squared loadings group give information regarding the extracted factors or
components. For principal components extraction, these values are the same
as those reported under initial Eigen values.
4.6.4 Factor Analysis: Rotated Component Matrix
Table 4.27 displays rotated component matrix and reports the factor
loadings for each variable on the components or factors after rotation. Each
number represents the partial correlation between the item and the rotated
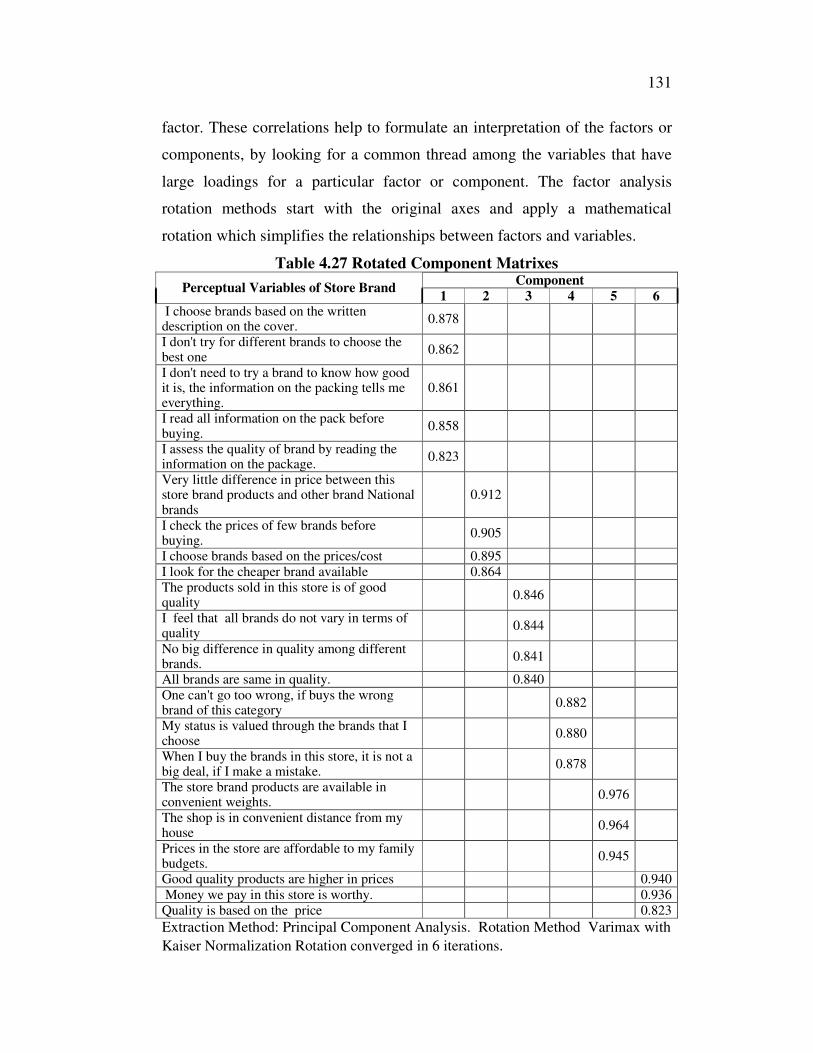
131
factor. These correlations help to formulate an interpretation of the factors or
components, by looking for a common thread among the variables that have
large loadings for a particular factor or component. The factor analysis
rotation methods start with the original axes and apply a mathematical
rotation which simplifies the relationships between factors and variables.
Table 4.27 Rotated Component Matrixes Component
Perceptual Variables of Store Brand 1 2 3 4 5 6
I choose brands based on the written description on the cover.
0.878
I don't try for different brands to choose the best one
0.862
I don't need to try a brand to know how good it is, the information on the packing tells me everything.
0.861
I read all information on the pack before buying.
0.858
I assess the quality of brand by reading the information on the package.
0.823
Very little difference in price between this store brand products and other brand National brands
0.912
I check the prices of few brands before buying.
0.905
I choose brands based on the prices/cost 0.895
I look for the cheaper brand available 0.864
The products sold in this store is of good quality
0.846
I feel that all brands do not vary in terms of quality
0.844
No big difference in quality among different brands.
0.841
All brands are same in quality. 0.840
One can't go too wrong, if buys the wrong brand of this category
0.882
My status is valued through the brands that I choose
0.880
When I buy the brands in this store, it is not a big deal, if I make a mistake.
0.878
The store brand products are available in convenient weights.
0.976
The shop is in convenient distance from my house
0.964
Prices in the store are affordable to my family budgets.
0.945
Good quality products are higher in prices 0.940
Money we pay in this store is worthy. 0.936
Quality is based on the price 0.823
Extraction Method: Principal Component Analysis. Rotation Method Varimax with
Kaiser Normalization Rotation converged in 6 iterations.
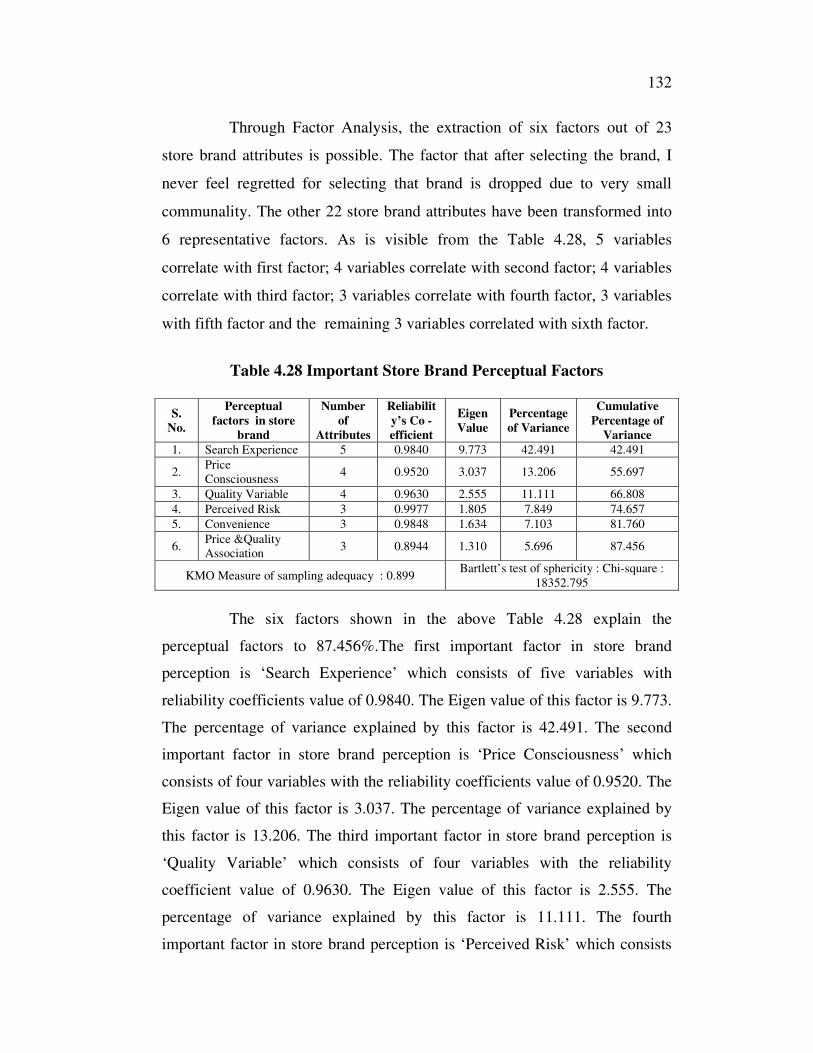
132
Through Factor Analysis, the extraction of six factors out of 23
store brand attributes is possible. The factor that after selecting the brand, I
never feel regretted for selecting that brand is dropped due to very small
communality. The other 22 store brand attributes have been transformed into
6 representative factors. As is visible from the Table 4.28, 5 variables
correlate with first factor; 4 variables correlate with second factor; 4 variables
correlate with third factor; 3 variables correlate with fourth factor, 3 variables
with fifth factor and the remaining 3 variables correlated with sixth factor.
Table 4.28 Important Store Brand Perceptual Factors
S.
No.
Perceptual
factors in store
brand
Number
of
Attributes
Reliabilit
y’s Co -
efficient
Eigen
Value
Percentage
of Variance
Cumulative
Percentage of
Variance
1. Search Experience 5 0.9840 9.773 42.491 42.491
2. Price
Consciousness 4 0.9520 3.037 13.206 55.697
3. Quality Variable 4 0.9630 2.555 11.111 66.808
4. Perceived Risk 3 0.9977 1.805 7.849 74.657
5. Convenience 3 0.9848 1.634 7.103 81.760
6. Price &Quality
Association 3 0.8944 1.310 5.696 87.456
KMO Measure of sampling adequacy : 0.899 Bartlett’s test of sphericity : Chi-square :
18352.795
The six factors shown in the above Table 4.28 explain the
perceptual factors to 87.456%.The first important factor in store brand
perception is ‘Search Experience’ which consists of five variables with
reliability coefficients value of 0.9840. The Eigen value of this factor is 9.773.
The percentage of variance explained by this factor is 42.491. The second
important factor in store brand perception is ‘Price Consciousness’ which
consists of four variables with the reliability coefficients value of 0.9520. The
Eigen value of this factor is 3.037. The percentage of variance explained by
this factor is 13.206. The third important factor in store brand perception is
‘Quality Variable’ which consists of four variables with the reliability
coefficient value of 0.9630. The Eigen value of this factor is 2.555. The
percentage of variance explained by this factor is 11.111. The fourth
important factor in store brand perception is ‘Perceived Risk’ which consists
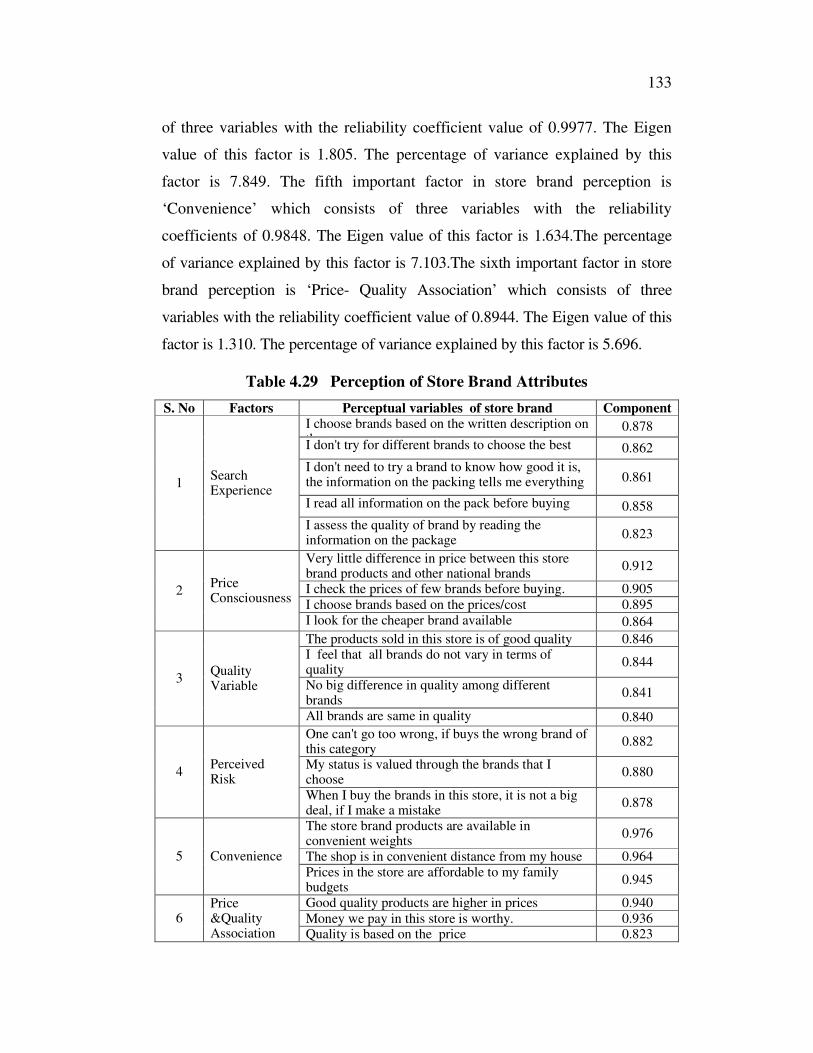
133
of three variables with the reliability coefficient value of 0.9977. The Eigen
value of this factor is 1.805. The percentage of variance explained by this
factor is 7.849. The fifth important factor in store brand perception is
‘Convenience’ which consists of three variables with the reliability
coefficients of 0.9848. The Eigen value of this factor is 1.634.The percentage
of variance explained by this factor is 7.103.The sixth important factor in store
brand perception is ‘Price- Quality Association’ which consists of three
variables with the reliability coefficient value of 0.8944. The Eigen value of this
factor is 1.310. The percentage of variance explained by this factor is 5.696.
Table 4.29 Perception of Store Brand Attributes
S. No Factors Perceptual variables of store brand Component I choose brands based on the written description on the cover.
0.878
I don't try for different brands to choose the best one
0.862
I don't need to try a brand to know how good it is, the information on the packing tells me everything
0.861
I read all information on the pack before buying
0.858
1 Search Experience
I assess the quality of brand by reading the information on the package
0.823
Very little difference in price between this store brand products and other national brands
0.912
I check the prices of few brands before buying. 0.905
I choose brands based on the prices/cost 0.895 2
Price Consciousness
I look for the cheaper brand available 0.864
The products sold in this store is of good quality 0.846 I feel that all brands do not vary in terms of quality
0.844
No big difference in quality among different brands
0.841 3
Quality Variable
All brands are same in quality 0.840
One can't go too wrong, if buys the wrong brand of this category
0.882
My status is valued through the brands that I choose
0.880 4 Perceived Risk
When I buy the brands in this store, it is not a big deal, if I make a mistake
0.878
The store brand products are available in convenient weights
0.976
The shop is in convenient distance from my house 0.964 5 Convenience
Prices in the store are affordable to my family budgets
0.945
Good quality products are higher in prices 0.940
Money we pay in this store is worthy. 0.936 6 Price &Quality Association Quality is based on the price 0.823

134
The primary objective of this research is to find out key perceptual
factors which have significant impact on the store brand perception. To
achieve this objective, an analysis is done based on the responses of 488
customers towards 23 perceptual factors and have extracted 6 representative
factors through factor analysis. The six factors extracted through factor
analysis are ‘Search Experience’, ‘Price Consciousness’, ‘Quality Variable’,
‘Perceived Risk’, ‘Convenience’ and ‘Price -Quality Association. Among 23
store brand perceptual factors, the attribute “After selecting the brand, I never
feel regretted for selecting that brand”, has very less communality indicating
that this factor is not so important to consumers when it comes to buying store
brand items. It is dropped from the further analysis on this accord. It is
identified that ‘Search Experience’ is the most important factor determining
overall perception which is evident from the retail outlets like Reliance, More,
Spencer’s and Shri SKDS. The perceived high factors by the customers for
‘Search Experience’ includes: “Written Description on the cover”; “Don't try
for different brands to choose the best”; “Don't need to try a brand to know
how good”; “Read all information on the pack before buying” and “Assess the
quality of brand by reading the information on the package”. These act as key
dimensions of store brand perception and most of them are represented by
the first factor.
The second-most important factor ‘Price Consciousness’ with the
variables like, “Very little difference in price between store brand and other
national brands”; “Check the prices of few brands before buying”; “Choose
brands based on the prices/cost ” and “Look for cheaper brand available”, has
been found to have a sizeable impact on store brand perception. Previous
research findings by Batra and Sinha’s (2000) have identified that the low
price of store brands is one of the major factors that encourage consumers to
purchase store brand products. The consumers ‘Price Consciousness’ will
have a positive impact on consumers’ attitudes towards store brand purchase.
135
Batra and Sinha show that ‘Price Consciousness’ is the strongest of all
constructs that positively influence store brand purchase across several
product categories previously studied. Similarly, the study by Raju, et
al.(1995) also indicate that store brand products perform well in the product
classes where consumers are more sensitive to price. Confirming the same,
the findings also identify that all these dimensions are important perceptual
factors through ‘Price Consciousness’ the second representative factor.
Third important factor ‘Quality Variable’ with the variables like:
“Products sold in this store is of good quality”; “All brands do not vary in
terms of quality”; “No big difference in quality among different brands” and
“All brands are same in quality” has been found to have a moderate impact on
perception about store brands. Store brand purchase is higher in categories
where consumer perception of ‘Quality Variability’ between national brands
and store brands is lower. This conclusion is well supported by the research
findings of Narasimhan and Wilcox (1998) .They have noted that the degree
of perceived quality variation across brands in a category has a positive
influence on the perception of purchase risk. Similar results have been found
in some prior studies. For example, Hoch and Banerji (1993) point out that
product quality is a key factor in explaining market shares of store brands.
This work suggests that store brand products enjoy more success in categories
where the quality level of store brands is closer to that of national brands.
Dick et al. (1995) also support the notion that consumers’ store brand
proneness is higher when consumers are aware of a lower quality difference
between store brands and national brands.
The fourth factor ‘Perceived Risk’ with the variables like “When
consumers buys the wrong brand of this category”; ‘The status is valued
through the brands that consumer choose”; “Brands in this store, It is not a big
deal, If make a mistake” has been found to have somewhat less impact on
136
customers’ perceptions regarding store brands. Batra and Sinha’s (2000) work
has found an indirect effect of quality variability on store brands proneness.
The work indicates that the influence of quality variation on store brand
buying is mediated by the consequences of making a purchase mistake. The
fifth factor ‘Convenience’ with the variables: “Store Brand Products are
available in convenient weights”; “The shop is in convenient distance from
house” and “Prices in the store are affordable to my family budgets” has been
found to be one of the major factors at least for the customers who buy store
brand items.
The sixth factor ‘Price and Quality Association’ with the variables
like : “Good quality products are higher in prices”; “Money we pay in this
store is worthy” and “Quality is based on the price” has been found to have a
somewhat less impact on customers’ perceptions regarding store brands. For
consumers who draw assumptions directly from price to evaluate product
quality, store brand products are in less favorable position where the lower
price is associated with inferior quality. Similar findings are seen in other
studies which have examined the influence of ‘Price-Quality Association’ on
store brand proneness in general product categories. For example, Ailawadi et
al (2001), Burton et al (1998) and Garretson et al (2002) have shown
consistent evidence to support the notion that the weaker the ‘Price-Quality
Association’, the more favorable the attitude towards store brands, and
consequently, higher the purchase of store brands. The study indicates that
perceptual factors influence consumers’ perception differently across different
product categories in retail outlets. Factors reducing consumers perception of
risk will have positive relationship with store brand purchase. This notion is
supported by the findings by Garretson et al (2002) with regard to quality
variability. The quality variations between store brands and national brands
have a higher potential to increase consumer uncertainty, and as a result lead
consumers to perceive that there is a greater risk attached to buy store brand
137
products. Similarly, factors increasing favorable attitudes towards store
brands will have positive effects on the purchase of store brands. This notion
is evident in the variables of ‘Search Experience’ ‘Price Consciousness’,
‘Price-Quality Association. The Price-conscious consumers are likely to have
a more positive attitude towards buying store brands. In contrast, consumers
who have strong ‘Price-Quality Association’ and ‘Convenience’
considerations are likely to offer the desire to buy store brand products.
4.7 MULTIPLE REGRESSION ANALYSIS
The Multiple Regression Analysis is the main technique used to
examine the relationships among the six perceptual constructs of store brands
with store image, consumer satisfaction and store loyalty. The multiple
regressions is a dependency technique which is most widely used to analyze
the relationships between a single dependent variable and a set of independent
variables as stated by Hair et al (1998). This method succeeds in measuring
the joint influence of the explanatory variables on the dependent variables.
For each of these explanatory variables, the effect on the outcome variable is
accessed as stated by Harraway (1995). It is a statistical tool that is usually
used when both the dependent and independent variables are metric, since the
six perceptual constructs of store brand and store loyalty as well as store
image and consumer satisfaction is measured on metric scales. It is
appropriate to use Multiple Regression Analysis to examine the relationships.
4.7.1 Impact analysis of store brand factors on consumer satisfaction
The overall consumer satisfaction towards the store brand factors of
retail outlets are influenced by a number of factors. It is evident from some
researches done by Cronin and Taylor (1994), Bloemer and de Ruyter (1998),
Macintosh and Lockshin (1997), Dhar et al (2001) which imply that the
consumers’ satisfaction with a store is an indisputable indicator of customers’
loyalty to the store, and it is a known fact that the products are elements of the
138
satisfaction. Now-a days, store brands have achieved an adequate standard of
quality. These comments help to consider that store brands provide a sense of
satisfaction, loyalty and repurchase behavior that are likely to boost up store
loyalty.
It is understood that store brand perception is an important factor
that determines the satisfaction of individual customer. It works as an
antecedent of consumer satisfaction and it is necessary to understand the
impact of various dimensions of store brand perception on consumer
satisfaction by retailers. In order to identify the most crucial store brand
perception factor, which influence more on overall satisfaction, the multiple
regression analysis has been administered. The overall satisfaction with five
point likert scale has 1 as highly dissatisfied and 5 as highly satisfied. The
next subsection analyses the relationships between the six perceptual
constructs of store brand purchase and consumer satisfaction. According to
Burns and Bush (1999) and Churchill and Iacobucci (2002), the equation in
multiple regression analysis has the following form:
The fitted model is: Y = a + b1x1 + b2x2 + b3x3 + b4x4 + b5x5 +b6x 6+ e
Y=3.028 + 0.156 (SE) + 0.175 (PC) + 0.066 (QV )+ 0.040 (PR) + 0.116
(CON) + 0.051(PQA)
whereas
Y = Overall Satisfaction of customer towards the Stores
x1 = Perception Score on Overall Search Experience;
x2 = Perception Score on Price consciousness;
x3 = Perception Score on Quality Variation;
x4 = Perception Score on Perceived Risk;
x5 = Perception Score on Convenience;
x6 = Perception Score on Price -Quality Association
b1, b2, . . .b6 = Regression co-efficient of independent variables
e = error term, a = Intercept
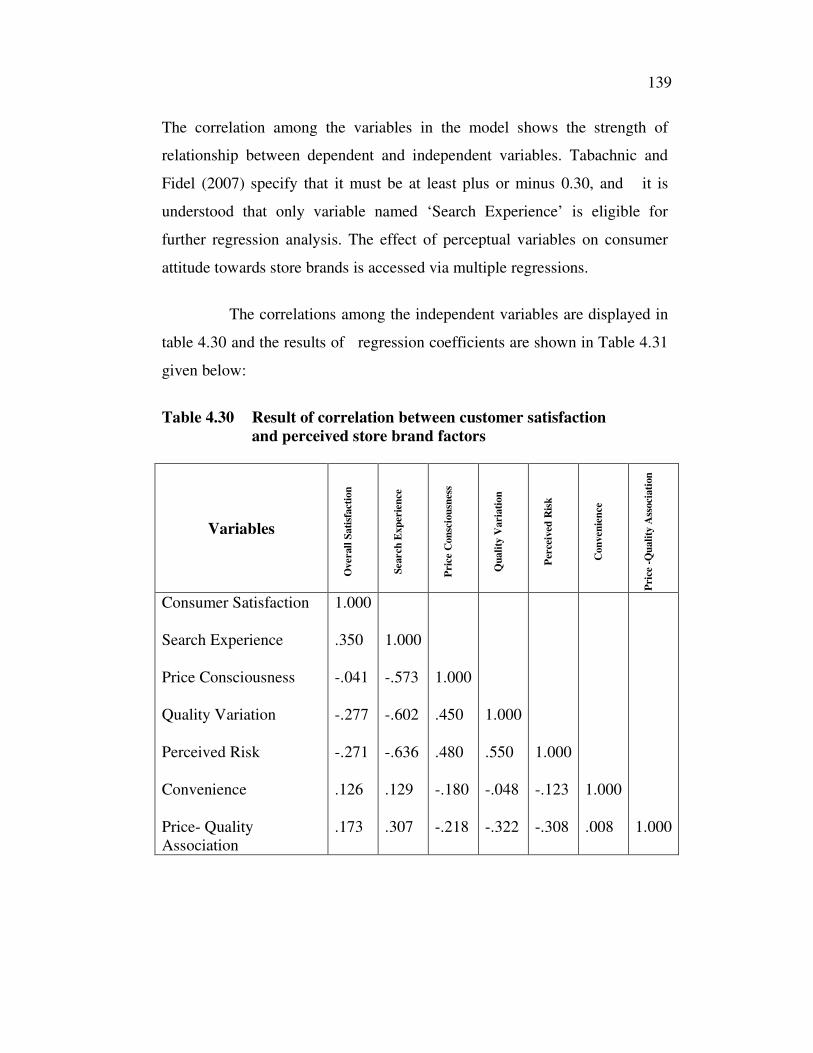
139
The correlation among the variables in the model shows the strength of
relationship between dependent and independent variables. Tabachnic and
Fidel (2007) specify that it must be at least plus or minus 0.30, and it is
understood that only variable named ‘Search Experience’ is eligible for
further regression analysis. The effect of perceptual variables on consumer
attitude towards store brands is accessed via multiple regressions.
The correlations among the independent variables are displayed in
table 4.30 and the results of regression coefficients are shown in Table 4.31
given below:
Table 4.30 Result of correlation between customer satisfaction
and perceived store brand factors
Variables
Overall
Sati
sfacti
on
Search
Exp
erie
nce
Pric
e C
on
scio
usn
ess
Qu
ali
ty V
aria
tion
Per
ceiv
ed
Ris
k
Con
ven
ien
ce
Pri
ce -
Qu
ali
ty A
ssocia
tion
Consumer Satisfaction
Search Experience
Price Consciousness
Quality Variation
Perceived Risk
Convenience
Price- Quality
Association
1.000
.350
-.041
-.277
-.271
.126
.173
1.000
-.573
-.602
-.636
.129
.307
1.000
.450
.480
-.180
-.218
1.000
.550
-.048
-.322
1.000
-.123
-.308
1.000
.008
1.000
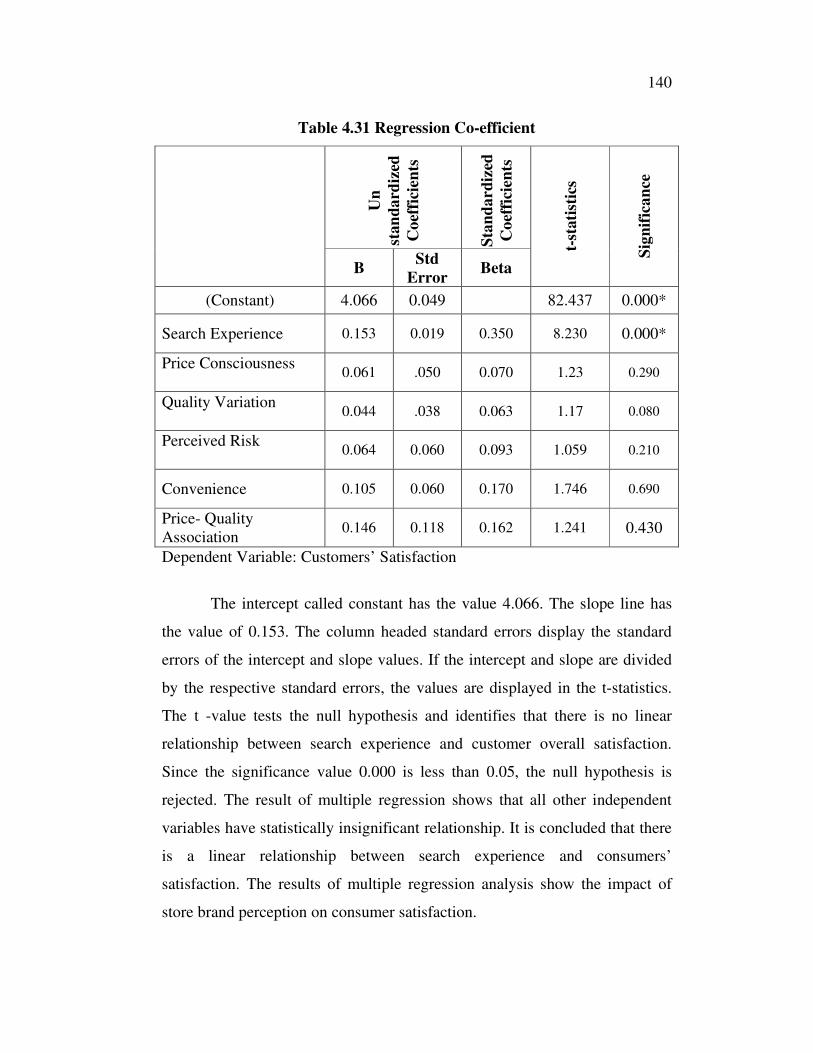
140
Table 4.31 Regression Co-efficient
Un
stan
da
rdiz
ed
Co
effi
cien
ts
Sta
nd
ard
ized
Co
effi
cien
ts
B Std
Error Beta
t-st
ati
stic
s
Sig
nif
ica
nce
(Constant) 4.066 0.049 82.437 0.000*
Search Experience 0.153 0.019 0.350 8.230 0.000*
Price Consciousness
0.061 .050 0.070 1.23 0.290
Quality Variation
0.044 .038 0.063 1.17 0.080
Perceived Risk
0.064 0.060 0.093 1.059 0.210
Convenience 0.105 0.060 0.170 1.746 0.690
Price- Quality
Association 0.146 0.118 0.162 1.241 0.430
Dependent Variable: Customers’ Satisfaction
The intercept called constant has the value 4.066. The slope line has
the value of 0.153. The column headed standard errors display the standard
errors of the intercept and slope values. If the intercept and slope are divided
by the respective standard errors, the values are displayed in the t-statistics.
The t -value tests the null hypothesis and identifies that there is no linear
relationship between search experience and customer overall satisfaction.
Since the significance value 0.000 is less than 0.05, the null hypothesis is
rejected. The result of multiple regression shows that all other independent
variables have statistically insignificant relationship. It is concluded that there
is a linear relationship between search experience and consumers’
satisfaction. The results of multiple regression analysis show the impact of
store brand perception on consumer satisfaction.
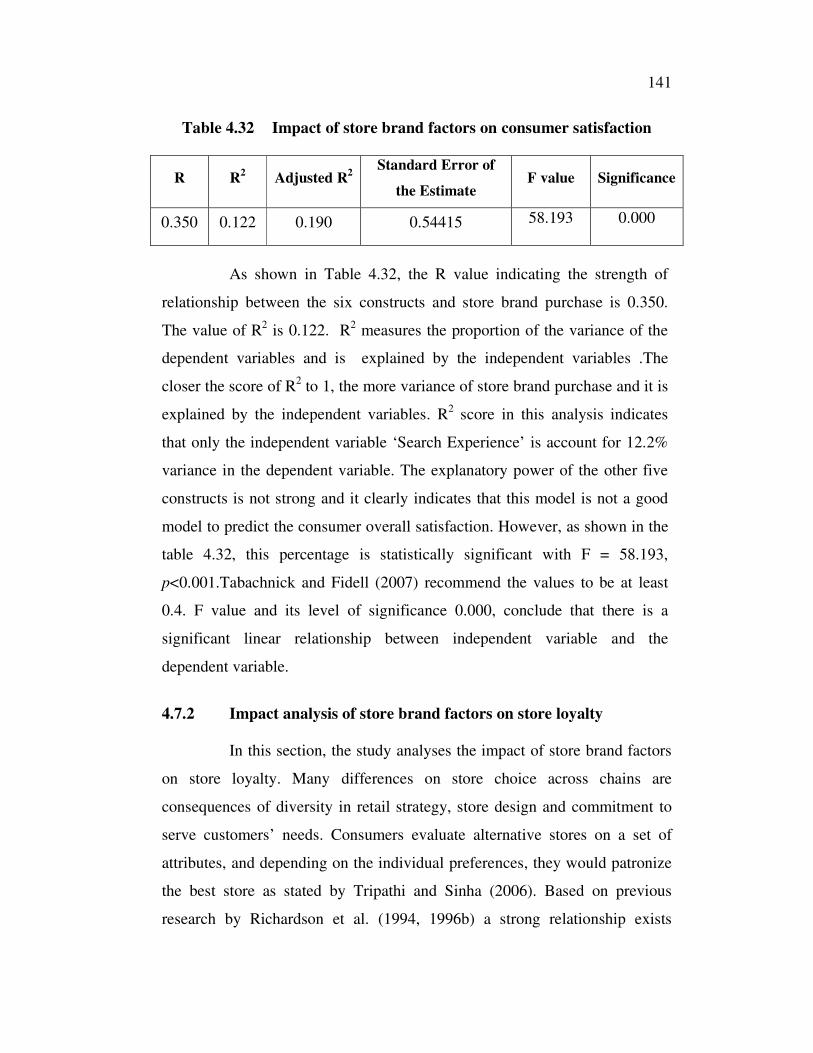
141
Table 4.32 Impact of store brand factors on consumer satisfaction
R R2 Adjusted R
2
Standard Error of
the Estimate F value Significance
0.350 0.122 0.190 0.54415 58.193 0.000
As shown in Table 4.32, the R value indicating the strength of
relationship between the six constructs and store brand purchase is 0.350.
The value of R2 is 0.122. R
2 measures the proportion of the variance of the
dependent variables and is explained by the independent variables .The
closer the score of R2 to 1, the more variance of store brand purchase and it is
explained by the independent variables. R2 score in this analysis indicates
that only the independent variable ‘Search Experience’ is account for 12.2%
variance in the dependent variable. The explanatory power of the other five
constructs is not strong and it clearly indicates that this model is not a good
model to predict the consumer overall satisfaction. However, as shown in the
table 4.32, this percentage is statistically significant with F = 58.193,
p<0.001.Tabachnick and Fidell (2007) recommend the values to be at least
0.4. F value and its level of significance 0.000, conclude that there is a
significant linear relationship between independent variable and the
dependent variable.
4.7.2 Impact analysis of store brand factors on store loyalty
In this section, the study analyses the impact of store brand factors
on store loyalty. Many differences on store choice across chains are
consequences of diversity in retail strategy, store design and commitment to
serve customers’ needs. Consumers evaluate alternative stores on a set of
attributes, and depending on the individual preferences, they would patronize
the best store as stated by Tripathi and Sinha (2006). Based on previous
research by Richardson et al. (1994, 1996b) a strong relationship exists
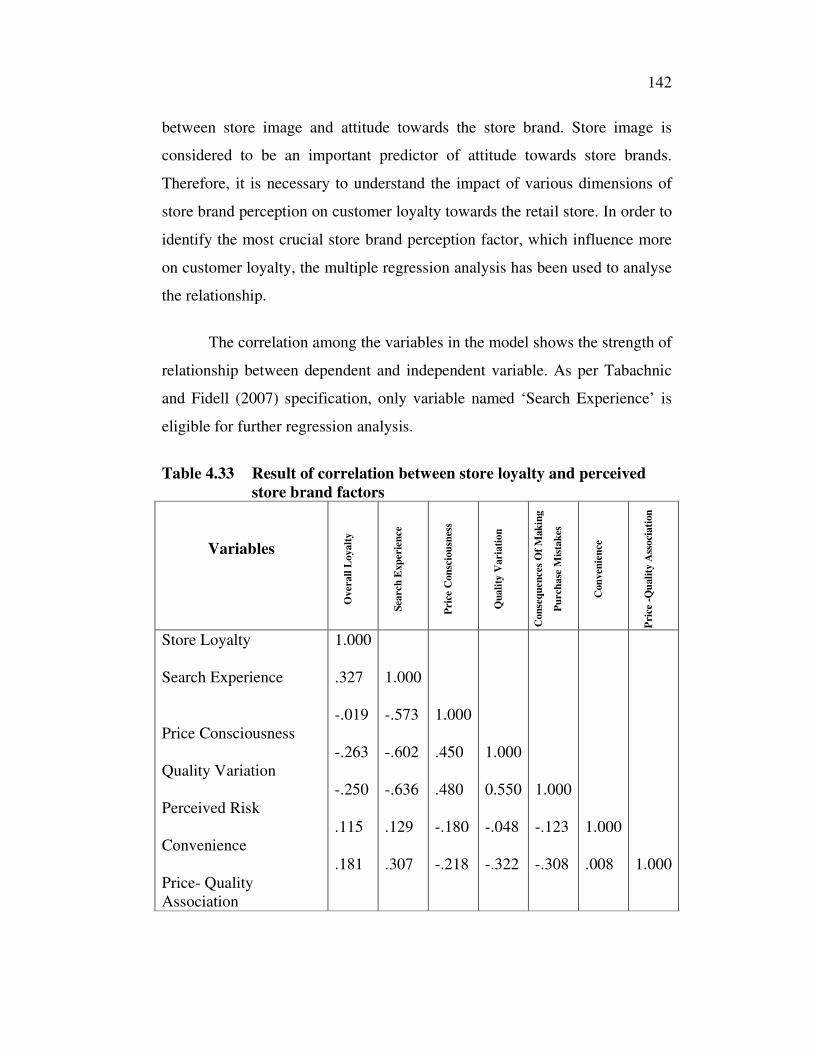
142
between store image and attitude towards the store brand. Store image is
considered to be an important predictor of attitude towards store brands.
Therefore, it is necessary to understand the impact of various dimensions of
store brand perception on customer loyalty towards the retail store. In order to
identify the most crucial store brand perception factor, which influence more
on customer loyalty, the multiple regression analysis has been used to analyse
the relationship.
The correlation among the variables in the model shows the strength of
relationship between dependent and independent variable. As per Tabachnic
and Fidell (2007) specification, only variable named ‘Search Experience’ is
eligible for further regression analysis.
Table 4.33 Result of correlation between store loyalty and perceived
store brand factors
Variables
Overall
Loyalt
y
Search
Exp
erie
nce
Pric
e C
on
scio
usn
ess
Qu
ali
ty V
aria
tion
Con
seq
uen
ces
Of
Mak
ing
Pu
rch
ase
Mis
tak
es
Con
ven
ien
ce
Pri
ce -
Qu
ali
ty A
ssocia
tion
Store Loyalty
Search Experience
Price Consciousness
Quality Variation
Perceived Risk
Convenience
Price- Quality
Association
1.000
.327
-.019
-.263
-.250
.115
.181
1.000
-.573
-.602
-.636
.129
.307
1.000
.450
.480
-.180
-.218
1.000
0.550
-.048
-.322
1.000
-.123
-.308
1.000
.008
1.000
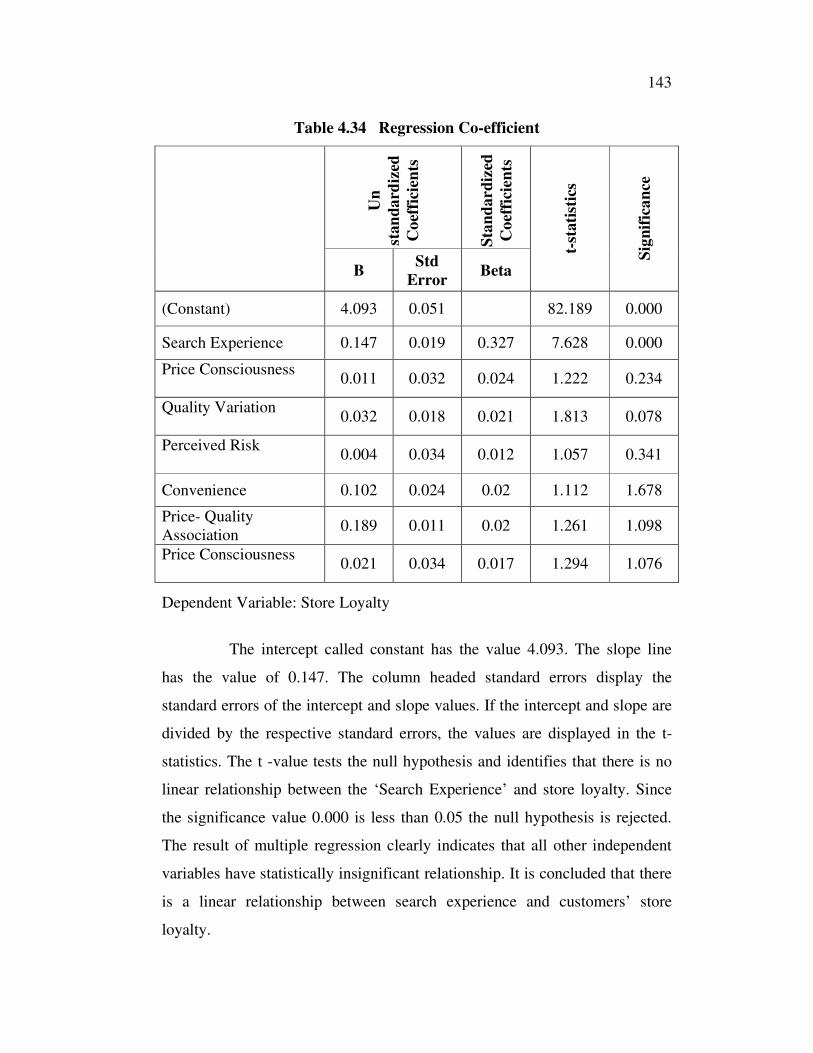
143
Table 4.34 Regression Co-efficient
Un
stan
da
rdiz
ed
Co
effi
cien
ts
Sta
nd
ard
ized
Co
effi
cien
ts
B Std
Error Beta
t-st
ati
stic
s
Sig
nif
ica
nce
(Constant) 4.093 0.051 82.189 0.000
Search Experience 0.147 0.019 0.327 7.628 0.000
Price Consciousness
0.011 0.032 0.024 1.222 0.234
Quality Variation
0.032 0.018 0.021 1.813 0.078
Perceived Risk
0.004 0.034 0.012 1.057 0.341
Convenience 0.102 0.024 0.02 1.112 1.678
Price- Quality
Association 0.189 0.011 0.02 1.261 1.098
Price Consciousness
0.021 0.034 0.017 1.294 1.076
Dependent Variable: Store Loyalty
The intercept called constant has the value 4.093. The slope line
has the value of 0.147. The column headed standard errors display the
standard errors of the intercept and slope values. If the intercept and slope are
divided by the respective standard errors, the values are displayed in the t-
statistics. The t -value tests the null hypothesis and identifies that there is no
linear relationship between the ‘Search Experience’ and store loyalty. Since
the significance value 0.000 is less than 0.05 the null hypothesis is rejected.
The result of multiple regression clearly indicates that all other independent
variables have statistically insignificant relationship. It is concluded that there
is a linear relationship between search experience and customers’ store
loyalty.
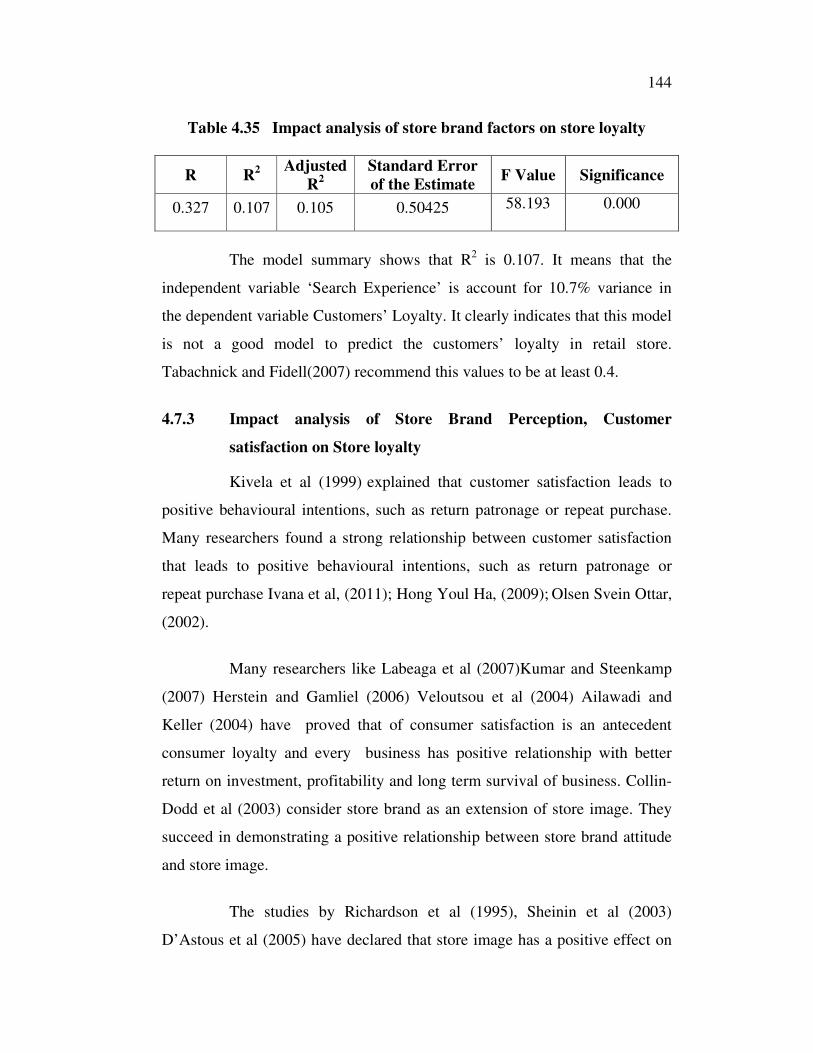
144
Table 4.35 Impact analysis of store brand factors on store loyalty
R R2
Adjusted
R2
Standard Error
of the Estimate F Value Significance
0.327 0.107 0.105 0.50425 58.193 0.000
The model summary shows that R2 is 0.107. It means that the
independent variable ‘Search Experience’ is account for 10.7% variance in
the dependent variable Customers’ Loyalty. It clearly indicates that this model
is not a good model to predict the customers’ loyalty in retail store.
Tabachnick and Fidell(2007) recommend this values to be at least 0.4.
4.7.3 Impact analysis of Store Brand Perception, Customer
satisfaction on Store loyalty
Kivela et al (1999) explained that customer satisfaction leads to
positive behavioural intentions, such as return patronage or repeat purchase.
Many researchers found a strong relationship between customer satisfaction
that leads to positive behavioural intentions, such as return patronage or
repeat purchase Ivana et al, (2011); Hong Youl Ha, (2009); Olsen Svein Ottar,
(2002).
Many researchers like Labeaga et al (2007)Kumar and Steenkamp
(2007) Herstein and Gamliel (2006) Veloutsou et al (2004) Ailawadi and
Keller (2004) have proved that of consumer satisfaction is an antecedent
consumer loyalty and every business has positive relationship with better
return on investment, profitability and long term survival of business. Collin-
Dodd et al (2003) consider store brand as an extension of store image. They
succeed in demonstrating a positive relationship between store brand attitude
and store image.
The studies by Richardson et al (1995), Sheinin et al (2003)
D’Astous et al (2005) have declared that store image has a positive effect on
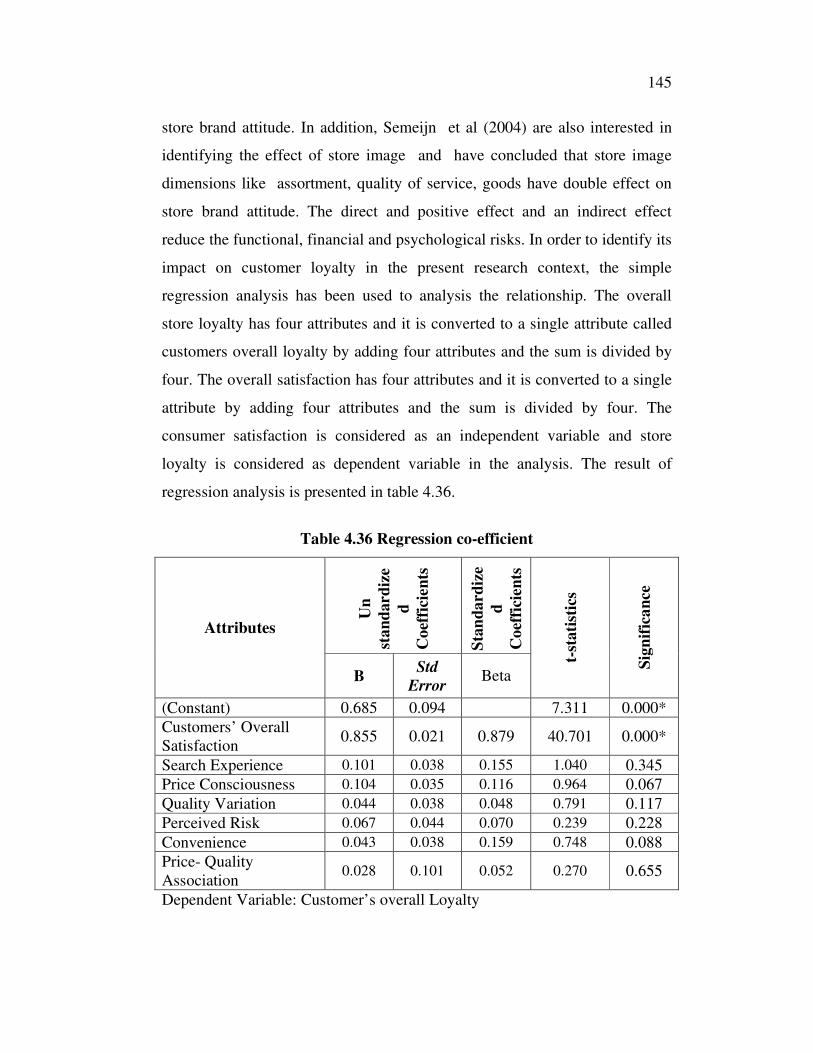
145
store brand attitude. In addition, Semeijn et al (2004) are also interested in
identifying the effect of store image and have concluded that store image
dimensions like assortment, quality of service, goods have double effect on
store brand attitude. The direct and positive effect and an indirect effect
reduce the functional, financial and psychological risks. In order to identify its
impact on customer loyalty in the present research context, the simple
regression analysis has been used to analysis the relationship. The overall
store loyalty has four attributes and it is converted to a single attribute called
customers overall loyalty by adding four attributes and the sum is divided by
four. The overall satisfaction has four attributes and it is converted to a single
attribute by adding four attributes and the sum is divided by four. The
consumer satisfaction is considered as an independent variable and store
loyalty is considered as dependent variable in the analysis. The result of
regression analysis is presented in table 4.36.
Table 4.36 Regression co-efficient
Un
sta
nd
ard
ize
d
Co
effi
cien
ts
Sta
nd
ard
ize
d
Co
effi
cien
ts
Attributes
B Std
Error Beta
t-st
ati
stic
s
Sig
nif
ica
nce
(Constant) 0.685 0.094 7.311 0.000*
Customers’ Overall
Satisfaction 0.855 0.021 0.879 40.701 0.000*
Search Experience 0.101 0.038 0.155 1.040 0.345
Price Consciousness 0.104 0.035 0.116 0.964 0.067
Quality Variation 0.044 0.038 0.048 0.791 0.117
Perceived Risk 0.067 0.044 0.070 0.239 0.228
Convenience 0.043 0.038 0.159 0.748 0.088
Price- Quality
Association 0.028 0.101 0.052 0.270 0.655
Dependent Variable: Customer’s overall Loyalty
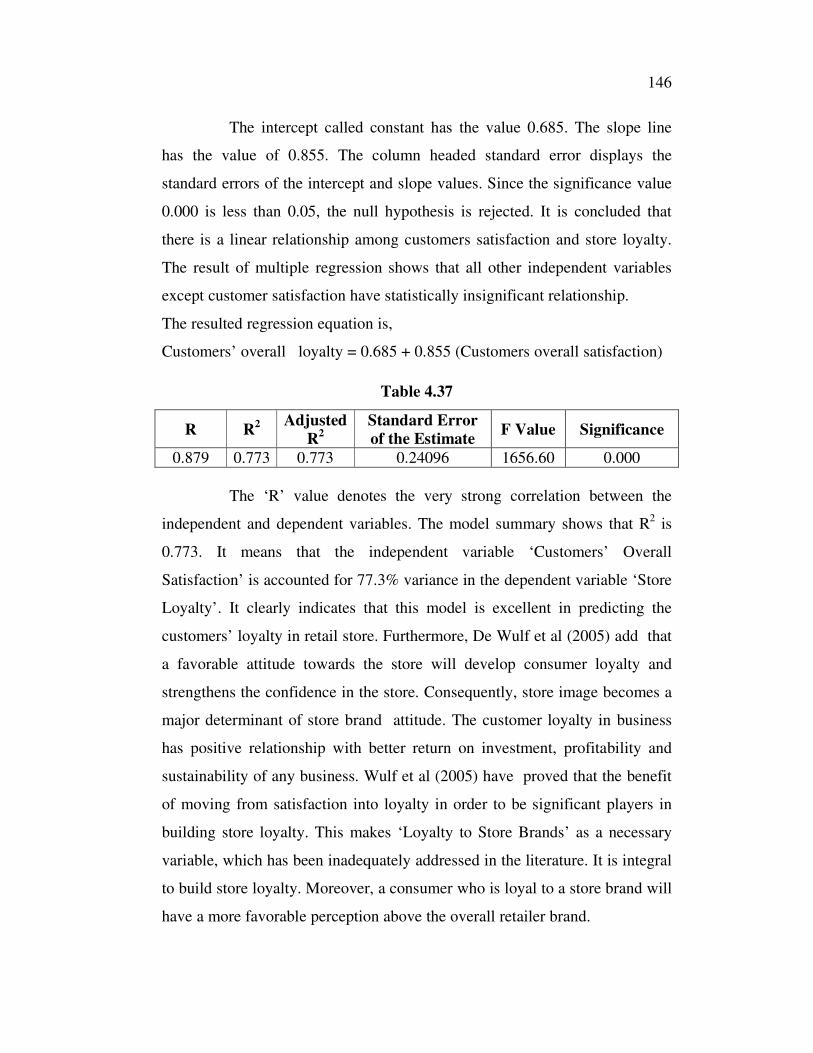
146
The intercept called constant has the value 0.685. The slope line
has the value of 0.855. The column headed standard error displays the
standard errors of the intercept and slope values. Since the significance value
0.000 is less than 0.05, the null hypothesis is rejected. It is concluded that
there is a linear relationship among customers satisfaction and store loyalty.
The result of multiple regression shows that all other independent variables
except customer satisfaction have statistically insignificant relationship.
The resulted regression equation is,
Customers’ overall loyalty = 0.685 + 0.855 (Customers overall satisfaction)
Table 4.37
R R2
Adjusted
R2
Standard Error
of the Estimate F Value Significance
0.879 0.773 0.773 0.24096 1656.60 0.000
The ‘R’ value denotes the very strong correlation between the
independent and dependent variables. The model summary shows that R2 is
0.773. It means that the independent variable ‘Customers’ Overall
Satisfaction’ is accounted for 77.3% variance in the dependent variable ‘Store
Loyalty’. It clearly indicates that this model is excellent in predicting the
customers’ loyalty in retail store. Furthermore, De Wulf et al (2005) add that
a favorable attitude towards the store will develop consumer loyalty and
strengthens the confidence in the store. Consequently, store image becomes a
major determinant of store brand attitude. The customer loyalty in business
has positive relationship with better return on investment, profitability and
sustainability of any business. Wulf et al (2005) have proved that the benefit
of moving from satisfaction into loyalty in order to be significant players in
building store loyalty. This makes ‘Loyalty to Store Brands’ as a necessary
variable, which has been inadequately addressed in the literature. It is integral
to build store loyalty. Moreover, a consumer who is loyal to a store brand will
have a more favorable perception above the overall retailer brand.
147
4.8 CONSUMER SATISFACTION AND STORE LOYALTY
The consumer satisfaction represents the attitude of the customers
on various services offered by the retail outlets. There is a consensus amongst
practitioners and academicians like Fitzel (1998) Sivadas and Baker-Prewitt
(2000) that customer satisfaction is a necessary precursor of loyalty. Several
researchers Westbrook(1980) Woodruff et al. (1983) have described
satisfaction as an emotion whereas other researchers Churchill and Suprenant
(1982) Bloemers and Kasper (1995) have found that it is reduced to purely
cognitive comparison. Oliver (1997) has defined customer satisfaction as the
consumer’s response towards fulfillment, and the degree to which the level of
fulfillment is pleasant or unpleasant.
Many researchers Oliva et al (1992), Heskett et al (1994)
Kandampully and Suhartanto (2000) Szymanski and Henard (2001) have
proved that there is a positive relationship between satisfaction and loyalty.
Rowley (2005) adds that satisfied customer is likely to be loyal customer with
or without the mediation of other antecedents.
In general, La Barbera and Mazursky (1983) have found that
loyalty and repurchase behavior are influenced by consumers satisfaction and
they lead to low intention to switch to another brand. Additionally, customers
tend to be satisfied when their needs and wants are fulfilled by the retailer.
According to Pepe et al. (2011), in the previous study it is verified that
satisfaction is really affecting repurchase intention. Hence, retailers should
determine the driver that enhances customer satisfaction which leads to
loyalty. Based on the research by Oliver (1997), a satisfied customer will
respond when his/her needs are fulfilled by retailers and thus, will create
loyalty.
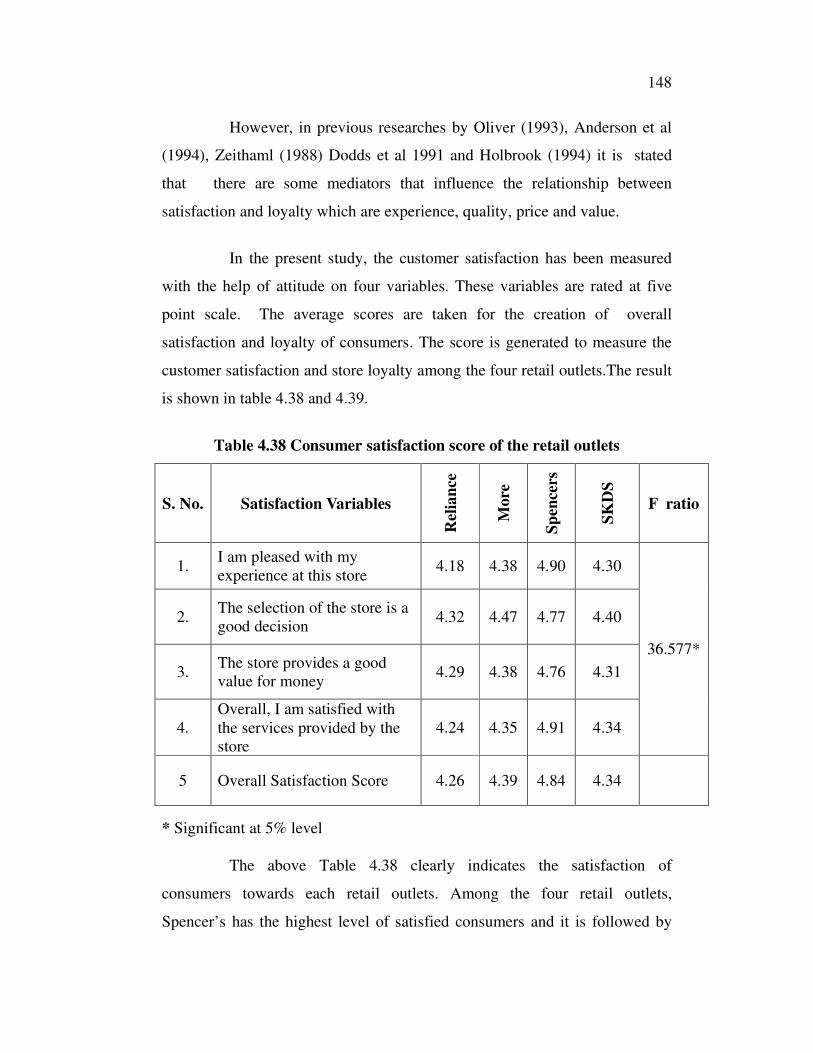
148
However, in previous researches by Oliver (1993), Anderson et al
(1994), Zeithaml (1988) Dodds et al 1991 and Holbrook (1994) it is stated
that there are some mediators that influence the relationship between
satisfaction and loyalty which are experience, quality, price and value.
In the present study, the customer satisfaction has been measured
with the help of attitude on four variables. These variables are rated at five
point scale. The average scores are taken for the creation of overall
satisfaction and loyalty of consumers. The score is generated to measure the
customer satisfaction and store loyalty among the four retail outlets.The result
is shown in table 4.38 and 4.39.
Table 4.38 Consumer satisfaction score of the retail outlets
S. No. Satisfaction Variables
Rel
ian
ce
More
Sp
ence
rs
SK
DS
F ratio
1. I am pleased with my
experience at this store 4.18 4.38 4.90 4.30
2. The selection of the store is a
good decision 4.32 4.47 4.77 4.40
3. The store provides a good
value for money 4.29 4.38 4.76 4.31
4.
Overall, I am satisfied with
the services provided by the
store
4.24 4.35 4.91 4.34
36.577*
5 Overall Satisfaction Score 4.26 4.39 4.84 4.34
* Significant at 5% level
The above Table 4.38 clearly indicates the satisfaction of
consumers towards each retail outlets. Among the four retail outlets,
Spencer’s has the highest level of satisfied consumers and it is followed by

149
More, SKDS and Reliance, with mean scores of 4.84, 4.39, 4.34 and 4.26
respectively. The variables of the consumer satisfaction are measured by each
retail outlets in order to give further importance to improve their level of
satisfaction among different consumers.
The Reliance consumers are satisfied on the basis of the following
sequence of satisfaction variables like ‘The selection of the store is a good
decision’, ‘The store provides a good value for money’, ‘Overall, I am
satisfied with the services provided by the store’ and ‘I am pleased with my
experience at this store’ with mean scores of 4.32, 4.29, 4.24 and 4.18
respectively.
With respect to More retail outlets, the satisfaction of the consumers
are known by the following variables like ‘The selection of the store is a good
decision’, ‘I am pleased with my experience at this store’, ‘The store provides
a good value for money’ and ‘Overall satisfied with other services provided
by the store’ with mean scores of 4.47, 4.38, 4.38 and 4.35 respectively.
The satisfaction of Spencer’s consumers are measured by following
sequence of variables like ‘Overall satisfied with other services provided by
the store’, ‘I am pleased with my experience at this store’, ‘The selection of
the store is a good decision’ and ‘The store provides a good value for money’
with mean scores of 4.91, 4.90, 4.77 and 4.76 respectively.
The SKDS’ consumer satisfaction are estimated in the following
sequence with ‘The selection of the store is a good decision’, ‘Overall
satisfied with other services provided by the store’, ‘The store provides a
good value for money’ and ‘I am pleased with my experience at this store’
with mean scores of 4.40, 4.34, 4.31 and 4.30 respectively.
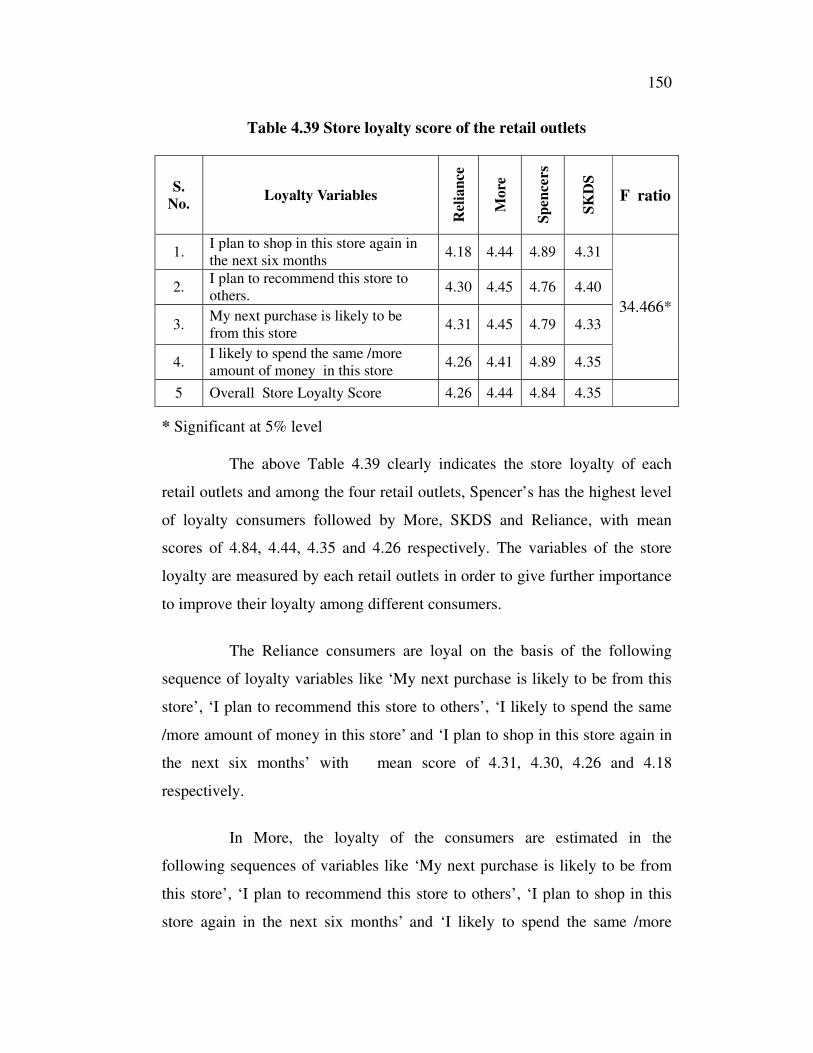
150
Table 4.39 Store loyalty score of the retail outlets
S.
No. Loyalty Variables
Rel
ian
ce
Mo
re
Sp
ence
rs
SK
DS
F ratio
1. I plan to shop in this store again in
the next six months 4.18 4.44 4.89 4.31
2. I plan to recommend this store to
others. 4.30 4.45 4.76 4.40
3. My next purchase is likely to be
from this store 4.31 4.45 4.79 4.33
4. I likely to spend the same /more
amount of money in this store 4.26 4.41 4.89 4.35
34.466*
5 Overall Store Loyalty Score 4.26 4.44 4.84 4.35
* Significant at 5% level
The above Table 4.39 clearly indicates the store loyalty of each
retail outlets and among the four retail outlets, Spencer’s has the highest level
of loyalty consumers followed by More, SKDS and Reliance, with mean
scores of 4.84, 4.44, 4.35 and 4.26 respectively. The variables of the store
loyalty are measured by each retail outlets in order to give further importance
to improve their loyalty among different consumers.
The Reliance consumers are loyal on the basis of the following
sequence of loyalty variables like ‘My next purchase is likely to be from this
store’, ‘I plan to recommend this store to others’, ‘I likely to spend the same
/more amount of money in this store’ and ‘I plan to shop in this store again in
the next six months’ with mean score of 4.31, 4.30, 4.26 and 4.18
respectively.
In More, the loyalty of the consumers are estimated in the
following sequences of variables like ‘My next purchase is likely to be from
this store’, ‘I plan to recommend this store to others’, ‘I plan to shop in this
store again in the next six months’ and ‘I likely to spend the same /more

151
amount of money in this store’ with mean scores of 4.45, 4.45, 4.44, 4.44 and
4.41 respectively.
The Loyalty of Spencer’s consumers are measured by following
sequence of variables are ‘I plan to shop in this store again in the next six
months’, ‘I likely to spend the same /more amount of money in this store’,
‘My next purchase is likely to be from this store’ and ‘I plan to recommend
this store to others’ with the mean score of 4.89, 4.89, 4.79 and 4.76
respectively.
Next, the loyal consumers of SKDS are estimated in the following
sequence of variables are ‘I plan to recommend this store to others’, ‘I likely
to spend the same /more amount of money in this store’, ‘My next purchase is
likely to be from this store’ and ‘I plan to shop in this store again in the next
six months’, with the mean score is 4.40, 4.35, 4.33 and 4.31respectively.
In addition, Bloomer and Kasper (1995) have found that loyalty
entails repetitive purchasing through a high commitment towards certain
products. Thus, commitment emerges when customers think that the
connection with retailer is essential in sustaining it in the long term period.
Finally, it is concluded that customer loyalty plays a significant role in many
businesses since years ago. Therefore, if the company can sustain their
customer well, the customers will have less attention to switch to the
competitors and keep being loyal to the company and eventually lead to high
profitability.
152
4.9 MEASUREMENT MODEL ANALYSIS
Before a full structural model is performed, a measurement model
analysis is conducted as stated by Anderson and Gerbing (1988) and Cheng
(2001). It is argued that the measurement model has to be held before the
testing of the relationships among constructs should be performed. The
measurement model analysis phase basically tests eight blocks of data;
namely: ‘Perceived Risk’, ‘Search Experience’, ‘Price Consciousness’, ‘Price
–Quality Association’, ‘Quality Variable’, ‘Convenience’, ‘Consumer
Satisfaction’ and ‘Brand Loyalty’ which is treated as the core and pivotal
variable, antecedents and its consequences. It is used to test the fit between
data and model from the measurement prospective.
The analysis is made in two stages using measurement model and
reliability. Measurement model was used to confirm the scales to the present
study. The model fit indices are estimated for two different models. Model 1-
A six factor model of store brand purchase consists of 22 items. The
consumer satisfaction and store loyalty consist of four items for each
variables respectively.
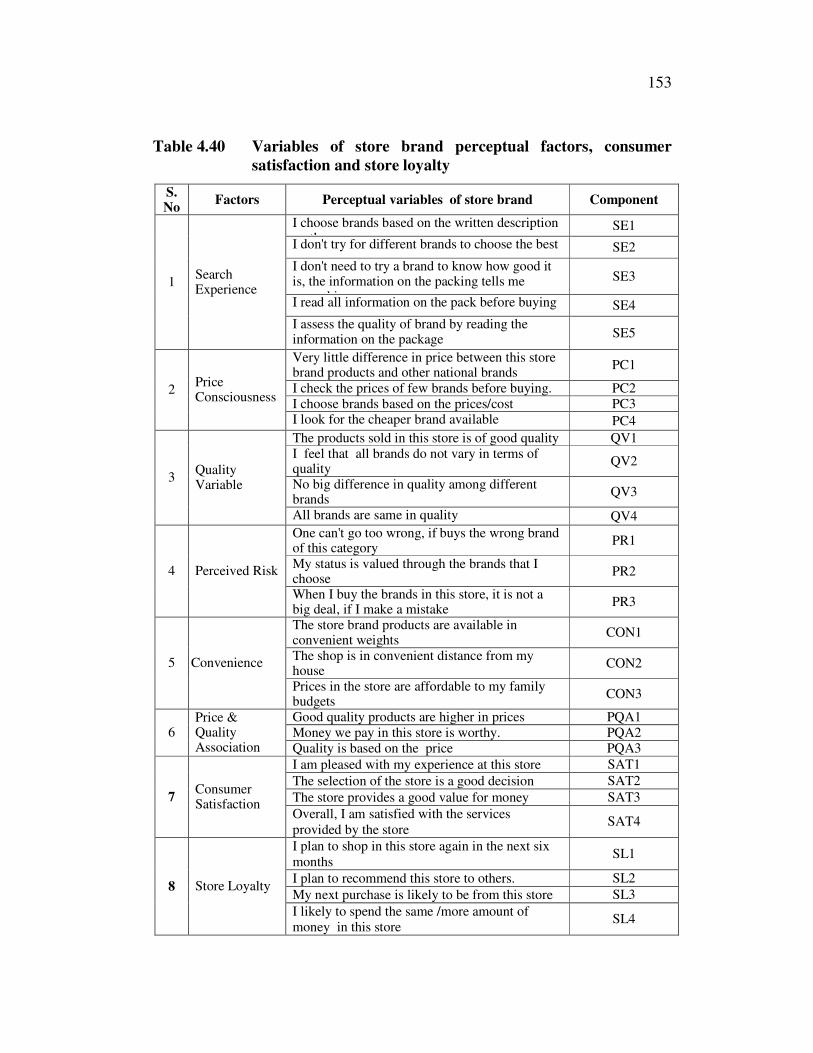
153
Table 4.40 Variables of store brand perceptual factors, consumer
satisfaction and store loyalty
S. No
Factors Perceptual variables of store brand Component
I choose brands based on the written description on the cover.
SE1
I don't try for different brands to choose the best one
SE2
I don't need to try a brand to know how good it is, the information on the packing tells me everything
SE3
I read all information on the pack before buying
SE4
1 Search Experience
I assess the quality of brand by reading the information on the package
SE5
Very little difference in price between this store brand products and other national brands
PC1
I check the prices of few brands before buying. PC2
I choose brands based on the prices/cost PC3 2
Price Consciousness
I look for the cheaper brand available PC4
The products sold in this store is of good quality QV1
I feel that all brands do not vary in terms of quality
QV2
No big difference in quality among different brands
QV3 3
Quality Variable
All brands are same in quality QV4
One can't go too wrong, if buys the wrong brand of this category
PR1
My status is valued through the brands that I choose
PR2 4 Perceived Risk
When I buy the brands in this store, it is not a big deal, if I make a mistake
PR3
The store brand products are available in convenient weights
CON1
The shop is in convenient distance from my house
CON2 5 Convenience
Prices in the store are affordable to my family budgets
CON3
Good quality products are higher in prices PQA1
Money we pay in this store is worthy. PQA2 6 Price & Quality Association Quality is based on the price PQA3
I am pleased with my experience at this store SAT1
The selection of the store is a good decision SAT2
The store provides a good value for money SAT3 7 Consumer Satisfaction
Overall, I am satisfied with the services
provided by the store SAT4
I plan to shop in this store again in the next six
months SL1
I plan to recommend this store to others. SL2
My next purchase is likely to be from this store SL3 8 Store Loyalty
I likely to spend the same /more amount of
money in this store SL4
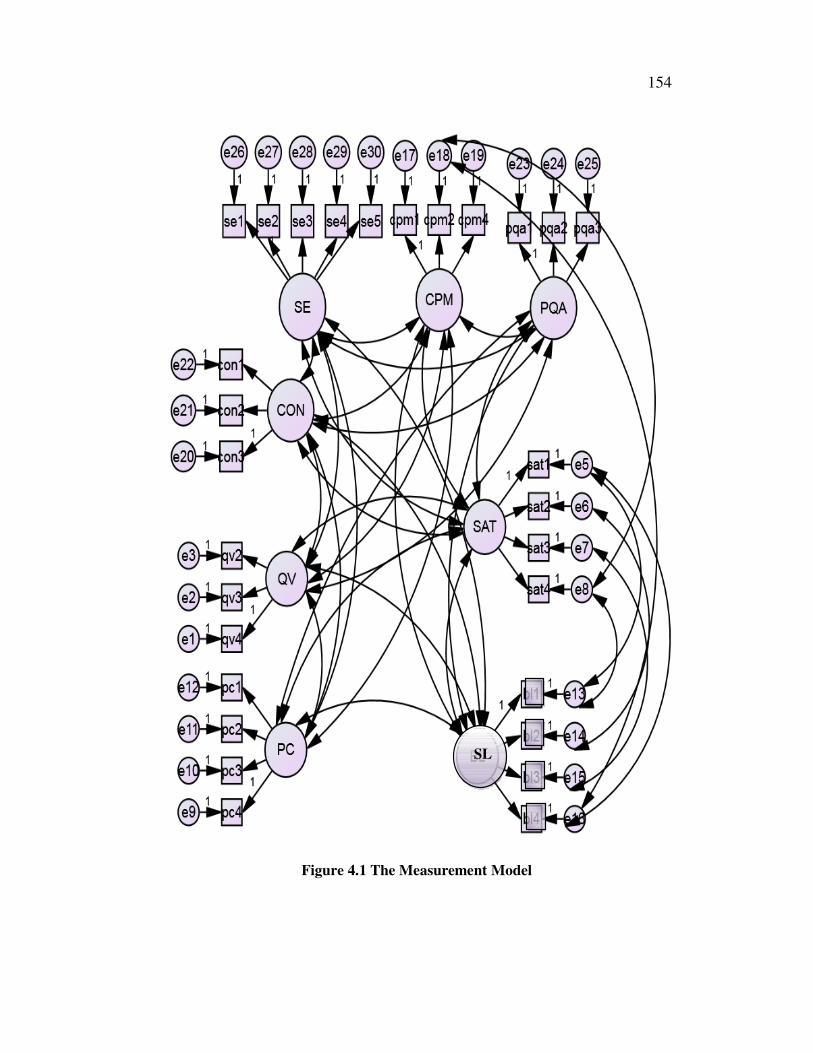
154
Figure 4.1 The Measurement Model
SL
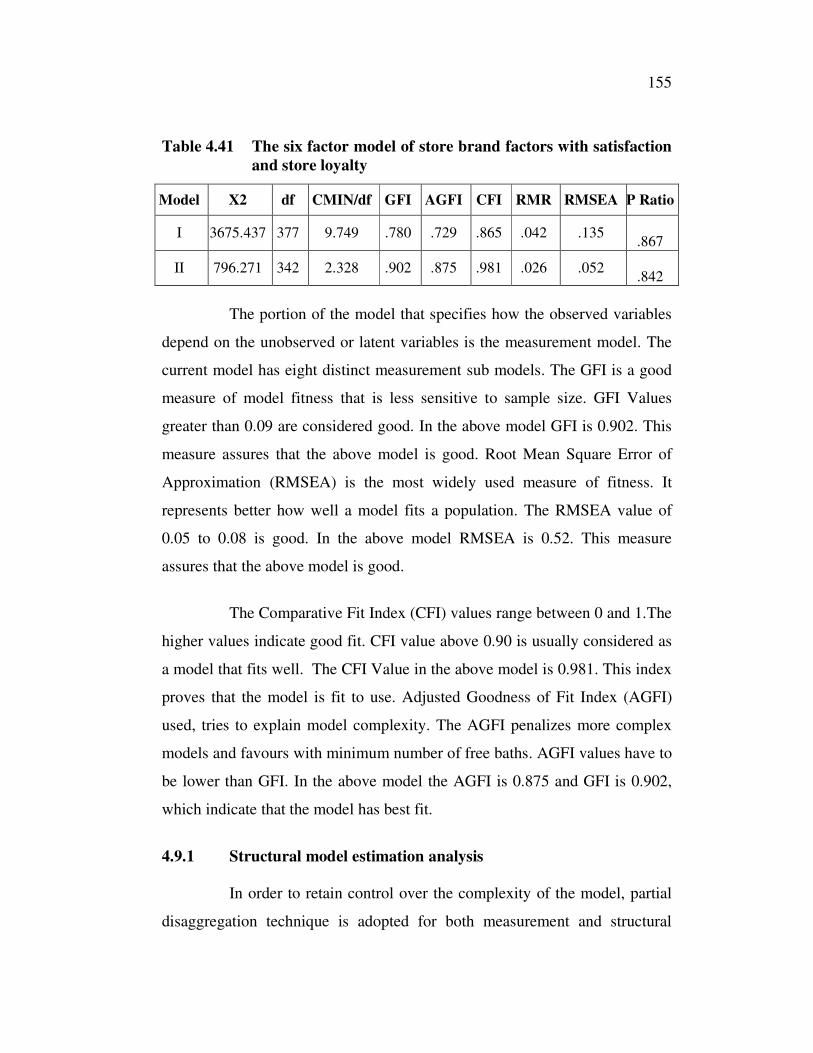
155
Table 4.41 The six factor model of store brand factors with satisfaction
and store loyalty
Model X2 df CMIN/df GFI AGFI CFI RMR RMSEA P Ratio
I 3675.437 377 9.749 .780 .729 .865 .042 .135
.867
II 796.271 342 2.328 .902 .875 .981 .026 .052
.842
The portion of the model that specifies how the observed variables
depend on the unobserved or latent variables is the measurement model. The
current model has eight distinct measurement sub models. The GFI is a good
measure of model fitness that is less sensitive to sample size. GFI Values
greater than 0.09 are considered good. In the above model GFI is 0.902. This
measure assures that the above model is good. Root Mean Square Error of
Approximation (RMSEA) is the most widely used measure of fitness. It
represents better how well a model fits a population. The RMSEA value of
0.05 to 0.08 is good. In the above model RMSEA is 0.52. This measure
assures that the above model is good.
The Comparative Fit Index (CFI) values range between 0 and 1.The
higher values indicate good fit. CFI value above 0.90 is usually considered as
a model that fits well. The CFI Value in the above model is 0.981. This index
proves that the model is fit to use. Adjusted Goodness of Fit Index (AGFI)
used, tries to explain model complexity. The AGFI penalizes more complex
models and favours with minimum number of free baths. AGFI values have to
be lower than GFI. In the above model the AGFI is 0.875 and GFI is 0.902,
which indicate that the model has best fit.
4.9.1 Structural model estimation analysis
In order to retain control over the complexity of the model, partial
disaggregation technique is adopted for both measurement and structural

156
analyses. This technique combines items into composites to reduce higher
levels of random errors, yet it retains the advantages of structural equations
and is capable of dealing with data problems. In essence, a partial
disaggregation approach, in which constructs are represented by subsets of
test items, has been found to lead to more interpretable and meaningful
results.
4.9.2 Evaluation of the full structure model
The structural model is the part of Structural Equation Modeling
that relates latent variables to one another. When a latent dependent variable
does predict another latent dependent variable, the relationship is recursive
and the disturbances are not correlated. A relationship is recursive, if the
causal relationship is unidirectional.
The GFI is a good measure of model fitness that is less sensitive to
sample size. GFI Values greater than 0.09 considered good. In the above
model GFI is 0.893. This measure assures that structural model is not fit to
the context. Root Mean Square Error of Approximation (RMSEA) is the most
widely used measure of fitness. It represents better how well a model fits a
population. The RMSEA value of 0.05 to 0.08 is good. In the above model
RMSEA is 0.056. This measure assures that the above model is good.
Comparative Fit Index (CFI) values range between 0 and 1. The higher values
indicate good fit. CFI value above 0.90 is usually considered as a model that
fits well. The CFI Value in the above model is 0.978. This index proves that
the model is fit to use. Adjusted Goodness of Fit Index (AGFI) used, tries to
explain model complexity. The AGFI penalizes more complex models and
favours with minimum number of free baths. AGFI values have to be lower
than GFI. In the above model the AGFI is 0.871 and GFI is 0.893, which
indicate that the model has best fit.
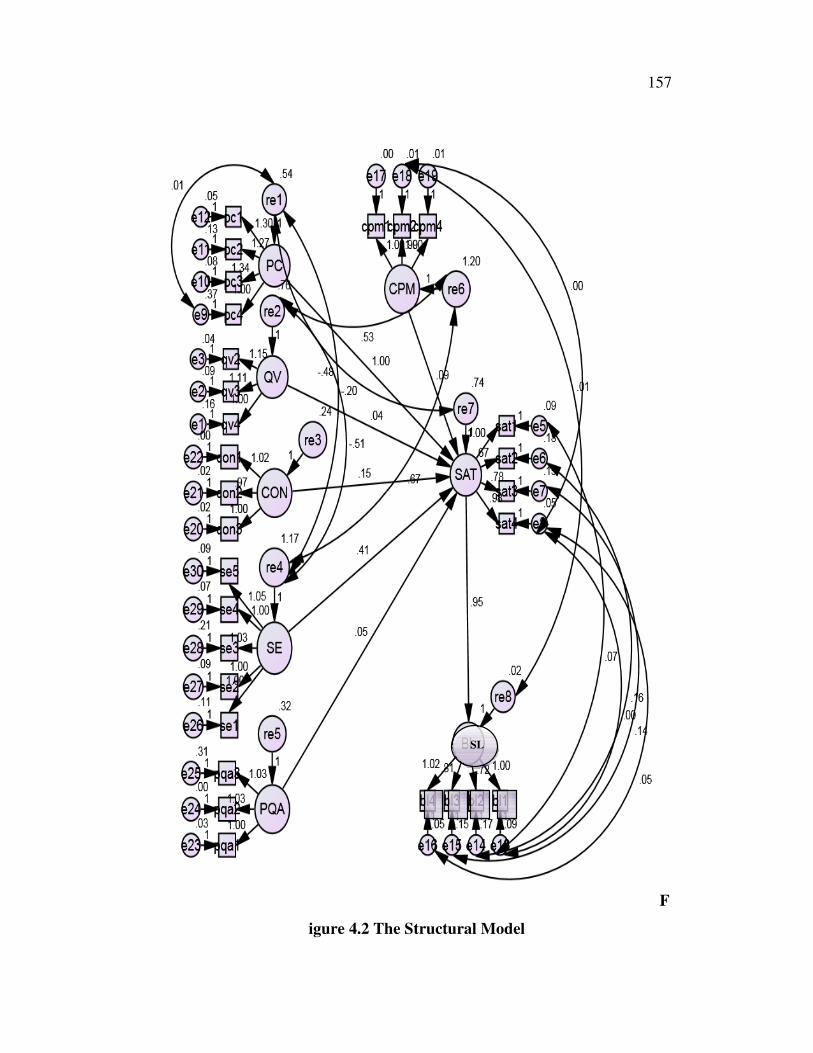
157
F
igure 4.2 The Structural Model
SL
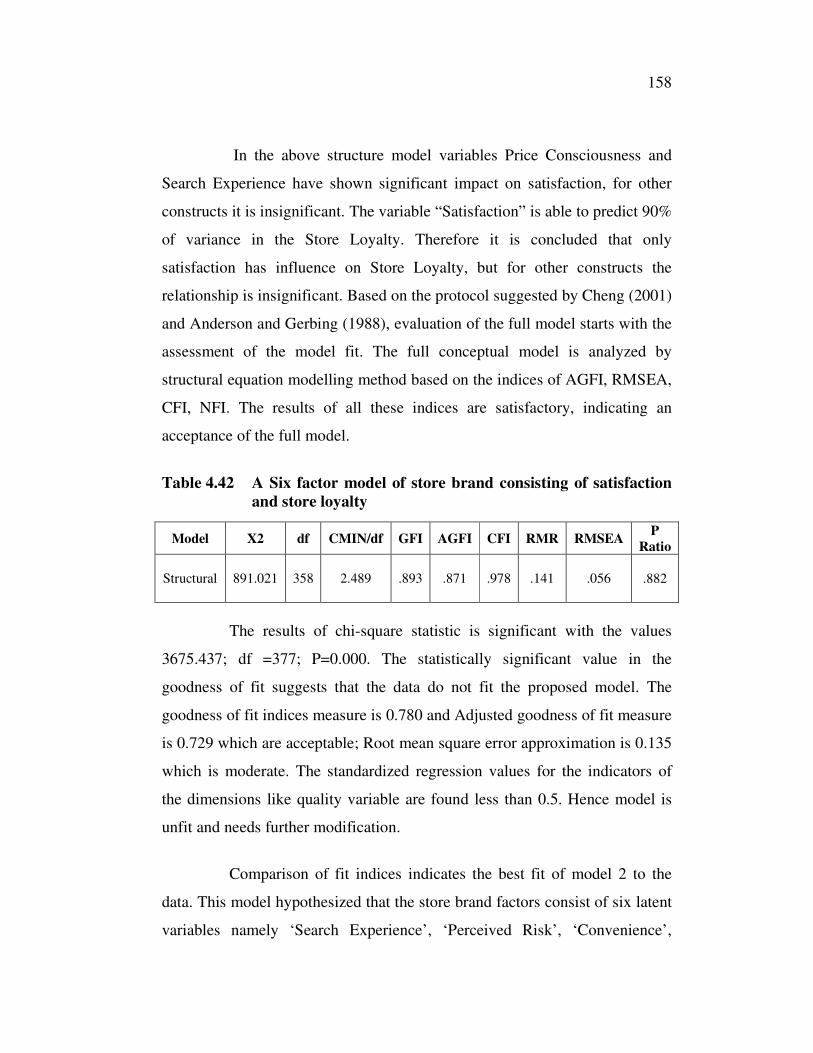
158
In the above structure model variables Price Consciousness and
Search Experience have shown significant impact on satisfaction, for other
constructs it is insignificant. The variable “Satisfaction” is able to predict 90%
of variance in the Store Loyalty. Therefore it is concluded that only
satisfaction has influence on Store Loyalty, but for other constructs the
relationship is insignificant. Based on the protocol suggested by Cheng (2001)
and Anderson and Gerbing (1988), evaluation of the full model starts with the
assessment of the model fit. The full conceptual model is analyzed by
structural equation modelling method based on the indices of AGFI, RMSEA,
CFI, NFI. The results of all these indices are satisfactory, indicating an
acceptance of the full model.
Table 4.42 A Six factor model of store brand consisting of satisfaction
and store loyalty
Model X2 df CMIN/df GFI AGFI CFI RMR RMSEA P
Ratio
Structural 891.021 358 2.489 .893 .871 .978 .141 .056
.882
The results of chi-square statistic is significant with the values
3675.437; df =377; P=0.000. The statistically significant value in the
goodness of fit suggests that the data do not fit the proposed model. The
goodness of fit indices measure is 0.780 and Adjusted goodness of fit measure
is 0.729 which are acceptable; Root mean square error approximation is 0.135
which is moderate. The standardized regression values for the indicators of
the dimensions like quality variable are found less than 0.5. Hence model is
unfit and needs further modification.
Comparison of fit indices indicates the best fit of model 2 to the
data. This model hypothesized that the store brand factors consist of six latent
variables namely ‘Search Experience’, ‘Perceived Risk’, ‘Convenience’,
159
‘Quality Variable’, and ‘Price Consciousness’. Even though the statistically
significant values reveal the poor fit model, the model fit indices are
estimated and the results demonstrate good fit. In comparison to the model-1
GFI with 0.90 and AGFI with 0.87 reveal greater degree of model fitness than
the other indices like CFI and RMR which have also improved. RMSEA is in
line with the suggested cutoff of 0.08 for good fit as stated by Byrne (1998)
Anderson and Gerbing (1988), Bacon (1997), Cheng (2001), Hair et al
(1998), Hoyle (1995), Purdie and Hattie (2002).
4.10 SUMMARY
The collected data are analyzed to realize the objectives of the
study, which is elucidated in this chapter. Statistical Package for Social
Sciences (SPSS) is used to analyze and interpret the data collected through the
tools such as ANOVA, multi regression analysis, mean and standard
deviation. With the help of the tools mentioned an analysis is done which
results in certain observations regarding the store image and store brands of
organized retail sector in Madurai.
This chapter discussed five main parts in data analysis of this
research. The first section analyses the profiles of the consumers with their
categories/ distribution towards different retail outlets. The results showed a
response rate of 93.8% in the store -intercept survey. Among the respondents,
the large proportion was female; aged between 30 and 39 years old; salaried
people; average monthly grocery expenditure between 1001-2000 and
duration of store brand purchase is more than 2 years. The second section,
analyzed the store choice behavior of organized retail and majority of the
consumers of four retail outlets opined ‘Value for Money’, ‘Wide Range of
Promotional Offers’ and ‘Extensive Varieties’ of Products are the important
attributes to select a store. The third section examined the importance of
purchase parameters of store brand products in association with profile of the
160
consumers. In fourth section, the ANOVA test results in respect of different
retail outlet, it is shown that there is a significant relationship between all the
factors such as ‘Search Experience’, ‘Price Consciousness’, ‘Quality
Variable’, ‘Perceived Risk’, ‘Convenience’ and ‘Price–Quality Association’
influences to purchase store brands based on different retail segments. In the
fifth stage, multiple regression analysis was adopted, the impact of store
brand factors on consumer satisfaction and relationship between store image
and store loyalty. Finally, structural equation modeling is performed, its
resulted there is confirm significant relationships among the constructs in the
model and shows satisfactory results for both the measurement models and
the structural model.
161
CHAPTER V
FINDINGS, CONCLUSIONS AND IMPLICATIONS
5.1 INTRODUCTION
The primary purpose of this research is to examine the association
between consumers’ perceptions of store image and attitudes towards store
brands, in order to find out the relationship among store brand factors,
satisfaction and store loyalty. It aims to address a research gap by examining
attitudes to specific store brands in the organized retailing market in Madurai
district where store brands research is limited. The research clarifies the
effects of store image on store brand attitude. It has identified the impact of
store image on overall satisfaction which leads to store loyalty, where the
evidence on the relationship among data are analyzed. Madurai market
context of the current research allows the organized retail sector to be
examined across four different outlets. It has also allowed for an examination
of the relative consumer positioning and attitudes to store brands in an area
where only a limited empirical research has been done previously. This
chapter discusses the findings arising from the research objectives and
conclusions are drawn for the research problem. The research has also
contributed further insights for researchers and marketing practitioners alike
in terms of retailers and store brands positioning and as well as areas for
future research are given further an overall conclusion for the research work
is provided in the final section.
162
5.2 SIGNIFICANCE OF FINDINGS
The dominant gender among the consumer is female. Majority of
respondents visiting the organized retail outlet belong to the age category of
30-39 years. It is also seen that the maximum respondents visiting the
organized outlets are home makers and they visit along with some
companions basically family members. Most of the consumers of organized
retail outlets of Madurai fall into the category of salaried group, whose
monthly expenditure on purchases is commensurate with their income. This
means that even though the frequency of visit is monthly, the majority of the
consumers spends an average monthly grocery expenditure of between
Rs.1000-2000 and consequently, the amount spent on each visit in a month
will vary according to the number of visits made in that month. This also
implies that the some of the visits to the organized retail outlet would have
been a family outing for entertainment. The most dominant duration of store
brand purchase is more than 2 years. The customers preferred to purchase
‘Ready to Eat Snacks’ among the different grocery items, since the emergence
of double –income earning lifestyle. From these findings it is inferred that the
majority of consumers visiting the organized outlets for more than 2-3 years
as the trend of nuclear urban family. The main characteristic of a nuclear
urban family is the members are highly individualistic and they have adequate
spending power; the members have divergent tastes and they have unique
needs that require solutions. As brought out by Sherrell (1989) consumers
receive pleasure in addition to merchandise as outcomes of a shopping trip.
The consumers visiting organized retail outlet with companion expect the visit
to be entertaining and pleasurable. Earlier studies by Taylor and
Cosenza(2002) also states about the trend of malls providing large areas and
focus on entertaining consumers. This shows that even consumers who
regularly visit organized retail outlet and who are fully aware of the
advantages of organized outlet, also visit unorganized outlet regularly for
163
various reasons. As brought out by Sinha and Banerjee (2004) the major
drivers for choosing a retail store in India is ‘Nearness to Residence’ and the
comfort level that the respondents has in dealing with the retail outlet.
With regard to store choice attributes, the research indicates that all the
respondents of the study perceive that their respective store is offering ‘Value
for Money’. Almost all the customers perceive that their stores are lacking
the’ Availability of Specific Products’ except Kannan Store. Customers of
Reliance stores perceive that Reliance retail offers ‘Value for Money’, ‘Wide
range of Promotional Offers’ and ‘Extensive Variety of Products’. At the
same time customers of reliance stores perceive that there is a scope for
improvement with the increase in the availability of specific products.
Customers of More perceive that more offers ‘Value for Money’ as
well as ‘Wide Range of Promotional Offers’ to the customers. Customers of
Spencer’s perceives that Spencer products are ‘Trust Worthy’; ‘Value for
Money’ and the employees in the Spencer offers ‘Best Services’ to their
customers. Kannan stores lauded for their offerings such as ‘Value for
Money’; ‘Wide Range of Promotional Offers’; ‘Extensive Variety of
Products’ and ‘Affordable Prices’ for products.
Except Kannan Store, other stores are located ‘Nearness to
Residence’ of the respondents. It is very clear that there is a distinction in the
perception of customers towards their retail stores. Different formats are
appreciated for different reasons. As per the customers, the one common
attribute that makes similarity in the perception of customer is ‘Value for
Money’ offered by the store. Among the four formats Spencers’ customers
have different perception towards their store in the attributes such as ‘Trust
worthy Products’ and ‘Service of Employees’. The Spencers’ customers have
some kind of uniqueness in their choice of store. There is a statistically
164
significant difference in the perception towards the choice of stores except the
attribute ‘Value for Money’.
From the ANOVA test results with respect to different retail outlet,
it is proved that there is a significant difference in factors influencing store
choice attributes except the ‘Value for Money’. This is most influencing
factor in all the four major retail outlets while selecting a particular retail
outlet as their purchase decision. From the consumer point of view, the
retailers have to give more importance to the value and expectation for a
product with reasonable price. The research indicates that there is an
association between the profile of the consumers and all the variables of the
store choice attributes. All the consumers invariably by gender; age;
occupation; duration of visit and store brand purchase; frequency of visit;
amount spent for grocery purchase and preference of grocery items consider
‘Value for Money’, ‘Wide Range of Promotional Offers’, and ‘Extensive
Varieties of Products’ as the most influencing store choice attributes.
In this study ‘Nearness to Residence’ is one of the influencing
factors other than ‘Value for Money’ and ‘Wide Range of Promotional
Offers’ for store choice among the consumers who belong to above 60 years
of age group. Similarly, the findings are seen in other studies which have
examined the store choice attributes. Finlay (2007) has examined the
perceptions of consumers towards grocery and shopping outlets and has finds
price and location as two critical factors influencing grocery outlet choice.
Attractive pricing and promotion strategies of retailers allure customers
towards store brands.
This study also reveals that trust worthy products and best service
of employees are also the influencing factors to choose the store among the
respondents with above Rs 5000 as an average monthly expenditure for
grocery purchase. This finding is consistent with Nair Suja’s (2011) work in
165
which customers are assured of a quality product with a tangible price
difference. Customers purchase risk is reduced as trusted retail name equals
the trust in the product offered by a particular retailer. The preference of
Indian consumers towards organized retail is essentially due to the
trustworthiness and quality factor. Supporting this, Leung and Oppewal
(2009) study also reveals that store names have a larger impact on store
choice than the brand names of the products offered as store brand. It ensures
cost savings to customer and leads to earn customer loyalty.
Other findings regarding the purchase parameters of store brand
products indicate that the results from ANOVA test in respect of different
retail outlet, is proved that while purchasing store brand products there is no
significant difference in purchase parameters like ‘Easiness to Prepare’ and
‘Flavor’ among all the four major retail outlets. The research indicates that
there is no significant difference between age group and purchase parameters.
Other profile variables are associated with consumer attitudes towards
purchase parameters. There is a statistically significant association between
gender and packaging. Occupations have significant relationship with
‘Cleanliness’ followed by ‘Easy to prepare’, ‘Flavor’ and ‘Discount’. Finally,
it is found that the duration of purchase; the product categories and type of
retail outlet has significant relationship with the customer attitude on the
purchase parameters of store brands.
The findings of the current research are supported, by Nair Lakshmi
(2011) who highlights on the changing perceptions of customers towards store
brands and the importance they attach to such brands while making purchases.
The factors influencing the purchase decision for store brands are: perceived
quality; freshness; packaging; health; availability of alternatives; sales
promotion and advertising. It is identified that, majority of store brand
packages do not visually display that actual product contents. This provides
166
detrimental to product sales. Attractive packaging is essential to persuade the
target market and core content is of similar quality to other manufacturer
brands in that product category. Hangzhon Shanghai (2000) study reveals
that the most important attributes are ‘Inspection stamp and certificate’ and
‘Freshness’. Food safety is valued higher by homemakers who are the major
grocery shoppers for the families.
5.3 CONSUMER FACTORS INFLUENCE STORE BRAND
PURCHASE
5.3.1 Price Consciousness
This research shows that ‘Price Consciousness’ is the strongest
influential factor among the six constructs determining store brand purchase.
In retail outlets like Kannan and More, consumers are more price conscious
than the other two retail outlets. With respect to the respondent’s
occupational level, the professionals are more price conscious than salaried,
business and home makers. All the consumers invariably by gender, age,
occupation, their duration of visit and store brand purchase, their amount
spent for grocery purchase, and their preference of grocery items consider
price as an influencing factor in store brand purchase. The results suggest that
consumers are more likely to buy store brand products in categories where
they are more prices conscious. The low price of store brand is one of the
major factors that encourage consumers to purchase store brand products. As
a result, consumers’ ‘Price Consciousness’ has a positive impact on
consumer attitudes towards store brand purchase.
This finding is consistent with Batra and Sinha’s (2000) study, that
‘Price Consciousness’ is the strongest of all constructs that positively
influence store brand purchase across the several product categories.
Similarly, the study of Raju, Sethuraman et al (1995) also indicates that store
brand products perform well in the product classes where consumers are more
167
sensitive to price. The importance of pricing as an attribute influences
customer’s acceptance of store brands. The retailers endanger themselves
while using low price for store brands. Burger and Schott (1972) also reveal
that store brand purchasers are slightly more price conscious than national-
brand purchasers. Later researches for example Burton et al (1998) and
Ailawadi et al (2001) have showed that consumers who tend to pay low prices
have a more favorable attitude towards buying store brand products.
5.3.2 Quality Variable
This research found that in retail outlets like Reliance and Kannan,
consumers have consider ‘Quality Variable’ as an important factor to
purchase store brand. ‘Quality Variable’ has influenced all the consumers
invariably by gender, age, occupation, duration of visit and store brand
purchase, frequency of visit, amount spent for grocery purchase and
preference of grocery items.
Hoch and Banerji (1993) have pointed out that product quality is a
key factor in explaining market shares of store brands. Their work suggests
that store brand products enjoy more success in categories, where the quality
level of store brands is closer to that of national brands. Semeijn et al (2004)
conclude that when ‘Quality Variance’ within a product category is high, it is
likely that consumers will choose manufacturer branded products over store
brands, to reduce perceived risk associated with that purchase. Dick, Jain and
Richardson (1995) also support the notion that consumers’ store brands
proneness is higher, when consumers are aware of a lower quality difference
between store brands and national brands. Pandya Amit and Joshi Monarch
(2011) have showed consistent evidence to support the notion that the
perception of quality is an important element related to store brand use. If all
brands in a category are seen as sharing a similar quality, then store brands
use is often observed to increase. Quality is more important than price to
shoppers.

168
5.3.3 Price–Quality Association
This research shows that in retail outlets like More and Spencer’s
consumers have consider ‘Price-Quality Association’ as important factor to
purchase store brand. The ‘Price-Quality Association’ has influenced the
consumers especially Male gender, salaried and business people in
occupation, those who purchase more than Rs.3000 per month as monthly
grocery expenditure, visiting for last 6 months and also for more than 3 years.
Several store brand studies have shown that the perception of ‘Price-Quality
Association’ has a negative influence on store brands attitude and purchase.
Earlier research by Wolinsky (1987) has indicated that a positive relationship
between price and quality provides negative impact on consumers’ attitude
towards store brands buying behavior. Later studies by Burton et al.,(1998)
and Garretson et al.,(2002) have also shown that the stronger belief of ‘Price-
Quality Association’ increases consumers’ unfavorable attitude to store
brands and thus reduces their proneness to the purchase of these products.
Although retailers set low prices to encourage the purchase of store brands,
this purchase encouragement will not be effective. This is particularly the case
for consumers who rely on price in their quality assessment. The low prices of
store brands serve only to exacerbate further unfavorable quality perceptions
of store brands products. Similar findings are seen in other studies which have
examined the influence of ‘Price-Quality Association on store brand
proneness in general product categories. In general, prior studies by Erickson
and Johansson (1985) have considered the perception of price as an indicator
of quality. Lichtenstein and Burton (1989) have stated that ‘Price-Quality
Association’ perception appear to be a function of general schemas.
Consumers easily generalize the association of price with quality to other
situations. Therefore, consumers who have strong ‘Price-Quality Association’
will have a negative attitude towards low-priced products, including store
brands.
169
5.3.4 Search Experience
This research results that customers who spend monthly more than
Rs. 5000 for grocery purchase only have shown importance on ‘Search
Experience’ factor in store brand purchase. Among the various retail outlets,
consumers of Spencer’s have shown positive influence in search experience.
Batra and Sinha(2000) have found that consumers prefer national brands to
store brands in product categories, where they cannot rely on the written
information provided by the product packaging, to assess accurately the
quality of important product attributes. In other words, this finding implies
that consumers’ proneness to store brands rises in categories where consumers
can easily make purchase decisions based on searching accessible product
features. Other studies Omar (1996) has also shown that national-brand
buyers rank usage experience as an important criterion of brand choice more
highly than store brands users do.
5.3.5 Perceived Risk
This research indicates respondents who are above 60 years of age
and those who are purchasing grocery for less than Rs.1000 per month. Only
Reliance customers consider perceived risk over other factors of store brands
purchase. Several studies by Bettman (1973) and Dunn et al (1986) have
confirmed the importance of perceived risk in store brands purchase. The
perceptions of uncertainty and danger associated with store brands purchase
are the key variables that differentiate store brands proneness from national
brand buyers. Perceived risk is an important explanatory construct for
supermarket product decisions. However, most store brand studies have
chosen to use ‘perceived risk’ as an variable to predict consumers’
preferences for store brand products. It also indicates that consumers perceive
that national-brands purchases are associated with lower performance risk and
higher financial risk than store brands. Supporting these views, Richardson et
170
al. (1996) have stated that perceived risk associated with using store brands is
an important determinant of consumer propensity to favorably evaluate and
purchase these store products. They have found that the greater the perceived
risk associated with store brands, the lower the consumer proneness towards
store brands.
Supporting the above findings, Batra and Sinha (2000) have
provided evidence showing a negative relationship between the degree of
consequence of a purchase mistake and store brands purchase. Their findings
suggest that store brands purchase increases in product categories, which
consumers’ perceptions of consequence of making a purchase mistake
decreases. Livesey and Lennon (1978) have noted possible reasons for
perception differences are with reference to experience with store brands;
heterogeneous response to marketing activities; different product needs;
perceived risk and category importance among consumers.
In a study by DelVecchio (2001) several product attributes have
been identified as antecedents of store brands success in specific product
categories. The product attributes have been related to risks, when consumers
purchase a store brand product. A negative effect of the perceived risks on
consumers’ evaluations of products sold under a store brand is predicted. It is
also hypothesized that some risks are relieved by the perceived store image.
Similarly results have been found in some prior studies like Narasimhan and
Wilcox (1998) who have noted that the degree of perceived quality variation
across brands in a category, has a positive influence on the perception of
purchase risk.
171
5.3.6 Convenience
This research has found that Convenience is the strongest
influential factor among the six constructs determining store brand purchase.
This research also indicates that all retail outlets like Reliance, More,
Spencers’ and Kannan consumers have considered convenience as the
important factor to purchase store brand. The research indicates that almost all
the consumers have shown positive consideration towards convenience than
other factors of store brands purchase. Convenience is the most influenced all
the consumers invariably of gender; age; occupation; duration of visit and
store brand purchase; frequency of visit; amount spent for grocery purchase
and preference of grocery items. In other words, this finding implies that
consumers willing to purchase store brands need rises in various product
categories where consumers can easily make purchase decisions based on the
availability of store brand products in convenient weights, nearness to
residence and mainly prices are affordable to their family budgets.
From the ANOVA test results in respect of different retail outlet, it
is shown that there is a significant relationship between all the factors that
influence to purchase store brands based on different retail segments.
All the consumers invariably of gender; age occupation; duration of
visit and store brand purchase; frequency of visit; amount spent for grocery
purchase and preference of grocery items considered the most influencing
store brand factors are ‘Convenience’; ‘Price-Quality Association’; ‘Price
Consciousness’ and ‘Quality Variable’.
From the ANOVA test, the research indicates that there is a no
significant difference between age group and other profile variables that are
associated with the store brand factors.
172
5.4 CONSUMER SATISFACTION AND LOYALTY TOWARDS
RETAIL OUTLETS
The research shows that customers of Spencers have higher level of
satisfaction followed by More and Kannan store. Reliance customers are least
satisfied to their store. Compared to other retail formats Spencer customers
have more positive attitude towards store. The reason is ‘Overall, I am
satisfied with the services provided by the store’; ‘I am pleased with my
experience at this store’; ‘the selection of the store is a good decision’ and
‘the store provides a good value for money’. The research also shows that,
there is a statistically significant difference among customers in their level of
satisfaction towards different retail stores.
The research indicates that customers of Spencers’ have higher
level of loyalty followed by More and Kannan store. Reliance customers were
least loyal to their store. When compared to other retail formats Spencer
customers has more positive loyalty attitude towards the store. The research
work found that, there is a statistically significant difference among customers
in their level of loyalty towards different retail stores.
5.5 IMPACT ANALYSIS OF STORE BRAND FACTORS,
STORE IMAGE ON CONSUMER SATISFACTION AND
STORE LOYALTY
The impact analysis of consumer factors of store brands purchase
posit that the search quality is positively accounted for consumers overall
satisfaction and loyalty towards store, while the other explanatory power of
the five constructs is not strong. It clearly indicates that this model is not a
good model to predict the consumers overall satisfaction and loyalty. It means
that the independent variable ‘Customers Overall Satisfaction’ is positively

173
accounted for store loyalty. It clearly indicates that the model is excellent in
predicting the customers’ loyalty towards retail stores.
From a broader perspective, the store image literature also supports
the link between store image and perceptions of brands carried by the store. In
other words, the more positively consumers view a store, the more positively
they will judge the store’s brands. Furthermore, De Wulf et al. (2005) have
added that a favorable attitude towards the store will develop consumers’
loyalty and strengthen the confidence of the consumers on the store. In
contrast, the result of the current research has not been supported by any
previous researches. The current study sets out that the customers attitudes
towards store brands are negatively associated with consumer perceptions of
store image. The findings related to this relationship indicate that the extent
to which store retains loyalty as a result of the store image, because
consumers have positive attitude and satisfaction towards the other attributes
of store choice not only the brands offered by the retailers’ as store brands.
The results also reveal that the quality of the products offered by the store is a
common determinant of attitude to store brands. Individual perceptions of
store image held by all shoppers in stores, has no satisfaction on store brand
attitude. The results of the current research clarifies the findings of Lee and
Hyman (2008) who have reported that store has only a weak effect on
attitudes towards store brands. They caution that the significance of the
relationship depends on the stores and store image factors which have positive
influence on store loyalty.
5.6 CONCLUSIONS ABOUT THE RESEARCH PROBLEM
The research problems investigated in this study are: The factors
that affect consumers’ attitudes towards store brands and the influence of
store brand on store image and the impact of store image on overall
satisfaction which leads to store loyalty. The research work further
174
investigates how do consumer factors influence on store brand purchase and
consumer satisfaction leads to store loyalty. The research indicates that more
positively the customers view a store, more positive their attitudes to the
store’s brands. In contrast with the conclusion reached in the original study,
there is only a weak support for the notion that store brands attitude is
associated with the unique positioning and attributes of store.
This is despite a confirmation that the stores and their brand in the
study are uniquely positioned by customers. The main store image
determinant of store brand attitude, which is applied across store brands and
stores, is found to be the quality of the products offered by the store. This
suggests that consumers use the quality of the store’s wider product
assortment as an extrinsic cue to assess store brands. Finally, the research has
confirmed that the extent to which store image predicts store brand attitude
depends on the store and the store brand, and further, one will have a weak
effect in some cases.
5.7 IMPLICATIONS FOR THEORY
5.7.1 Contribution to academic theory
There are a number of contributions to academic theory, which are
derived from this research. The research has provided interesting results for
organized retail sector. It shows that study of store brand factors influence the
customer satisfaction which acts as a catalyst to compete national brands.
The study raises a number of implications for researchers. First,
since store image has been shown to be a predictor of store brand attitude, it is
useful to include this variable in studies examining consumer attitudes to, and
preference for, store brand in order to enhance the explanatory power of
models developed. Secondly, researchers should be aware that the reverse
175
relationship will also hold, in other words, store brands will influence store
positioning and store image in the minds of consumers.
Another important implication for researchers is that the results
appear to open an motivation for retailers to use store brands to contribute to
store differentiation, since store brand attitude is not strongly associated with
unique store positioning. Consequently a case exists for further empirical
research in this area.
5.7.2 Contribution to organized retail sector
The findings of the current research provide in-depth knowledge
about the various dimensions, providing the link between retailing and
consumer behavior. There are a number of contributions to the knowledge
base within the retail market to take retail decisions in a competitive market
environment. These include the demonstration that store choice attributes are
higher order constructs. It examines the relationships among store brand
attitude, consumer satisfaction and store loyalty. In sum, the research
contributes to retail market to work upon the shoppers emotional intrinsic or
irrational behavior like the visual merchandising and ambience at the store.
They should be so attractive that the shoppers find themselves in a situation
where they just and will not get away without buying anything. The finding of
the current research helps retail chains to improve store brand quality and to
maintain competitive prices for store brands. It explains to large retailers, how
to start developing their own product brand according to the consumers need.
This study offers important and practical insights for retailers who intend to
develop their store brands. Store image involves a multitude of dimensions
effects of which have to be considered separately in retailers’ strategies.
According to the research findings, investments in these directions will be
worthwhile to the extent that a better image will help retailer brand.
176
5.8 MANAGERIAL IMPLICATION
The several managerial implications for retailers in the organized
retail sector and when attempting to better promote their own brand. The
research has implications for organized retailers in terms of store choice and
store brand strategy which have impact on consumer satisfaction and loyalty
towards store in future time period. The positive association exists in most
cases among store image, consumer satisfaction and store loyalty but not with
store brands. The finding suggests that retailers should specifically consider
aspects of store image that are relevant to the store brands they offer, when
designing activities to develop and enhance unique store positioning.
The following comprehended recommendations have been made to
improve the functioning of the stores.
(a) As the majority of the respondents belong to the younger generation
their needs should be taken reasonable with fixed prices, without
bargaining. So organized retailers are suggested to make sure that there
is an availability of branded products at reasonable price.
(b) Retail outlets can further appeal to the female customers by offering
more products, especially for women. They can provide a shopping
experience that women are particularly attracted to. In this way, retail
chains can expand their customer base as the retail outlets have a large
base of potential customers. Increase in the number of retail outlets
increases competition among these retailers. To attract customers they
give various promotional schemes as various discounts, ‘Buy One Get
One Free’, another product with any particular product, ‘festival special’,
etc. Conducting separate festival melas for store brand products and spot
competition to kids and female consumer motivate them by providing
house brand products as gift. Female consumers and kids are interested
in melas provided during festive season such as Diwali, Pongal and New
year eva and they are also exclusively interested in conducting games
177
and contests. These types of promotional activities are motivating the
consumers to purchase store brands.
(c) Location, variety of products and reasonable price are the major
motivating factors that influence the customers to visit the retail outlets.
So retail chains should give proper emphasis on these factors. Organized
retailers are suggested to offer convenient location, sufficient parking
space and an atmosphere ambience so that customers can have a
pleasurable shopping experience. It is proved by different studies that
more a customer spends time in a store, the more likely he/she is to make
purchases. So with the purpose to increase revenue, organized retailers
have to pay attention towards physical aspects, variety of brand and non
branded products at reasonable prices.
(d) The organized retailers have to take effective steps to improve other
services like billing, if consumers do not prefer long queues for billing.
So the organized retail outlets may start home delivery to cater to the
needs of the consumers. Proper parking facilities with free of cost for the
regular customers/heavy purchasers is necessary. Such people may be
issued a parking card, with free earmarked parking.
(e) Retailers have to concentrate on brand promotion by providing book
marks, prize coupons, calenders, wrist bands, T-shirts and cap
merchandise. To promote the brand, the retailers are influenced to
provide certain activities and offers, through which the retailers can
create loyalty towards brands so well as stores. Again, bringing the
customer to the store will not be sufficient in achieving their ultimate
objective. Their evaluation criterion refers to tangible and/ or intangible
benefits that consumers use to compare product classes, brand, and
vendors and so on. Persuading them to buy again needs due emphasis on
in-store promotions, ambience, design and social cues. This enables
them to choose the brand and product from the store. The special
promotional activities should be there on weekdays so as to gather rush
178
on weekdays, and to avoid the chaos and confusion on the weekends.
The consumption and post purchase experience accompanied by various
loyalty building initiatives can play a major role in convincing them to
make impulse buying, repeat purchases ultimately creating store loyal
customers.
5.8.1 Recommendations to specific retail outlets
Based on the findings, the following recommendations have been
made to improve the functioning of each retail outlet:
Reliance has the scope for improvement in the product display,
employee behaviour with customers and making the price of the products
comparable to other retail formats. More retail has to popularize the brand
with innovative promotional ideas and media to gain competitive advantage
over its competitors. More has to improve trustworthiness of its offerings,
since More has less trustworthiness of products compared to other stores.
Spencers’ doing better in terms of store choice attributes is compared to other
retail formats. Spencer has been rated in store brand attributes except the
attributes such as ‘Affordable Price’, ‘Extensive Varieties of Products’ and
‘Wide Range of Promotional Offers’. There is scope for the improvement in
the above attributes which will make Spencer’s as the best among the retail
format in the perception of customers in Madurai.
Kannan store has to formulate strategies to improve the perception
of customers towards ‘Service of Employees’, ‘Attractive Display of
Products’ and Trustworthiness of Products’. The sales personnel may be
educated to portray courteous behavior to make consumers shopping more
effectual and the sensitization training on customer relation and its benefit for
employees as well as store are essential to improve the behavior of
employees. Floor supervisors may instruct to overcome the problems of
179
clumsy display of products. The concept of 5S may applied for the
improvement of product display better.
In general, existing retail stores invariably by retail formats have to
improve their product display, availability of specific products, trust
worthiness of store brands, employee behaviour with customer and changing
the perception of price affordability of store brands.
Need for Segmentation, Targeting and Positioning of store brands:
Retailers have to develop specific segmentation of customers. Based on that
segmentation they have to target particular segment which they perceive
profitable and sustainable over the period of time. Based on the target market
and its specific characteristics, retailers have to position their brand
efficiently. In a simple word, the retailers have to apply the rudiments of
marketing principles for store brands too.
In general, whatever the formats, the stores’ must ensure that
customers should feel happy with their store experience; store choice and
worthiness of money spent on the purchase of products to improve their level
of satisfaction. There is scope for the improvement in the customer loyalty in
More, Kannan and Reliance stores by improving the level of satisfaction of
customers. Increasing the customer loyalty must be the priority of the retail
stores, since loyalty brings repeated customer visit, positive word of mouth
towards store and increased profitability by increased spending in the store.
Bridson and Hickman (2003) have found the different types of loyalty
program attributes that affect customer stores satisfaction in term of retail
offer. This study has found that both hard and soft attributes are significant
predictors of satisfaction with the merchandise, trading format, customer
service and customer communication in store. Kaul (2005) has concluded
that consumers are satisfied with the stores. Service qualities make them to
remain loyal. Service quality is increasingly perceived as a tool to increase
180
value for the customer, as a means of positioning in a competitive
environment to ensure consumer satisfaction, retention and patronage. Despite
its strategic importance, Indian retailers do not have an appropriate instrument
to measure service quality.
5.8.2 Suggestions to Develop Store Brands
• Retailers can adopt marketing mix strategies for store brands:
Product quality is of prime importance and the consumers look
towards store brands for good quality. Therefore the retailers should strive to
maintain good quality standards in the store brand merchandise.
Pricing is a major determinant for differentiating from competing
brands and to generate preference towards store brands. This is because
consumers expect to get good quality at a fair price when they buy store
brands. The retailers should therefore set the price at a level where the
consumers feel that they are getting much more than what they are paying for.
Promotion of store brands is vital for their success. The retailers
should promote their store brands, especially at the selling points, in order to
create awareness as to why customers should purchase them in preference
over national brands.
Proper placement of store brands in the store and on the shelves is
quite important for drawing the attention of consumers. Significantly the
central position is more effective in both vertical and horizontal display of
merchandise. Besides, placing the store brands around the national brands
offers opportunity for consumers to compare and evaluate.
The Marketing strategies of retailer’s are very important tools for
improving the value of retail business and to enhance the sales of organized
retail outlet. Strategies of retailers are:
181
• Retention strategies like understanding the consumers, customer
delight, store image better environment, attractive merchandising and
loyalty programs and customized technology.
• Promotional strategies like customer segmentation, personal selling,
advertising, entertainment facilities and after sales service.
• Image improvement strategies like franchise/joint venture and training
sales personnel.
• Pricing strategies like free gifts, discounts options and festival offers.
• Competitive strategies like competitive pricing and public relation.
Retailers might have to be patient and make consistent investments
in terms of both money and effort to sustain ad grow their store brand
business. The dominance of national brands demands extra effort on the part
of retailers to successfully promote their store brands. The other parameters to
be considered are:
Shelf-space: Store brands should be displayed along with national brands to
bring in the perception of value. It is suggested to keep the SKUs next to
national brands, preferably on the right side as many customers are right-
handed.
Price flexibility: As store brands are not available in other competitor stores,
consumers cannot compare their prices. While, when national brands are
being made available in other stores, their prices easily come under price
comparison. Here, the price variance with national brands becomes the crucial
factor. This is also the contributing factor to better profitability.
In-store initiativeness: Store executives can play an enabling role so that
consumers take note of the store brand and the price differential. Store brands
are mainly promoted through in-store initiatives. The retailer has undertaken
extensive marketing through public media to promote and position store
182
brands. This is mainly because consumers are automatically attracted towards
the store brand because of their attractive price–quality relationship
Therefore, the employees attempt to promote the store brands directly to the
customers who visit the store.
Merchandise update: Store executives can also constantly collect feedback
on these store brands from users, which can be the premise for a continual
improvement strategy.
Store Certified Products: To offer an increasing variety of store brand
goods, with clear labeling, as a part of risk reduction, contribute to store
loyalty. The retailers not only focus on a particular product, but also
concentrate on varieties of products that are certified. This is done to make
them more valuable and they have the responsibility to label the products
which reduces the purchase risk. The labeling creates more loyalty and trust
in the insight of the consumers which finally creates an intension to buy the
products repeatedly, which leads to store loyalty.
Promotional Reward System: To establish a reward system associated with
incentives for the consumers, who frequently purchase store brand products
and who retain the consumer loyalty. The SMS campaign is done to frequent
visiting consumers about the new arrival of store brand products in retail
outlet. In order to make the frequent purchasers to feel loyal, the retailer has
to do some promotional activities in advance to the technology development.
So SMS campaign can provide the details about new arrivals of store brand
products and respective offers to the consumers.
Credit Point Scheme: A comprehensive credit scheme may be initiated to
increase sales potential, by providing separate credit points system for every
store brand purchase. Now- a -days, retail merchandising has become one of
the orders of fashion in purchasing products. As the intention of consumer has
183
changed a lot, the retail store brand producers are forced to provide certain
offers in the name of value added services. This is the positive intensity
created by the consumers for the store brand producers and products. In order
to maintain this sale, the retailers are providing some credit points for every
purchase of store brands. In such cases, the retailers apply certain conditions
and terms, as the points increases to a certain limit, the consumers can avail
offers such as price reduction. This is how the credit point system for every
store brand purchase influences the consumers to avail the benefits of store
brands. The attitude of every individual consumer varies and some consumers
may be satisfied with credit point system and store brand purchase.
Pricing Policy: Retailers are benefited only if consumers perceive their store
brand as result of consistency comparable quality and availability in relation
to branded products. Retailers have to provide more assortments for store
brands, to compete with supplier’s band. The NPD, aggressive retail mix as
well as EDLP strategy can be the strategy to supplier’s brand. Price plays a
very important role in influencing the overall consumer preferences. If a
considerable number of consumers opt for store brands, it is because of the
price factor. Indian consumers are very price sensitive. Retailers can reduce
transportation and other logistics costs by outsourcing the products locally
and can pass on the benefits to the consumers. Thus, from a retailer’s point of
view, they are in the job of vendor management. Sourcing the products from
the vendors who deliver quality is the key to their success. Out of this store
brands provide reasonable quality coupled with reasonable price.
Promotion Mix: Strategies like advertising, personal selling; sales
promotions and publicity play a significant role in introducing a store brand.
Advertising on signage, handbills arid through posters within the store are
some of the effective means to make consumers aware of the arrival of the
latest items under a store brand. Customers’ feedbacks enable a retailer to
184
understand the response towards store brands. This allows the retailer to make
tangible changes, if required, in order to improve the quality of the brand.
Globally, customers have been found to possess varying perceptions
regarding store brands. However, majority of the customers are of the opinion
that store brands are comparable to national brands, but perhaps slightly
inferior in quality. Advertising use of in-store displays, product tastings,
brochures, etc. can also reinforce the prestige of store brands. The idea that
store brands are a second-rate alternative which persists among a large
number of consumers, who perceive store brands as inferior to the
corresponding national brands will be with the customers. These actions will
also help to increase familiarity, reduce consumer perceived risk and give
more value to store brands.
5.9 FUTURE RESEARCH
This research provides possible avenues for various future
researches.
The current research is focused on a single product category
(grocery products), and one single type of retail brand (store brands). To
develop a better understanding of the role of store image in moderating the
relationship between perceptual variables and store brand attitudes, it would
be useful to consider a variety of product categories. Store brands can also be
found in kitchenware, baby care, body care, garments, Do-It-Yourself (DIY)
products. Inclusion of further stores and store brands, in varying geographic
locations, would enable the study of the relationship between store image and
store brand attitude to take into account, a wider range of retailer brand
architectures. Finally, future research can include other factors, such as
congruency between store image and store brand and investigate their
combined effect on the attitude towards retailer brands.

185
Most of the studies done on Indian retail formats have focused on
the attributes of stores and on overall consumer choice towards emerging
retail formats. Consumer’s product choice towards retail formats is an
unexplored area. There is a lack of focus on the holistic view of shopping
trends of Indian consumers and their choice of store formats. By
understanding this picture, retailers can focus their strategies in the right
direction. Further areas for additional research are as follows: Firstly, the
store image scale could be adapted to include psychological variables related
to consumer attitudes towards the store. Secondly, a longitudinal study would
be provided for the inclusion of changes in consumer attitudes over time,
especially changes in response to store brand market development or to other
changes affecting store image in the grocery industry. The future research
could be done to examine the influences of consumer factors on store brand
buying from organized retail sector like Malls, super markets with diverse
geographic areas. The further study extends to examine the relationships
between consumer factors and brand choice decisions.
5.10 CONCLUSION
This thesis has explored how consumer factors affect store brand
purchase across different retail outlets in grocery retailing. In particular, this
research has examined several consumer perceptions and attitudes to explain
the selection of store choice attributes. Several demographic constructs are
also investigated. Knowledge gaps which are found in the literature review
are justified in the current study. The literature proves that retailer
differentiation is one of the key motivations for store brands. The literature
also indicates that store image and brand image are interdependent. The
research also suggests several implications for both researchers and managers.
Finally, based on the current study, the suggestions for future research are
discussed.
186
This research provides insights on the preference level of store
brands in Madurai district. Theoretically, this study has proves the importance
of examining the influences of consumer factors on store brand purchase.
Similarly, factors increasing favorable attitudes towards store brands will
have a positive effect on the purchase of store brands. With respect to retail
outlets, this study has identified that Reliance and Spencer’s consumers
consider ‘Perceived Risk’ and ‘Search Experience’ as the most important
purchase attitudes respectively. It has been proved that other factors like
‘Convenience’; ‘Price Consciousness’; ‘Price-Quality Association’ and
‘Quality Variable’ have shown positive influence on store brands of different
retail segments.
Finally, the research work has proved that positive association
exists in store image, consumer satisfaction and store loyalty rather than the
brands offered by the retailers as store brands. The research identifies that
store brands are not only the important factors which influence consumers to
select a store. All other factors like ‘Value for Money’; ‘Wide Range of
Promotional Offers’ and ‘Extensive Varieties of Products’ have become the
important store choice attributes while choosing a store. This research
confirms that store image plays an important role in attitudes towards store
brands. Retailers have to realize their strong points and they have to modify
their positioning strategy accordingly. Thus, the research has served the need
to examine the relationship among store image and store brand factors,
consumer satisfaction and store loyalty.
Through this research work the researcher has authentically proved
that store brands never cast store image. It further proves that store image,
customer satisfaction and store loyalty are the major constituents which drag
the consumers to visit the store repeatedly and to remain loyal to the store
thereby fetching huge profit to the store.
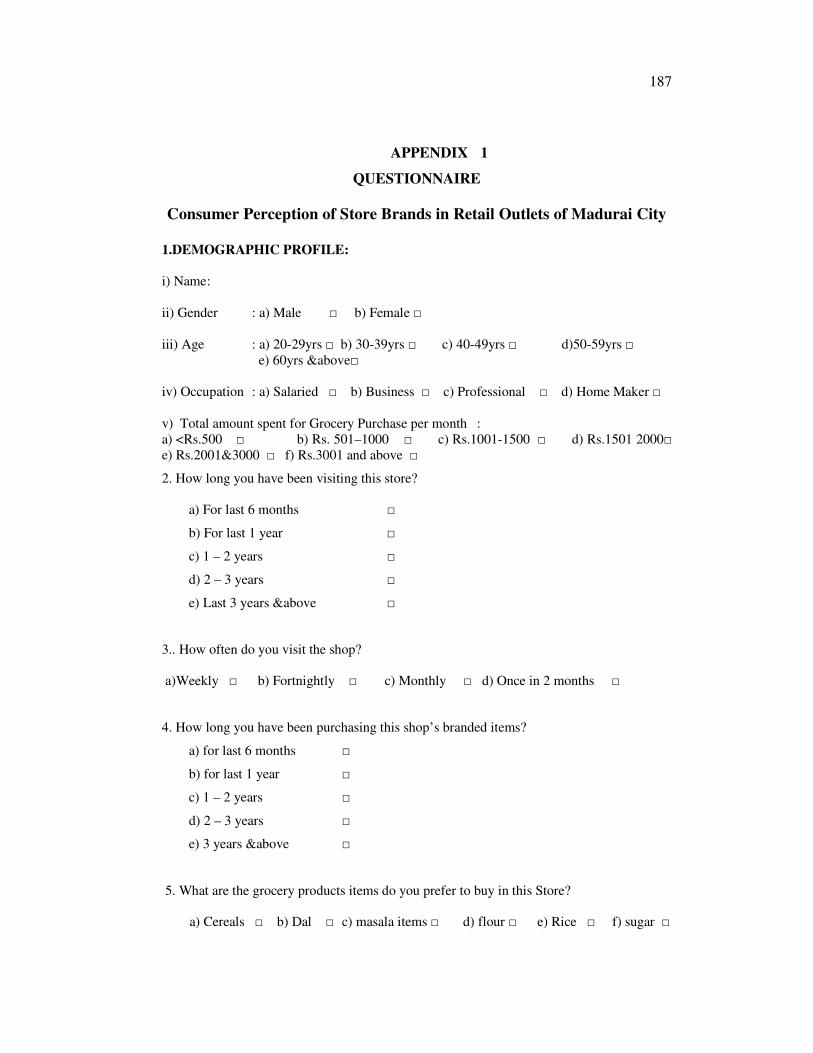
187
APPENDIX 1
QUESTIONNAIRE
Consumer Perception of Store Brands in Retail Outlets of Madurai City
1.DEMOGRAPHIC PROFILE:
i) Name :
ii) Gender : a) Male □ b) Female □
iii) Age : a) 20-29yrs □ b) 30-39yrs □ c) 40-49yrs □ d)50-59yrs □
e) 60yrs &above□
iv) Occupation : a) Salaried □ b) Business □ c) Professional □ d) Home Maker □
v) Total amount spent for Grocery Purchase per month :
a) <Rs.500 □ b) Rs. 501–1000 □ c) Rs.1001-1500 □ d) Rs.1501 2000□
e) Rs.2001&3000 □ f) Rs.3001 and above □
2. How long you have been visiting this store?
a) For last 6 months □
b) For last 1 year □
c) 1 – 2 years □
d) 2 – 3 years □
e) Last 3 years &above □
3.. How often do you visit the shop?
a)Weekly □ b) Fortnightly □ c) Monthly □ d) Once in 2 months □
4. How long you have been purchasing this shop’s branded items?
a) for last 6 months □
b) for last 1 year □
c) 1 – 2 years □
d) 2 – 3 years □
e) 3 years &above □
5. What are the grocery products items do you prefer to buy in this Store?
a) Cereals □ b) Dal □ c) masala items □ d) flour □ e) Rice □ f) sugar □
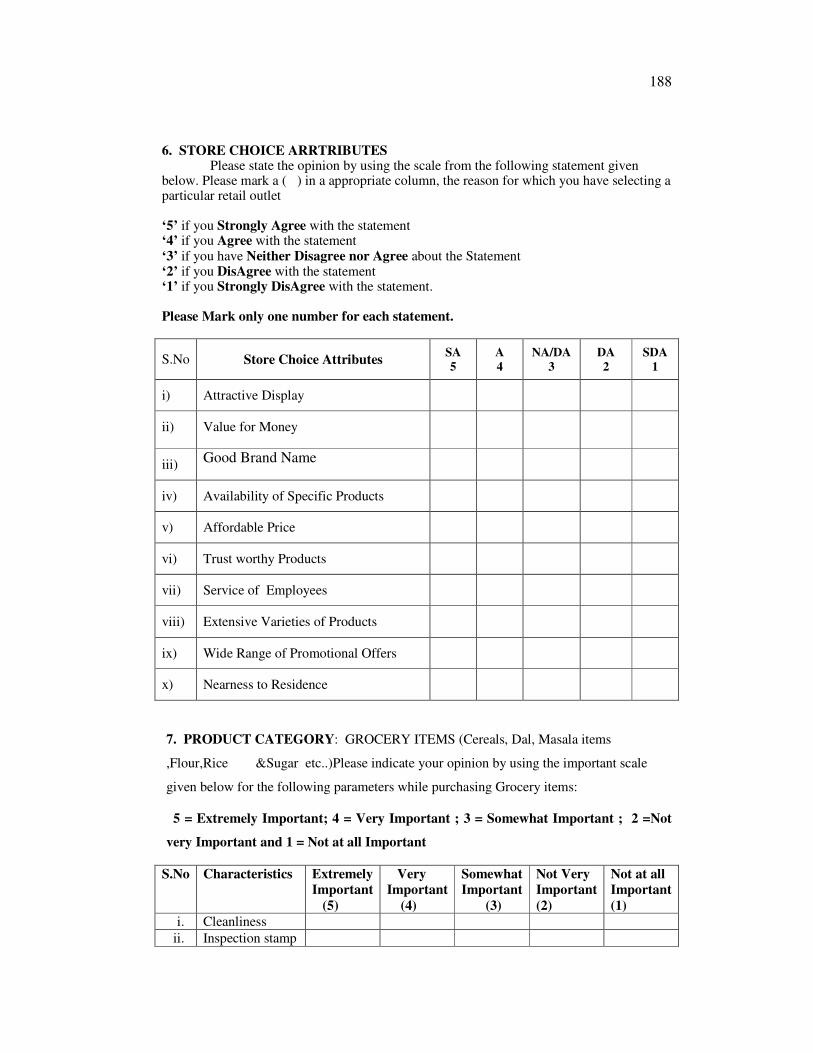
188
6. STORE CHOICE ARRTRIBUTES Please state the opinion by using the scale from the following statement given
below. Please mark a ( ) in a appropriate column, the reason for which you have selecting a particular retail outlet ‘5’ if you Strongly Agree with the statement ‘4’ if you Agree with the statement ‘3’ if you have Neither Disagree nor Agree about the Statement ‘2’ if you DisAgree with the statement ‘1’ if you Strongly DisAgree with the statement. Please Mark only one number for each statement.
S.No Store Choice Attributes SA
5
A
4
NA/DA
3
DA
2
SDA
1
i) Attractive Display
ii) Value for Money
iii) Good Brand Name
iv) Availability of Specific Products
v) Affordable Price
vi) Trust worthy Products
vii) Service of Employees
viii) Extensive Varieties of Products
ix) Wide Range of Promotional Offers
x) Nearness to Residence
7. PRODUCT CATEGORY: GROCERY ITEMS (Cereals, Dal, Masala items
,Flour,Rice &Sugar etc..)Please indicate your opinion by using the important scale
given below for the following parameters while purchasing Grocery items:
5 = Extremely Important; 4 = Very Important ; 3 = Somewhat Important ; 2 =Not
very Important and 1 = Not at all Important
S.No Characteristics Extremely
Important
(5)
Very
Important
(4)
Somewhat
Important
(3)
Not Very
Important
(2)
Not at all
Important
(1)
i. Cleanliness
ii. Inspection stamp

189
and certificate
iii. Packaging
iv. Purchase
convenience
v. Competitive
Price
vi. Food Safety
vii. Easy to prepare
viii. Flavor
ix. Freshness
x. Discount
8. Consumer Perception Towards Store Brand: Instructions: Please read each statement and CIRCLE the number that most accurately reflects your opinion. Circling ‘5’ means that you strongly Agree with the statement and circling ‘1’ means you strongly disagree the statement. Please circle only one number for each statement. 5 = Strongly Agree; 4 = Agree; 3 = Neither Agree nor Disagree; 2 = DisAgree, 1 = Strongly DisAgree
S.No STATEMENTS SA A NA/DA DA SDA
1. One can’t go too wrong, if buys the
wrong brand of this category. 5 4 3 2 1
2. When I buy the brands in this store, it is
not a big deal, if I make a mistake. 5 4 3 2 1
3. Very little difference in price between
this store brand products and other brand
National brands 5 4 3 2 1
4. . Money we pay in this store is worthy. 5 4 3 2 1
5. I don’t need to try a brand to know how good
it is, the information on the packing tells me
everything 5 4 3 2 1
6. The store brand products are available in
different weights. 5 4 3 2 1
7. The shop is in convenient distance from my
house 5 4 3 2 1
8. Prices are affordable to my family budgets. 5 4 3 2 1
9. After selecting the brand, I feel regretted for
selecting that brand. 5 4 3 2 1
10. All brands are same in quality. 5 4 3 2 1
11. I assess the quality of brand by reading the
information on the package. 5 4 3 2 1
12. I check the prices of few brands before
buying. 5 4 3 2 1
13. Good quality products are higher in prices 5 4 3 2 1
14. The products sold are of good quality 5 4 3 2 1
15. No big difference in quality among different
brands. 5 4 3 2 1
16. I choose brands based on the written 5 4 3 2 1
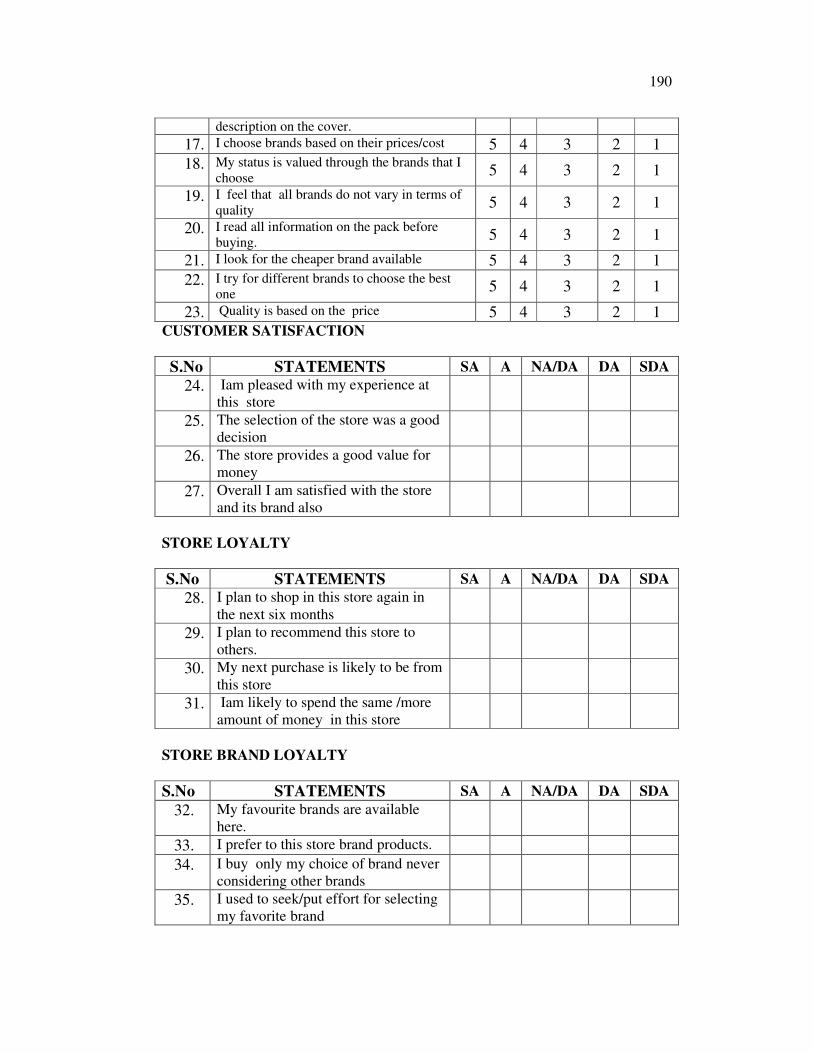
190
description on the cover.
17. I choose brands based on their prices/cost 5 4 3 2 1
18. My status is valued through the brands that I
choose 5 4 3 2 1
19. I feel that all brands do not vary in terms of
quality 5 4 3 2 1
20. I read all information on the pack before
buying. 5 4 3 2 1
21. I look for the cheaper brand available 5 4 3 2 1
22. I try for different brands to choose the best
one 5 4 3 2 1
23. Quality is based on the price 5 4 3 2 1
CUSTOMER SATISFACTION
S.No STATEMENTS SA A NA/DA DA SDA
24. Iam pleased with my experience at
this store
25. The selection of the store was a good
decision
26. The store provides a good value for
money
27. Overall I am satisfied with the store
and its brand also
STORE LOYALTY
S.No STATEMENTS SA A NA/DA DA SDA
28. I plan to shop in this store again in
the next six months
29. I plan to recommend this store to
others.
30. My next purchase is likely to be from
this store
31. Iam likely to spend the same /more
amount of money in this store
STORE BRAND LOYALTY
S.No STATEMENTS SA A NA/DA DA SDA
32. My favourite brands are available
here.
33. I prefer to this store brand products.
34. I buy only my choice of brand never
considering other brands
35. I used to seek/put effort for selecting
my favorite brand

191
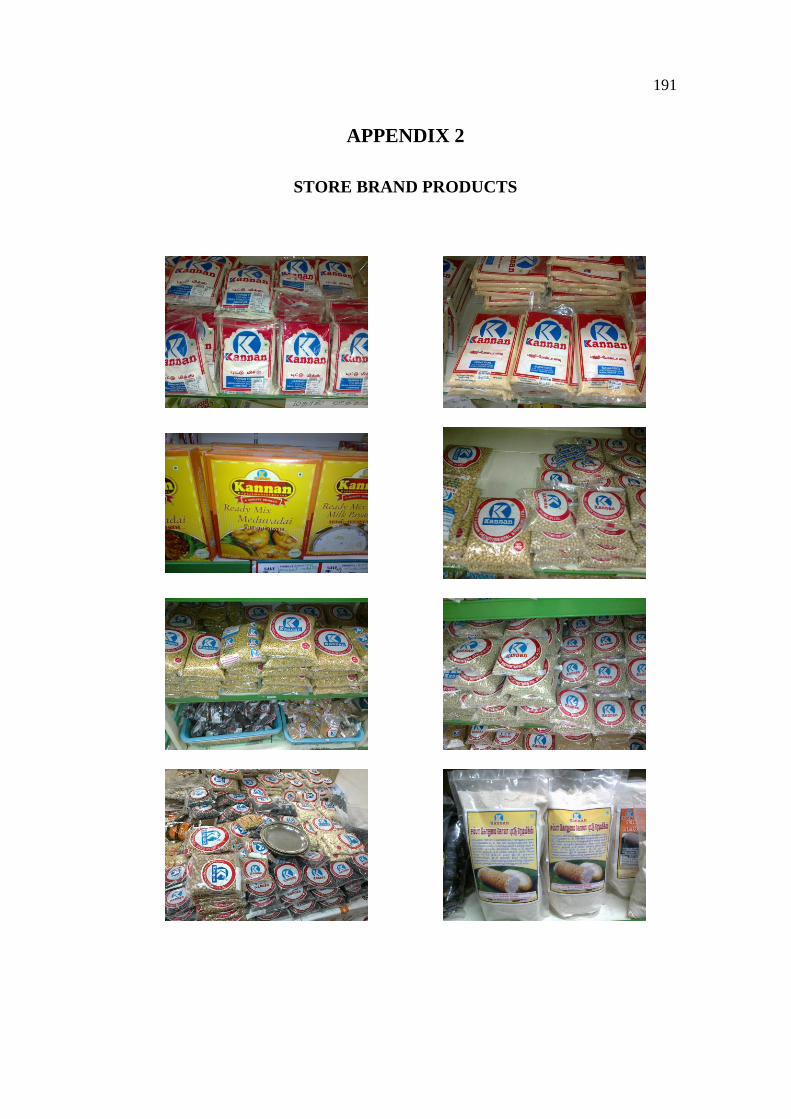
191
APPENDIX 2
STORE BRAND PRODUCTS
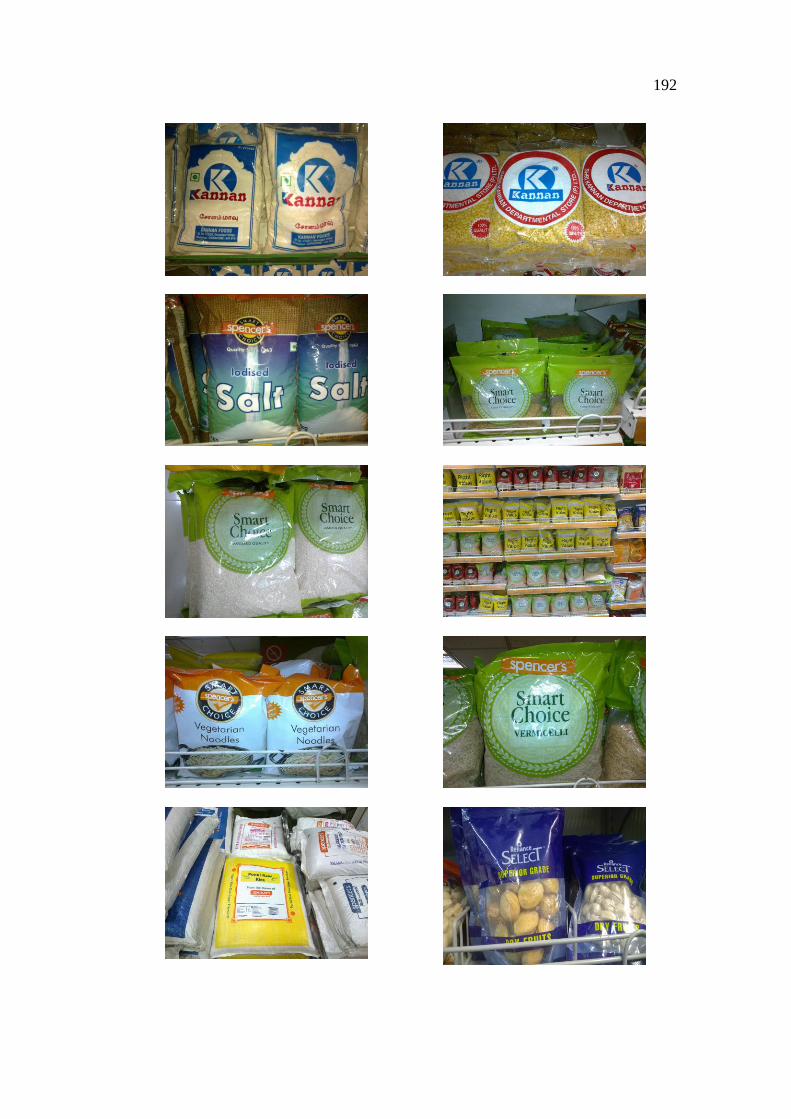
192

193
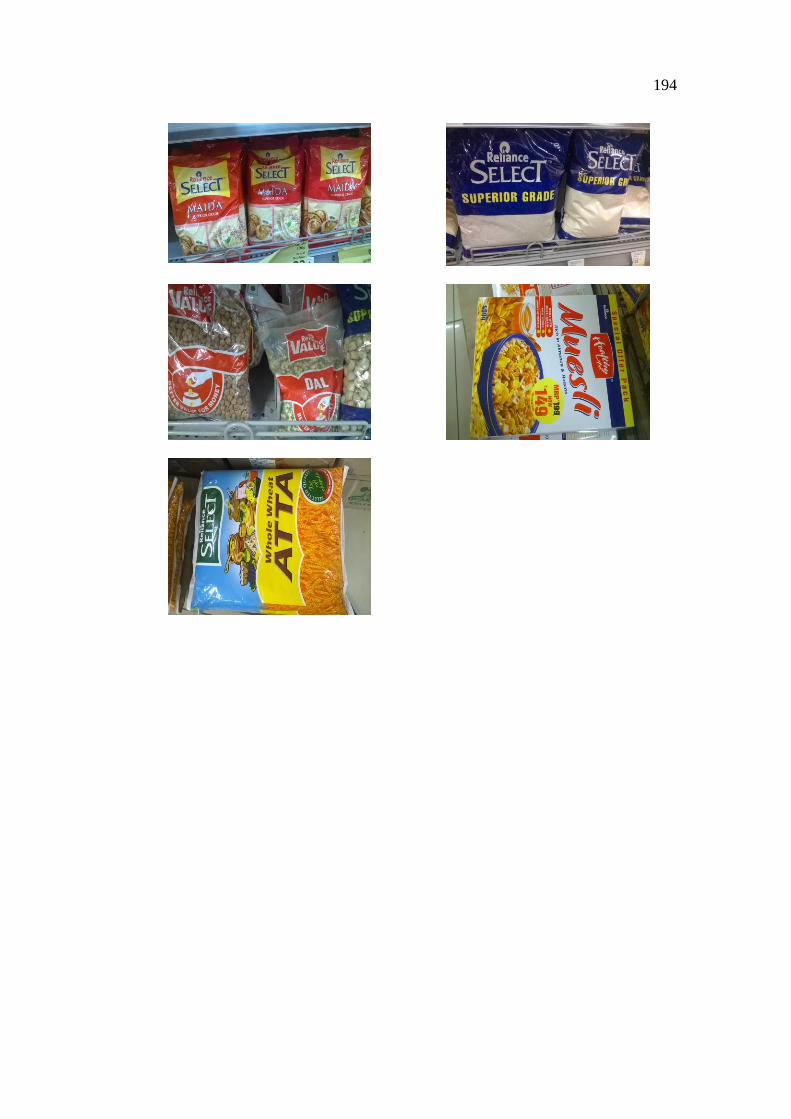
194
195
REFERENCES
Abhishek & Abraham Koshy 2008, ‘Quality perceptions of private label
brands’, Indian Institute of Management, Research and Publication,
pp.1-22.
AC Nielsen 2005, ‘The power of private label 2005. A review of growth
trends around the world’, Executive News Report, Global Services.
Ailawadi, K, Pauwels, K & Steenkamp JB 2008, ‘Private label use and store
loyalty, Journal of Marketing Research, vol. 72, no. 6, pp. 19-30.
Ailawadi, KL & Harlam, B 2001, ‘The effects of store brands on retailer
profitability: an empirical analysis’, Working paper, Tuck Business
School, Dartmouth College, Hannover, NH.
Ailawadi, KL & Harlman, B 2004, ‘An empirical analysis of the determinants
of retail margins: the role of store-brand share’, Journal of Marketing,
vol. 68, pp. 147-65.
Ailawadi, KL & Keller, KL 2004, ‘Understanding retail branding: Conceptual
insights and research priorities, Journal of Retailing, vol. 80, no. 4,
pp. 331-342.
Ailawadi, KL 2001, ‘The retail power performance conundrum: What have
we learned?’, Journal of Retailing, vol. 77, no. 3, pp. 299-318.
Alhemoud, M 2004, ‘Shopping behaviour of supermarket customers in
Kuwait’, Journal of Business and Economic Research, vol. 6, no. 3,
pp. 47-58.
Ali, J 2010, ‘Buying behaviour of consumers for food products in an
emerging economy’, British Food Journal, vol. 112, no. 2,
pp. 109-124.
Amit, P & Joshi, M 2011, ‘A comparative study on consumers attitude
towards private labels: A focus of gujarat’, The IUP Journal of
Marketing Management, vol. 10, no. 1, pp. 19-24.
Anderson, EW & Fornell, C 1994, ‘A customer satisfaction research
prospectus’, In Rust R.T. and Oliver R.L. (Eds). Service Quality: New
Direction in theory and practice. Thousand Oaks, C.A: Sage Publication,
pp. 241-68.
196
Anderson, JC & Gerbing, DW 1988, ‘Structural equation modeling in
practice: a review and recommended two-step approach’, Psychological
Bulletin, vol. 103, no. 3, pp. 411-23.
Anselmsson, J & Johansson, U 2007, ‘Are the retailer motives of private label
brands fulfilled?: Creation of brand value, brand loyalty and the effect
on store image and store loyalty: Working Paper Series’, Lund Institute
of Economic Research, Lund University.
Apelbaum, E, Gerstner, E & Naik, PA 2003, ‘The effects of expert quality
evaluations versus brand name on price premiums’, Journal of Product
& Brand Management, vol. 12, no. 2/3, pp. 154-65.
Applebaum William 1996, ‘Methods for determining store trade areas, market
penetration and potential sales’, Journal of Marketing Research, vol. 3,
pp. 127-141.
Arnold, Stephen, J, tae, H, Ourn, Tigert & Douglas, J 1983, ‘Determining
attributes in retail patronage: Seasonal, temporal, regional and
international comparisons’, Journal of Marketing Research, vol. 20, pp.
149-157.
Arshad, SA & Hisam, MW 2008, ‘Issues in Retailing’. Eds. Aneet and
Ramanjeet Singh, Deep Deep Publications Pvt. Ltd., pp. 109-118.
Ashley, SR 1998, ‘How to effectively compete against private-label brands’,
Journal of Advertising Research, vol. 38, no. 1, pp. 75-82.
Assael, H 1998, ‘Consumer behavior and marketing action’, 6th
ed.
Cincinnati, OH: South Western College Publishing.
Auckland University of Technology, New Zealand, 2009.
Azad, Private Labels in the Indian Retail sector, Advertising Express, vol. 10,
no. 9, pp. 12-15, 2010.
Bacon, LD 1997, Using Amos for Structural Equation Modeling in Market
Research, SPSS, Chicago, IL.
Bagozzi, RP & Heatherton, TF 1994, ‘A general approach to representing
multifaceted personality constructs: application to state self-esteem’,
Structural Equation Modeling, vol. 1 no. 1, pp. 35-67.
Bagozzi, RP 1980, ‘Casual models in marketing’, Journal of Consumer
Research, New York: Wiley, vol. 17, no. 2, pp. 127-140.
197
Baidyaray Debjani 2011, ‘Changing face of apparel retail in India’, Retail
Biz, vol. 8, no. 11, pp. 9-14.
Baker, J, Parasuraman, A, Grewal, D & Voss, GB 2002, ‘The influence of
multiple store environment cues on perceived merchandise value and
patronage intentions’, Journal of Marketing, vol. 66, no. 2,
pp. 120-141, 2002.
Baltas, G & Argouslidis, PC 2007, ‘Consumer characteristics and demand for
store brands, International Journal of Retail & Distribution
Management, vol. 35, no. 5, pp. 328-341.
Baltas, G & Doyle, P 1998, ‘An empirical analysis of private brand demand
recognising heterogeneous preferences and choice dynamics. The
Journal of the Operational Research Society, vol. 49, no. 8,
pp.790-798.
Baltas, G 1997, ‘Determinants of store brand choice: A behavioral analysis’,
Journal of Product and Brand Management, vol. 6, no. 5, pp. 315-324.
Baltas, G 2003, ‘A combined segmentation and demand model for store
brands, European Journal of Marketing, vol. 37, no. 10, pp. 1499-513.
Bandalos, DL & Finney, SJ 2001, ‘Item parceling issues in structural equation
modeling in new developments and techniques’, Lawrence Erlbaum
Associates, Inc., Mahwah, NJ.
Barnett, ML, Jermier, JM & Lafferty, BA 2006, ‘Corporate reputation: the
definitional landscape’, Corporate Reputation Review, vol. 9, no. 1,
pp. 26-38.
Batra, R & Sinha, I 2000, ‘Consumer-level factors moderating the success of
private label brands’, Journal of Retailing, vol. 76, no. 2, pp. 175-191.
Bauer, RA 1967, ‘Consumer behavior as risk taking. In Risk taking and
information handling in consumer behavior’, ed. D.F. Cox, Boston:
Division of Research, Graduate School of Business Administration,
Harvard University, pp. 23-33.
Beldona, S & Wysong, S 2007, ‘Putting the ‘Brand’ back into store brands:
An exploratory examination of store brands and brand personality’,
Journal of Product and Brand Management, vol. 16, no. 4.
198
Bellizi, JA, Hamilton JR, Kruekeberg, HF, Martin, WS 1981, ‘Consumer
Perceptions of national, private and generic brands’, Journal of
Retailing, vol. 57, no. 4, pp. 56-70.
Bergès-Sennou, F, Bontems, P & Réquillart, V 2003, ‘Economic impact of
the development of private labels, paper presented at the first biennial
conference of the food system research group’, Madison.
Berthon, P, Hulbert, JM & Pitt, LF 1999, ‘Brand management
prognostications’, Sloan Management Review, vol. 40, no. 2, pp. 53-65.
Bettman, JR 1973, ‘Perceived risk and its components: A model and
empirical test’, JMR, Journal of Marketing Research (pre-1986),
vol. 10, no. 2, pp. 184-190.
Bloemer, J & De Ruyter, K 1998, ‘On the relationship between store image,
store satisfaction and store loyalty’, European Journal of Marketing, vol.
32, no. 5/6, pp. 499-513.
Bloemer, JMM & Kasper, JDP 1995, ‘The Complex relationship between
consumer satisfaction and brand loyalty’, Journal of Economic
Psychology, 16, pp. 311-329. http://dx.doi.org/10.1016/ 0167-4870
(95)00007-B, 1995.
Bonfrer, A & Chintagunta, PK 2004, ‘Store brands: who buys them and what
happens to retail prices when they are introduced?’, Review of Industrial
Organization, vol. 24, no. 2, pp. 195-217.
Bordens, K. S & Abbott, BB 1996, ‘Research design and methods: a process
approach, Third Edition, In. California USA: Mayfield Publishing
Company.
Bryman, A & Bell, E 2003, Business Research Methods, Hampshire: Oxford
University Press.
Bryne, BM & Mahwah, NJ, Structural Equation Modeling with AMOS,
Lawerence Erlbaum Associates.
Burger, PC & Schott, B 1972, ‘Can private brand buyers be identified?’,
Journal of Marketing Research, vol. 9, pp. 219-222.
Burns, AC & Bush, RF 2006, ‘Marketing Research’, 5th
Edition, Pearson
Education, New Jersey, USA.
199
Burt, SL 2000, ‘The strategic role of retail brands in British grocery retailing’,
European Journal of Marketing, vol. 34, no. 8, pp. 875-890.
Burton, S, Lichtenstein, DR, Netemeyer, RG & Garretson, JA 1998,
‘A scale for measuring attitude toward private label products and an
examination of its psychological and behavioral correlates’, Journal of
the Academy of Marketing Science, vol. 26, no. 4, pp. 293-306.
Cardello, AV 1994, ‘Consumer expectations and their role in food
acceptance,’ In: MacFie H.J.H. and Thomson D.M.H. eds. Measurement
of food preferences. London: Blackie Academic and Professional, pp.
253-297.
Chen, K, Murrad, A, Veeman, M, Unterschultz, J & Le, T 2002, ‘Relative
important rankings for pork attributes by Asian – Origin consumers in
California, applying an ordered probit model to a choice based sample’,
Journal of Agriculture and Applied Economics, vol. 34, no. 1, pp. 67-79.
Chen, S 2005, ‘An empirical investigation of category-level effects of
consumer factors on private label purchase’, Thesis (Master). Auckland
University of Technology, Auckland, New Zealand.
Cheng, EWL 2001, ‘SEM being more effective than multiple regression in
parsimonious model testing for management development research’,
Journal of Management Development, vol. 20, no. 7, pp. 650-67.
Choi, CS & Coughlan, AT 2006, ‘Private label positioning: quality versus
feature differentiation from the national brand’, Journal of Retailing,
vol. 82, no. 2, pp. 79-93.
Chowdhury, J, Reardon, J & Srivastava, R & 1998, ‘Alternative modes of
measuring store image: An empirical assessment of structured versus
unstructured measures’, Journal of Marketing Theory and Practice,
vol. 6, pp. 72-86.
Churchill, GA & Iacobucci, D 2002, ‘Marketing research: methodological
foundations. 8th
ed, Orlando: Harcourt College Publishers.
Churchill, GA & Surprenant, C 1982, ‘An Investigation into the Determinants
of Customer Satisfaction, Journal of Marketing Research,
19(November), http://dx.doi.org/10.2307/3151722, pp. 491-504.

200
Collins-Dodd, C & Lindley, T 2003, ‘Store brands and retail differentiation:
The influence of store image and store brand attitude on store own brand
perceptions’, Journal of Retailing and Consumer Services, vol. 10, no. 6,
pp. 345-352.
Connor, JM & Peterson, EB 1992, ‘Market-structure of national brand –
private label price differences of manufactured food products’, Journal
of Industrial Economics, vol.10, no.2, pp.157-71.
Craig, Samuel C., Ghosh, Avijit, McLafferty and Sara. ‘Models of retail
location process: A review’, Journal of Retailing, Vol.60, pp.5-26, 1984.
CRISIL Research. Organized food retailing can increase rural income, cut
inflation – Resultant increase in rural spending can boost GDP, Insight
in Industry, June, 2007.
Cronin, JJ, Jr & Taylor, SA 1982, ‘Measuring service quality: a re-
examination and extension’, Journal of Marketing, http://dx.doi.org/
10.2307/1252296, vol. 56 (July), pp. 55-68.
Cunningham, ICM, Hardy, AP & Imperia, G 1982, ‘Generic brands versus
national brands and store brands: A comparison of consumers'
preferences and perceptions’, Journal of Advertising Research, vol. 22,
no. 5, pp. 25-32.
D’Astous, A & O 2005, ‘Saint-louis national versus store brands effect on
consumer evaluations of a garment’, Journal of Fashion Marketing and
Management, pp. 306-317.
Dabholkar, PA, Thorpe, DI & Rentz, JO 1996, ‘A measure of service quality
for retailstores: scale development and validation’, Journal of the
Academy of Marketing Science, vol. 24, no. 1, pp. 3-16.
Dawar, N & Parker, P 1994, ‘Marketing universals: consumers' use of brand
name, price, physical appearance, and retailer’, Journal of Marketing,
vol. 58, no. 2, P. 81.
Dawson, J, Findlay, A & Sparks, L (Eds.) 2008, The retailing reader,
Abingdon, UK: Routledge.
De, Wulf, KG, Odekerken-Schröder, F, Goedertier & G, ‘Van ossel.
Consumer perceptions of store brands versus national bands’, The
Journal of Consumer Marketing, vol. 22, no. 4/5, pp. 223-232.
201
Delgado-Ballester, E & Munuera-Alema´n, JL 2001, ‘Brand trust in the
context of customer loyalty’, European Journal of Marketing, vol. 35,
no. 11, pp. 1238-58.
Delgado-Ballester, E., Munuera-Alema´n, J.L. and Yagu¨ e-Guille´n, M.J.
‘Development and validation of a brand trust scale’, International
Journal of Market Research, vol. 45, no. 1, pp. 35-53, 2003.
DelVecchio, D 2001, ‘Consumer perceptions of private label quality: The role
of product category characteristics and consumer use of heuristics’,
Journal of Retailing and Consumer Services, vol. 8, no. 5, pp. 239-249.
Dhar, SK & Hoch, SJ 1997, ‘Why store brand penetration varies by retailer,
Marketing Science, vol. 16, no. 3, pp. 208-227.
Dick A, Jain, A & Richardson, P 1995, ‘Correlates of store brand proneness:
Some empirical observations’, The Journal of Product and Brand
Management, vol. 4, no. 4, pp. 15-22.
Dick, AS, Jain, AK & Richardson, PS 1996, ‘How consumers evaluate store
brands’, Journal of Product and Brand Management, vol. 5, pp. 19-28.
Dimitriadis, S & Langeard, E 1990, ‘Limits of brand extensions: an empirical
study of consumer reactions to retailer’s corporate brand extensions,
institut d’administration des entreprises of aix-en-provence, puyricard.
Dodds, WB, Kent, BM & Dhruv, G 1991, ‘Effect of price, brand and store
information on buyers,’ Product Evaluation, Journal of Marketing
Research, vol. 28, pp. 307-319. http://dx.doi.org /10.2307/3172866.
Dowling, GR & Staelin, RA 1994, ‘Model of perceived risk and intended
risk-handling activity’, Journal of Consumer Research, vol. 21,
pp. 119-134.
Dunn, MG, Murphy, PE & Skelly, GU 1986, ‘Research Note: The influence
of perceived risk on brand preference for supermarket products’,
Journal of Retailing, vol. 62, no. 2, pp. 204-216.
Dunne, D & Narasimhan, C 1999, ‘The new appeal of private labels’ Harvard
Business Review, vol. 77, no. 3, pp. 41-52.
East, R, Hammond, K, Harris, P & Lomax, W 2000, ‘First-store loyalty and
retention’, Journal of Marketing Management, vol. 16, pp. 307-25.
202
Erdem T & Swait, J 1998, ‘Brand equity as a signaling phenomenon’, Journal
of Consumer Psychology, vol. 7, no. 2, pp. 131-157.
Erdem, T, Zhao, Y & Valenzuela, A 2004, ‘Performance of store brands: A
cross-country analysis of consumer store-brand preferences’,
Perceptions and Risk.
Erickson, GM & Johansson, JK 1985, ‘The Role of price in multi-attribute
product evaluations’, Journal of Consumer Research, vol. 12, no. 2,
pp. 195-199.
Esbjerg, L, Grunert, KG, Bech-Larsen, T, Juhl, HJ & Brunsø, K 2004,
‘Manufacturer and retailer brands in food retail assortments: Notes from
a shopping trip across Europe: MAPP Working Paper No. 85, Aarhus
School of Business, Aarhus.
FDI Policy in Multibrand Retail. Ministry of Commerce, Government of
India. 28 November 2011. http://commerce.nic.in/pressrelease/
pressrelease_detail.asp.
Fernie, J, Fernie, S, Moore, C 2003, Principles of Retailing, Butterworth-
Heinemann, Oxford.
Finlay. Grocery Shopping in the UK: A Study of Consumers, 2007.
Fitzell, Philip, B 1982, ‘Private Labels: Store Brand and Generic products’,
West port, Connecticut: AVI Publishing Company.
Fitzell, Philip, B 1998, ‘The explosive growth of private labels in North
America’, New York: Global Books.
Fornell, C 2009, ‘A national customer satisfaction barometer: the swedish
experience’, Journal of Marketing, vol. 56, no. 3, pp. 6-21.
Fraser Alison 2009, ‘Attitudes to private labels: the role of store image’,
pp.1-9.
Gabrielsen, TS & Sorgard, L 2007, ‘Private labels, price rivalry and public
policy’, European Economic Review, vol. 51, no. 2, pp. 403-424.
Gamliel & Herstein 2007, ‘The Effect of framing on willingness to buy
private brands’, Journal of Consumer Marketing, vol. 24, no. 6.
203
Garretson, J, Fisher, D & Burton, S 2002, ‘Antecedents of private label
attitude and brand promotion attitude: Similarities and differences’,
Journal of Retailing, vol. 78, no. 2, pp. 91-99.
Garretson, JA & Burton, S 1998, ‘An examination of the economic,
shopping-related and psychological profiles of highly coupon and sale
prone consumers’, American Marketing Association. Conference
Proceedings, vol. 9, pp. 36-37.
Gautschi & David, A 1981, ‘Specification of patronage models for retail
centre choice’, Journal of Marketing Research, vol. 18, pp. 162-174.
Ghosh, P, Tripathi, V & Kumar, A 2010, ‘Customer expectations of store
attributes: A study of organized retail outlets in India’, J. Retail &
Leisure Property, vol. 9, no. 1, pp. 75-87.
Giraldi, JM, E, Spinelli, PB & Merlo, EM 2003, ‘Retail store image: analysis
of the implications for store positioning’, READ - Revista Eletrônica de
Administração, vol. 9, no. 36.
Go´ mez, M & A, Ferna´ ndez 2009, ‘Consumer-level factors that influence
store brand proneness: An empirical study with Spanish consumers’,
Journal of Euromarketing, vol. 18, no. 1, pp. 23-34.
Gonza´ lez, C, Dı´az, A & Trespalacios, J 2006, ‘Antecedents of the
differences in perceived risk between store brands and national brands,’
European Journal of Marketing, vol. 40, no. 1/2, pp. 61-82.
Grant, AWH & Schlesinger, LA 1995, ‘Realize your customer's full profit
potential’, Harvard Business Review, vol. 73, no. 5, pp. 59-72.
Gremler, DD & Brown, SW 1996, ‘Service loyalty: its nature, importance,
and implications, in Edwardson, B, Brown, SW & Johnston, R (Eds),
advancing service quality: A Global perspective’, International Service
Quality Association, pp. 171-180.
Grewal, D, Levy, M & Lehmann, DR 2004, ‘Retail branding and customer
loyalty: An overview’, Journal of Retailing, vol. 80, no. 4.
Guerrero, L, Colomer, Y, Guàrdia, MD, Xicola, J & Clotet, R 2000,
‘Consumer attitude towards store brands’, Food Quality and Preference,
vol. 11, no. 5, pp. 387-395.
Hair, JFJ, Anderson, RE, Tatham, RL & Black, WC 1998, ‘Multivariate data
analysis’, 5th
ed., Prentice-Hall, Upper Saddle River, NJ.

204
Hansen, T & Solgaard, HS 2004, ‘New perspectives on retailing and store
patronage behaviour: A study of the interface between retailers and
consumers’, Dordrecht, The Netherlands: Kluwer Academic Publishers.
Hansen, T 2001, ‘Quality in the marketplace: A theoretical and empirical
investigation’, European Management Journal, vol. 19, no. 2,
pp. 203-211.
Harcart, A, Kara & Kucukemiroglu, O 2006, ‘Consumer’s perceived value
and buying behavior of store brands: An empirical investigation’, The
Business Review, vol. 5, no. 2, pp. 55- 61.
Hariprakash 2011, ‘Private labels in Indian retail industry’, International
Journal of Multidisciplinary Research, vol. 1, no. 8, pp. 1-3.
Harraway, JA 1995, ‘Introductory statistical methods for biological, health
and social sciences’, Dunedin... Dunedin, University of Otago, P. 305.
Hartman, KB & Spiro, RL 2005, ‘Recapturing store image in customer-based
store equity: a construct conceptualization’, Journal of Business
Research, vol. 58 no. 8, pp. 1112-20.
Hawkins, DI, Best, RJ & Coney, KA 2004, ‘Consumer behavior: building
marketing strategy’, 9th
edn. New York: McGraw-Hill.
Herstein & Tifferet 2007, ‘An Investigation of the new generic consumer,’
Journal of Consumer Marketing, vol. 24, no. 3.
Herstein, R & Gamliel, E 2004, ‘An investigation of private branding as a
global phenomenon’, Journal of Euromarketing, vol. 13, no. 4,
pp. 59-77.
Heskett, JL, Jones, TO, Loveman, GW, Sasser, WE, Jr & Schlesinger, LA
1994, ‘Putting the service profitchain to work’, Harvard Business
Review, March-April, pp. 105-11.
Hoch, SJ & Banerji, S 1993, ‘When do private labels succeed?’, Sloan
Management Review, vol. 34, no. 4, pp. 57-67.
Hoch, SJ & Lodish, LM 1998, ‘Store brands and category management,
Unpublished working paper’, University of Pennsylvania.
Hong Youl Ha 2009, ‘Effects of two types of service quality on brand equity
in china: the moderating roles of satisfaction, brand associations, and
brand loyalty’, Seoul Journal of Business, vol. 15, no. 2, pp. 59-83.
205
Hoch, SJ 1996, ‘How should national brands think about private labels?’,
Sloan Management Review, vol. 37, no. 2, pp. 89-102.
Hoch, SJ, Montgomery, AL & Park, Y-H 2002, ‘Why private labels show
long-term market share evolution, School of Management’, Cornell
University.
Hodge, DR & Gillespie, D 2003, ‘Phrase completions: An alternative to
likert scales’, Social Work Research, vol. 27, no. 1, pp. 45-55.
Holbrook, JAD & Hughes, LP 1998, ‘Innovation in enterprises in British
columbia, in de La Mothe, J & Paquet, G (Eds), Local and Regional
Systems of Innovation’, Kluwer Academic, Boston, MA.
Holbrook. MB 1994, ‘The Nature of customer value: An axiology of services
in the consumption experience, in Roland T, Rust and Richard L, Oliver,
eds. Service Quality: New Directions in Theory and Practice’, Thousand
Oaks, CA: Sage Publications, Inc., pp. 21-71.
Howard, JA & Sheth, JN 1969, ‘The theory of buyer behavior’, New York:
John Wiley and Sons.
Hoyle, RH 1995, ‘The structural equation modeling approach: basic concepts
and fundamental issues’, in Hoyle, RH. (Ed.), Structural Equation
Modeling: Concepts, Issues and Applications, Sage, Thousand Oaks,
CA.
Huang, MH 2009, ‘Using service quality to enhance the perceived quality of
store brands’, Total Quality Management & Business Excellence, vol.
20, no. 2, pp. 241-252.
Hubbard, Raymond. ‘A review of selected factors conditioning consumer
travel behaviour’, Journal of Consumer Research, vol. 5, pp. 1-21.
Huff David, L 1964, ‘Defining and estimating a trade area’, Journal of
Marketing, vol. 18, pp. 34-38.
Hyllegard, Karen, Eckman, Molly, Descals, Alejandro Molla & Borja, Miguel
Angel Gomez 2005, ‘Spanish consumers’ perceptions of US apparel
speciality retailers’ products and services’, Journal of Consumer
Behaviour, vol. 4, no. 5, pp. 345-362.
206
Ivana Blešić, Dragan Tešanović & Dorne Psodorov 2011, ‘Consumer
satisfaction and quality management in the hospitality industry in South-
East Europe’, African Journal of Business Management, vol. 5, no. 4,
pp. 1388-1396.
Iyengar, SS & Lepper, MR 2000, ‘When choice is demotivating: Can one
desire too much of a good thing?’, Journal of personality and social
psychology, vol. 79, no. 6, pp. 995-1006.
Jin, B & Suh, Y 2005, ‘Integrating effect of consumer perception factors in
predicting private brand purchase in a Korean discount store context’,
Journal of Consumer Marketing, vol. 22, no. 2/3, pp. 62-71.
JMR, Journal of Marketing Research, vol. 41, no. 1, pp. 86-100.
Johnson, Michael, D & Claes Fornell 1991, ‘A frame work for comparing
customer satisfaction across individuals and product categories’, Journal
of Economic Psychology, vol. 12, pp. 267-86.
Juhl, HJ, Esbjerg, L, Grunert, KG, Bech-Larsen, T & Brunsø, K 2006, ‘The
fight between store brands and national brands - What's the score?’,
Journal of Retailing and Consumer Services, vol. 13, no. 5, pp. 331-338.
Justin, B 2010, ‘Consumer perceptions of private label brands within the retail
grocery sector of South Africa’, African Journal of Business
Management, vol. 4, no. 2, pp. 203-220.
Kahn, BE & Wansink, B 2004, ‘The influence of assortment structure on
perceived variety and consumption quantities’, Journal of Consumer
Research, vol. 30, no. 4, pp. 519-533.
Kandampully, J & Suhartanto, D 2000, ‘Customer loyalty in the hotel
industry: the role of customersatisfaction and image’, International
Journal of Contemporary Hospitality Management, vol. 12, no. 6,
pp. 346-351. http://dx.doi.org /10.1108/09596110010342559.
Kapferer, JN 1986, Beyond positioning: Retailer‘s identity, Retail Strategies
for Profit and Growth, pp. 167-175.
Kapferer, JN 1995, ‘Stealing brand equity: Measuring perceptual confusion
between national brands and ‘copycat’ own-label products, Marketing
and Research Today, vol. 23, no. 2, pp. 96-103.
207
Kaul & Subhashini 2005, ‘Measuring retail service quality: Examining
applicability of international research perspectives in India’, Retrieved
on Jan. 25, 2012 from http://www.iimahd.ernet.in/publications/
data/2005-10-02skaul.pdf.
Kaul, A 2006, ‘Conceptual note on influencing store loyalty: Implications for
Indian retailers, http://www.iimahd.ernet.in/ publications/data/2006-10-
06_skaul.pdf.
Kaul, S 2005, ‘Impact of performance and expressiveness value of store
service quality on the mediating role of satisfaction’, WP No. 3 October,
IIMA.
Keller, KL 1998, ‘Strategic brand management: building, measuring, and
managing brand equity - 2nd edition. In. Upper Saddle River, New
Jersey: Pearson Education Inc.
Kerrie, Bridson & Melissa and Hickman, ‘Loyalty program attributes and
their influence on retail customer satisfaction’, Retrieved on Jan. 25
from http://elmurobbie.files.wordpress.com/2009/01/program loyalty
satisfaction.pdf, 2003.
Kivela J, Reece, J & Inbakaran, R 1999, ‘Consumer research in the restaurant
environment. part 2: research design and analytical methods’,
International Journal of Contemporary Hospitality Management, vol. 11,
no. 6, pp. 269-286.
Kisholoy Roy 2008, ‘Store brands in organized retails, marketing master
mind’, vol. 8, no. 12, pp. 30-36.
Knox, S & Walker, D 2001, ‘Measuring and managing brand loyalty’, Journal
of Strategic Marketing, vol. 9, no. 2, pp. 111-28.
Krishnamurthi, L & Raj, SP 1991, ‘An empirical analysis of the relationship
between brand loyalty and consumer price elasticity’, Marketing
Science, vol. 10, no. 2, pp. 172-84.
Kumar, N & Steenkamp, JB, Brand versus brand, EM, International
Commerce Review, vol. 7, no. 1, pp. 46-53.
Laaksonen, H & Reynolds, J 1994, ‘Own brands in food retailing across
Europe’, Journal of Brand Management, vol. 2, no. 1, pp. 37-46.
Laaksonen, H & Reynolds, J 2002, ‘Own brands in food retailing across
Europe’, Retailing: Critical Concepts, vol. 2, no. 1, P. 225.
208
LaBarbera, PA & Mazursky, D 1983, ‘A longi-tudinal assessment of
consumer satisfaction/ dissatisfaction:the dynamic aspect of the
cognitive process’, Journal of Marketing Research, vol. 20,
pp. 393-404. http://dx.doi.org/10.2307/3151443.
Labeaga, J, Lado, N & Martos, M 2007, ‘Behavioral loyalty towards store
brands’, Journal of Retailing and Consumer Services, vol. 14, no. 5,
pp. 347-56.
Lacoeuilhe, J 2001, ‘Attitude envers la marque de distributeur et rôle dans la
fidélisation à l’enseigne proposition d’un cadre d’étude. Acte du 17eme
congrès international de l’AFM. Deauville. France.
Lambert, DR 1981, ‘Price as a quality cue in industrial buying’, Academy of
Marketing Science. Journal, vol. 9, no. 3, pp. 227-238.
Lancaster, KJ 1996, ‘A new approach to consumer theory’, The Journal of
Political Economy, vol. 74, no. 2, pp. 132-157.
Laurent, G & Kapferer, JN 1985, ‘Measuring consumer involvement
profiles’, JMR, Journal of Marketing Research, vol. 22, no. 1,
pp. 41-53.
Lee, D & Hyman, MR 2008, ‘Hedonic/functional congruity between stores
and private label brands, The Journal of Marketing Theory and Practice,
vol. 16, no. 3, pp. 219-232.
LEE, D 2004, ‘Image congruence and attitudes toward private brands’,
Advances in Consumer Research, vol. 31, pp. 435-441.
Leung, V & Oppewal, H 1999, ‘Effects of brand and store names on
consumer store choice, http://smib.vuw.ac.nz:8081/www/
ANZMAC1999/Site/ L/ Leung.pdf.
Lewison, Dale, M & Wesley Balderson, D 1999, Retailing: Canadian Edition.
Prentice Hall, Scarborough, Ontario.
Lichtenstein, D, Netemayer, R & Burton, S 1990, ‘Distinguishing coupon
proneness from value consciousness: An acquisition-transaction utility
theory perspective’, Journal of Marketing, vol. 54, no. 3, pp. 54-67.
Liljander, V, Polsa, P & Riel, A 2009, ‘Modelling consumer responses to an
apparel store brand: store image as a risk reducer’, Journal of Retailing
and Consumer Services, vol. 16, pp. 281- 290.
209
Lindquist, JD 1974, ‘Meaning of image’, Journal of Retailing, vol. 50, no. 4,
pp. 29-38.
Little, TD, Cunningham, WA, Shahar, G & Widaman, KF 2002, ‘To parcel or
not to parcel: exploring the question, weighing the merits’, Structural
Equation Modeling, vol. 9, no. 2, pp. 151-73.
Liu, TC & Wang, CY 2008, ‘Factors affecting attitudes toward private labels
and promoted brands’, Journal of Marketing Management, vol. 24,
no. 3-4, pp. 283-298.
Livesey, F & Lennon, P 1978, ‘Factors affecting consumers’, Choice between
manufacturer brands and retailer own brand’, European Journal of
Marketing, vol. 12, no. 2, pp. 158-170.
Louviere, Jordan J, Gaeth, Gary, J, ‘Decomposing the determinants of retail
facility choice using the method of hierarchical information integration:
A supermarket illustration’, Journal of Retailing, vol. 63, pp. 25-48.
Macintosh, G & Lockshin, LS, ‘Retail relationships and store loyalty: a multi-
level perspective’, International Journal of Research in Marketing,
vol. 5, pp. 487-97.
Manolis, C, Keep, WW, Joyce, ML & Lambert, DR 1994, ‘Testing the
underlying structure of a store image scale’, Educational and
Psychological Measurement, vol. 54, no. 3, pp. 628B645.
Mark & Chen, S 2009, ‘Consumer factors moderating private label brand
success: further empirical results’, International Journal of Retail &
Distribution Management, vol. 37, no. 1.
Martenson, R 2007, ‘Corporate brand image, satisfaction and store loyalty: A
study of the store as a brand, store brands and manufacturer brands’,
International Journal of Retail & Distribution Management, vol. 35,
no. 7, pp. 544-555.
Martineau, P 1985, ‘The personality of the retail store’, Harvard Business
Review, vol. 36, pp. 47-55.
Mazursky, D & Jacoby, J 1986, ‘Exploring the development of store images’,
Journal of Retailing, vol. 62, no. 2, pp. 145-165.
McGoldrick, PJ 1984, ‘Grocery generics-An extension of the private label
concept’, European Journal of Marketing, vol. 18, no. 1, pp. 5-24.

210
McMaster, D 1987, ‘Own brands and the cookware market’, European
Journal of Marketing, vol. 21, no. 1, pp. 83-94.
Medina, O, Me´ndez, J & Rubio, N 2002, La relacio´ n precio-calidad en los
mercados degran consumo. Ana´ lisis comparativo entre marcas de
distribuidor y marcas de fabricante, Informacio´n Comercial Espan˜ola,
vol. 801, pp. 181-200.
Méndez, JL, Oubiña, J & Rubio, N 2008, ‘Expert quality evaluation and price
of store vs. manufacturer brands: An analysis of the Spanish mass
market’, Journal of Retailing and Consumer Services, vol. 15, no. 3,
pp. 144-155.
Meyer, JP & Allen, NJ 1991, ‘A three-component conceptualization of
organizational commitment’, Human Resource Management Review,
vol. 1, no. 1, pp. 61-89.
Miao, X 2003, ‘Consumer preferences for fresh meat attributes and retail
outlets in china : The Case of Hangzhou and Shanghai’, Master of
Science in Agriculture and Resource Economics, Department of Rural
Economics, Edmonton, University of Alberta.
Mieres, CG, Martín, AMD & Gutiérrez, JAT 2006, ‘Antecedents of the
difference in perceived risk between store brands and national brands’,
European Journal of Marketing, vol. 40, no. 1/2, pp. 61-82.
Mills, DE 1999, ‘Private labels and manufacturer counterstrategies’,
European Review of Agricultural Economics, vol. 26, no. 2,
pp. 125-145.
Mills, DE 2002, ‘Why Retailers Sell Private Labels’, Journal of Economics
and Management Strategy, vol. 4, no. 3, pp. 509-528.
Miranda, MJ & Joshi, M 2003, ‘Australian retailers need to engage with
private labels to achieve competitive difference’, Asia Pacific Journal of
Marketing and Logistics, vol. 15, no. 3, pp. 34-47.
Mitchell, VW 2001, ‘Re-conceptualizing consumer store image processing
using perceived risk’, Journal of Business Research, vol. 54, no. 2,
pp. 167-172.
Monroe, KB & Krishnan, R 1985, ‘The effect of price on subjective product
evaluation in Jacoby, J and Olson, JC (Eds), Perceived Quality: How
consumers views stores and Merchandise, DC, Heath Lexington, MA,
pp. 209-32.
211
Morris, T, Private label Prospects Good, FMCG, vol. 8, pp. 40-41.
Myers, JG 1967, ‘Determinants of private brand attitude’, Journal of
Marketing Research, pp. 73-81.
Nair Lakshmi 2011, ‘Private Labels Brands in Food & Grocery: The
Changing Perceptions of Consumers & Retailers in India – A Study in
the Pune Region’, International Referred Research Journal, vol. II,
no. 1, pp. 144-156.
Nair Suja 2011, ‘Store loyalty and visual merchandising’, Himalaya
Publishing House, pp. 249-252.
Nalini Prava Tripathy 2006, ‘A service quality model for customers in public
sector banks’, The ICFAI Journal of Bank Management, vol. 5, no. 2,
pp. 77-82.
Nandan, Sh & Dickinson, R 1994, ‘Private brands’, Journal of Consumer
Marketing, vol. 11, no. 4, pp.18-28.
Nandan, Shiva & Roger Dickinson 1994, ‘Private Brands: Major Brand
Perspective’, Journal of Consumer Marketing, vol. 11, no. 4, pp. 18-28.
Narasimhan, C & Wilcox, RT 1998, ‘Private labels and the channel
relationship: Across-category analysis’, The Journal of Business,
vol. 71, no. 4, pp. 573-600.
Nelson, P 1970, ‘Information and consumer behavior’, Journal of Political
Economy, vol. 78, no. 2, pp. 311-329.
Nielsen, AC 2001, ‘Market information digest: A comprehensive reference
book on the New Zealand grocery industry’, AC Nielsen New Zealand
Ltd, Auckland.
Nielsen, AC 2005, ‘The power of private label’, available at
www.acnielsen.se.
Oliva, TA, Oliver, RL & MacMillan, IC 1992, ‘A catastrophe model for
developing service satisfaction strategies’, Journal of Marketing, vol. 56,
pp. 83-95. http://dx.doi.org/10.2307/1252298.
Oliver, RL 1980, ‘A cognitive model of the antecedents and consequences of
satisfaction decision’, Journal of marketing Research, 17 (November),
pp. 406-409.
212
Olsen, Svein Ottar 2002, ‘Comparative evaluation and the relationship
between quality, 'satisfaction, and repurchase loyalty’, Journal of the
Academy of Marketing Science, vol. 30, no. 3, pp. 240-249.
Oliver, RL 1993, A conceptual model of service quality and service
satisfaction in Teresa A. Swartz, David E. Bowen and Stephen W.
Brown, eds, Advances in Services Marketing and Management,
Greenwich, CT:JAI Press, pp. 65-86.
Oliver, RL 1997, Satisfaction: A Behavioral Perspective on the Consumer.
Irwin/McGraw-Hill, New York, NY.
Omar, OE 1996, ‘Grocery purchase behavior for national and own label
brands’, Service Industries Journal, vol. 16, no. 1, pp. 58-66.
Osman, MZ 1983, ‘A conceptual model of retail image influence on loyalty
patronage behavior, International Review of Retail, Distribution &
Consumer Research, vol. 3, no. 2, pp. 133-48. http:// dx.doi.org/
10.1080/ 09593969300000011.
Ostrom, A & Iacobucci, I 1995, ‘Consumer Trade-offs and the evaluation of
services’, Journal of Marketing, vol. 59, no. 1, pp. 17-28.
Owen, W 2003, 'Private Labels' present challenge for marketers of branded
products, The Independent New Zealand Business Weekly, P. 30.
Patti, Charles, H & Raymond, P, Fisk 1982, ‘national advertising, brands and
channel control: An historical perspective with contemporary options’,
Journal of Academy of Marketing Science, 10(Winter/Spring),
pp. 90-108.
Pauwels, K & Srinivasan, S 2007, ‘Who benefits from store brand entry?’,
Marketing Science, vol. 23, no. 3, P. 364.
Pedro Galván Guijo 2007, ‘Merchandising of private brands vs manufacturer
brands’, ESIC Market, pp. 223-245.
Peles and Yoram 1967, ‘On the uses of private brands’, Journal of Industrial
Economics, vol. 12, pp. 173-178.
Pepe, MS, Abratt, R & Dion, P 2011, ‘The impact of private label brands on
customer loyalty and product category profitability’, Journal of Product
& Brand Management, vol. 20, no. 1, pp. 27-36. http://dx.doi.org/
10.1108/ 10610421111107996.
213
Peter, JP & Olson, JC 1990, Consumer Behavior and Marketing Strategy, 2nd
edn. Boston, MA: Irwin.
PLMA Private label manufacturing association, http://www.
plmainternational.com/en/private_label_en3.htm latest retrieved 30th
Nov. 2009.
Porter, SS & Claycomb, C 1997, ‘The influence of brand recognition on retail
store image, Journal of Product and Brand Management, vol. 6,
pp. 373-387.
Priyank Azad 2011, ‘Growing popularity of store brands in indian retail’,
Marketing Mastermind, vol. 11, no. 4, pp. 39-41.
Purdie, N & Hattie, J 2002, ‘Assessing students’ conceptions of learning’,
Australian Journal of Educational & Development Psychology, vol. 2.
Puri Sandeep & Dr. Dwiwedi Harsh 2011, ‘Going global with private labels’,
Retail Biz, vol. 8, no. 7, pp. 29-31.
Quelch, J & Harding, D 1996, ‘Brands versus private labels: Fighting to win’,
Harvard Business Review, vol. 74, no. 1, pp. 99-109.
Raju, J, Sethuraman, R & Dhar, S 1995, ‘The introduction and performance
of store brands’, Management Science, vol. 41, no. 6, pp. 957-78.
Rao, AR & Monroe, KB 1988, ‘The Moderating effect of prior knowledge
on cue utilization, Journal of Consumer Research, vol. 15, no. 2,
pp. 253-264.
Rao, AR & Monroe, KB 1989, ‘The effect of price, brand name, and store
name on buyers' perceptions of product quality: An integrative review’,
Journal of Marketing Research, pp. 351-357.
Rao, AR & Monroe, KB 1996, ‘Causes and consequences of price premiums’,
Journal of Retailing, vol. 69, pp. 511-35.
Ravichandran, K, David Sam Jayakumar & Abdus Samad, K 2008, ‘Service
quality: Food retail’, SCMS Journal of Indian Management, vol. 5,
no. 3, pp. 25-41.
Richards, T, Hamilton, SF & Patterson, PM 2007, Spatial competition in
private labels, Paper presented at the AAEA Annual Meeting, Portland,
Oregon.
214
Richardson, PS 1997, ‘Are store brands perceived to be just another brand?’,
Journal of Product and Brand Management, vol. 6, pp. 388-404.
Richardson, PS, AS, Dick & Jain AK 1994, ‘Extrinsic and intrinsic cue
effects on perceptions of store brand quality’, Journal of Marketing,
vol. 58, pp. 28-36.
Richardson, PS, Dick, AS & Jain, AK 1996, ‘The influence of store aesthetics
on evaluation of private label brands’, Journal of Product and Brand
Management, vol. 5, no. 1, pp. 19-28.
Richardson, PS, Dick, AS, & Jain, AK 1995, ‘Correlates of store brand
proneness: some empirical observations’, Journal of Product and Brand
Management, vol. 4, pp. 15-22.
Richardson, PS, Dick, AS, and Jain, AK 1996, ‘Household store brand
proneness: A framework’, Journal of Retailing, vol. 72, pp. 159-185.
Richardson. PS, Dick AS & Jain, AK 1996, ‘How consumerevaluate store
brands’, Journal of Product and Brand Management. vol. 5, no. 2,
pp. 19-28.
Rondan, F, Navarro, A & Phau, I 2006, ‘The influence of price and brand
loyalty on store brands versus national brands, The International Review
of Retail’, Distribution and Consumer Research, vol. 16, no. 4,
pp. 433-52.
Rosen, DL 1984, ‘Consumer perceptions of quality for generic grocery
products: A comparison across categories’, Journal of Retailing,
vol. 60, no. 4, P. 64.
Rothe, James, T & Lawrence, M, Lamont 1973, ‘Purchase behavior and brand
choice determinants’, Journal of Retailing, vol. 49, no. 3, pp. 19-33.
Rowley, J 2005, ‘The four Cs of customer loyalty’, Marketing Intelligence &
Planning, vol. 23, no. 6, pp. 574-581. http://dx.doi.org/ 10.1108/
02634500510624138.
Rozano, M, Go´ mez, M, & Dı´az, A 2009, ‘Customer perceptions of
perceived risk in generic drugs: The Spanish Market. INNOVAR 19’,
no. 34, pp. 53-64.
215
Samrat 2011, ‘Perceptions & buyer behavior towards private-label colas: an
exploratory study to understand the views of the store managers of
united kingdom’, The IUP Journal of Marketing Management, vol. 10,
no. 1, pp. 5-18.
Sayman, S & Raju, JS 2004a, ‘How category characteristics affect the number
of store brands offered by the retailer: A model and empirical analysis’,
Journal of Retailing, vol. 80, no. 4, pp. 279-287.
Sayman, S & Raju, JS 2004b, ‘Investigating the cross-category effects of
store brands’, Review of Industrial Organization, vol. 24, no. 2,
pp. 129-141.
Sckokai & Soregaroli 2008, ‘Impact of private label development across retail
formats: Evidences from the Italian dairy market’, Review of
Agricultural & Environmental Studies, pp. 27-47.
Scott-Morton, F & Zettelmeyer, F 2004, ‘The strategic positioning of store
brands in retailer-manufacturer negotiations, Review of Industrial
Organization, vol. 24, no. 2, pp. 161-194.
Sebastianelli, R & Tamimi, N 2002, ‘How product quality dimensions relate
to defining quality’, The International Journal of Quality & Reliability
Management, vol. 19, no. 4, pp. 442-453.
Sekaran, U 2003, ‘Research Methods for Business: a skill-building approach,
4th
Edition, In. New York: John Wiley & Sons. Inc.
Semeijn, J, Van Riel, A & Ambrosini, B 2004, ‘Consumer evaluations of
store brands: Effects of store image and product attributes’, Journal of
Retailing and Consumer Services, vol. 11, no. 4, pp. 247-58.
Sethuraman, R & Mittelstaedt, J 1992, ‘Coupons and private labels: A cross-
category analysis of grocery products’, Psychology & Marketing, vol. 9,
no. 6, pp. 487-500.
Sethuraman, R 2000, ‘What makes consumers pay more for national brands
than for store brands: image or quality?’, Marketing Science Institute
Working Paper Series, Report No. 00-110, Marketing Science Institute,
Cambridge, MA.
Sethuraman, R 2003, ‘Measuring national brands' equity over store brands’,
Review of Marketing Science, vol. 1.
216
Sharma, Dubey & Pandey 2010, ‘Customer perception of store brands vs
national brands in select are of Maharashtra’, Journal of Engineering,
Science & Management Education, vol. 4, pp. 59-65.
Chen, S 2005, ‘An Empirical Investigation of category level effects of
consumer factors on private label purchase’, Auckland University of
Technology.
Sheinin, DA & Wagner, J 2003, ‘Pricing store brands across categories and
retailers’, Journal of Product & Brand Management, vol. 12, no. 4,
pp. 201-219. http://dx.doi.org/10.1108/10610420310485023.
Shitole & Moghe 2011, ‘Unfolding the growth story of india’s modern retail
sector’, Marketing Mastermind, vol. XI, no. 7, pp. 12-18.
Sinha, I & Batra, R 1999, ‘The effect of consumer price consciousness on
private label purchase’, International Journal of Research in Marketing,
vol. 16, no. 3, pp. 237-251.
Sinha, Piyush, K & Banerjee, A 2004, ‘Store choice behaviour in an evolving
market’, International Journal of Retail & Distribution Management,
vol. 32, no. 10, pp. 482-494.
Sinha, PK 2003, ‘Shopping orientation in the evolving Indian market’,
Vikalpa, vol. 28, no. 2, pp. 13-22.
Sivadas, E & Baker-Prewitt, J 2000, ‘An examination of the relationship
between service quality, customer satisfaction and store loyalty’,
International Journal of Retail & Distribution Management, vol. 28, no.
2, pp. 73-82. http://dx.doi.org/10.1108/095905500 10315223.
Smith & Bruce 2000, ‘The Store as a brand’, DSN Retailing Today, vol. 39,
no. 23, pp. 19-20.
Soberman & Marker 2003, ‘Why private labels may increase market prices’,
W.P No: 2003/77/MKT, pp. 1-26.
Song Wei. An Empirical Investigation of manufacturing Chinese Private
Labels, Journal of Management & Marketing Research, pp. 1-12, 2011.
Sprott, DE & Shimp, TA 2004, ‘Using product sampling to augment the
perceived quality of store brands’, Journal of Retailing, vol. 80, no. 4,
pp. 305-315.

217
Steenkamp, JB, EM & Dekimpe, MG 1997, ‘The increasing power of store
brands: Building loyalty and market share’, Long Range Planning,
vol. 30, no. 6, pp. 917-930.
Steiner, RL 2004, ‘The Nature and benefits of national brand/private label
competition’, Review of Industrial Organization, vol. 24, no. 2,
pp. 105-121.
Stone, RN & Grønhaug, K 1993, ‘Perceived risk: Further considerations for
the Marketing discipline, European Journal of Marketing, vol. 27, no. 3,
pp. 39-50.
Sudhir, K & Talukdar, D 2004, ‘Does store brand patronage improve store
patronage?’, Review of Industrial Organization, vol. 24, no. 2,
pp. 143-160.
Sudman, S 1980, ‘Improving the quality of shopping center sampling, Journal
of Marketing Research, vol. 17, pp. 423-431.
Szymanski, DM & Henard, DH 2001, ‘Customer satisfaction: a meta-analysis
of the empirical evidence’, Journal of the Academy of Marketing
Science, vol. 29, no. 1, pp. 16-35.
Tabachnick, BG & Fidell, LS 2001, Using multivariate statistics, 4th
ed., New
York, Harper Collins.
Talwar, SL 2010, Organized Retail in Northern and Western States, Retailer
Magazine, vol. 5, no. 7.
Tarzijan, J 2004, ‘Strategic effects of private labels and horizontal integration,
international review of retail’, Distribution and Consumer Research,
vol. 14, no. 3, pp. 321-335.
Taylor, Susan, L & Robert, M & Cosenza 2002, ‘Profiling later aged female
teens: Mall shopping behavior and clothing choice’, Journal of
Consumer Marketing, vol. 19, no. 5, pp. 393- 408.
Tazyn Rahman 2012, ‘Organized retail industry in India– Opportunities and
challenges’, International Journal of Research in Finance & Marketing,
vol. 2, no. 2.
Thenmozhi, SP & Dhanapal, D 2010, ‘Unorganised retailing in India – A
study on retail service quality’, European Journal of Social Sciences,
vol. 23, no. 1, pp. 68-75.
218
Tripathi, S & Sinha, PK 2006, ‘Family and store choice – A conceptual
framework. WP No. 3, IIMA.
Vahie Archna & Audhesh Paswan 2006, ‘Private label brand image: its
relationship with store image and national brand’, International Journal
of Retail & Distribution Management, vol. 34, no. 1, pp. 67-8.
Vaidyanathan, R & Aggrawal, P 2000, ‘Strategic brand alliances:
Implications of ingredient branding for national and private label
brands’, Journal of product and brand management, vol. 9, no. 4/5,
pp. 214-228.
Varley, R 2005, ‘Store image as the key differentiator’, European Retail
Digest, vol. 46, pp. 18-21.
Veloutsou, C, Gioulistanis, E & Moutinho, L 2004, ‘Own labels choice
criteria and perceived characteristics in Greece and Scotland: Factors
influencing the willingness to buy’, Journal of Product and Brand
Management, vol. 13, pp. 228-241.
Verhoef, PC, Nijssen, EJ & Sloot, LM 2002, ‘Strategic reactions of
national brand manufacturers towards private labels: An empirical
study in the Netherlands’, European Journal of Marketing, vol. 36,
no. 11/12, pp. 1309-1326.
Verma Amit 2011, ‘Private Labels The Future Weapon on Indian Retailers’,
Marketing Mastermind, vol. 11, no. 4, pp. 42-45.
Vidushi Handa, Navneet grover 2012, ‘Retail sector in India: Issues and
challenges’, ZENITH International Journal of Multidisciplinary
Research, vol. 2, no. 5.
Wang & Chen 2011, ‘Consumers’ attitudes towards different product
category of private labels’, African Journal of Business Management,
vol. 5, no. 17.
Wedel, M & Zhang, J 2004, ‘Analyzing brand competition across
subcategories’, JMR, Journal of Marketing Research, vol. 41, no. 4,
pp. 448-456.
Westbrook, RA 1980, ‘Intrapersonal affective influences upon consumer
satisfaction with products’, Journal of Consumer Research, vol. 7(June),
pp. 49-54, http://dx.doi.org/10.1086/208792.
219
Wheatley, JJ, Chiu, JSY & Allen, D 1982, ‘Generics: Their Impact on
national and private brands’, Advances in Consumer Research, vol. 9,
no. 1, pp. 195-200.
Wileman, Andrew & Michael Jary 1997, Retail Power Plays: From Trading to
Brand Leadership, Washington Square, New York: New York
University Press.
Wolinsky, A 1987, ‘Brand names and price discrimination’, The Journal of
Industrial Economics, vol. 35, no. 3, pp. 255-268.
Wong, GKM & Yu, L 2003, ‘Consumers’ perception of store image of joint
venture shopping centres: First-tier versus second-tier cities in China’,
Journal of Retailing and Consumer Services, vol. 10, pp. 61-70.
Woodruff, RB, Ernest, RC & Roger, LJ 1983, ‘Modelling Consumer
Satisfaction Processes Using Experience-Based Norms’, Journal of
Marketing Research, vol. 20 (August), pp. 296-304. http://dx.doi.org/
10.2307/3151833.
Yelkur, R 2000, ‘Consumer perceptions of generic products: a Mexican
study’, Journal of Product & Brand Management, vol. 9, no. 7,
pp. 446-56.
Zeithaml, VA 1988, ‘Consumer perceptions of price, quality, and value: A
means-end model and synthesis of evidence’, Journal of Marketing,
vol. 52, no. 3, pp. 2-22.
Zeithaml, VA, Berry, L & Parasuraman, A. ‘The behavioral consequences of
service quality’, Journal of Marketing, vol. 60, no. 2, pp. 31-46.
Zielke, S & Dobbelstein, T 2007, ‘Customers' willingness to purchase new
store brands, Journal of Product & Brand Management, vol. 16, no. 2,
pp. 112-121.
WEBSITES
http://www.morestore.com/abt_retail.html
http://www.adityabirla.com/our_companies/indian_companies/retail.html
http://www.rpggroup.com/sretail.html
http://www.ril.com/html/business/business_retail.html
http://www.articleshub.org/article/30465/BMI-India-Retail-Report-Q1-
2011---new-marketreport-published.html
220
BOOKS 1. Suja Nair. ‘Retail Management’, Himalaya Publishing House,
pp. 401-429.
2. Kotler, Phillip. ‘Marketing Management: Analysis, Planning and
Control’, Prentice Hall, New Delhi.
3. Schiffman and Kanuk, ‘Consumer Behaviour’, PHI, New Delhi.
4. Pradhan Swapna 2010, ‘Retailing Management’, Text & Cases, 3rd
edition, McGraw Hill.
5. Nair Suja 2011, ‘Store Loyalty & Visual Merchandising’, Himalaya
Publishing House, pp. 249-252.
6. Ko Floor 2007, ‘Branding a Store - How to build successful retail
brands in a changing market place’, First South Asian Edition, Kogan
Page, London.
7. Geoffrey Randall 2003, ‘Branding - A practical guide to planning your
strategy’, CREST Publishing House (A Jaico Enterprise), Kongan Page
Ltd., London.
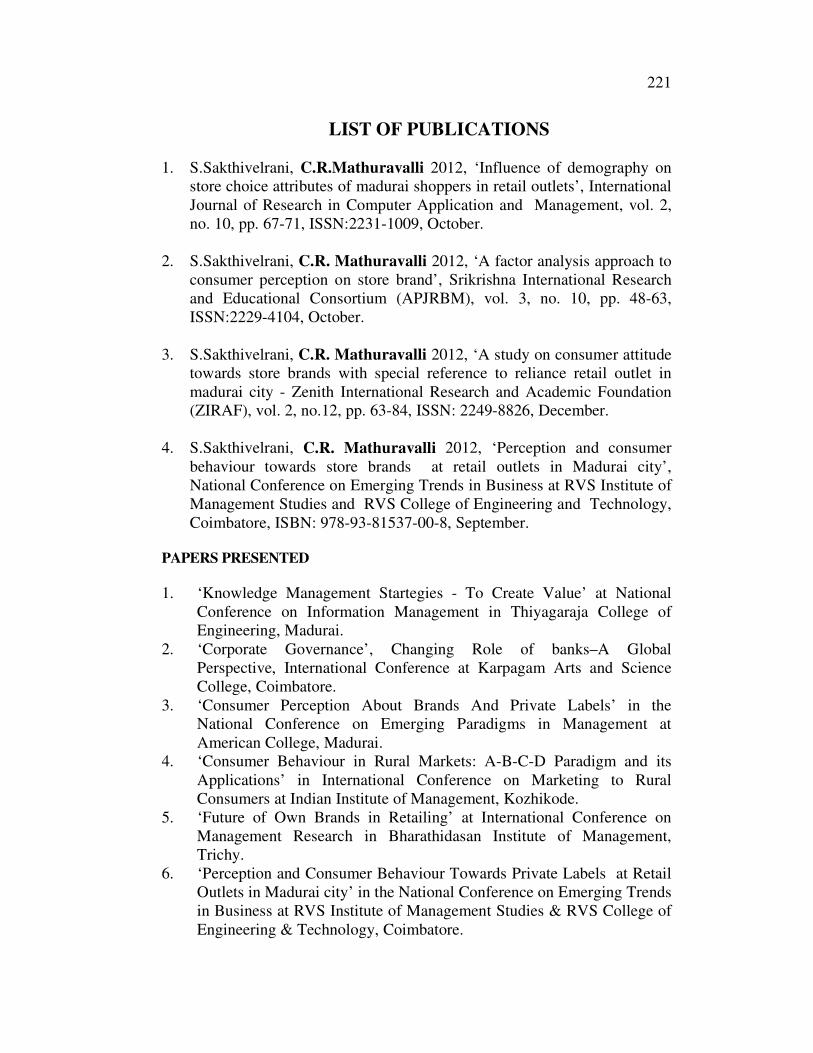
221
LIST OF PUBLICATIONS
1. S.Sakthivelrani, C.R.Mathuravalli 2012, ‘Influence of demography on
store choice attributes of madurai shoppers in retail outlets’, International
Journal of Research in Computer Application and Management, vol. 2,
no. 10, pp. 67-71, ISSN:2231-1009, October.
2. S.Sakthivelrani, C.R. Mathuravalli 2012, ‘A factor analysis approach to
consumer perception on store brand’, Srikrishna International Research
and Educational Consortium (APJRBM), vol. 3, no. 10, pp. 48-63,
ISSN:2229-4104, October.
3. S.Sakthivelrani, C.R. Mathuravalli 2012, ‘A study on consumer attitude
towards store brands with special reference to reliance retail outlet in
madurai city - Zenith International Research and Academic Foundation
(ZIRAF), vol. 2, no.12, pp. 63-84, ISSN: 2249-8826, December.
4. S.Sakthivelrani, C.R. Mathuravalli 2012, ‘Perception and consumer
behaviour towards store brands at retail outlets in Madurai city’,
National Conference on Emerging Trends in Business at RVS Institute of
Management Studies and RVS College of Engineering and Technology,
Coimbatore, ISBN: 978-93-81537-00-8, September.
PAPERS PRESENTED
1. ‘Knowledge Management Startegies - To Create Value’ at National
Conference on Information Management in Thiyagaraja College of
Engineering, Madurai.
2. ‘Corporate Governance’, Changing Role of banks–A Global
Perspective, International Conference at Karpagam Arts and Science
College, Coimbatore.
3. ‘Consumer Perception About Brands And Private Labels’ in the
National Conference on Emerging Paradigms in Management at
American College, Madurai.
4. ‘Consumer Behaviour in Rural Markets: A-B-C-D Paradigm and its
Applications’ in International Conference on Marketing to Rural
Consumers at Indian Institute of Management, Kozhikode.
5. ‘Future of Own Brands in Retailing’ at International Conference on
Management Research in Bharathidasan Institute of Management,
Trichy.
6. ‘Perception and Consumer Behaviour Towards Private Labels at Retail
Outlets in Madurai city’ in the National Conference on Emerging Trends
in Business at RVS Institute of Management Studies & RVS College of
Engineering & Technology, Coimbatore.
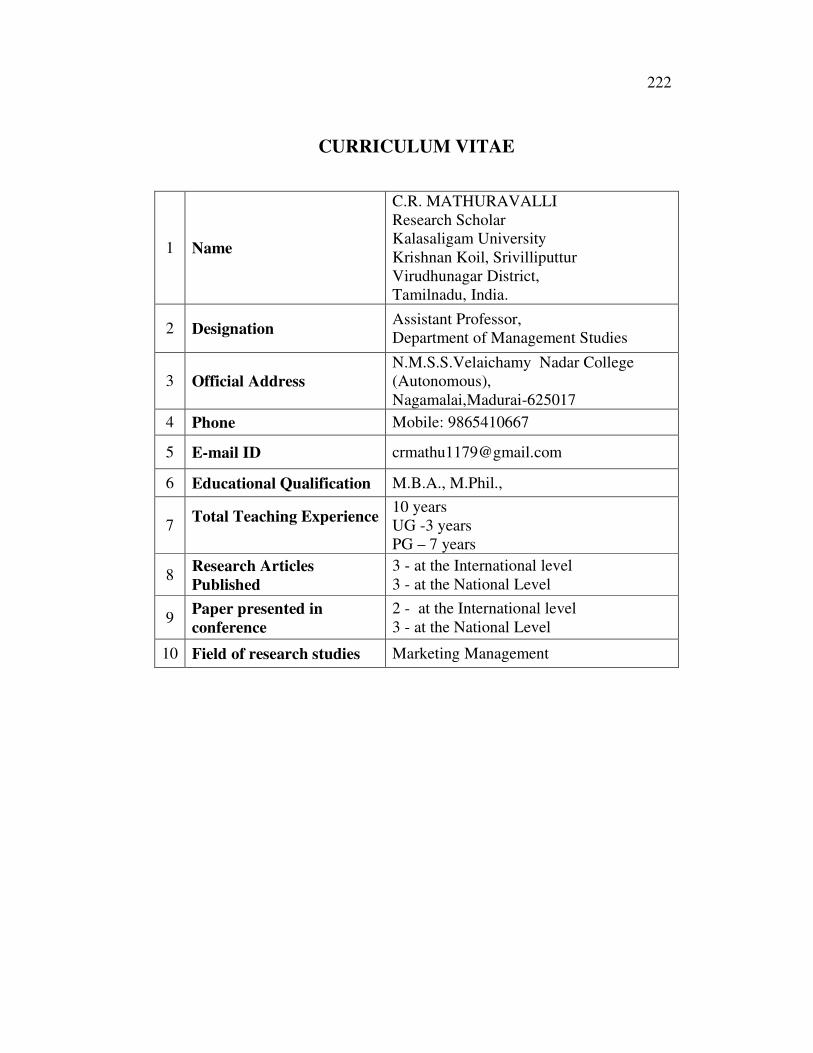
222
CURRICULUM VITAE
1 Name
C.R. MATHURAVALLI
Research Scholar
Kalasaligam University
Krishnan Koil, Srivilliputtur
Virudhunagar District,
Tamilnadu, India.
2 Designation Assistant Professor,
Department of Management Studies
3 Official Address
N.M.S.S.Velaichamy Nadar College
(Autonomous),
Nagamalai,Madurai-625017
4 Phone Mobile: 9865410667
5 E-mail ID [email protected]
6 Educational Qualification M.B.A., M.Phil.,
7 Total Teaching Experience
10 years
UG -3 years
PG – 7 years
8 Research Articles
Published
3 - at the International level
3 - at the National Level
9 Paper presented in
conference
2 - at the International level
3 - at the National Level
10 Field of research studies Marketing Management