an introduction business process documentation with data flow diagrams
TRANSCRIPT
A N I N T R O D U C T I O N
BUSINESS PROCESS DOCUMENTATION WITH DATA FLOW DIAGRAMS

Porter’s Value Chain Model
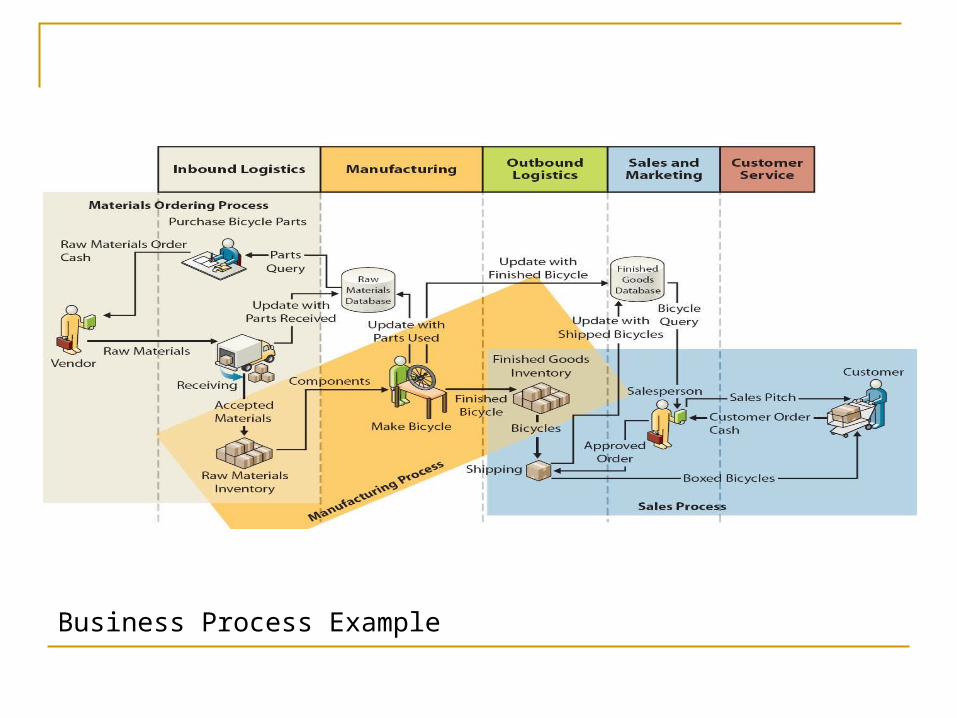
Business Process Example
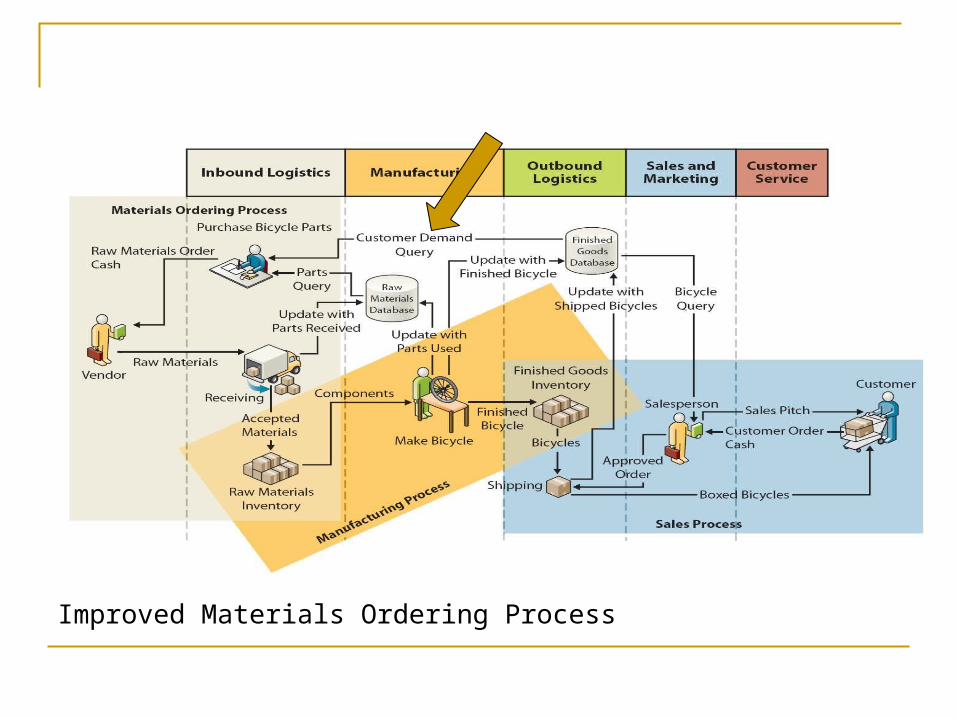
Improved Materials Ordering Process
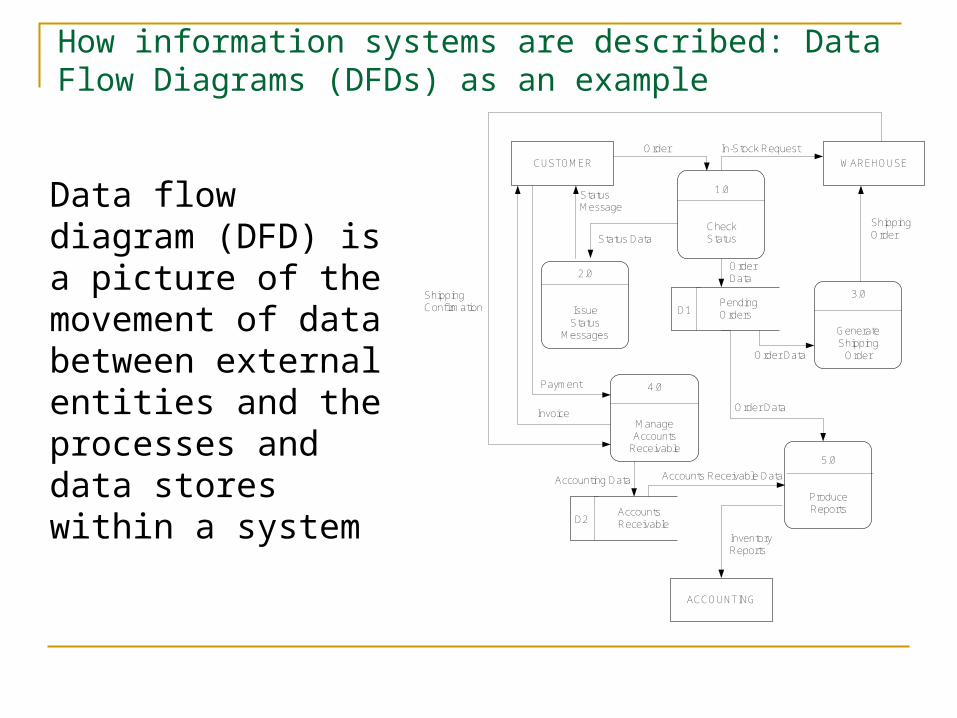
How information systems are described: Data Flow Diagrams (DFDs) as an example
Data flow diagram (DFD) is a picture of the movement of data between external entities and the processes and data stores within a system
1.0
CheckStatus
2.0
IssueStatus
Messages
3.0
GenerateShipping
Order
ACCOUNTING
CUSTOMER WAREHOUSE
4.0
Manage Accounts
Receivable5.0
ProduceReports
Order In-Stock Request
Status Data
Status Message
PendingOrdersD1
Order Data
Order Data
Shipping Order
Shipping Confirmation
Invoice
Payment
Accounts ReceivableD2
Accounting Data Accounts Receivable Data
Order Data
Inventory Reports
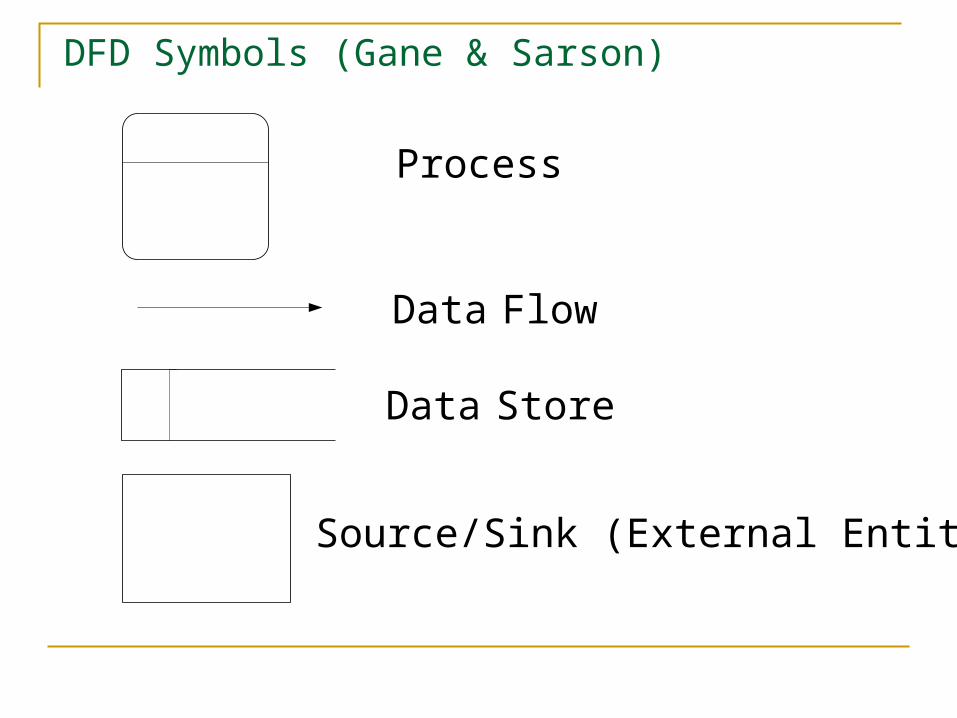
DFD Symbols (Gane & Sarson)
Process
Data Flow
Data Store
Source/Sink (External Entity)
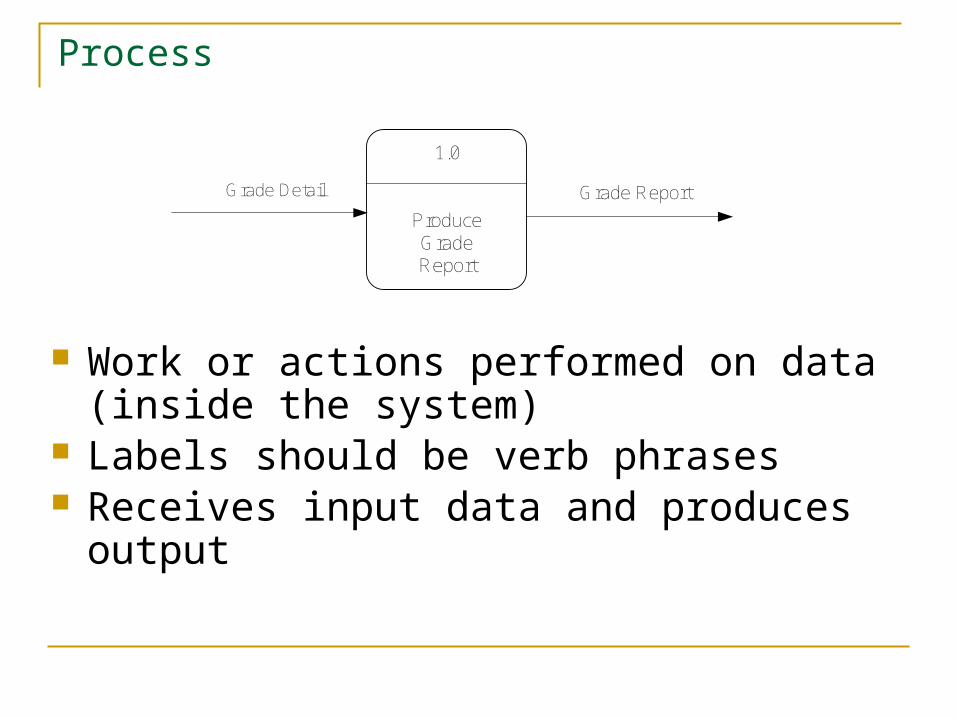
Process
Work or actions performed on data (inside the system)
Labels should be verb phrases Receives input data and produces output
1.0
ProduceGradeReport
Grade Detail Grade Report

Rule 1: Process
Can have more than one outgoing data flow or more than one incoming data flow; must have at least one of each
1.0
GradeStudent
Work
Student Grade
Submitted WorkGraded Work
3.0
Calculated Gross Pay
Hours Worked
Pay RateGross Pay
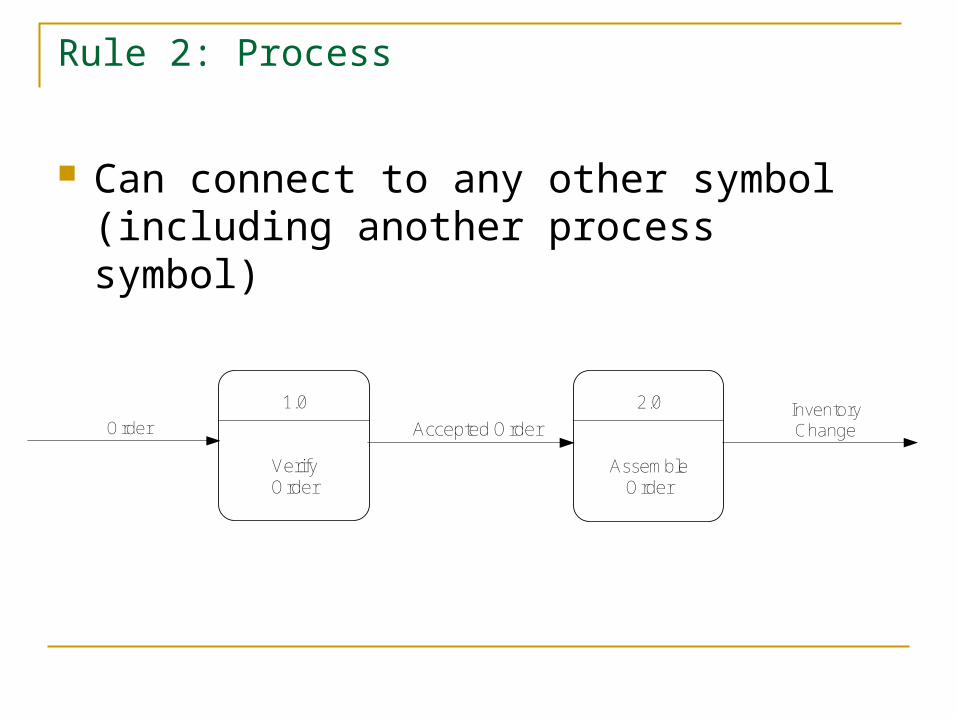
Rule 2: Process
Can connect to any other symbol (including another process symbol)
1.0
VerifyOrder
2.0
Assemble Order
Order Accepted OrderInventory Change
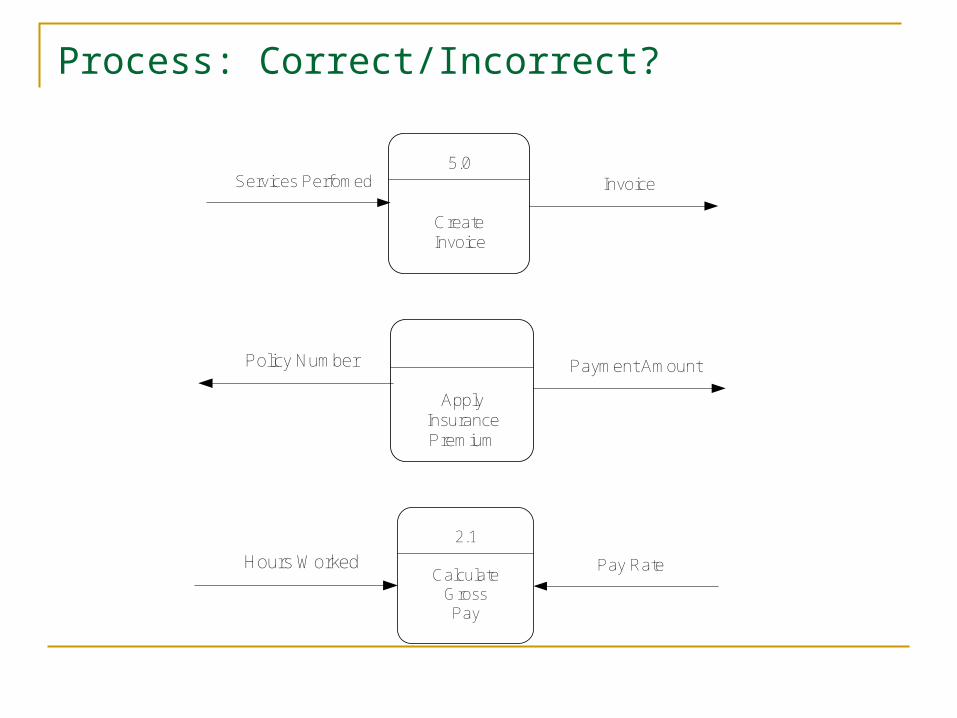
Process: Correct/Incorrect?
5.0
Create Invoice
Services Perfomed Invoice
Apply InsurancePremium
Payment AmountPolicy Number
2.1
Calculate Gross Pay
Hours Worked Pay Rate
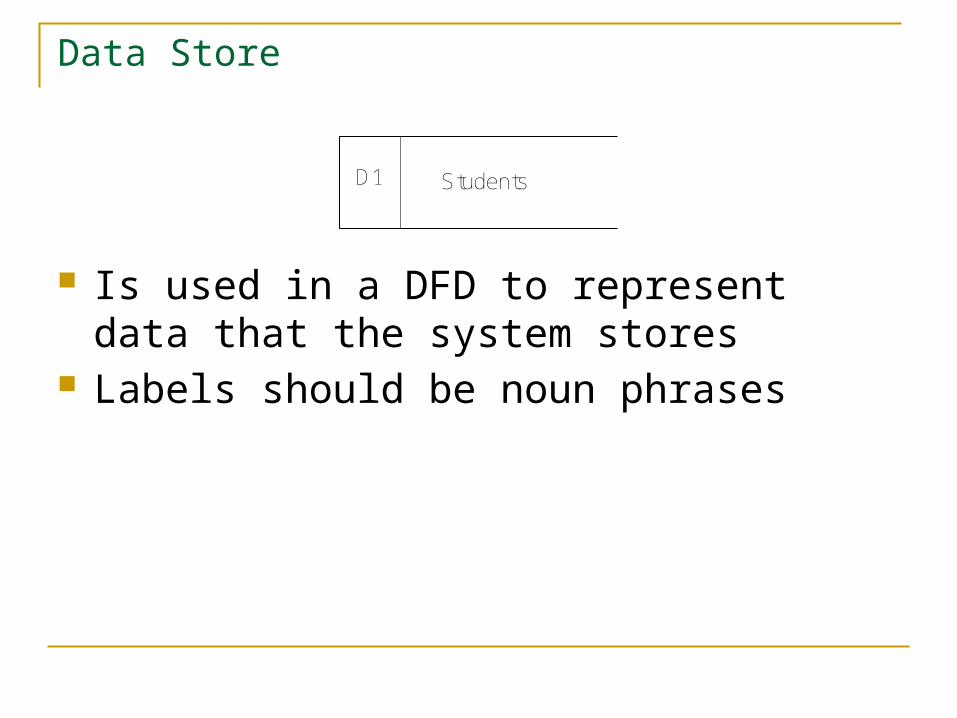
Data Store
Is used in a DFD to represent data that the system stores
Labels should be noun phrases
StudentsD1
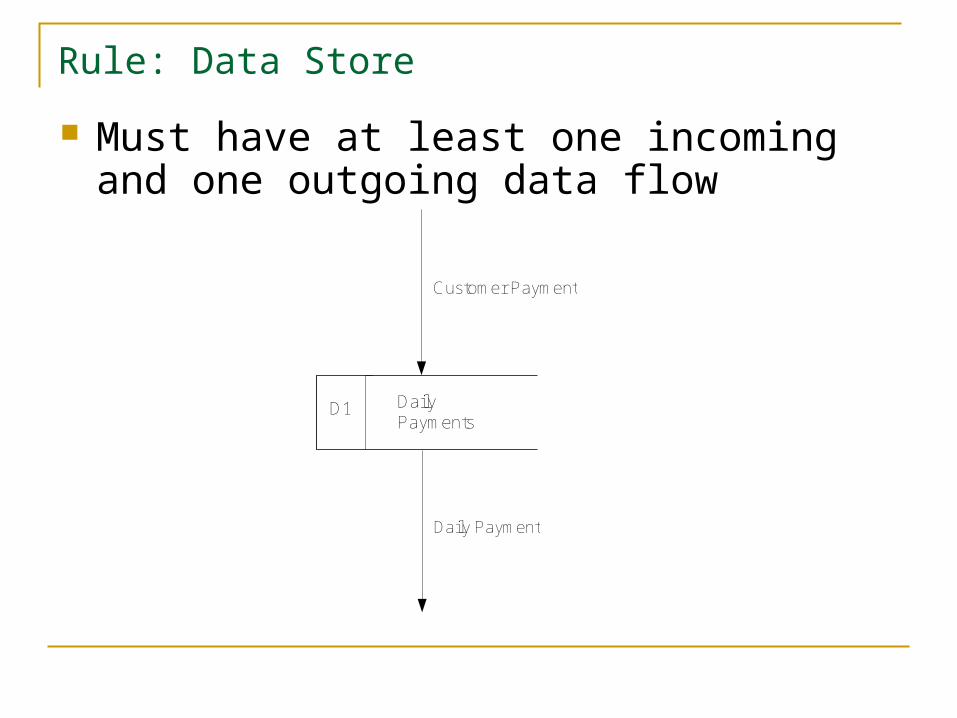
Rule: Data Store
Must have at least one incoming and one outgoing data flow
Daily Payments
D1
Customer Payment
Daily Payment
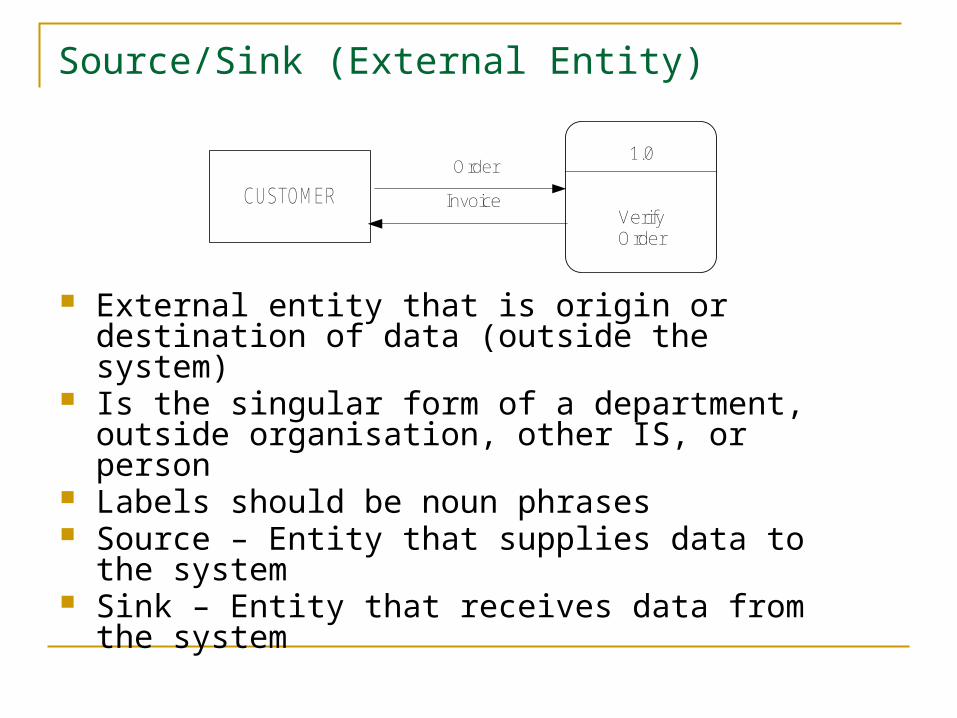
Source/Sink (External Entity)
External entity that is origin or destination of data (outside the system)
Is the singular form of a department, outside organisation, other IS, or person
Labels should be noun phrases Source – Entity that supplies data to the system Sink – Entity that receives data from the system
CUSTOMER
1.0
VerifyOrder
Order
Invoice
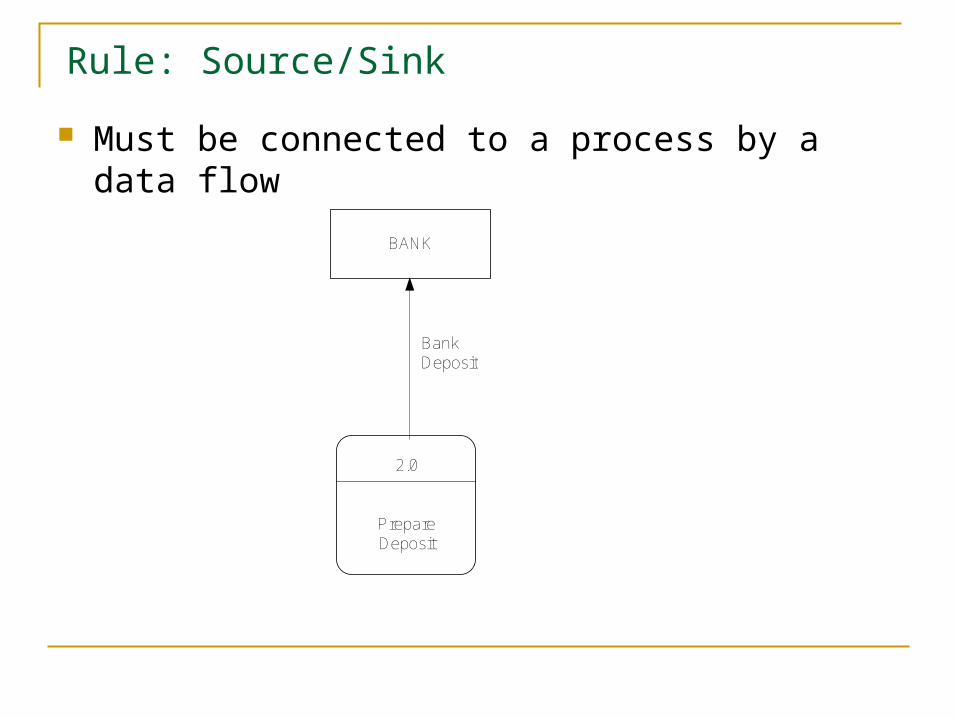
Rule: Source/Sink
Must be connected to a process by a data flow
BANK
2.0
Prepare Deposit
BankDeposit
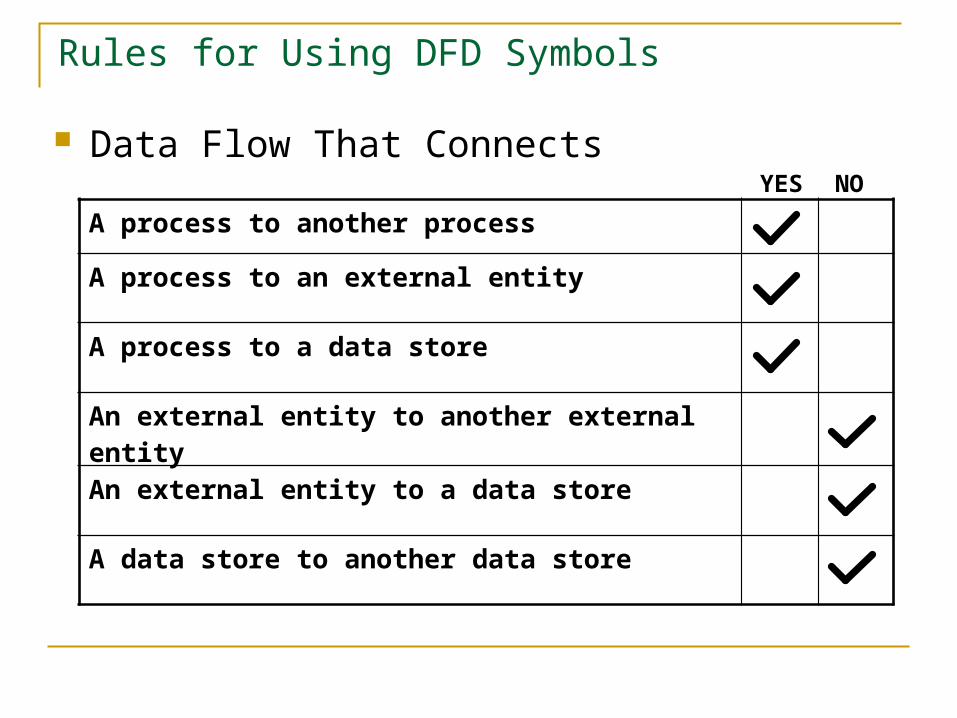
Rules for Using DFD Symbols
Data Flow That ConnectsYES NO
A process to another process
A process to an external entity
A process to a data store
An external entity to another external entity
An external entity to a data store
A data store to another data store
Context Diagram
Top-level view of IS Shows the system boundaries, external entities that
interact with the system, and major information flows between entities and the system.
Example: Order system that a company uses to enter orders and apply payments against a customer’s balance

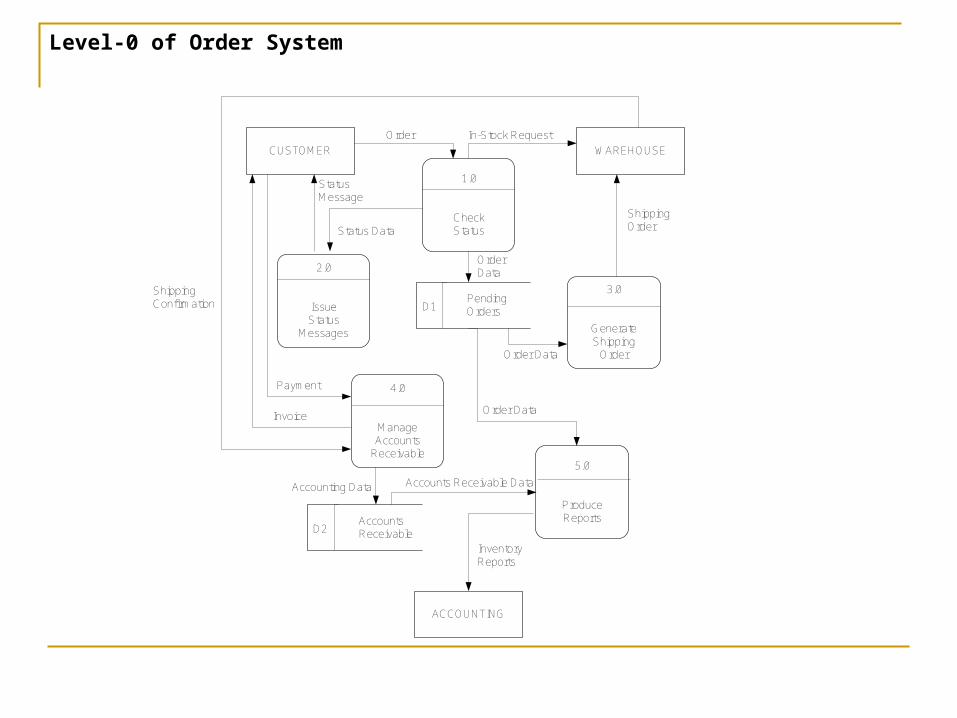
Level-0 DFD
Shows the system’s major processes, data flows, and data stores at a high level of abstraction
When the Context Diagram is expanded into DFD level-0, all the connections that flow into and out of process 0 needs to be retained.
Lower-Level Diagrams (but higher numbers like Level 1, Level 2, etc)
Functional Decomposition An iterative process of breaking a system description
down into finer and finer detail Uses a series of increasingly detailed DFDs to
describe an IS Balancing
The conservation of inputs and outputs to a data flow process when that process is decomposed to a lower level
Ensures that the input and output data flows of the parent DFD are maintained on the child DFD
Strategies for Developing DFDs
Top-down strategy Create the high-level diagrams (Context Diagram),
then low-level diagrams (Level-0 diagram), and so on Bottom-up strategy
Create the low-level diagrams, then higher-level diagrams
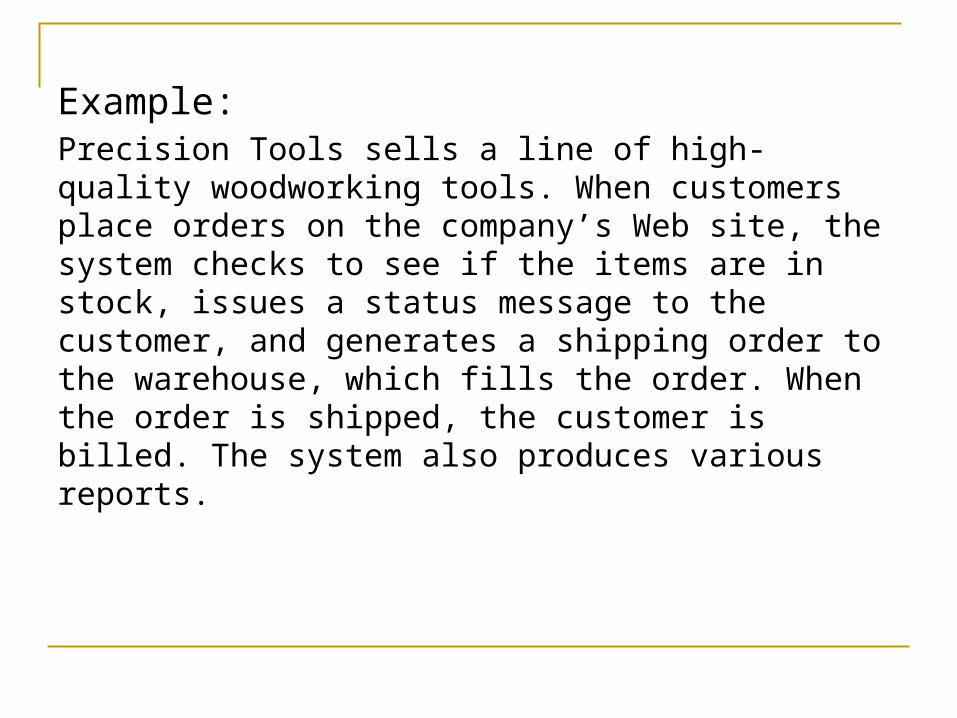
Example:Precision Tools sells a line of high-quality woodworking tools. When customers place orders on the company’s Web site, the system checks to see if the items are in stock, issues a status message to the customer, and generates a shipping order to the warehouse, which fills the order. When the order is shipped, the customer is billed. The system also produces various reports.
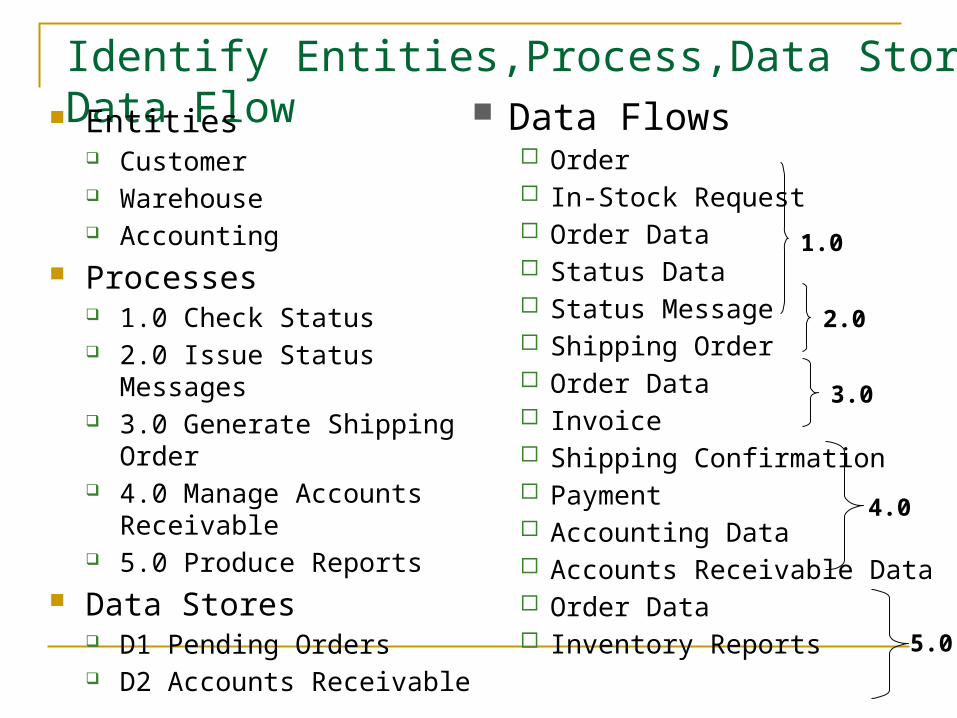
Identify Entities,Process,Data Stores & Data Flow Entities
Customer Warehouse Accounting
Processes 1.0 Check Status 2.0 Issue Status Messages 3.0 Generate Shipping Order 4.0 Manage Accounts
Receivable 5.0 Produce Reports
Data Stores D1 Pending Orders D2 Accounts Receivable
Data Flows Order In-Stock Request Order Data Status Data Status Message Shipping Order Order Data Invoice Shipping Confirmation Payment Accounting Data Accounts Receivable Data Order Data Inventory Reports
1.0
2.0
3.0
4.0
5.0

ACCOUNTING
WAREHOUSECUSTOMER
0
Order System
Order
Payment
In-StockRequest
StatusMessage
Invoice Shipping Confirmation
Shipping Order
Inventory Reports
Context Diagram of Order System
1.0
CheckStatus
2.0
IssueStatus
Messages
3.0
GenerateShipping
Order
ACCOUNTING
CUSTOMER WAREHOUSE
4.0
Manage Accounts
Receivable5.0
ProduceReports
Order In-Stock Request
Status Data
Status Message
PendingOrdersD1
Order Data
Order Data
Shipping Order
Shipping Confirmation
Invoice
Payment
Accounts ReceivableD2
Accounting Data Accounts Receivable Data
Order Data
Inventory Reports
Level-0 of Order System