an international perspective - hsdl.org
TRANSCRIPT

FIRE DEATH RATE TRENDS
An International Perspective
Federal Emergency Management AgencyUnited States Fire Administration
National Fire Data Center

2
FIRE DEATH RATE TRENDS:
An International Perspective
May, 1997
Federal Emergency Management AgencyUnited States Fire Administration
National Fire Data Center
This publication was produced under contract EMW-95-C-4717 by TriData Corporation for the United States FireAdministration, Federal Emergency Management Agency. Any information, findings, conclusions, orrecommendations expressed in this publication do not necessarily reflect the views of the Federal EmergencyManagement Agency or the United States Fire Administration.

3
Table of Contents
INTRODUCTION ........................................................................................................................................................ 1
PART I: THE INTERNATIONAL FIRE PICTURE, 1979-1992............................................................................ 2
THE UNITED STATES IMPROVES...................................................................................................................................... 3
FIRE DEATH RATE TRENDS .................................................................................................................................. 5
QUANTIFYING FIRE SAFETY ................................................................................................................................ 8
PART II: FIRE IN THE U.S.: THE INSTITUTIONAL AND CULTURAL CONTEXT................................. 11
THE FOCUS IN THE UNITED STATES IS ON RESPONSE, NOT MITIGATION ........................................................................ 11
ATTITUDES TOWARDS GOVERNMENT............................................................................................................................ 12
U.S. “ACCEPTS” FIRE AS A FACT OF LIFE....................................................................................................................... 15
U.S. DOESN’ T INVEST HEAVILY IN PUBLIC EDUCATION ................................................................................................. 16
FOREIGN CULTURES “ TAILOR” THEIR PREVENTION PROGRAMS TO SPECIFIC COMMUNITIES.......................................... 16
CONCLUSION........................................................................................................................................................... 17
REFERENCES............................................................................................................................................................ 19

1
INTRODUCTION
The United States historically has had one of the highest fire loss rates of the
industrialized world – both in terms of fire deaths and dollar loss. This unenviable status
has perplexed many experts in the fire world. The United States is health and safety
conscious in many areas – automobiles, consumer products, food, and medical drugs, to
name a few – and has a vast arsenal of technological resources to combat fire. For such a
safety conscious and technologically advanced society to be a leader in fire losses is indeed
puzzling.
This report explores the magnitude and the nature of the U.S.’s fire death problem,
and it is divided into two sections. The first section presents a statistical portrait of fire
death rates for fourteen industrialized countries. Comparisons reveal the magnitude of
differences between the U.S., Japan, and a selection of European countries in fire death
rates. Trends in overall rates and differences between countries are also explored. The
second section of this report presents observations about key institutional and attitudinal
differences between the U.S. and industrialized countries with significantly lower fire
death rates. Allocations of fire fighting resources and different cultural attitudes regarding
the “acceptability” of fire are addressed in this section.
2
PART I: THE INTERNATIONAL FIRE PICTURE, 1979-1992
This section provides information on fire death rates for fourteen industrialized
nations. While comparisons of total fires and total fire losses would be preferable, reliable
data is not available due to diverse record keeping and fire classification practices in
different countries. Loss estimates can even vary within a country, depending on the
source of the information. This is especially true for data regarding monetary loss. In the
United States, for example, the monetary loss reported by a fire department can vary
significantly from that assessed by an insurance company. And both of these estimates
may differ from the monetary loss as perceived by the owner or occupant. Fire deaths,
however, are less controversial as they are more readily identified and consistently
counted, although they, too, have reporting problems. Because of these considerations, the
analysis below comparing the U.S. to other industrialized countries is limited to fire
deaths.
Figure 1 depicts the average per capita fire death rates for fourteen industrialized
nations for the period 1979 to 1992. As this figure demonstrates, during this time period
the United States had one of the highest per capita fire death rates – only Hungary and
Canada were in the same range. At 26.5 deaths per million population, the U.S. rate of fire
deaths was over five times that of Switzerland, the nation with the lowest rate of all the
countries considered – only 5.2 deaths per million population.

3
Figure 1
A V E R A G E F IR E D E A T H R A T E B Y C O U N T R Y(1 9 7 9 -1 9 9 2 )
5 .2
6 .4
8 .5
1 0 . 6
1 5 . 7 1 5 . 8 1 5 . 91 7 . 0
1 9 . 4
2 2 . 0
2 4 . 0
2 6 . 5
3 0 . 7
1 4 . 6
0 .0
5 .0
1 0 . 0
1 5 . 0
2 0 . 0
2 5 . 0
3 0 . 0
3 5 . 0
Sw
itzer
land
Net
herl
ands
Aus
tria
Spa
in
Den
mar
k
Fra
nce
Sw
eden
Japa
n
Nor
way
Uni
ted
Kin
gdom
Fin
land
Can
ada
Un
ited
Sta
tes
Hun
gary
Dea
ths/
Mill
ion
Pop
ulat
ion
Source: World Fire Statistics Centre
The United States Improves
Figure 2 indicates that, at least in absolute terms, the situation in the U.S. improved
greatly between 1979 and 1992. The U.S. fire death rate fell 46.3 percent, from 36.3 fire
deaths per million population in 1979 to 19.5 fire deaths per million population in 1992.
As shown in Figure 2, however, this trend was not limited to the United States; rather it
was international. Of the countries considered, only Hungary and Denmark recorded
increases in their rates of fire deaths over that period – all the other countries lowered their
fire death rates. The reduction in fire deaths for the United States (46 percent, or 16.8 fire
deaths per million population) was the largest absolute and relative drop of any of the
countries shown – almost twice the size of the next biggest drop (the United Kingdom,
with a reduction of 38 percent, or 9.0 fire deaths per million population).1
1 Canada is not considered in this comparison. See Note under Figure 2.

4
Figure 2
COMPARISON OF FIRE DEATH RATES (1979 vs. 1992)Ranked by Percent of Decrease
0.0 5.0 10.0 15.0 20.0 25.0 30.0 35.0 40.0
Hungary
Denmark
Netherlands
Switzerland
Austria
Japan
Finland
Spain
Sweden
France
Norway
United Kingdom
United States
Fire Deaths/Million Population
1979 Fire DeathRate
1992 Fire DeathRate
Source: World Fire Statistics CentreNote that Canada is not included in this figure as the 1979 data was not available
Despite its impressive gains, the United States still has one of the highest per capita
fire death rates among the countries considered, as can be seen in Figure 3 below. The
most current comparative data (1992) reveals that the United States, while having
substantially reduced its fire death rate, is still 30 percent to 50 percent higher than its peer
nations, or those countries analysts consider most like the United States. And in the case
of Switzerland and the Netherlands, the United States’ fire death rate is nearly triple.
Many people feel that there is little reason for the United States, which possesses a wealth
of advanced fire suppression technologies and fire service delivery mechanisms, to lag so
far behind other nations in terms of fire safety. However, most of the advanced fire
technology used in the United States is installed in public places, and most fire deaths
occur in the home.

5
Figure 3
1992 FIRE DEATH RATE BY COUNTRY
5.36.3
7.48.6
14.9 15.2 15.8 16.0 16.4
19.5
21.8
12.613.5
33.1
0.0
5.0
10.0
15.0
20.0
25.0
30.0
35.0
Sw
itzer
land
Net
herla
nds
Aus
tria
Spa
in
Fra
nce
Sw
eden
Uni
ted
Kin
gdom
Japa
n
Can
ada
Nor
way
Den
mar
k
Uni
ted
Sta
tes
Fin
land
Hun
gary
Dea
ths/
Mill
ion
Pop
ulat
ion
Average 1992 Fire Death Rate
Source: World Fire Statistics Centre
FIRE DEATH RATE TRENDS
In recent years, the United States has been successful in reducing fire deaths.
Figure 4 depicts a time-series comparison of the per capita fire death rates of the fourteen
industrialized nations. As Figure 4 indicates, the general trend in fire death rates has been
downward, and the U.S. rate has gone down a little faster than the others.

6
Fig
ure
4
FIR
E D
EA
TH
S P
ER
MIL
LIO
N P
OP
UL
AT
ION
BY
CO
UN
TR
Y
0.0
5.0
10
.0
15
.0
20
.0
25
.0
30
.0
35
.0
40
.0
19
80
19
82
19
84
19
86
19
88
19
90
19
92
Fire Deaths Per Million Populationn
Hu
ng
ary
Un
ite
d S
tate
s
Fin
lan
d
Ca
na
da
Un
ite
d K
ing
do
m
Sw
itz
erl
an
d
Ne
the
rla
nd
s
Au
stri
aS
pa
in
De
nm
ark
Sw
ed
enN
orw
ay
Fra
nc
e
Ja
pa
n
Sou
rce
: W
orld
Fire
Sta
tistic
s C
ent
re

7
A clearer picture of the drop in fire death rates can be discerned by grouping the
countries by region as shown in Figure 5. This figure presents a comparison of fire death
rate trends for the fourteen countries divided into five regional groups: North America
(Canada and the United States), Western Europe (Austria, Denmark, France, the
Netherlands, Spain, Switzerland, the United Kingdom), Scandinavia (Finland, Norway,
and Sweden), Hungary, and Japan.2 In this figure, the trend line for North America has a
much steeper downward slope than that of the other regions, indicating that North America
has reduced its fire death rate significantly more than the other regions. In fact, North
America experienced a 12.8 percent annual reduction in its fire death rate, compared to a
3.8 percent reduction for Western Europe, a 2.3 percent reduction for Scandinavia, a 2.3
percent reduction for Japan, and a 4.4 percent increase for Hungary.
Figure 5
FIRE DEATHS PER M ILLION BY REGION
-5 .0
0.0
5.0
10.0
15.0
20.0
25.0
30.0
35.0
40.0
79 80 81 82 83 84 85 86 87 88 89 90 91 92
Y ear
Dea
ths/
Mill
ion
Pop
ulat
ionn
Hun gary
Nor th A m e rica
S can danav ia
Japan
W estern Europe
Tre ndlines a re shown as sm all dotte d l ines
Source: World Fire Statistics Centre
2 Hungary and Japan are reported as “regions” to provide bases for comparison of Eastern Europe and Asia,respectively. The use of a single country to denote the region is necessitated by the paucity of data fromother countries in those regions.

8
The trends for Hungary, Scandinavia, and Japan, however, must be viewed with
caution, as the data series are for smaller populations and the fit between the trend lines
and the data is not as good as those for North America and Western Europe. The poorer fit
may well be an indication that the fire loss data gathered in those three areas is less reliable
than the data from North America and Western Europe.
The data for Figure 5 are reproduced in Table 1. The fit ratio indicates the amount
of variance between the data and the trend line, which estimates the change in the death
rate from 1979 to 1992. A higher fit ratio indicates less variance in actual death rates
compared to values predicted by the trend line. Fit ratios vary from 0.0 to 1.0, with 0.0
indicating no fit and 1.0 indicating a perfect fit. It is important to note that fluctuations
evident in the regional per capita fire death rates reflect both actual changes in fire death
rates and changes in the quality of fire data collected.
Table 1
Region Percent
Per Capita Fire DeathReduction(-) or Gain (+)
Fit Ratio
Hungary +4.4 .51
Scandinavia -2.3 .18
Western Europe -3.8 .92
North America3 -12.8 .91
Japan -2.3 .56
QUANTIFYING FIRE SAFETY
Quantifying fire safety is another difficult area. The number and rate of fire deaths
are certainly indicative of relative fire safety. Yet they are also the result of a nation’s
overall fire safety environment. Five crucial components that create or encourage fire
safety and contribute to a nation’s overall fire safety environment are:
3 When the fire death rate of the United States is compared against that of other regions, the drop in firefatalities becomes even more apparent – the trend line for the United States alone shows an average annualreduction of 19 percent with a fit ratio of .84.
9
• the quality and distribution of fire fighting resources,
• the amount of active and passive fire protection in the built environment and its
contents,
• the amount of fire prevention activities undertaken,
• the societal “acceptability” of fire, and
• the fire safety behavior of the population.
The first three of these factors are readily quantifiable; the last two factors are not.
Of the three quantifiable factors, only the first two have been measured and recorded
systematically, either in the United States or abroad. These have been measured as the
percentage of gross domestic product (GDP) spent by a nation on fire fighting forces and
the percentage of GDP spent on built-in fire protection to buildings. The fire safety of
building contents has not been measured.
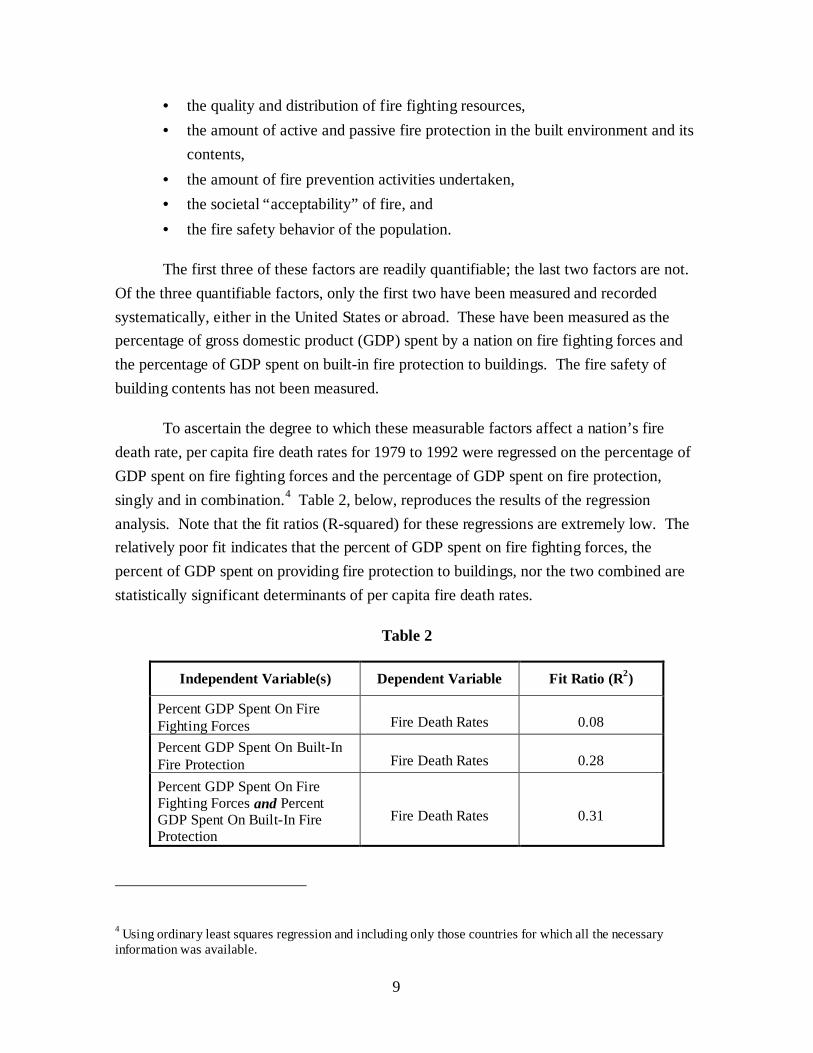
To ascertain the degree to which these measurable factors affect a nation’s fire
death rate, per capita fire death rates for 1979 to 1992 were regressed on the percentage of
GDP spent on fire fighting forces and the percentage of GDP spent on fire protection,
singly and in combination.4 Table 2, below, reproduces the results of the regression
analysis. Note that the fit ratios (R-squared) for these regressions are extremely low. The
relatively poor fit indicates that the percent of GDP spent on fire fighting forces, the
percent of GDP spent on providing fire protection to buildings, nor the two combined are
statistically significant determinants of per capita fire death rates.
Table 2
Independent Variable(s) Dependent Variable Fit Ratio (R2)
Percent GDP Spent On FireFighting Forces Fire Death Rates 0.08
Percent GDP Spent On Built-InFire Protection Fire Death Rates 0.28
Percent GDP Spent On FireFighting Forces and PercentGDP Spent On Built-In FireProtection
Fire Death Rates 0.31
4 Using ordinary least squares regression and including only those countries for which all the necessaryinformation was available.

10
This analysis implies that the amount invested in fire prevention activities, the
cultural view of the acceptability of fire, and the behavior of the population may explain
more about a nation’s fire death rate than does the amount of money spent on firefighting
or built-in fire protection. More attention and research needs to be focused on these areas.
Unfortunately, this task is made more difficult by the paucity of data on funding levels for
fire prevention activities and the difficulty in quantifying either cultural attitudes towards
fire or fire safety behaviors.

11
PART II: FIRE IN THE U.S.: THE INSTITUTIONAL AND CULTURAL
CONTEXT
There are numerous reasons for the relatively high fire death rate in the United
States. Many of these reasons are linked to the institutional and cultural framework
surrounding the issue of fire in the U.S. Different countries approach the issue of fire in
different ways. Osborne and Gaebler commented on the approach taken by most
jurisdictions in the U.S. in their landmark 1992 work, Reinventing Government,
[a]ccording to the National Fire Protection Association, we have the highest fatality ratefrom fire in the industrial world. Why? Because we spend most of our money respondingto fires, not preventing them. (Osborne and Gaebler 1992, p. 223)
In other words, fire suppression is emphasized over fire prevention in the U.S. One
reflection of this is the high standards set for fire department response times and fire
suppression performance. By U.S. standards, the response time standards prevalent in
other countries would be unacceptable. For example, in some foreign cities, the objective
of the fire service is to put a fire engine on the scene within 10 to 20 minutes of an initial
report of a fire. In Holland, the general target is a 30-minute response time. In the U.S., a
30-minute response time would be cause for public outcry.
The focus in the United States is on response, not mitigation
If firefighters in other countries do not respond to fires as quickly as firefighters in
the U.S., why are their fire death rates lower? Simply put, it is a function of the level of
resources devoted to fire suppression versus fire prevention. Other countries place a higher
premium on their ability to prevent fires rather than their ability to put them out once they
occur. The data in Part I of this report detailing lower relative fire death rates in many
European countries suggests that prevention is more effective than suppression in saving
lives.
A variety of strategies can be used by government agencies and fire departments to
prevent fires, and countries (or jurisdictions within countries) adopt unique mixes of them.
Among the fire prevention strategies they choose from are regulating the level of fire
protection in the built environment, teaching citizens about their responsibilities in
12
preventing fires, and offering citizens practical guidance for avoiding situations that
increase the risk of fire.
The emphasis on fire suppression over fire prevention in the U.S. is evident in
firefighting budget allocations and staffing patterns. Other countries spend more on fire
prevention activities and dedicate more of their firefighters’ time to these activities.
Industrialized countries typically spend between four and ten percent of their fire
department budgets on fire prevention, whereas the U.S. spends only about three percent.
Because individual fire departments have finite resources, they must make difficult
decisions about the appropriate mix of services to offer citizens. Unfortunately, there is an
understandable tendency for U.S. fire departments to want to ensure that the response
capabilities of their departments are not compromised in any way. The result is generally
to prioritize funding to preserve or enhance emergency response times rather than to
expand the level of fire prevention and public education services.
Other countries typically devote more staff time to fire prevention activities than
fire departments in the U.S. The Tokyo fire department provides a useful illustration.
According to Schaenman,
The Tokyo Fire Department has 18,000 firefighters, 1,850 of whom are assigned full timeto prevention. In addition, firefighters with suppression assignments also spend time onprevention activities. In total, Tokyo typically has 15 to 20 percent of their personnel timespent on prevention. (1985, p. 74)
While numerical data are not available for a comparable U.S. city, it is known that
it would be highly unusual for a fire department in the United States to assign 10 percent of
its full-time personnel to fire prevention activities.
Attitudes towards government
Differences between U.S. and foreign fire departments partly reflect different
cultural attitudes towards the role of government. Whereas attitudes in many countries
hold that government should be actively involved in protecting the health and welfare of
citizens, Americans have, in general, less tolerance for active government. These attitudes
have important ramifications when dealing with the issue of fire, especially the way in
which fire protection issues are regulated.
Some European and Asian Pacific countries set national-level standards for
building codes and fire prevention and suppression activities. In the U.S., localities can

13
draw on national models, but the ultimate responsibility for regulation and enforcement
resides at the local level. This approach has advantages and disadvantages. An advantage
is that local agencies can respond more effectively to local circumstances, such as the
prevalence of specific building types and uses. A disadvantage is that coordination among
different fire departments in a highly decentralized system can be complicated. Also, it
can take longer to institutionalize fire safety innovations for preventing or suppressing fires
into local fire department practices and the building codes of thousands of municipalities.
The institutional framework for dealing with fire issues in the U.S. is partly an
historical artifact. The U.S. has a much shorter history as a nation than most other
countries, and it has not had the breadth of experience that other countries have had with
major conflagrations that destroyed entire cities. Save for the Great Chicago Fire of 1871,
there is little institutional memory evident in American culture of the devastating potential
of fires and the critical need to prevent them from occurring.
In contrast, there is greater cultural awareness of the destructive force of fires in
many European and Asian Pacific countries. In large part, this awareness is the product of
hundreds of years of experience living in densely populated cities, where fires have
periodically threatened large portions of the citizenry and building stocks. For example,
Japan has experienced an inordinate number of devastating fires. Of the 48 fires
throughout the world known to have destroyed 10,000 or more buildings, over half
occurred in Japan. Given the institutional memory of such occurrences in Japan and other
Asian Pacific and European countries, a much higher value is placed on preventing fires in
these countries, and this value is incorporated into the missions and practices of fire
departments.
The greater emphasis on prevention in fire services abroad is real but subtle, in that
the proportion of fire department budgets dedicated to prevention activities is higher than
in the U.S., but not dramatically so. The cultural value placed on the importance of
preventing fires is evident in ways other than fire department budgets, however. While the
degree varies by country, among the fire prevention strategies that nations can incorporate
into their institutional fire protection frameworks and into the organizational cultures of
their fire departments are:

14
• Regulating the level of fire protection in the built environment through building
codes. The importance of this factor in a nation’s overall fire prevention strategy can
vary by country or even by locality. In the Netherlands, most local building codes are
based on a model national code, and stringent regulation of structures is the country’s
primary fire prevention strategy.
• Regulating the types of structures covered by building codes. Countries and localities
may not only adopt different building codes, they may also apply them to different
classes of buildings. In the Netherlands, all structures are covered by building codes,
including any new construction or modifications to residential structures. The attention
paid to fire safety in residential structures also affects the style of those structures. Like
many European countries, the Netherlands emphasizes compartmentalization to contain
fires and to facilitate safe passage of occupants from buildings. Similarly, all rooms
must have at least two exits, and every room must either be adjacent to a hallway or
stairway or contain a window to the outside. In contrast, most American homes are not
designed with ease of egress in mind, so few homes are well compartmentalized and
many have interior rooms without easy or multiple escape routes. In addition, open
space housing designs that are currently popular allow fires to spread easily from one
part of a house to another. American homes are also more likely to have doorless
doorways. (Schaenman, 1993, p. 12 and p. 44)
• Providing high levels of training for firefighters, especially fire officers. Firefighters
in other countries tend to receive more training, including more training on fire
prevention. Once promoted to officers, firefighters in many countries receive a
significant amount of additional training on prevention issues. For example, in Britain
junior officers attend nine weeks of training, four of which are devoted to prevention
issues. (Schaenman, 1993, p. 23)
• Encouraging high education levels of fire service members. Firefighters in other
countries tend to be more highly educated, and a higher proportion of them have
technical backgrounds than in the U.S. Higher educational and professional
backgrounds, particularly in the officer ranks, raises the status of positions within those
fire services generally. The level of technical expertise makes service members more
qualified to act as consultants for reviewing the fire safety of buildings and building
plans. Where utilized as technical consultants, service members are able to provide a
respected and valued service to the community outside of their role of putting out fires.
This is an example of how the value of doing prevention work can be actively

15
reinforced within the culture of a fire service. Similarly the value of prevention is
reinforced in those fire services that have separate prevention bureaus or prevention
career ladders. By making staff positions within those agencies relatively high status
positions within the fire service as a whole, prevention work is rewarded and its value
is reinforced.
U.S. “accepts” fire as a fact of life
The lack of a strong cultural norm around preventing fires may explain another
aspect of U.S. attitudes towards fire. Americans tend to view fires as an inevitable part of
life and, unlike citizens in other countries, are more prone to characterize fires as
unfortunate “accidents”. When fires happen, those who lose their homes and possessions
are compassionately termed “fire victims,” even in cases where the fire was a direct
consequence of human behaviors. These attitudes may be reinforced by insurance
practices, which generally allow home owners to insure up to 100 percent of the value of
their property. In the event of a fire, owners are reimbursed for the full value of their loss,
which may have the unintended affect of making people less concerned about taking
precautions to minimize the risk of fire. Insurance industry practices can also importantly
affect arson rates, a subject not reviewed here.
In contrast to the U.S., many countries view fire as a preventable and shameful
occurrence. In many of the United States’ peer countries, families who have careless fires
are ostracized, and parents are expected to make sure that their children are well aware of
fire hazards. People who have fires in their homes or businesses are looked at with raised
eyebrows – the implied question is whether they are reliable people. In some nations,
those responsible for starting fires can receive criminal sanctions, and in others insurance
practices only allow residents to recoup a portion of their property losses. In Japan, the
cultural rejection of fire as an accident is a function of the susceptibility to fire of their
many tightly packed wood and paper structures.

16
U.S. doesn’t invest heavily in pu blic education
Because other societies consider fire to be everyone’s business –not just the fire
department’s – there is a much greater tendency abroad to educate broad segments of
society about the dangers of fire, how to prevent fires, and how to extinguish fires in their
incipient and early free-burning stages. For example, the use of paid advertising to reach
large numbers of people during “prime time” with fire and life safety messages is
commonplace in Great Britain.
... the British spend a lot more money than we do in reaching their public with high qualitypublic fire education. They do not think in terms of running a spot occasionally, but ratherof targeting the elderly with 20 exposures of a particular message within a year. Theyspend millions of dollars at the national level in purchasing advertising time – somethingthat rarely, if ever, is done in the U.S. for fire protection. In London, the fire brigadebudget had included millions of dollars for running television fire safety messages inprime-time or with soap operas, to reach the desired populations. (Schaenman 1994, p. 44)
By contrast, in America fire safety advertisements are generally run as public
service announcements (PSAs). As a requirement to receive a television or radio license
from the Federal Communications Commission, carriers must broadcast PSAs.
Unfortunately, however, there are no regulations stating when PSAs must be aired. Most
PSAs are played when air time is cheapest – after prime time and before the morning
programs begin. It is safe to say that late-night television viewers have more exposure to
fire safety PSAs than do other viewers. Unless federal broadcast regulations are changed
or fire agencies start to purchase commercial air time, the number of PSAs to which large
numbers of Americans are exposed will continue to be relatively small.
Foreign cultu res “ta ilor” their p revent ion prog rams to specific comm unities
In the U.S. there is a tendency on the part of the fire service to concentrate fire
prevention efforts into campaigns that are national in scope or generic in nature (e.g.,
installation of smoke detectors, “Exit Drills In the Home,” and “Stop, Drop, and Roll”).
While these campaigns ensure that a uniform fire prevention message is presented across
the country, important regional variations in fire risk cannot be addressed. This view of
fire prevention messages is changing somewhat – there is growing interest in the fire
service in supplementing national strategies with “bottom-up,” community-based fire
prevention programs − but overall, prevention messages have generally not been regionally
tailored.

17
By contrast, foreign fire services report that in addition to their respective national
campaigns, they employ fire prevention practices that are targeted to the specific needs of
local communities. “The successful [foreign] programs take into account prevalent
attitudes about fire and the realities of fire risk in their communities, and act accordingly.”
(Seaton 1996a, p. 87) An example of this practice is the emphasis that the Austrians and
Dutch place on the mandatory use of chimney sweeps to prevent chimney and heating-
related fires. Through the use of chimney sweeps, “heating-related fires, once the scourge
of Europe, have been dramatically reduced.” (Schaenman 1994, p. 46) Moreover,
successful foreign programs have focused on how to get the prevention message
effectively to target audiences. In London, research showed that older residents were very
attached to their pets, so the fire service used this as the central theme of a successful fire
prevention campaign specifically targeted to that audience.
CONCLUSION
The data and analyses presented here depict an unfortunate but correctable
situation. The United States has one of the premier firefighting forces in the world, but we
need to focus more on prevention and less on putting out fires once they have started.
Time line data show that while the situation in the U.S. has improved, we still lag behind
other countries in the relative loss of life due to fires. Other countries have demonstrated
that it is possible to save lives by expending more energy and funding on fire prevention
and fire education. While current institutional arrangements and cultural attitudes make
wholesale adoption of foreign fire prevention methods unlikely, the experiences of other
countries provide the U.S. fire service with a wealth of information and ideas that can be
integrated into current firefighting practices and services.
Among the strategies that appear to offer the best means of “reinventing” fire
protection in the United States are:
• better funding and fire department staffing of fire prevention activities;
• improving public awareness of the fire problem;
• changing attitudes about the acceptability of fires;

18
• teaching people how to protect themselves from fire; and
• teaching people what to do in the event of a fire to minimize the losses to bothpersons and property.

19
REFERENCES
The Geneva Association (1984). World Fire Statistics Centre Bulletin. Issue Number 1(March). Geneva, Switzerland: The Geneva Association.
The Geneva Association (1985). World Fire Statistics Centre Bulletin. Issue Number 3(August). Geneva, Switzerland: The Geneva Association.
The Geneva Association (1986). World Fire Statistics Centre Bulletin. Issue Number 4(July). Geneva, Switzerland: The Geneva Association.
The Geneva Association (1988). World Fire Statistics Centre Bulletin. Issue Number 6(April). Geneva, Switzerland: The Geneva Association.
The Geneva Association (1989). World Fire Statistics Centre Bulletin. Issue Number 7(November). Geneva, Switzerland: The Geneva Association.
The Geneva Association (1994). World Fire Statistics Centre Bulletin. Issue Number 10(May). Geneva, Switzerland: The Geneva Association.
The Geneva Association (1995). World Fire Statistics Centre Bulletin. Issue Number 11(May). Geneva, Switzerland: The Geneva Association.
The Geneva Association (1996). World Fire Statistics Centre Bulletin. Issue Number 12(June). Geneva, Switzerland: The Geneva Association.
Osborne, D. and T. Gaebler (1992). Reinventing Government: How the EntrepreneurialSpirit is Transforming the Public Sector. Reading, MA, Addison-Wesley Publishing.
Schaenman, P. (1982). International Concepts in Fire Protection: Ideas from Europethat Could Improve U.S. Fire Safety. Arlington, VA, TriData Corporation.
Schaenman, P. (1985). First-Class Abroad. Firehouse: 73-90.
Schaenman, P. (1993). International Concepts in Fire Protection: New Ideas fromEurope. Arlington, VA, TriData Corporation.
Schaenman, P. (1994). Reinventing Fire Protection. Firefighter's News: 44-461.
Schaenman, P. and E. Seits (1985). International Concepts in Fire Protection: Practicesfrom Japan, Hong Kong, Australia, and New Zealand. Arlington, VA, TriDataCorporation.

20
Schaenman, P. et al. (1987). Overcoming Barriers to Public Fire Education in the UnitedStates. Arlington, VA, TriData Corporation.
Schaenman, P. et al. (1990). Proving Public Fire Education Works. Arlington, VA,TriData Corporation.
Seaton, M. (1996a). How Different Countries Teach Fire Safety. NFPA Journal: 81-87.
Seaton, M. (1996b). The Moral Equivalent of a Drunk Driver. NFPA Journal: 83.