an interlaboratory comparison of techniques for extracting
TRANSCRIPT

JOURNAL OF GEOPHYSICAL RESEARCH, VOL. 102, NO. C12, PAGES 26,527-26,538, NOVEMBER 30, 1997
An interlaboratory comparison of techniques for extracting and analyzing trapped gases in ice cores
Todd Sowers 1, Ed Brook 2,3, David Etheridge 4, Thomas Blunier 5, Andreas Fuchs 5, Markus Leuenberger 5, Jerome Chappellaz 6, Jean Marc Barnola 6, Martin Wahlen 7, Bruce Deck 7, and Connie Weyhenmeyer 7
Abstract. We undertook an interlaboratory comparison of techniques used to extract and analyze trapped gases in ice cores. The intercomparison included analyses of standard reference gases and samples of ice from the Greenland Ice Sheet Project 2 (GISP2) site. Concentrations of CO2, CH4, the •5180 of 02, the •515N of N2, and the O2/N2, and Ar/N2 ratios were measured in air standards and ice core sampries. The standard reference scales for CO2 and CH 4 were consistent at the +2% level. The •502/N2 and •5180 of O2 measurements showed substantial deviations between the two laboratories able to measure these ratios. The
deviations are probably related to errors associated with calibration of the working standards. The •sAr/N2 and •515N of N2 measurements were consistent. Five laboratories analyzed the CH4 concentration in a 4.2-m section of the GISP2 ice core. The average of 20 discrete CH 4 measurements was 748+10 parts per billion by volume (ppbv). The standard deviation of these measurements was close to the total analytical uncertainty associated with the measurements. In all cases, those laboratories employing a dry extraction technique determined higher CH 4 values than laboratories using a wet extraction technique. The origin of this difference is unclear but may involve uncertainties associated with blank corrections. Analyses of the CO2 concentration of trapped gases showed extreme variations which cannot be explained by analytical uncertainties alone. Three laboratories measured the [CO2] on 21 discrete depths yielding an average value of 283+13 parts per million by volume (ppmv). In this case, the standard deviation was roughly a factor of 2 greater than the analytical uncertainties. We believe the variability in the measured [CO2] results from impurities in the ice which may have compromised the [CO2] of trapped gases in Greenland ice.
Introduction
The first studies of the composition of trapped gases in polar ice were performed in the 1950s [Scholander et al., 1956]. Since that time, numerous studies have focused on
reconstructing the composition of the atmosphere t¾om polar ice cores (see Raynaud et. al., 1993 for a recent review of the greenhouse gas records). Results of these studies suggest that atmospheric CO2 and CH 4 levels were substantially lower
•Department of Geosciences, Pennsylvania State University, University Park.
2Graduate School of Oceanography, University of Rhode Island, Narragansett.
•now at Department of Geology and Department of Environmental Science,Washington State University, Vancouver.
4Division of Atmospheric Research, Commonwealth Scientific and Industrial Research Organization, Aspendale, Victoria, Australia.
5Physics Institute, University of Bern, Switzerland. 6Laboratoire de Glaciologie et Geophysique de
l'Environnement, CNRS, St Martin d'Heres, France. 7Scripps Institution of Oceanography, University of California,
San Diego, La Jolla.
Copyright 1997 by the American Geophysical Union.
Paper number 97JC00633. 0148-0227/97/97JC-00633509.00
during glacial periods than during interglacial periods [Neftel et al., 1985; Stauffer et al., 1985; Barnola et al., 1987: Neftel et al., 1988; Stauffer et al., 1988; Barnola et al., 1991; Blunier et al.. 1993; Chappellaz et al., 1993; Chappellaz et al., 1993; Anklin et al., 1995; Barnola et al., 1995; Blunier et al., 1995]. Such results have led to a number of biogeochemical studies designed to understand the nature of the concentration variations and their climatic significance. Given the importance of these records, we believe it is important to continually strive to increase the integrity of the paleoatmospheric records derived from data on the trapped gases in ice cores.
There are a number of factors to consider when
reconstructing the composition of the paleoatmosphere from trapped gases in ice cores. After a core has been retrieved from the field and transported to the laboratory, the fossil air must be separated from the ice matrix /'or analysis. The composition of the air must be determined relative to a standard that has previously been calibrated on an acceptable concentration scale. The measured composition must be corrected/'or the effect of air enclosure in order to determine
the composition of the atmosphere at the time the gases were occluded in the firn-ice region of the glacier. These corrections include gravitational and isotopic fractionation resulting from the diffusion of air in the firn layer above the
26,527

26,528 SOWERS ET AL.' EXTRACTING AND ANALYZING TRAPPED GASES IN ICE CORES
Table 1. Listing of Laboratory Techniques Used to Extract Gases From Ice Cores, the Analytical Instrumentation Applied to the Extracted Fossil Air Samples, the Resulting Procedural Blank, and the External Precision
Elemental Analyses Isotopic Analyses 15Ar/N 2 •515 N of N 2
CO. z CH•_ bOz/N_ •. b•80 of O.•.•
Method cheese grater a + GC (as CH4)
b Blank 0.8 ppm External precision d +1.2 ppm Size of ice sample 0.5-1.5 kg
Method N/A
Blank
External precision d
Size of ice sample
Method small crusher
+GC (CO 2) Blank < I ppm External precision d +3 ppm Size of ice sample 40 g
Method m icrocrusherh + IR
Blank negligible External precision d +3 ppm Size of ice sample 4 g
Method N/A
Blank
External precision d Size of ice sample
CSIRO
cheese grater +GC
5 ppb c +5 ppb 0.5-1.5 kg
N/A N/A
Bern
small mill device c milling device f milling device + GC mass spectrometry mass spectrometry 19+4 ppbg blank <1%o blank <0.1%o + 10 ppb 15Ar/N 2_+0.3%o 15 •5 N_+0.05%o
80 2/N 2_+0.1%0 15 •8 O-•.08%o 12-20 g
LGGE wet extraction
+ GC
20_+6 ppb g _+10 ppbg 50 g
N/A N/A
SIO
wet extraction
+ GC
negligible ß +20 ppb 100 g
N/A N/A
URI
wet extraction wet extraction wet extraction
+ GC mass spectr.ometry mass spectrometry 15+6 ppb Blank <1%o • Blank <0.03%o • -+15 ppb -+1%o _+0.03%0 35_+3 g 10 g 10 g
GC is gas chromatography. a [Etheridge et al., 1988]. t, [Etheridge et al., 1996]. c [Etheridge et al., 1992; Pearman et al., 1986]. d External precision is defined as the total uncertainty associated with the extraction and analytical procedure. In general,
external precision is determined by introducing aliquots of working standard into an extraction vessel with degassed ice and then processing the standard/ice mixture as if it were a sample and recorded as -+ 1 sigma. Abbreviations for the various laboratories are CSIRO, CSIRO Division of Atmospheric Research; Bern, Physics Institute, University of Bern; LGGE, CNRS Laboratoire de Glaciologie et Geophysique de l'Environnement; SIO, Scripps Institute of Oceanography; URI, University of Rhode Island.
e [Fuchs et al., 1993]. f [Moor and Stau. ffk•; 1984]. g Chappellaz et al. (manuscript in preparation, 1997). h The microcrusher device involves a small extraction vessel fitted with a bed of tapered rods which lightly crush the ice
samples, thereby avoiding pressure melting at the surface [Wahlen et al., 1991]. •[Sowers et al., 1989].
bubble close-off region [Craig et al., 1988; Schwander 1989; Sowers et al., 1989], and any in situ chemical reactions. Finally, although not discussed here, the age of the air in the ice must be determined [Schwander and Stauffer 1984; Schwander et al., 1988].
We undertook an intercalibration study among five laboratories currently analyzing trapped gases in ice cores (Table 1). The study consisted of two separate components. The first part was the analysis of reference air samples by each laboratory in order to compare their working standards. The second part of the study included analyses of ice from a
4.2-m section of the GISP2 "F" ice core which was drilled in
July 1991. The species that were measured in this study were CO 2, CH4, the •80/J60 ratio of trapped 02, the 15N/14N ratio of trapped N 2, O2/N 2, and Ar/N 2. Each laboratory analyzed the occluded air in ice samples relative to their working standard. Analytical capabilities, blanks, and the external precision associated with each extraction procedure (defined below Table 1) are listed in Table 1. One specific objective of this intercalibration study was to investigate the apparent disagreement between the average glacial CH 4 values measured by different laboratories on the GISP2 and the

SOWERS ET AL.: EXTRACTING AND ANALYZING TRAPPED GASES IN ICE CORES 26,529
Table 2. Results of NOAA Analyses of Primary High Pressure Cylinders Used to Fill the 2-L Glass Flasks Which Were Distributed to All Labs for Analyses
Cylinder No. [CO21, ppmv [CH41. ppbv
109923 356.1+0.06 1488.2 + 3
114771 375.4+0.06 1824.4 + 3
111836 463.5 + 3
Greenland Ice Core Project (GRIP) ice cores from Summit, Greenland.
Experimental Techniques
Calibrating the Working Standards in Each Laboratory
For the first part of the study, samples of reference air were sent to each laboratory for analysis in 2-L glass flasks. Each glass flask was filled from one of three high-pressure cylinders that had been previously calibrated for CO2 and CH 4 by the National Oceanic and Atmospheric Administration/Climate Monitoring and Diagnostics Laboratory group (NOAA/CMDL) (Table 2). Note that the
elemental and isotopic composition of 0 2, Ar, and N 2 were not determined in these cylinders by NOAA. At least one, but generally two, glass flasks (equipped with two Louwers- Hapert,',• 0 to 9mm, viton O-ring valves), were filled to 1 atm. at the University of Rhode Island (URI) laboratory and sent to each laboratory where they were analyzed for as many constituents as possible. To insure the integrity of the flask samples, the CH 4 concentration was measured at URI immediately after being filled, as well as after the flasks had been analyzed and returned to the URI laboratory. Results suggest that the CH 4 concentrations in the returned flasks were within 0.5% of those of the parent cylinder. We conclude from these results that the filling and subsequent analyses of the flasks did not compromise the CH 4 composition to a measurable extent. While it may be possible that other constituents (i.e., CO 2, 02, or N 2) were compromised during the filling and subsequent analyses, our previous experience with these flasks suggests this is rather unlikely.
Analysis of a common air standard by each laboratory was necessary to calibrate working standards for the second part of the study, the ice-core analyses. As part of this comparison, 10 samples from the GISP2 short "F" core (10 cm diameter) were selected between 116.18 and 120.33 m.
below surface (mbs). Each sample was caretully inspected to insure there were no visible fractures in the ice that would
have compromised the integrity of the trapped air. The age of the occluded air in this interval corresponds to 1817-1832 A.D. [Wahlen et al., 1991' Alley et al., 1993]. Fossil air from this period was chosen for the intercalibration because the CO 2, CH 4, and N20 content of the atmosphere was fairly stable before, during, and after the study period [Wahlen et al., 1991' Etheridge et al., 1992; Blunier et al., 1993' Etheridge
etal., 1996]. Each -30-cm piece of ice was split lengthwise, providing two sections of core from the same depth interval. The ice was divided among the laboratories such that two laboratories analyzed samples from the same 30-cm interval.
Extraction Methods
Three methods have been developed to extract gases from ice: the wet, dry, and the sublimation techniques. The wet technique involves inserting an ice sample into an extraction vessel, evacuating the vessel, and then allowing the ice to melt in vacuo to liberate the trapped gases. This technique has been used to analyze constituents that are relatively insoluble and chemically stable in water (CH4, 02, N2, and Ar). During a dry extraction, the trapped gases are liberated without melting the ice. This is accomplished by placing an ice sample into a stainless steel extraction vessel where the ice is mechanically crushed, grated, or milled into very small pieces to release the occluded air parcels. Finally, a sublimation method has been used to separate large quantities of air from ice for gas analyses. This technique employs a glass extraction vessel t.,rough which infrared light is applied to heat the ice in vacuo to a temperature just below the melting point. The water vapor and liberated air is cryogenically removed from the sublimation vessel by cold traps [Wilson and Donahue 1989' Wilson and Donahue 1990; Wilson and Long this issue]
One major difference in these techniques is the extraction efficiency. The wet and sublimation extraction techniques liberate all air occluded in the bubbles, as well as any air dissolved in the ice matrix, resulting in extraction efficiencies which are generally higher than 99%. Dry extraction methods do not release air from all trapped bubbles and probably do not liberate any air which may be dissolved in the ice matrix [Wilson and Long, this issue]. Extraction efficiencies for the crushing techniques are generally below 80% [Zumbrunn et al., 1982' Barnola et al., 1983; Neftel et al., 1983]. The details of the extraction protocols used by the laboratories for various gases follow. The descriptions are general and intended to relay the pertinent aspects of the different techniques for comparative purposes. Further details can be found in the cited publications.
CO 2 analyses. Of the five laboratories listed in Table 1, tour measure the CO 2 concentration of trapped gases on a routine basis. Unfortunately the Bern laboratory (Physics Institute, University of Bern, (Bern)) was unable to participate in the CO 2 intercalibration because they were in the process of rebuilding their extraction device at the time of this study. There are two reasons why a wet extraction technique cannot be used for CO 2 analyses. First, CO 2 is extremely soluble in water, making quantitative extraction via a melt/refreeze technique almost impossible. Second, CO 2 may be produced in an extraction vessel if acidic aerosol species can attack carbonate dust particles. The probability of carbonate dust particles interacting with acidic aerosols is much higher when both species are suspended in a liquid medium.
The Commonwealth Scientific and Industrial Research
Organization (CSIRO) employs a "cheese grater" extraction device in which large ice samples (500-1500 g of ice at -80"C) are inserted into a cylinder of perforated stainless steel

26,530 SOWERS ET AL.' EXTRACTING AND ANALYZING TRAPPED GASES IN ICE CORES
(perforations toward the inside of a cylinder suspended inside a vacuum container). The container is then evacuated before
loading horizontally into a shaker device which oscillates back and forth, sliding the ice sample along the perforations. The ice-core sample is grated into very fine pieces (snow) which liberate the trapped gases. As soon as the ice has been
•grated, the air in the container is cryogenically transferred i•hrøugh a water trap (-100øC) to a cold finger (-•18K). The air sample is warmed before the CO 2 is separated from other constituents on a packed chromatography column, catalytically converted to CH4, and detected with a flame ionization detector [Etheridge et al., 1996].
The Scripps Institute of Oceanography (SIO) laboratory uses a microcrusher to liberate the gases trapped in small ice samples. The crusher (cooled to-60øC (213K)) contains a bed of tapered rods to crush the sample lightly to avoid pressure melting during extraction. The released air is rapidly condensed into a minisample tube cooled to -243"C (30K). Standard air samples are introduced over the crushed ice and analyzed in an identical fashion. After transfer, the trap is W•iarmed to-60øC (213K) and the gas is mixed into an IR cell with' a bellows assembly before the CO 2 is measured with a diode laser tuned to 4.3gm (R-12) [Wahlen et al., 1991],•:
At the Centre National de la Recherchd Scientifique Laboratoire de Glaciologie et Geophysique de l'Environnement (CNRS LGGE), a -•40-g ice sample is placed inside a stainless steel container with stainless steel ball bearings. After evacuation, the container is shaken vigorously to crush the ice into a very fine powder. The released gas is then expanded into a sample loop and injected into a gas chromatograph equipped with a thermal conductivity detector [Barnola et al., 1983].
The overall analytical precision of these dry extraction techniques for CO 2 analyses is generally better than +3 parts per million by volume. Uncertainties derive from difficulties in separating CO 2 t¾om H20 during the extraction, and from adsorption of CO 2 to the walls of the extraction apparatus [Zumbrunn et al., 1982; Barnola et al., 1983' Wahlen et al., 1991]. The overall experimental CO 2 blank is negligible.
CH 4 analyses. All five laboratories measure the CH 4 concentration of trapped gases in ice. Two laboratories use a dry extraction technique similar to that used for CO 2 and the other three use a wet extraction technique (Table 1). At LGGE and URI, an ice sample is inserted into an extraction vessel, which is then sealed and evacuated to pressures below 1 mbar (the approximate water vapor pressure over ice at-20øC). The vessel is then isolated and the ice melted, thereby liberating the trapped gases into the headspace above the water. Next, the water sample is refrozen from the bottom of the vessel to the top. This process forces the dissolved air into the head space. The ice is then cooled to temperatures between -80 and -110"C (URI) or-50øC (LGGE) to reduce the water vapor pressure in the head space.
The SIO procedure begins with the introduction of 100 g of ice into a 200-mL glass vessel sealed with a teflon O-ring before evacuation. The sample is allowed to melt before 50 mL of distilled/degassed water is introduced into the vessel in order to increase the total gas pressure in the headspace. The' sample is then refrozen to -10øC to force the dissolved air into the headspace. All three wet extraction techniques then allow the fossil air in the headspace to expand into a previously evacuated sample loop; the air is then injected into a gas chromatograph where the CH 4 is detected by a flame ionization detector.
The remaining two laboratories use a dry extraction procedure to liberate the trapped gases. The CSIRO laboratory uses the same aliquot of air from the large crusher for analyses of both CH 4 and CO 2. In Bern, a small milling device is used to shave a 12 to 20g ice sample to liberate the trapped gases. The gases are then trapped in a cryofocusing device (Porapak-Q TM column, cooled to -170øC) and analyzed with a gas chromatograph equipped with a flame ionization detector [Blunier et al., 1993; Fuchs et al.. 1993].
The experimental precision of the CH 4 analyses is generally better than 2% of preindustrial atmospheric values (700 ppbv). Part of the uncertainty can be attributed to variables associated with the chromatography. The other source of uncertainty comes from the extraction procedure itself. Those procedures involving a "melt-refreeze" cycle to liberate CH 4 tend to develop CH 4 contarnination that is proportional to the amount of time the ice sample remains in the liquid state. although the exact nature of this contamination is unclear. Multiple blank determinations at LGGE and URI inter a small and reproducible blank of 20+6 ppbv and 15+6 ppbv, respectively, indicating that the blank corrections can be made precisely. For those systems utilizing stainless steel bellows valves, a small CH 4 contamination may result from CH 4 outgassing from the bellows when the valve is opened or closed. Depending on the configuration and the tendency for CH 4 to outgas from a specific valve. varying amounts of CH 4 can be added to the sample [Chappellaz 1990].
The /50 ff•N 2,/5 ArfN 2,/5 •80, and /9SN analyses. Both wet and dry extraction procedures were used to separate the trapped gases from the ice for 02, Ar, and N 2 analyses [Sowers et al., 1989' Leuenberger, 1992]. After the gases are separated from the ice, the fossil air sample is allowed to expand into a sample reservoir on a mass spectrometer. The sample is then analyzed against a reference air standard and the results are reported using the standard delta notation. The elemental and isotopic results are reported as deviations from a standard. The •'SN/ •4N, •aO/•60, and Ar/N2 atmospheric ratios are extremely homogeneous and constant on millennial timescales. Therefore the atmosphere has been used as the primary standard for reporting the elemental and isotopic composition of O2, At, and N 2 in ice.
The O2/N 2 ratio of the atmosphere fluctuates by as much as 0.16%o on a seasonal basis due to photosynthesis and respiration [Keeling et al., 1996]. In addition, the atmospheric O2/1'42 ratio has been decreasing throughout the last century because of 0 2 consumption associated with fossil fuel combustion and land use changes. The measured fiO2/N 2 decline is approximately 0.014 %o/yr, while seasonal fluctuations in mid-high latitudes can be as large as 0.16%o [Keeling and Shertz 1992]. Therefore, depending on when a working standard was calibrated for O2/N 2, the resulting 502/N 2 values on fossil air could vary by as much as 0.2%0. However, because the analytical uncertainty associated with the O•N2 analyses in this study is greater than 1%o, seasonal or interannual O2/N 2 variations do not measurably affect the results in this study. The O2/N 2 ratio of trapped air in ice is not influenced by seasonal changes in the atmosphere because of mixing via molecular diffusion in the firn above the bubble close-off region.
The overall analytical precision of the elemental and isotopic analyses is generally better than 2%0 and +0.04%0, respectively. Part of the uncertainty derives from the mass spectrometric analyses (+0.8%0 for the elemental and +0.03%0
SOWERS ET AL.: EXTRACTING AND ANALYZING TRAPPED GASES IN ICE CORES 26,531
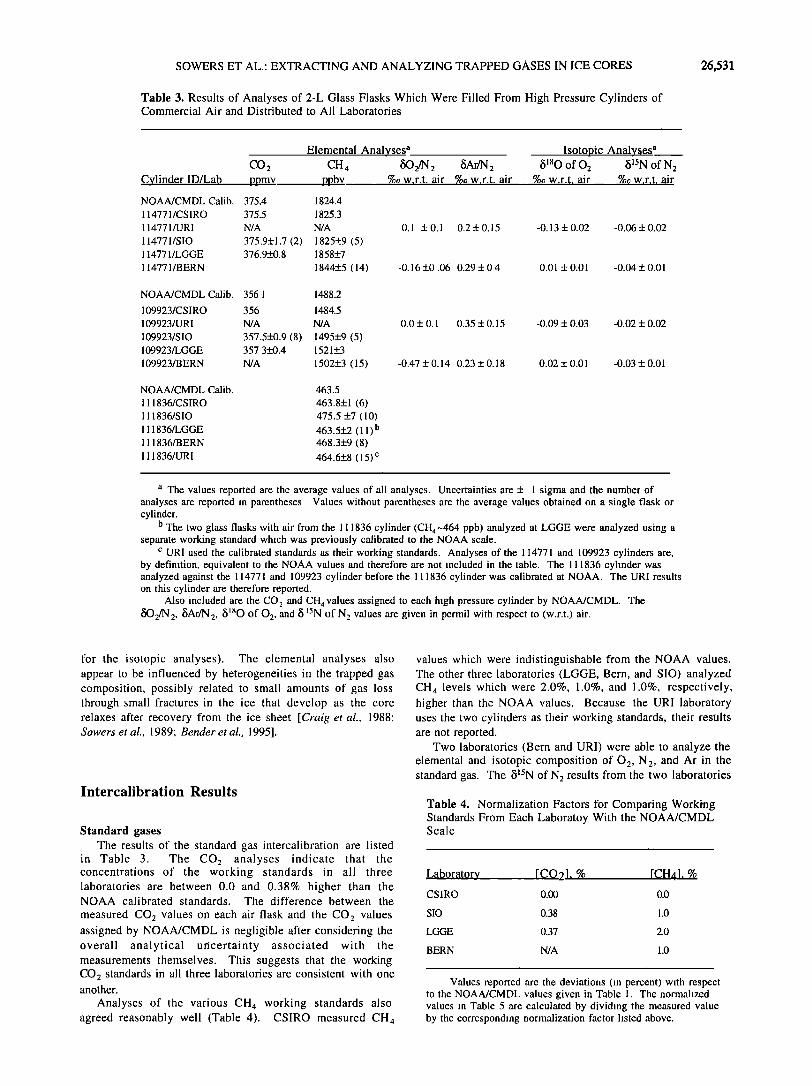
Table 3. Results of Analyses of 2-L Glass Flasks Which Were Filled From High Pressure Cylinders of Commercial Air and Distributed to All Laboratories
CO2 Cylinder ID/Lab ppmv
NOAA/CMDL Calib. 375.4 1824.4
114771/CSIRO 375.5 1825.3
114771/URI N/A N/A
114771/SIO 375.9+1.7 (2) 1825+9 (5) 114771/LGGE 376.9+0.8 1858+7
114771/BERN 1844+5 (14)
Elemental Analyses a CH 4 80 2/N 2 5Ar/N 2
ppbv %0 w.r.t. air %o w.r.t. air
Isotopic Analyses a 5•80 of 02 5•5N of N 2
%0 w.r.t. air %0 w.r.t. air
0.1 + 0.1 0.2 + 0.15 -0.13 + 0.02 -0.06 + 0.02
-0.16+0.06 0.29+0.4 0.01 +0.01 -0.04+0.01
NOAA/CMDL Calib. 356.1 1488.2
109923/CSIRO 356 1484.5
109923/URI N/A N/A
109923/SIO 357.5+0.9 (8) 1495+9 (5) 109923/LGGE 357.3+0.4 1521+3
109923/BERN N/A 1502+3 (15)
NOAA/CMDL Calib. 463.5
111836/CSIRO 463.8+1 (6) 111836/SIO 475.5 +7 (10)
111836/LGGE 463.5+2 (11) b 111836/BERN 468.3+9 (8)
111836/URI 464.6+8 (15) c
0.0 + 0.1 0.35 + 0.15 -0.09 + 0.03 -0.02 + 0.02
-0.47 + 0.14 0.23+0.18 0.02+0.01 -0.03+0.01
a The values reported are the average values of all analyses. Uncertainties are + I sigma and the number of analyses are reported in parentheses. Values without parentheses are the average values obtained on a single flask or cylinder.
b The two glass flasks with air from the 111836 cylinder (CH4-464 ppb) analyzed at LGGE were analyzed using a separate working standard which was previously calibrated to the NOAA scale.
c URI used the calibrated standards as their working standards. Analyses of the 114771 and 109923 cylinders are, by definition, equivalent to the NOAA values and therefore are not included in the table. The 111836 cylinder was analyzed against the 114771 and 109923 cylinder before the 111836 cylinder was calibrated at NOAA. The URI results on this cylinder are therefore reported.
Also included are the CO 2 and CH 4 values assigned to each high pressure cylinder by NOAA/CMDL. The fiO2/N 2, 5Ar/N 2, 5•aO of 02, and •5 •'SN of N 2 values are given in permil with respect to (w.r.t.) air.
for the isotopic analyses). The elemental analyses also appear to be influenced by heterogeneities in the trapped gas composition, possibly related to small amounts of gas loss through small fractures in the ice that develop as the core relaxes after recovery from the ice sheet [Craig et al., 1988; Sowers et al., 1989; Bender et al., 1995].
Intercalibration Results
Standard gases The results of the standard gas intercalibration are listed
in Table 3. The CO2 analyses indicate that the concentrations of the working standards in all three laboratories are between 0.0 and 0.38% higher than the NOAA calibrated standards. The difference between the
measured CO2 values on each air flask and the CO2 values assigned by NOAA/CMDL is negligible after considering the overall analytical uncertainty associated with the measurements themselves. This suggests that the working CO2 standards in all three laboratories are consistent with one another.
Analyses of the various CH 4 working standards also agreed reasonably well (Table 4). CSIRO measured CH 4
values which were indistinguishable from the NOAA values. The other three laboratories (LGGE, Bern, and SIO) analyzed CH 4 levels which were 2.0%, 1.0%, and 1.0%, respectively, higher than the NOAA values. Because the URI laboratory uses the two cylinders as their working standards, their results are not reported.
Two laboratories (Bern and URI) were able to analyze the elemental and isotopic composition of 02, N2, and Ar in the standard gas. The 5•SN of N 2 results from the two laboratories
Table 4. Normalization Factors /'or Comparing Working Standards From Each Laboratoy With the NOAA/CMDL Scale
Laboratory [CO21, % [CH41, %
CSIRO 0.00 0.0
SIO 0.38 1.0
LGGE 0.37 2.0
BERN N/A 1.0
Values reported are the deviations (in percent) with respect to the NOAA/CMDL values given in Table 1. The normalized values in Table 5 are calculated by dividing the measured value by the corresponding normalization factor listed above.

26,532 SOWERS ET AL.' EXTRACTING AND ANALYZING TRAPPED GASES IN ICE CORES
Table 5. Results of CO2 and CH4 Analyses on GISP 2 Ice Between 1 16 and 121 Meters Below the Surface (mbs)
Normalized to NOAA/CMDL
Depth,mbs/lab ID [CO2], ppmv [CH4], ppbv 116.30-116.35/URI 739(1) 116.63-116.9/CSIRO 289.6(1) 770.6( 1 ) 116.7-116.75/URI 737 + 6(2) 117.02-117.04/SIO 290.5 + 11(3) 117.09-117.11/SIO 303.6 + i1(3) 117.115-117.135/SIO 292.0 + 22(3) 117.28-117.33/SIO 751 + 15(1) 117.3-117.33/URI 753 + 14(2) 117.48-117.52/LGGE 740 + 11(2) 117.53-117.57/LGGE 741 + 10(1) 117.6-117.65/URI 754 + 10(2) 118.00-118.33/CSIRO 291.5(1) 763.4(1) 118.3-118.32/BERN 762 + 1(3) 118.407-118.453/LGGE 734 + 7(2) 118.42-118.444/SIO 273.7 + 15(2) 118.45-118.48/SIO 266.6 + 15(3) 118.453-118.483/LGGE 281.8 + 2(1) 118.483-118.513/LGGE 291.5 + 2(1) 118.57-118.63/SIO 745 + 19(1) 118.70-119.01/CSIRO 291.9(1) 758.4(1) 118.72-118.74/SIO 256.1 + 23(2) 118.74-118.76/SIO 249.3 + 3(3) 119.045-119.065/SIO 281.4 + 2(3) 119.17-119.23/SIO 753 + 20(1) 119.185-119.205/SIO 275.2 + 10(2) 119.22-119.27/SIO 747 + 20(1) 119.27-119.33/SIO 745 + 17(1) 119.74-119.78/LGGE 736 + 7(2) 119.76-119.80/LGGE 737 + 7(2) 119.80-119.83/LGGE 289.0 + 2(1) 119.83-119.86/LGGE 288.9 + 3(1) 119.86-119.89/LGGE 289.9 + 4(1) 119.89-119.92/LGGE 294.4 + 3( 1 ) 120.02-120.04/SIO 279.4 + 1(2) 120.04-120.06/SIO 281.6 + 10(3) 120.07-120.09/SIO 288.6 + 0.1 (2) 120.17-120.23/SIO 747 + 15(1) 120.22-120.27/SIO 744 + 21(1)
Average normalized values 283 + 13(21) 748 + 10(20)
Uncorrected
[CO2], ppmv
289.6(1)
291.6 + 11(3) 304.7 + 11(3) 293.1 + 22(3)
291.5( 1 )
274.7 + 15(2) 267.6 + 15(3)
282.8 + 2(1) 292.6 + 2(1)
291.9(1) 257.1 + 23(2) 250.2 + 3(3) 282.4 + 2(3)
276.2 + 10(2)
290.1 + 2(1) 290.0 + 3(1 )
291 + 4(1) 295.5 +3(1) 280.4 + 1(2)
282.6 + 10(3) 289.7 + 0.1(2)
[CH4], ppbv 739(1) 770.6(1) 737 + 6(2)
759 + 15(1) 753 + 14(2) 755 + 11(2) 756 + 10(1) 754 + 10(2) 763.4(1) 769 + 1(3) 749.5 + 7(2)
753 + 19(1) 758.4(1)
761 + 20(1)
755 + 20(1) 753 + 17(1)
751 + 7(2) 752 + 7(2)
755 + 15(1) 754 + 21(1)
The CO 2 and CH 4 values listed have been corrected for procedural blanks listed in Table 1. Results in the second and third columns have been further corrected by normalizing to the NOAA/CMDL standard scale using the correction factors in Table 4. None of the data have been corrected for gravitational fractionation. The magnitude of the correction is -1.5 ppm and +2.7 ppb for CO2 and CH 4 respectively, based on an average 15•5N of N 2 = 0.32%0 (Table 6 and equation (11) from Sowers et al., [1989]). Stated uncertainties are + 1 sigma.
were identical within the overall analytical uncertainty (Table 3). The 15•aO results from URI were lower than Bern by 0.13+0.02%o. One possible explanation /'or this 15 laO discrepancy involves the presence of substantial amounts of water vapor in some of the glass flasks which were used to transport aliquots of the URI working standards. Adsorption and/or isotopic exchange of water vapor with 0 2 may have compromised the isotopic composition of the standard air in the source of the mass spectrometer. The origin and concentration of the water vapor are unclear. The 15 O2/N2 and 5Pa'/N2 data from the two laboratories were consistent, although there does appear to be a slight (0.4%0) discrepancy
in the 1502/N2 data with the URI values being higher than the Bern values. This latter difference could be due to previously mentioned difficulties in calibrating the •O2/N2 of the working standard against present-day air.
Analyses of the Trapped Gases in the GISP2 Ice Core CO 2 and CH 4 results on the fossil air extracted from the
GISP2 ice core are included in Table 5 and illustrated in
Figures 1 and 2, respectively. In addition to the raw data, we have calculated and included the results from each laboratory on the NOAA calibration scale, using the normalization

SOWERS ET AL.: EXTRACTING AND ANALYZING TRAPPED GASES IN ICE CORES 26,533
290 280 270
260 -. CSIRO
ß SIO
_ x LGGE :
250 I,,,,,,,,, I m,,,,, ,, i,,,,,,,,, 117 118 119 120
Depth (mbs) Figure 1, CO 2 normalized to the NOAA concentration scale using the normalization factors in Table 4. All data are plotted with _+l-sigma error bars. A horizontal line corresponding to the average value tbr each laboratory was drawn across the depth interval where the analyses were made.
results for the intercalibration ice. All data have been corrected for procedural blanks and
factors in Table 4. All data in Table 5 have been corrected
for blank values in Table 1. In the case of CO2, the average concentration was 283_+13 ppmv tbr twenty one discrete depths. Note that the standard deviation about the mean of all 21 analyses (_+13 ppmv) is considerably higher than the averaged external reproducibility of CO2 measured in ice by each laboratory (-+6 ppmv). Normalized CO2 values measured at LGGE (N=6) and CSIRO (N=3) differed by 1.7 ppmv. The average CO2 value measured at SIO (N=12)was 11 ppmv lower than either LGGE or CSIRO. These results suggest that the CO2 concentration along the 4.2-m section of intercalibration ice is not homogeneous.
In contrast, the normalized CH4 results from the intercalibration ice were mostly consistent. The average of 20 discrete samples was 748_+10 ppbv. This range of values is comparable to the external precision associated with the CH4 measurements, suggesting that the CH• concentration in all intercalibration ice was constant. In all cases, LGGE provided the lowest average CH• value (738 -+ 3 ppbv, N-5) (Figure 2). The Bern and CSIRO data (762 and 764 ppbv, respectively) agreed within their uncertainties and were both higher than the SIO and URI data (747 and 746 ppbv, respectively). It is noteworthy that the two laboratories using dry extraction techniques both generated mean CH• values that were slightly higher (-20 ppbv) than those laboratories using a wet extraction technique. This difference is larger than the external precision of the measurements and may be
related to differences in the extraction efficiencies and/or
errors in blank estimates during the period when the intercalibration ice was analyzed.
Analyses of the isotopic and elemental composition of 02 , N2, and Ar in trapped air t¾om the intercomparison ice were performed at two laboratories, URI and Bern (Table 6). The average • •SN values were 0.32_+0.01%o and 0.39_+0.05%0 tbr URI and Bern, respectively. The difference between the mean values determined by the two laboratories ('0.07%0) is outside the 95% confidence limits for the two sets of
analyses. The average •80 values from URI were 0.12%o lower than Bern and slightly larger than the analytical uncertainties of the two laboratories. As the average •5•80 values from the two laboratories were approximately twice the •5 •SN values, the artifact appears to be mass dependent. We suspect that this artifact is related to the sample extraction protocol or analytical procedures in one or both of the laboratories, although the precise origin is not clear. Because the artifact appears to be mass-dependent, the calculated •80/•60 ratio of paleoatmospheric 02 (•18Oatm =
18 515 b Omea.suzv d - 2 * 'Nmeasurcd ) [Sowers et al., 1989] from the two sets of analyses are in complete agreement (b180•,tm = 0.03 _+0.01%o).
The average •O2/N2 and •Ar/N2 data from the two laboratories were also consistent with one another as well as
with previous measurements on the GISP2 core [Bender et al., 1995]. There is a large amount of scatter in the elemental

26,534 SOWERS ET AL.' EXTRACTING AND ANALYZING TRAPPED GASES IN ICE CORES
790
780 - ß
- CSIRO Ave. CH 4 770
760 URI Ave. CH 4
,,750 .!=
740
• CSIRO
ß ß SIO
ß .i .... • X LGGE
• URI
(3 Bern
Bern CH 4 .
. .
SIO Ave. CH 4
LGGE Ave. CH 4
720
117 118 119 120
Depth (mbs) Figure 2, CH 4 results for the intercalibration ice. All data have been corrected for procedural blanks and normalized to the NOAA concentration scale using the normalization factors in Table 4. All data are plotted with +l-sigma error bars. A horizontal line corresponding to the average value was drawn across the depth interval where the analyses were made. As there was only one depth measured by the Bern laboratory, no horizontal line is displayed.
data which has previously been attributed to heterogenieties in the bubble composition resulting from differential gas loss through microfractures [Bender et al., 1995].
Discussion
Heterogeneous Bubble Composition One of the greatest uncertainties associated with this type
of intercalibration is the degree to which the composition of
the trapped air in the 4.2-m section of GISP2 ice (used for this study) is homogeneous. There are at least three possible causes of heterogeneous gas composition over centimeter spatial scales: (1) neighboring bubbles may be closed off at different depths in the firn-ice transition region, thereby trapping air of slightly different age, (2) compositional alterations may occur along microfractures in the ice whereby occluded air can escape as the ice relaxes,
Table 6. Elemental and Isotopic Composition of 02, N 2, and Ar in the GISP 2 Ice Core
Elemental Analyses Isotopic Analyses fiO2/N 2, bAr/N> b•80 of 02, biSN of N2,
Depth Interval / lab %0 w.r.t. air %0 w.r.t. air %0 w.r.t. air %0 w.r.t. air 116.15-116.21/BERN -3.8 -2.5 0.75 0.34
116.25-116.27/URI -3.5 -9 0.65 0.31
116.80-116.82/URI -5.8 + 9 (2) 9.5 + 0.9 (2) 0.66 + 0.02 (2) 0.32 + 0.006 (2)
117.20-117.22/URI -9.0+ 1.7 (2) -9.0+ 1.7 (2) 0.73 +0.05 (2) 0.33 +0.01 (2)
117.7-117.75/URI -9.1 + 5.3 (2) 4.2 + 5.9 (2) 0.68 + 0.02 (2) 0.33 + 0.001 (2)
119.73-119.83/BERN -2.5 -1.3 0.88 0.44
120.01 - 120.11 / BERN - 1.1 -0.7 0.78 0.39
Depth values are given in meters below surface. All other values are in permil with respect to (w.r.t.) present day air.

SOWERS ET AL.: EXTRACTING AND ANALYZING TRAPPED GASES IN ICE CORES 26,535
and (3)chemical reactions within the ice may alter the trapped gas composition [Sowers et al., 1989; Anklin et al., 1995; Bender et al., 1995]. To address this potential heterogeneity, we split each core section into two equal halves. Each of the half-core sections was then shipped to a different laboratory l.or analyses so we could obtain two data sets from exactly the same depth interval. With the exception of CO2, •O2/N2, and b•'/rq2, our results suggest that the gases are essentially homogeneous (within analytical uncertainty) throughout the 4.2-m section. Variability in the •O2/N2 and b•'/rq2 ratios has previously been documented in closely spaced samples t¾om numerous cores [Sowers et al., 1989]. It is noteworthy that this artifact is probably not related to the CO2 variability in Greenland ice because the magnitude of the bø2/rq2 and b•'/rq2 variations is much smaller than the measured CO2 variability [Sowers et al., 1989].
Extreme CO2 Variations Delmas [1993], Anklin et al. [1995], and Barnola et al.
[1995] suggested that the high degree of variability associated with Greenland CO 2 measurements may be related to CO 2 liberation from carbonate dust due to dissolution by acid species in the ice or the in situ decomposition of organic acids. As the concentrations of carbonate dust, organic acids and hydrogen ions vary considerably over small spatial scales [Mayewski et al., 1993], it is entirely possible that the large CO 2 variations we observed in Greenland ice were caused by in situ carbonate dissolution. We conclude therefore that it is
impossible to make a detailed CO 2 intercomparison using Greenland ice. Future efforts in this regard will use ice from an Antarctic ice core which has much lower dust and H +
concentrations and thus has CO 2 concentrations that are both representative of the past atmosphere and homogeneous over larger spatial scales [Etheridge et al., 1996].
Glacial CH 4 Data From GISP2 and GRIP One important reason for performing a CH 4
intercalibration was the apparent disagreement between the GISP2 and GRIP CH 4 data during the last glacial period (17,000 to 22,000 years before present (yr B.P.), Figure 3) [Chappellaz et al., 1993a, Brooketal., 1996]. We can think of three possible explanations for the apparent disagreement: (1) a calibration artifact between the two different CH 4 working standards used in the two laboratories (LGGE and URI), (2) an unidentified CH 4 blank associated with the analyses of glacial ice, or (3) nonlinearities in the flame ionization detector(s) used.
We present the CH4 data from the two ice cores covering the last 40,000 years along with the isotopic composition of the ice (•5 •80•c c) in Figure 3. GRIP CH 4 data were generated by the LGGE and Bern laboratories [Blunier et al., 1993; Chappellaz et al., 1993; Blunier et al., 1995] and the GISP2 CH4 data were measured at URI [Brook et al., 1996]. We have constructed a common timescale by mapping the GRIP •5•8Oico record [GRIP Members 1993] into the GISP2 record [Grootes et al., 1993], which has been dated by counting annual layers throughout the GISP2 core [Alley et al., 1993; Meese etal., 1994]. The gas age-depth relation was derived by correcting for the ice age-gas age differences all along the cores using the protocol described by Brook et al. [1996]. After placing the two CH 4 records on a common timescale,
the data from the various laboratories were normalized to the
NOAA scale using the normalization factors listed in Table 4. The normalization tends to exaggerate the CH 4 discrepancy between the GRIP and GISP2 cores during the glacial period by 2%. Note that the original GRIP data from Blunier et al. [1995] were lowered by 15 ppbv to account for a previously unidentified blank associated with the Bern milling device. The GRIP data f¾om LGGE are directly from Chappellaz et al. [ 1993 a].
Between 0 and 9ka, all CH4 records agree. Prior to 9ka, URI values are consistently higher than corresponding GRIP values. The discrepancy is clearest during the Younger Dryas (11.7-13ka) and the peak of the last glacial period (between 17 and 23ka) where URI values are 50 ppbv higher. Because the two cores are located 28 kilometers apart in very similar climatological settings, the CH 4 records f¾om the two cores should be identical.
One major difference between the URI and LGGE extraction protocols is the use of a stainless steel extraction vessel at URI versus a glass vessel at LGGE. Since the URI values are higher than LGGE during these periods (but not during the Holocene), it is conceivable that the elevated URI values before 9ka are the result of an unexplained CH 4 contamination associated with the stainless steel vessel
which is not apparent in the younger samples. Owing to increasing hydrostatic pressure with depth in the ice sheet, the pressure in the bubbles increases until a threshold pressure is reached and the bubbles are slowly transformed into air hydrates, also know as clathrates [Gow et al., this issue]. The transformation in the GISP2 and GRIP cores occurs between 1300 and 1500 meters (7.4-9.3 ka), with all fossil air samples below this depth found in clathrate form. When samples of clathrated ice are allowed to melt, they tend to explode due to the rapid destabilization of the clathrates. One potential explanation for the elevated URI values in the clathrated ice involves enhanced CH 4 outgassing from the stainless steel vessels as the ice shards from the exploding ice strike the walls. However, this explanation does not appear to hold during the Bolling and Older Dryas periods (13-17 ka) where URI and LGGE show good agreement in clathrated ice.
Because the discrepancy is largest when the measured values are below 550 ppbv, another explanation for the observed difference may involve nonlinear responses in one or both of the laboratories' flame ionization detectors.
However, the analyses performed in all laboratories on the standard air with a nominal CH4 concentration of 463.5 ppbv (NOAA scale) (Table 2) do not support this explanation.
Finally, it is also possible that the magnitude of the blank may depend on the concentration of CH4 in the sample. Here again, however, blank determinations using different standards with varying CH 4 concentrations do not support this explanation. Both URI and LGGE have performed blank determinations using standard gases with CH 4 concentrations below 489 ppbv. Neither laboratory demonstrated any dependence of the blank on the CH 4 concentration.
At present, we do not have an acceptable explanation f.or the different CH 4 values measured by URI and LGGE during the Younger Dryas and last glacial periods. Future efforts to resolve this issue will focus on analyses of glacial ice from the Vostok and other Antarctic ice cores. At Vostok, ice containing fossil air from between 18 and 26 ka is found between 400 and 600 m, which is well above the depth at which the bubbles begin to l.orm clathrates.

26,536 SOWERS ET AL.' EXTRACTING AND ANALYZING TRAPPED GASES IN ICE CORES
-34
-36
-38
-40
-42
GRIP (Bern) CH 4
GRIP (LGGE) CH 4
GISP2
81 8Oice
GISP2 (URI) CH 4
....... GRIP CH 4 & BERN CH4 O LGGE CH4
GISP2 (• S Oi• --!,,,- GISP2 ON 4
8OO
700
600
500
400
0 10 2O 3O 4O Age (ka)
Figure 3, Isotopic temperature (•5 •aO,•) [ Grootes et al., 1993' Stuiver et at., 1995] and CH 4 records from the GRIP [Btunier et al., 1993; Chappellaz et al., 1993' Blunier et at., 1995] and GISP2 [Brook et al., 1996] ice cores covering the last 40ka. The timescale for all records is that of the GISP2 core. All CH 4 data have been corrected for blanks and normalized to the NOAA scale using normalization factors in Table 4. None of the CH 4 data have been corrected for gravitational fractionation. This correction is less than 3 ppbv and will not affect the difference between the two records as the correction is nearly the same for both cores. Note the excellent agreement between the records between 0 and 9ka. Prior to 9ka, URI CH 4 data appear to be -50 ppbv higher than the corresponding GRIP data during cold periods.
Conclusions
The ice-core air extraction techniques have been shown to produce similar results for the ice tested (relatively shallow ice from a cold, moderate accumulation rate site in central Greenland). The CO 2 standard scales at the various laboratories agreed with the NOAA scale within +0.38%. For CH 4 analyses, all laboratory standards agreed within +2%. The average CO 2 and CH 4 values measured on the intercalibration ice (corrected for the slight differences in working standards) were 283+13 ppmv and 748+10 ppbv, respectively. The CO 2 data show excessive scatter which we believe is related to CO2-producing impurities in Greenland ice.
The CH 4 results from the intercalibration ice showed subtle differences between the five laboratories which
measured CH 4. The standard deviation of all measurements
about the mean CH 4 value (+10 ppbv) is comparable to the overall analytical uncertainty for the CH 4 measurements, suggesting that much of the observed scatter is the result of analytical uncertainties as opposed to artifacts associated with the extraction procedures. However, results from the dry extraction techniques (CSIRO and Bern) are, on average, 20 ppbv higher than the average results of the melt extraction techniques and are 26 ppbv higher than the mean LGGE results. These differences are slightly more than can be explained by the known measurement errors. While we have not been able to identify the cause of this discrepancy, we believe that the blanks we determined for some of the
extraction procedures may be slightly underestimated for actual ice core samples. Therefore, when comparing CH 4 records from different laboratories at high precision levels (i.e., <20 ppbv), the interlaboratory differences in calibration scales and extraction procedures need be taken into account.

SOWERS ET AL.: EXTRACTING AND ANALYZING TRAPPED GASES IN ICE CORES 26,537
The elemental and isotopic compositions of 0 2, N 2, and Ar trapped in the intercalibration ice were measured by two laboratories. The 15•SN of N 2, the •")2/N2, and the 15m'/N2 data from the two laboratories were consistent with one another
within analytical uncertainties. The average •5•aO ofO 2 data from URI were 0.12%o lower than the Bern values. Estimates
of the 15•aO of the atmospheric 0 2 between 1817 and 1832 A.D. were in complete agreement (•18Oatm= 0.03 '3-0.01%o) with previous measurements.
Acknowledgments. T.A.S. and E.J.B. would like to thank M. Bender, J. Orchardo, T. Ellis, and M. Swanson for help in filling and analyzing calibration air and ice-core samples in URI. Support for T.A.S. was derived from NSF-OPP grant 93-21558. Ice core research at URI was supported by grants from the U.S. National Science Foundation. E.J.B. was also supported by a NOAA Climate and Global Change postdoctoral fellowship. D.M.E. thanks Ray Langenfelds, Darren Spencer, and Marco Lucarelli for their skilled operation and maintenance of laboratory instruments. Participation of D.M.E. in the intercomparison was supported in part by funding from the Australian Department of Environment, Sport and Territories (DEST) through the National Greenhouse Core Research Program.
References Alley, R. B., D. Meese, C. A. Shuman, A. J. Gow, K. Taylor, M.
Ram, E. Waddington, J. W. C. White and P. Mayewski, Abrupt accumulation increase at the Younger Dryas termination in the GISP2 ice core, Nature, 362, 527-529, 1993.
Anklin, M., J.-M. Barnola, J. Schwander, B. Stauffer and D. Raynaud, Processes affecting the CO: concentrations measured in Greenland ice, Tellus, 47B, 461-470, 1995.
Barnola, J. M., D. Raynaud, A. Neftel and H. Oeschger, Comparison of CO 2 measure•nents by two laboratories on air from bubbles in polar ice, Nature, 302, 401-413, 1983.
Barnola, J. M., D. Raynaud, Y. S. Korotkevich and C. Lorius, Vostok ice core provides 160,000-year record of at•nospheric CO 2, Nature, 329, 408-414, 1987.
Barnola, J. M., P. Pimienta, D. Raynaud and Y. S. Korotkevich, CO 2- climate relationship as deduced from the Vostok ice core: A reexamination based on new measurements and on a reevaluation
of the air dating, Tellus, Ser. B, 43b, 83-90, 1991. Barnola, J. M., M. Anklin, J. Porcheron, D. Raynaud, J. Schwander
and B. Stauffer, CO 2 evolution during the last millennium as recorded by Antarctic and Greenland ice, Tellus, Set. B, 47b, 264- 272, 1995.
Bender, M., T. Sowers and V. Lipenkov, On the concentrations of 02, N 2 and Ar in trapped gases from ice cores, J. Geophys. Res., 100, 18,651 - 18,660, 1995.
Blunier, T., J. A. Chappellaz, J. Schwander, J. M. Barnola, T. Desperts, B. Stauffer and D. Raynaud, Atmospheric methane record from a Greenland ice core over the last 1000 years, Geophys. Res. Lett., 20, 2219-2222, 1993.
Blunier, T., J. Chappellaz, J. Schwander, B. Stauffer and D. Raynaud, Variations in atmospheric methane concentration during the Holocene epoch, Nature, 374, 46-49, 1995.
Brook, E., T. Sowers and J. Orchardo, Rapid variations in atmospheric methane concentration during the past 110,000 years, Science, 273, 1087-1091, 1996,
Chappellaz, J., Etude du methane atmospherique au cors du dernier cycle climatique. A patir de l'analyse de l'air piege dans la glace Antartique, Univ. of Grenoble, Grenoble, France, 1990.
Chappellaz, J., T. Blunier, D. Raynaud, J. M. Barnola, J. Schwander and B. Stauffer, Synchronous changes in at•nospheric CH 4 and Greenland climate between 40 and 8 kyr B P, Nature, 366, 443- 445, 1993.
Chappellaz, J. A., I. Y. Fung and A.M. Thompson, The atmospheric CH 4 •ncrease since the last glacial maximu•n (1) Source estimates, Tellus, Set. B. 45b, 228-241, 1993.
Craig, H., Y. Horibe and T. A. Sowers, Gravitational separation of
gases and isotopes in polar ice caps, Science, 242, 1675-1678, 1988.
Delmas, R. J., A natural artifact in Greenland ice-core CO 2 measurements, Tellus, Ser. B, 45b, 391-396, 1993.
Etheridge, D. M., G.I. Pearman and F. Silva, Atmospheric trace-gas variations as revealed by air trapped in an ice core from Law Dome, Antarctica, Annals ql"Glaciology, 10, 28-33, 1988.
Etheridge, D. M., G. I. Pearman and P. J. Fraser, Changes in tropospheric methane between 1841 and 1978 from a high accumulation rate Antarctic ice core, Tellus, 44B, 282-294, 1992.
Etheridge, D. M., L. P. Steele, R. L. Langenfields, R. J. Francey, J.- M. Barnola and V. I. Morgan, Natural and anthropogenic changes in atmospheric CO2 over the last 1,000 years from air in Antarctic ice and firn, J. Geophys. Res., 101, 4115-4128, 1996.
Fuchs, A., J. Schwander and B. Stauffer, A new ice mill allows precise concentration determination of methane and most probably also other trace gases in the bubble air of very small ice samples, J. of Glaciol., 39, 199-203, 1993.
Gow, A. J., d. M. Meese, R. B. Alley, J. J. Fitzpatrick, S. Anandadrishnan, G. A. Woods and B. C. Elder, Physical and structural properties of the Greenland Ice Sheet Project 2 ice core: A review, J. Geophys. Res., this issue.
Greenland Ice Core Project Members, Climate instability during the last interglacial period recorded in the GRIP ice core, Nature, 364, 203-207, 1993.
Grootes, P.M., M. Stuiver, J. W. C. White, S. Johnsen and J. Jouzel, Comparison of oxygen isotope records from the GISP2 and GRIP Greenland ice cores, Nature, 366, 552-554, 1993.
Keeling, R. F., S. C. Piper and M. Heimann, Global and hemispheric CO: sinks deduced from changes in atmospheric 0 2 concentration, Nature, 381, 218-221, 1996.
Keeling, R. F. and S. R. Shertz, Seasonal and interannual variations in atmospheric oxygen and implications for the global carbon cycle, Nature, 358, 723-727, 1992.
Leuenberger, M., Isotopen-sowie Konzentrationsbestimmung and CO 2, N 20, O 2, N 2 in luftproben aus polarem eis, Ph.D. thesis, Univ. of Bern, Bern, Switzerland, 1992.
Mayewski, P. A., L. D. Meeker, M. C. Morrison, M. S. Twickler, S. I. Whitlow, K. K. Ferland, D. A. Meese, M. R. Legrand and J. P. Steffensen, Greenland ice core "signal" characteristics' An expanded view of climate change, J. Geophys. Res., 98, 12,839- 12,847, 1993.
Meese, D., R. Alley, T. Gow, P. Grootes, P. Mayewski, M. Ram, K. Taylor, E. Waddington and G. Zielinski, Preliminary depth-age scale of the GISP2 ice core, CRREL Spec. Rep. 94-1, Cold Reg. Res. and Eng. Lab., Hanover, N.H., 1994.
Moor, E. and B. Stauffer, Instruments and methods. A new dry extraction system for gases in ice, J. Glaciol., 30, 358-361, 1984.
Neftel, A., H. Oeschger, J. Schwander and B. Stauffer, Carbon dioxide concentration in Bubbles of natural cold ice, Journal el" Physical Chemistry, 87, 4116-4120, 1983.
Neftel, A., E. Moor, H. Oeschger and B. Stauffer, Evidence from polar ice cores for the increase in atmospheric CO 2 in the past two centuries, Nature, 315, 45-47, 1985.
Neffel, A., H. Oeschger, T. Staffelbach and B. Stauffer, CO 2 record in the Byrd ice core 50,000-5,000 years BP, Nature, 331,609-611, 1988.
Pearman, G. I., D. Etheridge, d.e Silva, F. and P. J. Fraser, Evidence of changing concentrations of atmospheric CO 2, N 20 and CH 4 from air bubbles in Antarctic ice, Nature, 320, 1986.
Scholander, P. F., J. W. Kanwisher and D.C. Nutt, Gases in icebergs, Science, 123, 104-105, 1956.
Schwander, J., The transformation of snow to ice and the occlusion of gases, in The Environmental Record in Glaciers and Ice Sheets, edited by H. Oeschger and C.C. Langway, pp. 53-67, John Wiley, New York, 1989.
Schwander, J. and B. Stauffer, Age difference between polar ice and the air trapped in its bubbles, Nature, 311, 45-47, 1984.
Schwander, J., B. Stauffer and A. Sigg, Air mixing in firn and the age of the air at pore close-off, Attn. Glaciol., 10, 141-145, 1988.
Sowers, T. A., M. L. Bender and D. Raynaud, Elemental and isotopic composition of occluded O 2 and N 2 in polar ice, J. Geophys. Res., 94, 5137-5150, 1989.
Stauffer, B., A. Neftel and H. S. Oeschger J., C. C. Langway, H. Oeschger and W. Dansgaard, CO 2 concentration in air extracted from Greenland ice samples, in Greenland Ice Core: Geophysics, Geochemistry, and the Environment, Geophys. Monogr. Ser. Vol.

26,538 SOWERS ET AL.: EXTRACTING AND ANALYZING TRAPPED GASES IN ICE CORES
33, edited by C. C. Langway et al., pp 85-90, AGU, Washington, D.C. 1985.
Stauffer, B., E. Lochbronner, H. Oeschger and J. Schwander, Methane concentration in the glacial atmosphere was only half that of the preindustrial Holocene, Nature, 332, 812-814, 1988.
Stuiver, M., P.M. Grootes and T. F. Braziunas, The GISP2 /5•O climate record of the past 16,500 years and the role of the sun, ocean and volcanoes, Quat. Res., 44, 341-354, 1995.
Wahlen, M., D. Allen, B. Deck and A. Herchenroder, Initial
measurements of CO,_ concentrations (1530 to 1940 AD) in air occluded in the GISP II ice core from Central Greenland, Geophys. Res. Lett., 18, 1457-1460, 1991.
Wilson, A. T. and d. F. Donahue, AMS carbon-14 dating of ice' progress and future prospects, Nuc. Inst. Method. Phys. Res., B52, 473-476, 1990.
Wilson, A. T. and D. J. Donahue, The recovery and dating of carbon dioxide in polar ice cores, Radiocarbon, 31,579-584, 1989.
Wilson, A. T. and A. Long, New approaches to CO 2 analysis in polar ice cores, J. Geophys. Res., this issue.
Zumbrunn, r., A. Neftel and H. Oeschger, CO 2 measurements on 1- 3 ß cm tce samples with an IR laserspectrometer (IRLS) combined with a new dry extraction device, Earth Planet. Sci. Lett., 60,
.,8/.,. 318-324, 1 ø"
J.-M. Barnola and J. Chappellaz, Laboratoire de Glaciologie et Geophysique de l'Environnement, CNRS, BP 96, 38402 St Martin d'Heres Cedex, France
T. Blunier, a. Fuchs, and M. Leuenberger Physics Institute, University of Bern, Sidlerstrasse 5, CH-3012, Bern, Switzerland
E. Brook, Department of Environmental Science,Washington State University, 14204 Salmon Creek Ave,Vancouver, WA 98686
B. Deck, M. Wahlen, and C. Weyhenmeyer, Scripps Institution of Oceanography, University of California, San Diego, La Jolla, 92093- 0220
D. Etheridge, Division of Atmospheric Research, Commonwealth Scientific and Industrial Research Organization, Aspendale, Victoria 3195, Australia
T. Sowers, Department of Geosciences, Pennsylvania State University, University Park, PA !6802-2714. (e-mail: sowers @ geosc.ps u.edu)
(Received January 16, 1996' revised August 16, 1996; accepted January 4, 1997.)