an integrative approach to delimiting species in a rare ... · an integrative approach to...
TRANSCRIPT

Molecular Ecology (2011) 20, 2771–2786 doi: 10.1111/j.1365-294X.2011.05124.x
An integrative approach to delimiting species in a rarebut widespread mycoheterotrophic orchid
CRAIG F. BARRETT* and JOHN V. FREUDENSTEIN†
*L. H. Bailey Hortorium and Department of Plant Biology, 412 Mann Library, Cornell University, Ithaca, NY 14850, USA,
†Department of Evolution, Ecology, and Organismal Biology, The Ohio State University Museum of Biological Diversity,
1315 Kinnear Road, Columbus, OH 43212, USA
Corresponde
E-mail: cfb66
� 2011 Black
Abstract
In the spirit of recent calls for species delimitation studies to become more pluralistic,
incorporating multiple sources of evidence, we adopted an integrative, phylogeographic
approach to delimiting species and evolutionarily significant units (ESUs) in the
Corallorhiza striata species complex. This rare, North American, mycoheterotrophic orchid
has been a taxonomic challenge regarding species boundaries, displaying complex patterns
of variation and reduced vegetative morphology. We employed plastid DNA, nuclear DNA
and morphometrics, treating the C. striata complex as a case study for integrative species
delimitation. We found evidence for the differentiation of the endangered C. bentleyi(eastern USA) + C. striata var. involuta (Mexico) from the remaining C. striata (= C. stri-ata s.s.; USA, Canada, Mexico). Corallorhiza striata involuta and C. bentleyi, disjunct by
thousands of kilometres (Mexico-Appalachia), were genetically identical but morpholog-
ically distinct. Evidence suggests the C. striata complex represents three species:
C. bentleyi, C. involuta and a widespread C. striata s.s under operational criteria of
diagnosability and common allele pools. In contrast, Bayesian coalescent estimation
delimited four species, but more informative loci and a resultant species tree will be needed
to place higher confidence in future analyses. Three distinct groupings were identified
within C. striata s.s., corresponding to C. striata striata, C. striata vreelandii, and
Californian accessions, but these were not delimited as species because of occupying a
common allele pool. Each comprises an ESU, warranting conservation considerations. This
study represents perhaps the most geographically comprehensive example of integrative
species delimitation for any orchid and any mycoheterotroph.
Keywords: integrative taxonomy, morphology, phylogeography, population
Received 29 November 2010; revision received 31 March 2011; accepted 13 April 2011
Introduction
Explicit species delimitation studies represent an essen-
tial component of systematics, yet they are currently
underrepresented relative to phylogenetic studies
(Wiens 2007). This is unfortunate, because delimiting
species represents a crucially important first step in
framing studies of conservation, ecology, evolution,
nce: Craig F. Barrett, Fax: (607) 255-5407;
@cornell.edu
well Publishing Ltd
phylogenetics and population genetics. However, there
is no universal consensus on how this should be accom-
plished, although numerous methods have been pro-
posed (e.g. Davis & Nixon 1992; Baum & Shaw 1995;
Doyle 1995; Wiens & Penkrot 2002; reviewed in Sites &
Marshall 2004; Knowles & Carstens 2007; Yang & Rann-
ala 2010). Despite important advances in sequencing
technology and coalescent theory [coalescent gene ⁄ spe-
cies tree approaches (e.g. Yang & Rannala 2010)], there
exists a strongly professed need to utilize multiple forms
of evidence. Many researchers favour a multifaceted,

2772 C. F . BARRETT and J . V . FREUDENSTEIN
integrative approach to delimiting species (e.g. Wiens &
Penkrot 2002; Sites & Marshall 2004; Dayrat 2005; Will
et al. 2005; Roe & Sperling 2007; Groenveld et al. 2009;
Leache et al. 2009; Padial & de la Riva 2010; Padial et al.
2010; Schlick-Steiner et al. 2010; Weisrock et al. 2010),
including the architects of a recently published Bayesian
coalescent molecular approach: ‘‘At a minimum, species
delimitation should rely on many kinds of data, such as
morphological, behavioural, and geographic evidence
(Yang & Rannala 2010).’’ We adopt a pluralistic, integra-
tive approach to delimiting species and ESUs in a group
of fungus-eating orchids, the Corallorhiza striata complex.
We utilize 14 quantitative morphological characters,
eight morphological landmarks, two plastid DNA loci
and three nuclear loci to investigate the patterns of varia-
tion and delimit species across populations spanning the
entire geographic range.
A case study in a widespread, variable orchid
Morphology, behaviour, phylogeography and popula-
tion genetics play important, often crucial, roles in taxo-
nomic and speciation studies, and thus are paramount
in conservation biology. Rangewide investigation is the
ideal method for informing species decisions, which in
turn provides the information necessary to best pre-
serve variation within the resultant taxa. The geo-
graphic ubiquity and unmatched species richness of
orchids among plants, combined with their tendency to
be rare and endangered (Dressler 1981, 1993), illustrate
the need for these types of studies. The Corallorhiza stri-
ata species complex is rare but widespread, highly vari-
able and has historically been a taxonomically
challenging group (Freudenstein 1997), owing to its
severely reduced vegetative and root morphology.
Thus, it will be especially crucial to examine multiple
sources of data in highly reduced parasitic and myco-
heterotrophic species, augmenting morphology with
DNA sequences. Barrett & Freudenstein (2009) identi-
fied four plastid DNA clades within the C. striata com-
plex. Corallorhiza striata var. involuta (Mexico) and the
endangered C. bentleyi (eastern USA) were virtually
identical for the loci examined, forming a distinct clade,
and were together highly divergent relative to the rest
of the complex. These two small-flowered, apparently
self-pollinating taxa were also morphologically distinct
from the remainder of the complex, and furthermore
distinct from one another, suggesting their recognition
as two separate species. The remaining populations of
C. striata, hereafter termed C. striata sensu stricto
(= s.s.), also formed a clade. Nested within this clade
were three subclades, each significantly differentiated in
terms of floral size. The large-flowered C. striata var.
striata (northern USA and Canada) was sister to the
smaller-flowered C. striata var. vreelandii, and these in
turn were sister to an intermediate-flowered clade ende-
mic to California.
Despite these preliminary findings, numerous ques-
tions remain regarding the patterns of variation in the
C. striata complex, especially as they relate to species
boundaries. Questions addressed here are as follows: (i)
In the context of geographic distribution, do nuclear
DNA, plastid DNA and morphology provide evidence
for separate species within the C. striata complex under
a phylogenetic species concept? (ii) Does Bayesian coa-
lescent analysis similarly delimit separate species? (iii)
What is the rangewide population structure of C. striata
s.s., and are vars. vreelandii, striata and Californian
accessions fully differentiated based on nuclear and
plastid DNA? (iv) Does nuclear DNA provide evidence
for gene flow between distinct plastid DNA ⁄ morphoge-
ographic groupings? (v) Lastly, is there evidence for
ESUs in the complex? To address these questions, we
utilized several analytical approaches, including gene
tree and network construction, assignment tests, hierar-
chical analysis of molecular variance, coalescent estima-
tion of gene flow, ordination, Bayesian species
delimitation and various other statistical tests. To our
knowledge, investigation of the C. striata complex rep-
resents one of the most geographically extensive analy-
ses to date for any orchid species complex (and also
any mycoheterotrophic species).
Materials and methods
Orchid sampling, DNA extraction, amplification,sequencing and phasing
Two to ten individuals were collected per sampling
locality across North America (Appendix S1, Support-
ing information). When possible, a single basal flower
per individual was collected for morphological analysis.
At least one individual from each population was vou-
chered at Ohio State University Herbarium. Sampling
efforts were focused towards C. striata in the USA and
Canada; accessions of C. bentleyi and C. striata var. in-
voluta were included in this study but could not be
sampled to the same extent as the remainder of C. stri-
ata because of rarity and difficulty obtaining material.
Individuals were sampled only if they were >1 m apart
to avoid sampling vegetative clones.
DNAs were extracted using a CTAB protocol (Doyle &
Doyle 1987). Plastid loci rbcL and rpl32-trnL spacer were
amplified and sequenced for 189 individuals following
Barrett & Freudenstein (2008) and Shaw et al. (2007),
respectively. Plastid outgroup taxa were chosen as in the
method described by Barrett & Freudenstein (2009). Sets
of published nuclear primers (e.g. Emshwiller & Doyle
� 2011 Blackwell Publishing Ltd

INTEGRATIVE ORCH ID SPECIES D ELIM ITATI ON 2773
1999; Strand et al. 2000) were tested on Corallorhiza striata
and congeners, resulting in only three regions that
amplified single bands. Primers NIAi3-F and NIAi3-R
(Howarth & Baum 2002) were used to amplify intron
three of nitrate reductase. The region corresponding to
RPB2 intron 23 in Arabidopsis thaliana was amplified with
primers P10-F and P11a-R (Denton et al. 1998). RPB2
encodes RNA polymerase II subunit B and is single copy
in diploid monocots (e.g. Specht 2006; Roncal et al. 2008).
The region corresponding to flavanone 3-hydroxylase
gene (F3H) intron II in the orchid Bromheadia finlaysoniana
was amplified with primers Flav-F2 and Flav-R (Taylor
et al. 2004). Both of these markers (RPB2 and F3H) have
been utilized successfully in congener C. maculata
(Taylor et al. 2004). Polyploidy has never been docu-
mented in Corallorhiza, and the diploid chromosome
number (2n) for C. striata is 42 (Love & Simon 1968; Love
& Love 1981).
Nuclear intron sequencing was completed as for plas-
tid loci (Barrett & Freudenstein 2008), for a total of 162
individuals each. Nitrate reductase showed clear evi-
dence of multiple copies, so no further sequencing was
undertaken for this locus. RPB2 and F3H introns each
demonstrated expected patterns for single copy genes.
No length variation was observed in either region, so
they were both sequenced directly, and ambiguity
codes were initially applied to heterozygous positions.
The nuclear ribosomal internal transcribed spacer (ITS)
was amplified and sequenced as in the method
described by Barrett & Freudenstein (2008). No evi-
dence of multiple ITS copies within individuals was
observed. Variation at this locus was informative but
limited, so a subset of individuals (n = 44) representing
nearly all populations from across the range was
sequenced to define ITS types. For the remaining indi-
viduals, allele-specific primers ITS-striata-R (GTTGGC
ACGAAGCGACGCAACA), ITS-vree-R (GTTGGCAC-
GAAGCGACGAAACG) and ITS-Cali-R (CCGACACA-
CAC TTAGGTGTGATT) were used in combination
with primer ITS1 (White et al. 1990) in a PCR assay to
identify the ITS types based on nucleotide polymor-
phisms. PCR conditions followed the procedure carried
out by Barrett & Freudenstein (2008). Each template
was subjected to PCR with each primer combination,
along with both negative and positive controls (i.e.
accessions previously sequenced) to confirm amplifica-
tion with the correct corresponding allele-specific
reverse primer. Sequences were aligned in MUSCLE 3.6
(Edgar 2004). Alignments were free of singleton muta-
tions that would likely represent PCR base misincorpo-
rations. PHASE 2.1.1 (Stephens et al. 2001; Stephens &
Donnelly 2003) was used to determine the allelic
sequences of heterozygous intron amplicons. Five inde-
pendent runs of 20,000 iterations were implemented
� 2011 Blackwell Publishing Ltd
from random seeds, discarding the first 5000 as burn-in
and allowing recombination. Runs indicated that a min-
imum posterior probability of 0.9 was recovered for
each position.
Recombination, phylogenetic and network analyses
Patterns derived from the plastid loci used in this study
were previously demonstrated to be free of topological
conflict (Barrett & Freudenstein 2009), so the loci were
combined as a single plastid data set. Gene trees for the
plastid matrix were constructed under both maximum
parsimony (MP) and likelihood (ML). TNT (Goloboff
et al. 2008) was used to implement MP searches, with
100 random addition sequence replicates and tree bisec-
tion-reconnection branch swapping, holding a total of
10 000 trees. Branch support was assessed via jackknif-
ing using the same search parameters as above for 5000
pseudoreplicates, with 37% deletion probability. The
GTR + I model was selected for combined plastid DNA
under the Akaike information criterion (Akaike 1974) in
MODELTEST (Posada & Crandall 1998). ML searches were
conducted in RAXML (Stamatakis 2006b), using the GTR-
MIX model, with C = 25 rate categories. GTRMIX uses
the GTRCAT approximation to assign per-site parame-
ters to a predefined number of categories and then uses
the GTR-C model to evaluate the likelihood (Stamatakis
2006a). Bootstrap searches (2000 replicates) were run
using the GTRCAT approximation (Stamatakis 2006a).
DNASP 4.10.1 (Rozas et al. 2003) was used to determine
the minimum number of recombination events (RM;
Hudson & Kaplan 1985) per nuclear intron. MAXCHI2
(Maynard Smith 1992) and GENECONV (Padidam et al.
1999) were employed using 10 000 permutations, with
Bonferroni correction for multiple comparisons (Rice
1989) in RDP3 (Heath et al. 2006). Lastly, the F-test was
implemented using SPLITSTREE 4 (Huson 1998; Huson &
Bryant 2006). Also estimated with DNASP were haplotype
diversity (h, the probability that two haplotypes are dif-
ferent), nucleotide diversity (p, the average number of
nucleotide substitutions per site of two randomly
drawn sequences; Nei & Li 1979; Tajima 1983), Tajima’s
D (Tajima 1989) and Fu’s FS (Fu 1997); the latter two
are tests of selective neutrality.
Trees of representative nuclear alleles were estimated
for each locus separately in PAUP 4.0b (Swofford 2003),
implementing MP heuristic searches as earlier (100
RAS, TBR, hold 10 000 trees), and 2000 jackknife repli-
cates using these same parameters. An accession of Cor-
allorhiza wisteriana (JVF 2789a FL) was used as the
outgroup for these sequences, which has been shown to
be a member of the sister clade to the C. striata complex
(Barrett & Freudenstein 2008; Freudenstein & Senyo
2008); this species was chosen because of difficulty

2774 C. F . BARRETT and J . V . FREUDENSTEIN
amplifying nuclear introns in the outgroup taxa chosen
for plastid DNA analyses. Nuclear relationships
between all sampled individuals of C. striata s.s. were
assessed via minimum-spanning networks in TCS 1.21
(Clement et al. 2000), with 95% connection limits.
Lastly, a multilocus distance network of relationships
between individuals within C. striata s.s. was obtained
with POFAD 1.03 (Joly & Bruneau 2006).
Analysis of population structure
Two approaches were employed to ascertain population
structure of C. striata s.s. First, a Bayesian genetic assign-
ment algorithm was implemented in STRUCTURE 2.3 under a
correlated allele frequency model allowing for admixture
of individuals (Pritchard et al. 2000). Plastid and nuclear
data were combined, with the ‘‘other’’ copy of the plastid
data per individual coded as missing (J. Pritchard, per-
sonal communication), and then STRUCTURE was run with
nuclear data only. Twenty replicate runs were completed
for values of the number of clusters, K, from K = 1–8. Runs
consisted of 10 000 000 generations of the Markov chain
Monte Carlo (MCMC), following a burn-in of 5 000 000
generations. The DK method (Evanno et al. 2005) was
used to determine the number of genetic clusters.
Second, analysis of molecular variance (AMOVA, Excof-
fier et al. 1992), implemented in ARLEQUIN 3.1 (Excoffier
et al. 2005), was used to assess the partitioning of
genetic variation among groupings and localities for
both plastid and nuclear data and its significance
(10 000 permutations). Plastid data (combined rbcL and
rpl32-trnL spacer) were partitioned by clade (excluding
C. bentleyi and C. striata var. involuta) and then by sam-
pling locality. Nuclear intron data were partitioned by
plastid clade membership, then by sampling locality
and individual; they were treated as unknown-phase
multilocus genotypes. AMOVA was not calculated for ITS
data, because of low polymorphism.
Gene flow estimation within C. striata s.s.
Coalescent analyses of gene flow were conducted in
MIGRATE 3.1.2 (Beerli & Felsenstein 1999, 2001) to assess
long-term nuclear gene flow between C. striata striata,
vreelandii and Californian accessions. MIGRATE uses the
Wright–Fisher model of gene flow to estimate the val-
ues Q = 4Nel and Mi fi j, where Ne = effective popula-
tion size, l = substitutions ⁄ site ⁄ generation (s ⁄ s ⁄ g) and
Mi fi j = migration rate from deme i to deme j. This
model assumes constant Ne, l, and M over time and
drift–migration equilibrium. Exponential and uniform
prior distributions were placed on Q (mean = 0.002,
range = 0.0–0.1) and M (mean = 100, range = 0–2000),
respectively; these priors outperformed various other
prior combinations in preliminary runs. Six heated Mar-
kov chains (temperatures 1, 1.5, 3, 10, 100 and 100 000)
were run for 4.0 · 107 steps, with a burn-in period of
6.0 · 106 steps. Three runs were completed from differ-
ent random starting seeds, and adequate Markov chain
mixing was verified by effective sample size (ESS) val-
ues for all parameters exceeding 300. To incorporate
uncertainty into estimates of Ne and Nem, substitution
rates were calculated based on values + ⁄ ) an order of
magnitude around the estimate of 7.0 · 10)9 substitu-
tions per site ⁄ year (noncoding nuclear DNA; Wolfe
et al. 1987; Hewitt 2000). This estimate was converted
to substitutions ⁄ site ⁄ generation assuming a generation
time of 5 years based on field experiments in Corallorh-
iza (Correll 1950; Rasmussen 1995).
Bayesian species delimitation
A multilocus, coalescent species delimitation analysis
was conducted using the program BPP 2.0 (Rannala &
Yang 2003; Yang & Rannala 2010). This method adopts
the biological species concept (BSC) (see Yang & Rann-
ala 2010), using a species phylogeny represented by a
user-specified guide tree, and accommodates lineage
sorting because of ancestral polymorphism. The guide
tree chosen was the plastid DNA topology of Barrett &
Freudenstein (2009). To assess the effect of alternate
guide tree topologies (i.e. species tree uncertainty),
branches within C. striata s.s. were rearranged in addi-
tional runs. Ten individuals each of var. striata, var. vre-
elandii and Californian accessions were analysed (one
randomly selected individual from each of ten ran-
domly selected localities for each); likewise, three indi-
viduals each were selected for C. bentleyi and C. striata
involuta. A gamma prior (G) was used to specify the
population size parameter Q and root age s0 of the spe-
cies tree. Three population size ⁄ species tree age combi-
nations were modelled (e.g. see Leache & Fujita 2010):
large Ne + deep divergence time [G(1,10) for h and s0],
large Ne + shallow divergence time [G(1,10) for h and
G(2,2000) for s0] and small Ne + shallow divergence
time [G(2,2000) for h and s0]. Other divergence time
parameters were assigned a Dirichlet prior (Yang &
Rannala 2010: equation 2). Each analysis of 500 000
MCMC generations was run twice from different start-
ing seeds with a burn-in period of 50 000; this gave
consistent parameter estimates between replicate runs
and ESS values >1000 for all parameters.
Floral morphometrics
Fourteen continuous floral characters were scored
(Appendix S3F, Supporting information). A total of 134
individuals were measured, including 36 individuals of
� 2011 Blackwell Publishing Ltd

INTEGRATIVE ORCH ID SPECIES D ELIM ITATI ON 2775
var. striata, 32 individuals of var. vreelandii, 35 Califor-
nian individuals, eight individuals of var. involuta and
23 individuals of Corallorhiza bentleyi. Data were analy-
sed using PAST 1.91 (Hammer et al. 2001) and SPSS 17
(SPSS Inc., Chicago, Illinois, USA) and tested for multi-
variate normality as in Barrett & Freudenstein (2009).
Measurements were log10-transformed, a variance ⁄covariance matrix was constructed, and principal com-
ponent analysis (PCA) was used to identify the clusters
of individuals in multivariate space. Canonical variates
analysis (CVA) and multivariate analysis of variance
(MANOVA) were used to test the statistical significance of
morphological distinctness based on a priori groupings,
respectively. To investigate labellum shape variation in
the C. striata complex, the labella of 118 individuals
were scanned at 2400 dpi. Labella were shown to be
particularly informative in a previous investigation
(Barrett & Freudenstein 2009), so eight labellum land-
marks (Appendix S3G, Supporting information) for 118
individuals were assigned using TPSDIG 2 (Rohlf 2004).
Landmarks were transformed to Procrustes coordinates
in PAST 1.91 (Hammer et al. 2001), subjected to thin-plate
spline analysis (TPS, Bookstein 1989), and partial warp
scores were used in ordination analyses (shape-PCA,
CVA).
Results
Plastid and nuclear DNA relationships
Topologies for combined plastid rbcL and rpl32-trnL
spacer (Fig. 1) under parsimony (Fig. 1) and likelihood
(Appendix S2, Supporting information) were topologi-
cally identical to Barrett & Freudenstein (2009) but
included more than twice the number of accessions.
Variety striata [jackknife support (JK) = 91, bootstrap
support (BS) = 90], var. vreelandii (JK = 85, BS = 88) and
the Californian accessions (JK = 100, BS = 100) each
comprised unique clades; the former were sister to one
another and collectively sister to the Californian clade
(JK = 99, BS = 100). Sister to (and highly distinct from)
this entire clade (JK = 100, BS = 100) was a clade com-
posed of C. bentleyi and C. striata var. involuta
(JK = 100, BS = 100). As in Barrett & Freudenstein
(2009), C. bentleyi and C. striata var. involuta were not
genetically distinct from one another. In fact, the only
variation observed in this clade was represented by a
single unique accession of C. striata var. involuta from
Oaxaca, Mexico (accession JVF 2155 OAX), sister to a
plastid haplotype of C. striata var. involuta (n = 7 acces-
sions) and C. bentleyi (n = 6 accessions).
Neither MAXCHI2 nor GENECONV tests detected significant
recombination signal within nuclear introns; the F-test
detected only marginally significant recombination for
� 2011 Blackwell Publishing Ltd
F3H (Appendix S3A, Supporting information). Hudson
& Kaplan’s (1985) test, however, identified a minimum
of two recombination events (RM) for RPB2, and three for
F3H, based on site-pair incompatibilities. Each intron
was split into nonrecombining regions based on break-
points from the Hudson & Kaplan (1985) test and con-
firmed to be free of recombination. RPB2 was split into
two regions, hereafter referred to as RPB2-5¢ and RPB2-3¢(231 and 122 nucleotides in length, respectively). The first
40 and last 4 base positions were removed from F3H,
leaving a nonrecombining region of 385 bp.
Both nuclear intron loci and ITS differentiated a clade
composed of C. bentleyi + C. striata involuta from C. stri-
ata s.s.; the former clade showed no genetic variation
for any of the three nuclear intron regions (Appendix
S4A–C, Supporting information). The C. bentleyi +
C. striata involuta clade shared no nuclear alleles with
C. striata s.s. ITS showed extremely limited variation
(Appendix S4D, Supporting information), but substantial
geographic structure. First, a C. bentleyi–involuta clade
and C. striata s.s. clade were each recovered (JK = 100
for each); as with the nuclear introns, no differentiation
was detected in the former. ITS resulted in a polytomy
for relationships within C. striata s.s. (Appendix S4D,
Supporting information), with var. striata and accessions
of var. vreelandii from Hidalgo, Mexico, each bearing
unique ITS types. The remaining var. vreelandii acces-
sions also comprised a unique ITS type, closely related to
another that contained all accessions from California.
Two accessions from the western Cascade Range in Ore-
gon (CFB 29a and b, Lane Co., OR, USA) each harboured
one allele matching var. striata and one matching Califor-
nian accessions. Allele-specific primers for ITS variants
clearly discriminated between ITS types, allowing char-
acterization of individuals from populations of each.
Within C. striata s.s. (Fig. 2a–c), nuclear intron
sequences did not demonstrate the exclusivity of alleles
among subgroups (i.e. plastid clade groupings). How-
ever, alleles for each locus had nonrandom distributions
among the three groupings (log-likelihood ratio G-test;
P < 0.0001 each). Individuals of varieties vreelandii and
striata cluster in distinct regions of the multilocus net-
work of Fig. 3, which here is more apparent than in
each single locus network (Fig 2a–c). However, var. vre-
elandii, var. striata and Californian accessions are not
completely exclusive. First, individuals from California
do not form a highly distinct cluster; they occupy inter-
mediate positions in the network and are generally
interspersed among individuals of both vars. vreelandii
and striata. Second, a few accessions of var. striata
(accessions 29a OR and 29b OR from Oregon, USA, and
125e WY from Wyoming, USA) grouped more closely
with individuals of var. vreelandii and Californian indi-
viduals.

Cremastra appendiculataAplectrum hyemale
Oreorchis patens2155 OAX
228a MOR228b MOR
G5 VA
237a MEX237b MEX237c MEX237d MEX237e MEX
B4 VA
B19 VA13a CA13b CA13c CA242b CA242c CA242d CA242e CA242f CA242g CA242h CA242i CA9c CA
246e CA246f CA246g CA9b CA248 CA5a CA5b CA9a CA253e CA253g CA253j CA253k CA253l CA253m CA253a CA253b CA253c CA253d CA253f CA253h CA253i CA
246a CA246b CA246d CA8 CA
103e NM103i NM112a AZ113a AZ113b AZ113c AZ113d AZ113e AZ113f AZLR5 NLRB3 NLRB4 NL
103f NM103g NM103h NM
2190 HID2193 HID229a HID229b HID
112c AZ110a AZ110b AZ110c AZ112b AZ
116b UT116d UT116e UT2773a UT2773b UT102 NM103d NM
103a NM103b NM103c NM100a NM100b NM100c NM100d NM106a NM106b NM106c NM114a UT114b UT114c UT114d UT116a UT116c UT116f UT163a CO163b CO
163c CO163d CO163e CO
198e MT
29a OR29b OR
219a BC219b BC219c BC39a WA39b WA
198a MT198b MT198c MT198i MT
193h MT
120b UT120c UT125a WY125c WY125d UT125e WY135a WY135b WY135c WY135d WY135e WY135f WY135g WY142 WY177a ID193a MT193b MT193c MT193d MT193e MT
193g MT
204d AB204e AB204f AB2769a MI48a WA48b WA
204c AB204h AB204i AB206b AB206c AB39c WADJ68 OR
120a UT120d UT
120e UT120f UT
193f MT
192a MT192b MT192c MT
198f MT198g MT223a BC223c BC223d BC223e BCHeshA MBHeshB MB
125b WY177b ID177c ID177d ID177e ID177f ID198d MT198h MT1a MI1b MI2769b MI2770a MI2770b MI2a MI2b MI3a MI3b MIJH1a MNJH1b MNJH1c MNJH1d MNJH1e MNJH2b WIJH2c WI
187a MT187b MT187c MT187d MT187e MT187f MT187g MT
1 nucleotide substitution
B6 VA
2550 WVG18 VA
Californian accessions
Corallorhiza striatavar. vreelandii
(Southwestern USA/Mexico)
Corallorhiza striatavar. striata
(Northern USA/Canada)
Corallorhiza striatavar. involuta(Mexico)
Corallorhiza bentleyi(Virginia/W.Virginia, USA)
100/100
100/100
100/100
99/100
85/88
91/90
84/95
83/76
92/95
94/99
80/85
86/92
100/100
Corallorhiza striatasensu stricto
- /70
- /77
- /77
Fig. 1 One of fourteen most parsimonious trees (Consistency Index (CI) = 0.93, Retention Index (RI) = 0.95) based on combined rbcL,
rpl32-trnL spacer and indel characters. Maximum parsimony (MP) jackknife (5000 pseudoreplicates) and ML bootstrap values (2000
pseudoreplicates) are adjacent to branches (MP ⁄ ML). Zigzags represent truncated branches. Black = C. striata vreelandii, grey = Cali-
fornian accessions, white = C. striata striata, striped = C. bentleyi and dotted = C. striata involuta.
2776 C. F . BARRETT and J . V . FREUDENSTEIN
� 2011 Blackwell Publishing Ltd

F3H
5′ RPB2
3′ RPB2
ITS
= 6 alleles(a)
(b)
(c)
(d)
Fig. 2 Statistical parsimony networks for C. striata sensu stricto
nuclear intron loci and internal transcribed spacer generated in
TCS (95% connection limit). Pie charts represent individual
alleles, their sizes proportional to their frequency in the sample.
(a) Flavanone 3-hydroxylase intron II (F3H), (b) 5’ region of
RNA Polymerase II Second Subunit intron 23 (5’ RPB2), (c) 3’
region of RPB2 intron 23, (d) Internal Transcribed Spacer (ITS).
The three colours represent plastid DNA group membership:
white = var. striata, black = var. vreelandii and grey = California.
0.1
Corallorhiza striata var. vreelandii (Southwestern USA, Mexico)Corallorhiza striata var. striata (northern USA, Canada) Corallorhiza striata (California)
INTEGRATIVE ORCH ID SPECIES D ELIM ITATI ON 2777
� 2011 Blackwell Publishing Ltd
Population structure of C. striata s.s.
Assignment tests for the nuclear-only data set indi-
cated that the number of genetic clusters (K) was
most likely 2 or 3 (Table 1), shown by DK values,
with relatively high values for both K = 2 and K = 3.
When plastid DNA was included, there was stronger
evidence for K = 3. Under both scenarios of K = 3
(Appendix S5, Supporting information), genetic
assignments matched the initial designation (i.e. var.
striata, var. vreelandii, and Californian accessions) for
151 of 155 individuals. The other four individuals
showed significant evidence of admixture between the
genetic clusters (i.e. <95% of an individual’s genotype
was from any single genetic cluster). Because the val-
ues of DK for K = 2 and K = 3 were so similar for
nuclear data, and the inclusion of plastid data
showed stronger evidence for K = 3, it is more likely
that there are three genetic clusters among the indi-
viduals sampled. Therefore, K = 3 was chosen for
hierarchical AMOVA.
AMOVA of combined plastid rbcL and rpl32-trnL
spacer (Table 2) partitioned 44.82% of the total genetic
variation between clades A–C (UCT = 0.45, P < 0.0001),
while 20.47% was explained among sampling localities
and 34.71% within them (respectively, USC = 0.37,
UST = 0.65, P < 0.0001 each). Pairwise UCT comparisons
were all significant (Appendix S3B, Supporting infor-
mation). Most of the significant nuclear variation in
C. striata s.s. was observed between a priori plastid
clade groupings (mean across loci = 45.17%, UCT = 0.45,
P < 0.0001) and within individuals (mean across loci =
42.93%, UIT = 0.57, P < 0.0001). Furthermore, all pair-
wise nuclear UCT comparisons were highly significant
Fig. 3 Pofad genetic distance network
of C. striata sensu stricto individuals
based combined nuclear intron alleles.
Tips of the network represent unique
multilocus genotypes.

Table 1 Summary of results from Bayesian genetic assignment tests implemented in STRUCTURE for nuclear data only
(RPB2 + F3H + ITS; above) and combined plastid and nuclear data (below)
K 1 2 3 4 5 6 7 8
Nuclear only
L[P(D)] )1379.1 )1022.9 )865.75 )815.6 )880.6 )797.2 )813.7 )805.0
S.D. 0.1 7.5 4.6 23.1 175.3 29.6 35.1 23.5
DK n ⁄ a 26.4 23.1 5.8 1.1 4.5 1.7 1.4
Plastid and nuclear
L(P[D]) )1789.9 )1344.7 )1119.5 )1088.2 )1060.7 )1085.8 )1176.3 )1117.9
S.D. 0.5 6.5 4.4 111.6 87.1 100.7 235.4 161.0
DK n ⁄ a 33.8 44.0 1.1 2.1 2.1 1.7 1.1
ITS, internal transcribed spacer. K = number of genetic clusters; L[P(D)] = log probability of the data for a given K; S.D. = standard
deviation of the log probability of the data; DK = second-order rate of change in the log probability of the data between different K
values.
2778 C. F . BARRETT and J . V . FREUDENSTEIN
among plastid groupings (P < 0.0001). No linkage dis-
equilibrium was detected among the three nuclear
intron loci (P < 0.0001). Significant deviations from
HWE were observed in a few instances (Appendix
S3C, Supporting information), most notably in var.
vreelandii for F3H and RPB2-5¢. Nuclear intron diver-
sity (h, p; Appendix S3D, Supporting information) was
highest in the Californian group, followed by var. stri-
ata and var. vreelandii; in contrast, the Californian
group displayed the lowest plastid DNA (ptDNA)
diversity, while var. striata had the highest. Nonsignifi-
cant Tajima’s D and Fu’s Fs suggested selective
neutrality for each locus.
Gene flow
Estimates of the effective number of migrants per gen-
eration (Nem) were all below one, suggesting little to no
gene flow between these three groupings (Appendices
S3E and 6, Supporting information). However, estimates
of both Ne and Nem have wide credibility intervals,
reflecting substantial uncertainty. The 95% posterior
densities of all M-parameter estimates include zero,
indicating that more loci will be needed to reduce
uncertainty around estimates of gene flow and effective
population sizes. For each grouping, estimates of Q and
M displayed unimodal posterior distributions (Appen-
dix S6, Supporting information). Despite wide credibil-
ity intervals, the shapes of these posterior distributions
(Appendix S6, Supporting information) provide
better indicators than the mean estimates. For
example, posterior distributions for MCalifornia fi vreelandii,
Mvreelandii fi California and Mstriata fi California all reach
their peaks at zero, while M striata fi vreelandii and
MCalifornia fi striata have nonzero peaks (the distribu-
tion for Mvreelandii fi striata near zero was relatively
ambiguous).
Morphology
Principal component analysis (Fig. 4a) of 134 individu-
als and 14 morphological characters yielded groupings
consistent with the findings of Barrett & Freudenstein
(2009). The distinctness of C. striata var. involuta,
C. bentleyi and C. striata s.s. persists in the light of
increased sample size relative to the aforementioned
study. Mardia’s test confirmed multivariate normality
(P > 0.1 for all comparisons). Canonical variates analy-
sis and PCA (Fig. 4b,a, respectively) recovered similar
overall structure; MANOVA demonstrated significant dif-
ferentiation of groupings (Wilk’s k = 0.0086, P < 0.0001),
with significant differences for each pairwise compari-
son (Hotelling’s T2, P < 0.01 each). Thus, both PCA and
CVA clearly illustrate morphological distinctness
among these groupings (these are merely mapped onto
PCA axes and play no part in calculations as they do in
CVA). PCA (Fig. 4a) suggests overlap for a few Califor-
nian individuals with both vars. striata and vreelandii,
but all three groupings had significantly different cent-
roids. PC1 and CV1 differentiate C. striata s.s. from the
C. bentleyi–involuta clade, as well as explain the vast
majority of the variation within C. striata s.s.; these lar-
gely represent overall correlated size variation. Column
length and perianth length + width characters (petals,
sepals and labellum) contribute most strongly to PC1
and CV1 (Appendix S3F, Supporting information). PC2
and CV2 differentiate C. bentleyi and C. striata var. in-
voluta, largely based on callus length and width
(Appendix S3F, Supporting information).
Shape-PCA and CVA of Procrustes-transformed label-
lum landmarks clearly differentiated C. bentleyi from all
other members of the C. striata complex (Fig. 4c,d).
Most notably, the position of the callus apex (landmarks
G and H; Fig. 5) extends below the widest point of the
labellum (landmark B; Fig. 5) in C. bentleyi relative to
� 2011 Blackwell Publishing Ltd
Principal component 1
–0.4
–0.3
–0.2
–0.1
0
0.1
0.2
0.3
Prin
cipa
l com
pone
nt 2
–0.64 –0.48 –0.32 –0.16 0 0.16 0.32 0.48
Canonical variate 1
–0.4
–0.3
–0.2
–0.1
0
0.1
0.2
0.3
Can
onic
al v
aria
te 2
Principal component 1
–0.12
–0.08
–0.04
0
0.04
0.08
0.12
Prin
cipa
l com
pone
nt 2
–0.15 –0.1 –0.05 0 0.05 0.1 0.15 0.2–0.04
–0.03
–0.02
–0.01
0
0.01
0.02
0.03
Can
onic
al v
aria
te 2
Canonical variate 1
Canonical variate 1
–6
–5
–4
–3
–2
–1
0
1
2
3
4
Can
onic
al v
aria
te 2
–0.8 –0.6 –0.4 –0.2 0 0.2 0.4 0.6
–0.2 –0.15 –0.1 –0.05 0 0.05 0.1 0.15 0.2 0.25
–4.8 –3.2 –1.6 0 1.6 3.2 4.8 6.4
(a) (b)
(d)(c)
(e)
C. bentleyiC. involutaC. striata striataC. striata CaliforniaC. striata vreelandii
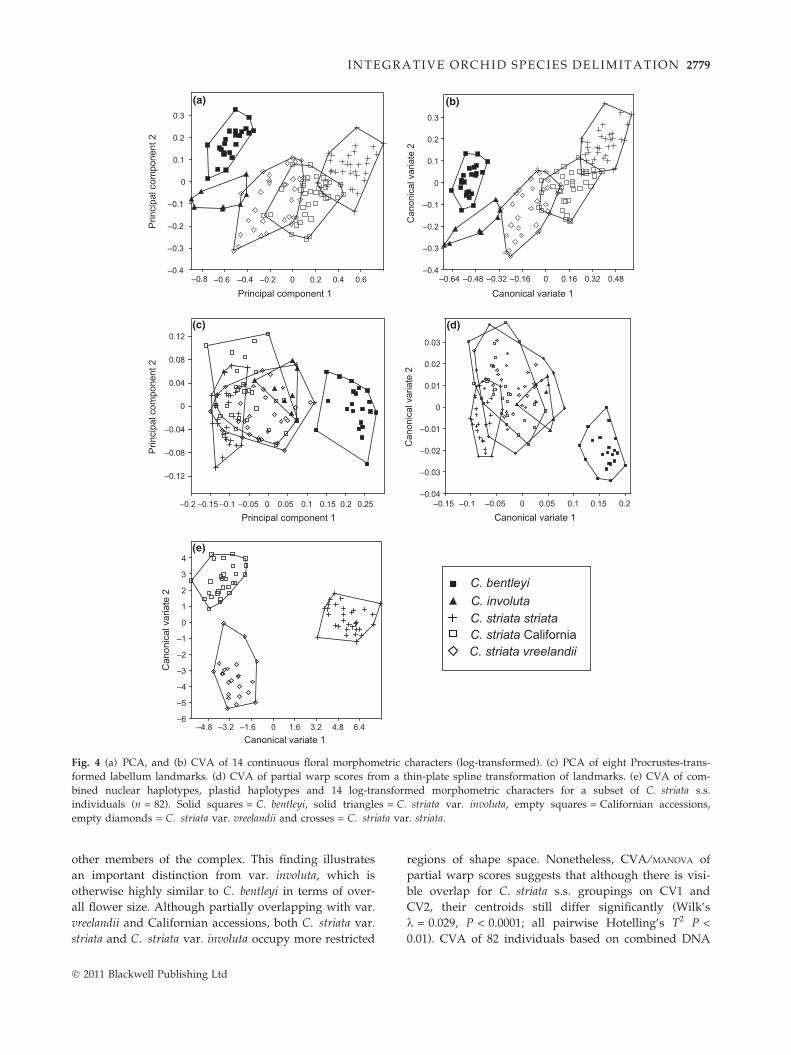
Fig. 4 (a) PCA, and (b) CVA of 14 continuous floral morphometric characters (log-transformed). (c) PCA of eight Procrustes-trans-
formed labellum landmarks. (d) CVA of partial warp scores from a thin-plate spline transformation of landmarks. (e) CVA of com-
bined nuclear haplotypes, plastid haplotypes and 14 log-transformed morphometric characters for a subset of C. striata s.s.
individuals (n = 82). Solid squares = C. bentleyi, solid triangles = C. striata var. involuta, empty squares = Californian accessions,
empty diamonds = C. striata var. vreelandii and crosses = C. striata var. striata.
INTEGRATIVE ORCH ID SPECIES D ELIM ITATI ON 2779
other members of the complex. This finding illustrates
an important distinction from var. involuta, which is
otherwise highly similar to C. bentleyi in terms of over-
all flower size. Although partially overlapping with var.
vreelandii and Californian accessions, both C. striata var.
striata and C. striata var. involuta occupy more restricted
� 2011 Blackwell Publishing Ltd
regions of shape space. Nonetheless, CVA ⁄ MANOVA of
partial warp scores suggests that although there is visi-
ble overlap for C. striata s.s. groupings on CV1 and
CV2, their centroids still differ significantly (Wilk’s
k = 0.029, P < 0.0001; all pairwise Hotelling’s T2 P <
0.01). CVA of 82 individuals based on combined DNA

–0.64 –0.48 –0.32 –0.16 0 0.16
–0.8
–0.64
–0.48
–0.32
–0.16
0
0.16
0.32 A
B
C
HG
F
E D A E
G
F
D
C
B
H
1 mm
var. striata C. bentleyivar. involuta Californiavar. vreelandii
C. bentleyi
C. involuta
C. striata striataC. striata CaliforniaC. striata vreelandii
Fig. 5 Procrustes-transformed landmark
plot of C. striata labellum data, parti-
tioned by plastid DNA grouping (top
left; crosses = var. striata, empty dia-
monds = var. vreelandii, empty squares
= Californian accessions, solid trian-
gles = C. striata involuta and solid
squares = C. bentleyi). On the top right
is a scanned labellum photograph (var.
striata accession 3b MI) showing the
positions of the landmarks (A) basal
labellum ridge, (B) labellum widest
point, (C) labellum apex, (D) callus
basal groove, (E) callus basal ridge, (F)
callus widest point, (G) callus apical
ridge and (H) callus apical groove).
Across the bottom are representative
scaled photographs of labella from each
of the groupings with arrows showing
callus apex. Black and grey ovals high-
light the callus apex (right) and widest
labellum point (left) for C. bentleyi and
C. striata involuta, respectively.
2780 C. F . BARRETT and J . V . FREUDENSTEIN
and morphological data (Fig. 4e) produced clusters that
corresponded well with each of the three a priori
groupings (Wilk’s k = 0.007, P < 0.0001).
Bayesian species delimitation in the C. striata complex
For all prior parameter combinations, the four-species
model (1110; Appendix S3H, Supporting information)
had posterior speciation probabilities >0.98; this model
specified var. striata, var. vreelandii and Californian
populations as separate species, with C. bent-
leyi + C. striata involuta as a single species. In compari-
son, the five-species model (1111; Appendix S3H,
Supporting information) displayed extremely low pos-
terior probabilities under all prior combinations (<0.02
in all cases; Appendix S3H, Supporting information).
However, further analyses under different guide tree
topologies (i.e. using all three possible topologies
within C. striata s.s. to reflect tree uncertainty among
these entities) gave similarly high posteriors for the
four-species model.
Discussion
Recent proposals regarding integrative species delimi-
tation have suggested a more or less algorithmic set of
steps for delimiting species using multiple sources of
data (e.g. Padial et al. 2010; Schlick-Steiner et al. 2010).
One of the many challenges in implementing algorith-
mic approaches is how to incorporate and reconcile
operational criteria, especially when they differ (but
see Padial & de la Riva 2010). Further, a recent discus-
sion in integrative taxonomy is whether congruence
among data types is required or whether ‘cumulation’
can be invoked, whereby any data type is sufficient for
delimiting species when considered in combination
with other types of data. In the extreme cases, the
former has been criticized for being too conservative
� 2011 Blackwell Publishing Ltd

INTEGRATIVE ORCH ID SPECIES D ELIM ITATI ON 2781
(i.e. identifying only old species) and thus underesti-
mating species diversity, while the latter has been criti-
cized for the opposite reason (Padial et al. 2010). We
view concordance among data types as sufficient but
not necessary for justifying species delimitation (see de
Queiroz 2007). We interpret ‘cumulative’ integration of
multiple data types as being more in agreement with
our goal of identifying the units suitable for phylo-
genetic analysis.
Phylogenetic species concepts (PSC) aim to identify
the smallest units suitable for phylogenetic analysis (El-
dredge & Cracraft 1980; Nelson & Platnick 1981; Cra-
craft 1983, 1989). Of the various incarnations of the
PSC, we generally favour the ‘diagnosable’ version of
Nixon & Wheeler (1990) because of its explicit criteria
for recognizing species, aiming to identify ‘‘...the small-
est aggregation of populations (sexual) or lineages
(asexual) diagnosable by a unique combination of char-
acter states in comparable individuals...’’ We also
favour Doyle’s (1995) method for identifying units of
phylogenetic analysis, by identifying ‘fields for recombi-
nation (FFR)’, whereby alleles at nuclear loci are shared
by heterozygous individuals suggesting inclusion in the
same allele pools. More specifically, it is the reverse of
this situation—lack of heterozygotes sharing sets of alle-
les—that suggests the presence of separate species for
phylogenetic analysis. Both of these approaches may
serve as operational criteria under a theoretical frame-
work of species as general lineages (reviewed in de
Queiroz 2007).
Evidence for species delimitation is summarized in
Fig. 6. The question naturally arises in integrative spe-
cies delimitation of what, if any, weights should apply
C. striata s.s.
C. involuta C. bentleyMorphologyGeography
ptDNA
Geography*MorphologynrDNA
Phenology
ptDNA
GeographyMorphologynrDNA
Phenology
striata
vreelandii
California
C. involuta
C. bentleyi
striata
vreelandii
California
C. involuta
C. bentleyi
striata
vreelandii
California
C. involuta
C. bentleyi
striata
vreelandii
California
C. involuta
C. bentleyi
ptDNA nrDNA Morphology Geography
striata
vreelandii
California
C. involuta
C. bentleyi
BPP(a)
(b)
BPPBPP
� 2011 Blackwell Publishing Ltd
to certain data types. Here, we emphasize nuclear DNA
and morphological data, with plastid DNA playing a
secondary role. It is well documented that uniparentally
inherited organellar DNA often displays substantially
greater structure than nuclear DNA, morphology, eco-
logical niche, etc., by virtue of geography (see Avise
2000). Furthermore, the fourfold difference in Ne
between nuclear and organellar DNA (in sexually
reproducing diploids) means that organellar DNA will
reach fixation of different combinations of variants or
reciprocal monophyly among populations faster than
nuclear DNA (Avise 2000; Hare 2001; Palumbi et al.
2001; Zink & Barrowclough 2008). For these reasons, we
are reluctant to place too much emphasis on organellar
DNA as the sole means of delimiting species.
Based on nonoverlapping patterns of floral size varia-
tion, C. striata s.s. and C. bentleyi + C. striata involuta
are distinct (Fig. 4a,b). A closer investigation of label-
lum morphology reveals that the primary difference
between C. bentleyi and C. striata involuta is in labellum
shape, specifically the relative positions of the callus
apex and the widest point of the labellum (Figs 4C,D
and 5). To the extent of our sampling, this represents a
fixed, diagnosable character state difference and identi-
fies C. bentleyi and the remaining C. striata as phyloge-
netic species. Freudenstein (1999) originally noted this
difference upon describing the recently discovered
C. bentleyi, but those observations were based on few
individuals from a single population in West Virginia,
USA. Here, we have demonstrated consistent label-
lum ⁄ callus differences among multiple populations of
C. bentleyi and C. striata involuta. Greenman (1898)
described C. involuta, which was later downgraded to a
i
striata
vreelandii
California
C. involuta
C. bentleyi
Phenology Fig. 6 (a). Schematic representation of
evidence for species delimitation in the
C. striata complex. Solid lines indicate
complete exclusivity (or allopatry in the
case of geography); dashed lines indi-
cate incomplete exclusivity but substan-
tial differences (or parapatry); no line
indicates no evidence for differentiation.
(b). Summary of evidence supporting
delimitation of three species in the
C. striata complex. *Corallorhiza striata
involuta and C. striata vreelandii are nar-
rowly parapatric in Mexico; no popula-
tions were found to harbour both.

2782 C. F . BARRETT and J . V . FREUDENSTEIN
variety within C. striata by Freudenstein (1997).
Although C. striata involuta does not display fixed floral
shape differences from C. striata s.s., nonoverlapping
floral size differentiates it from the latter (Fig. 4a,b).
A pertinent question that arises when considering
DNA sequence data under a phylogenetic species con-
cept is ‘‘what in fact constitutes a diagnosable charac-
ter?’’ Fig. 1 illustrates four main plastid clades; if
membership in one of these clades was to be considered
a useful character in identifying phylogenetic species,
then under one rather liberal interpretation, the C. stri-
ata complex would contain four species presently
described as C. bentleyi + C. striata involuta (both as a
single species), var. striata, var. vreelandii and Califor-
nian populations. However, for the reasons stated ear-
lier, we do not interpret this to be the case, specifically
with respect to each of the three clades of C. striata s.s.
representing separate species. However, C. striata invo-
luta is clearly not a variety of C. striata, in that it is vir-
tually genetically identical to C. bentleyi. Rather,
C. bentleyi and C. striata involuta together are highly
divergent from C. striata s.s., representing the basal-
most divergence in the C. striata complex (Fig. 1).
For all nuclear loci examined, C. bentleyi + C. striata
involuta were identical and furthermore distinct from
members of a highly variable C. striata s.s. (Appendix
S4, Supporting information). This finding corroborates
the pattern from ptDNA (Fig. 1) at the deepest level
within the C. striata complex, further bolstering support
for C. striata involuta as separate from C. striata s.s.
Applying a phylogenetic species concept in a multilocus
sense is not as straightforward as with organellar DNA,
although methods do exist (e.g. Davis & Nixon 1992;
Brower 1999). Obviously, C. bentleyi + C. striata involuta
are not in the same FFR (sensu Doyle 1995) as C. striata
s.s., because these two groups share no alleles. How-
ever, vars. vreelandii, striata and Californian accessions
share nuclear F3H and RPB2 alleles in the form of het-
Table 2 Analysis of molecular variance for C. striata s.s. nuclear int
voluta
Locus b ⁄ w clades b ⁄ w loc w ⁄ in loc w ⁄
F3H 49.54 13.70 2.45 34.3
RPB2-5¢ 49.27 11.02 5.50 34.2
RPB2-3¢ 36.66 5.72 )2.71 60.3
Mean (nuclear) 45.17 10.21 1.68 42.9
Plastid DNA 44.82 20.47 34.71 n ⁄ a
The values of the first four columns are percent variation explained b
A–C (see Fig. 1). The last five columns are values of fixation index an
significance: *P < 0.05, **P < 0.0001. ‘b ⁄ w loc’ = between sampling loc
sampling localities; ‘w ⁄ in ind’ = within individuals. U-statistics: ‘UIS’
sampling localities, ‘USC’ = among sampling localities within clades, ‘
populations
erozygotes (Fig. 2); this is even the case for two indi-
viduals from a population in Oregon being
heterozygous for ITS variants unique to Californian and
more northern var. striata populations. Thus, a pattern
conducive to separate allele pools (sensu Doyle 1995),
identifying units suitable for phylogenetic analysis, was
not observed within C. striata s.s.
POFAD (Fig. 3), STRUCTURE (Table 1; Appendix S5, Sup-
porting information), AMOVA (Table 2) and MIGRATE
(Appendices S3E and 6, Supporting information) analy-
ses, however, do suggest significant patterns of genetic
differentiation between the three entities of C. striata
s.s. Taken together with the pattern of morphological
and ptDNA variation, these entities closely fit Moritz’s
(1994) definition of ESUs: ‘‘ESUs should be reciprocally
monophyletic for mtDNA (in animals) and show signifi-
cant divergence of allele frequencies at nuclear loci.’’
We consider ESUs to be distinct, relevant units for con-
servation within a species. Thus, although these three
entities do not qualify as separate species occupying
exclusive FFR, their infraspecific nomenclature (each at
the level of variety) should reflect this distinctness and
align closely with their status as ESUs.
The lack of genetic variation between C. bentleyi and
C. striata involuta was surprising but is not necessarily
evidence of a single species (i.e. negative evidence, see
de Queiroz 2007). This pattern could either be attrib-
uted to the particular loci selected (i.e. assuming there
are other, more variable loci that will differentiate them)
or to the existence of truly genetically indistinguishable,
geographically disjunct sets of populations. It is not
presently possible to differentiate among these scenar-
ios; additional high variation loci will be needed to
address this issue in more detail.
Bayesian species delimitation using BPP sensu Yang &
Rannala (2010), in part, stems from their interpretation
of the BSC, incorporating incomplete lineage sorting:
‘‘Here, we adopt the BSC, recognizing groups that have
ron and plastid loci, excluding C. bentleyi and C. striata var. in-
in ind UIS UST USC UCT UIT
1 0.07 n ⁄ a 0.27** 0.50** 0.66**
1 0.14* n ⁄ a 0.22** 0.49** 0.66**
3 )0.05 n ⁄ a 0.09** 0.37** 0.40**
3 0.04 n ⁄ a 0.19** 0.45** 0.57**
n ⁄ a 0.65** 0.37** 0.45** n ⁄ a
y each hierarchical level; ‘among clades’ refers to plastid clades
alogues (U), taking into account sequence similarity, and their
alities; ‘b ⁄ w clades’ = between clades; ‘w ⁄ in loc’ = within
= among individuals within sampling localities, ‘UST’ = among
UCT’ = among clades and ‘UIT’ = among individuals among
� 2011 Blackwell Publishing Ltd

INTEGRATIVE ORCH ID SPECIES D ELIM ITATI ON 2783
experienced no recent gene flow as potential species
(although not requiring other evidence of reproductive
isolation).’’ BPP identified four species, corresponding to
var. vreelandii, var. striata, Californian accessions and
C. bentleyi + C. striata involuta (as a single species). That
the latter were considered a single species was not a
surprise, given the lack of variation between them for
the loci sampled. The four species delimitated by BPP
correlate exactly with the major ptDNA clades from
Fig. 1. The fact that changing the guide tree topology
(i.e. relationships between entities within C. striata s.s.)
essentially had no effect on the delimitation results of
the BPP analyses (see Leache & Fujita 2010 for a discus-
sion of high posterior probabilities despite misspecified
guide trees) suggests the need for more informative loci
and definitive knowledge of the species tree in future
analyses.
Interpretations under different operational criteria (to
the extent of the data and analyses in this study)
appear to delimit species differently for the C. striata
complex. Specifically, delimitation of the three entities
within C. striata s.s. as separate species by BPP but not
by the FFR method represents a direct conflict—the
opposite is the situation for C. bentleyi and C. striata
involuta under each, respectively. This situation is not
uncommon and can be accommodated under the theo-
retical framework of the general population lineage
concept, which posits that various operational criteria
may delimit species differently because they become
relevant at different times in lineage divergence
(reviewed in de Queiroz 2007). Presently, we favour
the delimitation of three species (C. bentleyi, C. involuta
and C. striata s.s.) under diagnosable PSC and FFR
operational criteria owing to the ability to utilize both
morphological and genetic evidence in a cumulative-
integrative manner. The fact that C. bentleyi and
C. striata involuta do vary morphologically suggests
that there may yet be nuclear DNA loci that differenti-
ate them, but this remains to be explored.
Other considerations for species delimitation in the
C. striata complex concern geography, phenology and
reproductive mode. Corallorhiza bentleyi is a narrow
endemic (eastern USA), disjunct from all other members
of the complex; the latter largely occupy more northern
and western montane and sub-boreal ⁄ subalpine regions
(Canada, USA, Mexico; see Freudenstein 1997; Barrett &
Freudenstein 2009). Corallorhiza striata involuta, despite
a virtually identical genetic relationship (to our knowl-
edge) to C. bentleyi, occurs in montane regions of
Mexico. Corallorhiza striata vreelandii has a limited distri-
bution in Mexico but is only narrowly parapatric with
C. striata involuta there (and no populations of the two
contained individuals from both). Thus, the ancestor of
C. striata involuta and C. bentleyi likely had a wider
� 2011 Blackwell Publishing Ltd
distribution throughout eastern North America, thus
presently representing a very recent disjunction (see Bar-
rett & Freudenstein 2009). Very little genetic differentia-
tion would be expected for these two sets of populations.
Corallorhiza striata s.s. typically flowers from April-
June, while C. bentleyi and C. striata involuta flower
from July-August (Freudenstein 1997), representing
temporal, phenological separation (Barrett & Freuden-
stein 2009). This pattern is corroborated by deep genetic
divergence and morphological size differences. Further-
more, C. bentleyi and C. striata involuta appear to be lar-
gely dependent on self-pollination, based on our
morphological and ecological observations in the field,
including seed set for all flowers in a raceme, even
before flowers are fully opened; no recorded observa-
tions of pollinators for either; small, drab-coloured,
half-open flowers; some populations of C. bentleyi that
are completely cleistogamous (i.e. closed-flowered), thus
potentially precluding outcrossing. In contrast, ichne-
umonid wasp pollinators have been observed for all
members of C. striata s.s. in the field (Freudenstein
1997; personal observation). Furthermore, predominant
selfing in C. bentleyi + C. striata involuta likely purged
genetic diversity via rapid genetic drift relative to the
predominantly outcrossing C. striata s.s.
Based on extensive geographic sampling of ptDNA,
nrDNA and morphology, we draw evidence from mul-
tiple data sources that the C. striata complex is com-
posed of three species, including (i) a morphologically
and genetically variable, widespread C. striata s.s., (ii)
C. bentleyi, endemic to Virginia and West Virginia,
USA, and (iii) C. involuta, endemic to the mountains of
Mexico. The widespread C. striata s.s. is distinct from
both C. bentleyi and C. striata involuta based on ptDNA,
nrDNA and morphology. Although virtually identical
based on the genetic markers chosen in this study,
C. bentleyi and C. involuta display diagnosable label-
lum-callus shape differences in addition to being geo-
graphically isolated by thousands of kilometres.
Within C. striata s.s., we identified three ESUs
(sensu Moritz 1994), which are best recognized at the
level of variety, based on (i) significant floral size dif-
ferences, (ii) ptDNA exclusivity, (iii) nrDNA diver-
gence, (iv) parapatry and (v) little evidence of gene
flow. Sharing of nuclear alleles, specifically in the form
of heterozygotes (i.e. common allele pools), argues
against their recognition at the species level. Bayesian
species delimitation (operationally adopting an inter-
pretation of the BSC) identified four species: three
within C. striata s.s. and a fourth composed of C. bent-
leyi + C. striata involuta. However, more informative
data will be needed (including definitive knowledge of
the species tree) to more confidently apply these
methods. Regardless, each of the entities identified in

2784 C. F . BARRETT and J . V . FREUDENSTEIN
this study should be treated as units for the purposes
of conservation of the orchids themselves and the hab-
itats in which they occur.
Acknowledgements
The authors thank S. Bentley, M. Burzynski, L. Heshka, J.
Horky, K. Inoue, J. Maunder and G. Salazar for assistance col-
lecting plant material. For sequencing assistance, we thank J.
Dıaz, and for feedback, we thank K. Abdul-Salim, B. Carstens,
J. Davis, H. Gibbs, A. Leache, D. Taylor, J. Wenzel, A. Wolfe
and three anonymous reviewers. We thank the USDA Forest
Service, California State Parks, Virginia Department of Agricul-
ture, ParksCanada and the Canadian Forest Service for permis-
sion to collect. Funding was provided by the American Orchid
Society, American Society of Plant Taxonomists, OSU Herbar-
ium, OSU Office of International Affairs and National Science
Foundation Grant DEB-0415920.
References
Akaike H (1974) A new look at the statistical model
identification. IEEE Transactions of Automatic Control, 19, 716–
723.
Avise J (2000) Phylogeography: the History and Formation of
Species, Harvard University Press, Cambridge, Massa-
chusetts, USA.
Barrett CF, Freudenstein JV (2008) Molecular evolution of rbcL
in the mycoheterotrophic Coralroot Orchids (Corallorhiza
Gagnebin, Orchidaceae). Molecular Phylogenetics and
Evolution, 47, 665–679.
Barrett CF, Freudenstein JV (2009) Patterns of morphological
and plastid DNA variation in the Corallorhiza striata species
complex (Orchidaceae, Epidendroideae). Systematic Botany,
34, 496–504.
Baum DA, Shaw KL (1995) Genealogical perspectives on the
species problem. In: Molecular and Experimental Approaches
to Plant Biosystematics (eds Hoch PC, Stephenson A), pp.
289–303. Missouri Botanical Garden, St. Louis, Missouri,
USA.
Beerli P, Felsenstein J (1999) Maximum likelihood estimation of
migration rates and effective population numbers in two
populations. Genetics, 152, 763–773.
Beerli P, Felsenstein J (2001) Maximum likelihood estimation of
a migration matrix and effective population sizes in n
subpopulations using a coalescent approach. Proceedings of
the National Academy of Sciences, USA, 98, 4563–4568.
Bookstein F (1989) Principal warps: thin-plate splines and the
decomposition of deformations. IEEE Trans. Pattern Analysis
and Machine Intelligence, 11, 567–585.
Brower AVZ (1999) Delimitation of phylogenetic species with
DNA sequences: a critique of Davis and Nixon’s population
aggregation analysis. Systematic Biology, 48, 199–213.
Clement M, Posada D, Crandall KA (2000) TCS: a computer
program to estimate gene genealogies. Molecular Ecology, 9,
1657–1659.
Correll DS (1950) Native orchids of North America north of
Mexico, Chronica Botanica, Waltham, Massacheusetts, USA.
Cracraft J (1983) Species concepts and speciation analysis.
Current Ornithology, 1, 159–187.
Cracraft J (1989) Speciation and its ontology: the empirical
consequences of alternative species concepts for under-
standing patterns and processes of differentiation. In:
Speciation and its Consequences (eds Otte D, Endler JA), pp.
28–59. Sinauer Associates, Sunderland, Massachusetts, USA.
Davis JI, Nixon KC (1992) Populations, genetic variation, and
the delimitation of phylogenetic species. Systematic Biology,
41, 421–435.
Dayrat B (2005) Toward integrative taxonomy. Biological Journal
of the Linnean Society, 85, 407–415.
Denton AL, McConaughy BL, Hall BD (1998) Usefulness of RNA
polymerase II coding sequences for estimation of green plant
phylogeny. Molecular Biology and Evolution, 15, 1082–1085.
Doyle JJ (1995) The irrelevance of allele tree topologies for
species delimitation, and a non-topological alternative.
Systematic Botany, 20, 574–588.
Doyle JJ, Doyle JL (1987) A rapid DNA isolation procedure for
small quantities of fresh leaf tissue. Phytochemical Bulletin, 19,
11–15.
Dressler R (1981) The Orchids: Natural History and Classification.
Harvard University Press, Cambridge, Massachusetts, USA.
Dressler R (1993) Phylogeny and Classification of the Orchid
Family. Cambridge University Press, Cambridge, UK.
Edgar RC (2004) MUSCLE: multiple sequence alignment with
high accuracy and high throughput. Nucleic Acids Research,
32, 1792–1797.
Eldredge N, Cracraft J (1980) Phylogenetic Patterns and the
Evolutionary Process. Columbia University Press, New York,
New York, USA.
Emshwiller E, Doyle JJ (1999) Chloroplast-expressed glutamine
synthetase (ncpGS): potential utility for phylogenetic studies
with an example from Oxalis (Oxalidaceae). Molecular
Phylogenetics and Evolution, 12, 310–319.
Evanno G, Regnaut S, Goudet J (2005) Detecting the number of
clusters of individuals using the software Structure: a
simulation study. Molecular Ecology, 14, 2611–2620.
Excoffier L, Smouse PE, Quattro JM (1992) Analysis of
molecular variance inferred from metric distances among
DNA haplotypes: application to human mitochondrial DNA
restriction data. Genetics, 131, 479–491.
Excoffier L, Laval G, Schneider S (2005) Arlequin ver. 3.0: an
integrated software package for population genetics data
analysis. Evolutionary Bioinformatics Online, 1, 47–50.
Freudenstein JV (1997) A monograph of Corallorhiza (Orchid-
aceae). Harvard Papers in Botany, 10, 5–51.
Freudenstein JV (1999) A new species of Corallorhiza (Orchid-
aceae) from West Virginia, USA. Novon, 9, 511–513.
Freudenstein JV, Senyo DM (2008) Relationships and evolution
of matK in a group of leafless orchids (Corallorhiza and
Corallorhizinae; Orchidaceae: Epidendroideae). American
Journal of Botany, 95, 498–505.
Fu Y-X (1997) Statistical tests of neutrality of mutations against
population growth, hitchhiking and background selection.
Genetics, 147, 915–925.
Goloboff PA, Farris JS, Nixon KC (2008) TNT: a free program
for phylogenetic analysis. Cladistics, 24, 774–786.
Greenman JM (1898) Diagnoses of new and critical Mexican
phanerogams (Corallorhiza involuta). Proceedings of the
American Academy of Arts, 33, 474.
Groeneveld LF, Weisrock DW, Rasoloarison R, Yoder AD,
Kappeler PM (2010) Species delimitation in lemurs: multiple
� 2011 Blackwell Publishing Ltd

INTEGRATIVE ORCH ID SPECIES D ELIM ITATI ON 2785
genetic loci reveal low levels of species diversity in the
genus Cheirogaleus. BMC Evolutionary Biology, 9, 30.
Hammer Ø, Harper D, Ryan P (2001) PAST: paleontological
statistics software package for education and data analysis.
Palaeontologia Electronica, 4, 1.
Hare MP (2001) Prospects for nuclear gene phylogeography.
Trends in Ecology and Evolution, 16, 700–706.
Heath L, van der Walt E, Varsani A, Martin DP (2006)
Recombination patterns in aphthoviruses mirror those
found in other picornaviruses. Journal of Virology, 80, 11827–
11832.
Hewitt GM (2000) The genetic legacy of the Quaternary ice
ages. Nature, 405, 907–913.
Howarth DG, Baum DA (2002) Phylogenetic utility of a nuclear
intron from nitrate reductase for the study of closely related
plant species. Molecular Phylogenetics and Evolution, 23, 525–
528.
Hudson RR, Kaplan NL (1985) Statistical properties of the
number of recombination events in the history of a sample
of DNA sequences. Genetics, 111, 147–164.
Huson DH (1998) SplitsTree: analyzing and visualizing
evolutionary data. Bioinformatics, 14, 68–73.
Huson DH, Bryant D (2006) Application of phylogenetic
networks in evolutionary studies. Molecular Biology and
Evolution, 23, 254–267.
Joly S, Bruneau A (2006) Incorporating allelic variation for
reconstructing the evolutionary history of organisms from
multiple genes: an example from Rosa in North America.
Systematic Biology, 55, 623–636.
Knowles LL, Carstens BC (2007) Delimiting species without
monophyletic gene trees. Systematic Biology, 56, 887–895.
Leache AD, Fujita MK (2010) Bayesian species delimitation in
West African forest geckos (Hemidactylus fasciatus).
Proceedings of the Royal Society Series B, 277, 3071–3077.
Leache AD, Koo MS, Spencer CL, Papenfuss TJ, Fisher RN,
McGuire JA (2009) Quantifying ecological, morphological,
and genetic variation to delimit species in the coast horned
lizard species complex (Phrynosoma). Proceedings of the
National Academy of Sciences, USA, 106, 12418–12423.
Love A, Love D (1981) Chromosome number reports LXXIII.
Taxon, 30, 829–861.
Love A, Simon W (1968) Cytotaxonomical notes on some
American orchids. Southwestern Naturalist, 13, 335–342.
Maynard Smith J (1992) Analyzing the mosaic structure of
genes. Journal of Molecular Evolution, 34, 126–129.
Moritz C (1994) Defining ‘‘Evolutionarily Significant Units’’ for
conservation. Trends in Ecology and Evolution, 9, 373–375.
Nei M, Li W-H (1979) Mathematical model for studying
genetic variation in terms of restriction endonucleases.
Proceedings of the National Academy of Sciences, USA, 76, 5269–
5273.
Nelson GJ, Platnick NI (1981) Systematics and Biogeography:
Cladistics and Vicariance, Columbia University Press, New
York, New York, USA.
Nixon KC, Wheeler QD (1990) An amplification of the
phylogenetic species concept. Cladistics, 6, 211–223.
Padial JM, de la Riva I (2010) A response to recent proposals
for integrative taxonomy. Biological Journal of the Linnean
Society, 101, 747–756.
Padial JM, Miralles A, de la Riva I, Vences M (2010) The
integrative future of taxonomy. Frontiers in Zoology, 7, 16.
� 2011 Blackwell Publishing Ltd
Padidam M, Sawyer S, Fauquet CM (1999) Possible emergence
of new geminiviruses by frequent recombination. Virology,
265, 218–225.
Palumbi SR, Cipriano F, Hare MP (2001) Predicting nuclear
gene coalescence from mitochondrial data: the three-times
rule. Evolution, 55, 859–868.
Posada D, Crandall K (1998) Modeltest: testing the model of
DNA substitution. Bioinformatics, 14, 817–818.
Pritchard JK, Stephens M, Donnelly P (2000) Inference of
population structure using multilocus genotype data.
Genetics, 155, 945–959.
de Queiroz K (2007) Species concepts and species delimitation.
Systematic Biology, 56, 879–886.
Rannala B, Yang Z (2003) Bayes estimation of species
divergence times and ancestral population sizes using DNA
sequences from multiple loci. Genetics, 164, 1645–1656.
Rasmussen H (1995) Terrestrial Orchids: From Seed to Mycotrophic
Plant. Cambridge University Press, Cambridge, UK.
Rice WR (1989) Analyzing tables of statistical tests. Evolution,
43, 223–225.
Roe AD, Sperling FAH (2007) Population structure and species
boundary delimitation of cryptic Dioryctria moths: an
integrative approach. Molecular Ecology, 16, 3617–3633.
Rohlf FJ (2004) TPSDIG2. Stony Brook. Department of Ecology
and Evolution, State University of New York at Stony Brook,
New York.
Roncal J, Zona S, Lewis CE (2008) Molecular phylogenetic
studies of Caribbean palms (Arecaceae) and their
relationships to biogeography and conservation. Botanical
Review, 74, 78–102.
Rozas J, Sanchez-DelBarrio JC, Messeguer X, Rozas R (2003)
DnaSP, DNA polymorphism analyses by the coalescent and
other methods. Bioinformatics, 19, 2496–2497.
Schlick-Steiner BI, Steiner F, Seifert B, Stauffer C, Christian E,
Crozier RH (2010) Integrative taxonomy: a multi-source
approach to exploring biodiversity. Annual Review of
Entomology, 55, 421–438.
Shaw J, Lickey E, Schilling E, Small R (2007) Comparison of
whole chloroplast genome sequences to choose noncoding
regions for phylogenetic studies in angiosperms: the tortoise
and the hare III. American Journal of Botany, 94, 275–288.
Sites JW, Marshall JC (2004) Operational criteria for delimiting
species. Annual Review of Ecology, Evolution, and Systematics,
35, 199–227.
Specht CD (2006) Systematics and evolution of the Tropical
Monocot Family Costaceae (Zingiberales): a multiple dataset
approach. Systematic Botany, 31, 89–106.
Stamatakis A (2006a) Phylogenetic models of rate
heterogeneity: a high performance computing perspective.
Proceedings of the International Parallel and Distributed
Processing Symposium 2006, Rhodos, Greece.
Stamatakis A (2006b) RAxML-VI-HPC: maximum likelihood-
based phylogenetic analyses with thousands of taxa and
mixed models. Bioinformatics, 22, 2688–2690.
Stephens M, Donnelly P (2003) A comparison of Bayesian
methods for haplotype reconstruction from population
genotype data. The American Journal of Human Genetics, 73,
1162–1169.
Stephens M, Smith NJ, Donnelly P (2001) A new statistical
method for haplotype reconstruction from population data.
American Journal of Human Genetics, 68, 978–989.

2786 C. F . BARRETT and J . V . FREUDENSTEIN
Strand AE, Leebens-Mack J, Milligan MG (2000) Nuclear DNA-
based markers for plant evolutionary biology. Molecular
Ecology, 6, 113–118.
Swofford D (2003) PAUP*: Phylogenetic Analysis Using Parsimony
(*and other Methods), Sinauer, Sunderland, MA, USA.
Tajima F (1983) Evolutionary relationship of DNA sequences in
finite populations. Genetics, 105, 437–460.
Tajima F (1989) The effect of change in population size on
DNA polymorphism. Genetics, 123, 597–601.
Taylor DL, Bruns TD, Hodges SA (2004) Evidence for
mycorrhizal races in a cheating orchid. Proceedings of the
Royal Society Series B, 271, 35–43.
Weisrock DW, Rasoloarison RM, Fiorentino I et al. (2010)
Delimiting species without nuclear monophyly in
Madagascar’s Mouse Lemurs. PLoS ONE, 5, e9883.
White TJ, Bruns TD, Lee S, Taylor JW (1990) Amplification and
direct sequencing of fungal ribosomal RNA genes for
phylogenetics. In: PCR Protocols: A Guide to Methods and
Applications (eds Innis MA, Gelfand DH, Sninsky JJ, White
TJ), pp. 315–322. Academic Press, New York, New York.
Wiens JJ (2007) Species delimitation: new approaches for
discovering diversity. Systematic Biology, 56, 875–878.
Wiens JJ, Penkrot TL (2002) Delimiting species based on DNA
and morphological variation and discordant species limits in
spiny lizards (Sceloporus). Systematic Biology, 51, 69–91.
Will KW, Mishler BD, Wheeler QD (2005) The perils of DNA
barcoding and the need for integrative taxonomy. Systematic
Biology, 54, 844–851.
Wolfe KH, Li W-H, Sharp PM (1987) Rates of nucleotide
substitution vary greatly among plant mitochondrial,
chloroplast, and nuclear DNAs. Proceedings of the National
Academy of Sciences, USA, 84, 9054–9058.
Yang Z, Rannala B (2010) Bayesian species delimitation using
multilocus sequence data. Proceedings of the National Academy
of Sciences, USA, 107, 9264–9269.
Zink RM, Barrowclough GF (2008) Mitochondrial DNA under
siege in avian phylogeography. Molecular Ecology, 17, 2107–
2121.
C.B. is a postdoctoral researcher interested in monocot phylog-
enetics, phylogeography, taxonomy, molecular evolution, and
co-evolution. J.F. is an associate professor of plant systematics
interested in morphological and molecular evolution of mono-
cots and various other angiosperm lineages (particularly Or-
chidaceae and Ericaceae), as well as in phylogenetic
methodology and systematic theory.
Data accessibility
GenBank accession numbers: F3H (JF310748–JF311057,
JF319835–JF319848); RPB2 (JF311058–JF311367, JF319849–
JF319862); ITS (EU391335, JF319664–JF319707); rpl32-trnL spacer
(FJ445602–FJ445678, GU223977-GU234037, JF319771–JF319834);
and rbcL (FJ445519–FJ445595, GU223916-GU223976, JF319708–
JF319770). Plastid DNA, nuclear DNA and morphological data
matrices: DRYAD entry doi:10.5061/dryad.8582.
Supporting information
Additional supporting information may be found in the online
version of this article.
Appendix S1 Locality and sampling information for molecular
and morphological data in the C. striata complex.
Appendix S2 Maximum Likelihood gene tree for combined
rbcL and rpl32-trnL spacer from RAxML under the
GTRGAMMA model.
Appendix S3 Recombination, AMOVA, heterozygosity, molecular
diversity, gene flow, ordination, landmark, and Bayesian
Species Delimitation information.
Appendix S4 MP phylograms of the C. striata complex based
on nuclear data.
Appendix S5 Population structure of Corallorhiza striata s.s.
Appendix S6 Posterior densities of migration estimates from
Bayesian analysis in MIGRATE for C. striata s.s.
Please note: Wiley-Blackwell are not responsible for the content
or functionality of any supporting information supplied by the
authors. Any queries (other than missing material) should be
directed to the corresponding author for the article.
� 2011 Blackwell Publishing Ltd