an integrative analysis reveals coordinated reprogramming of the ... · an integrative analysis...
TRANSCRIPT
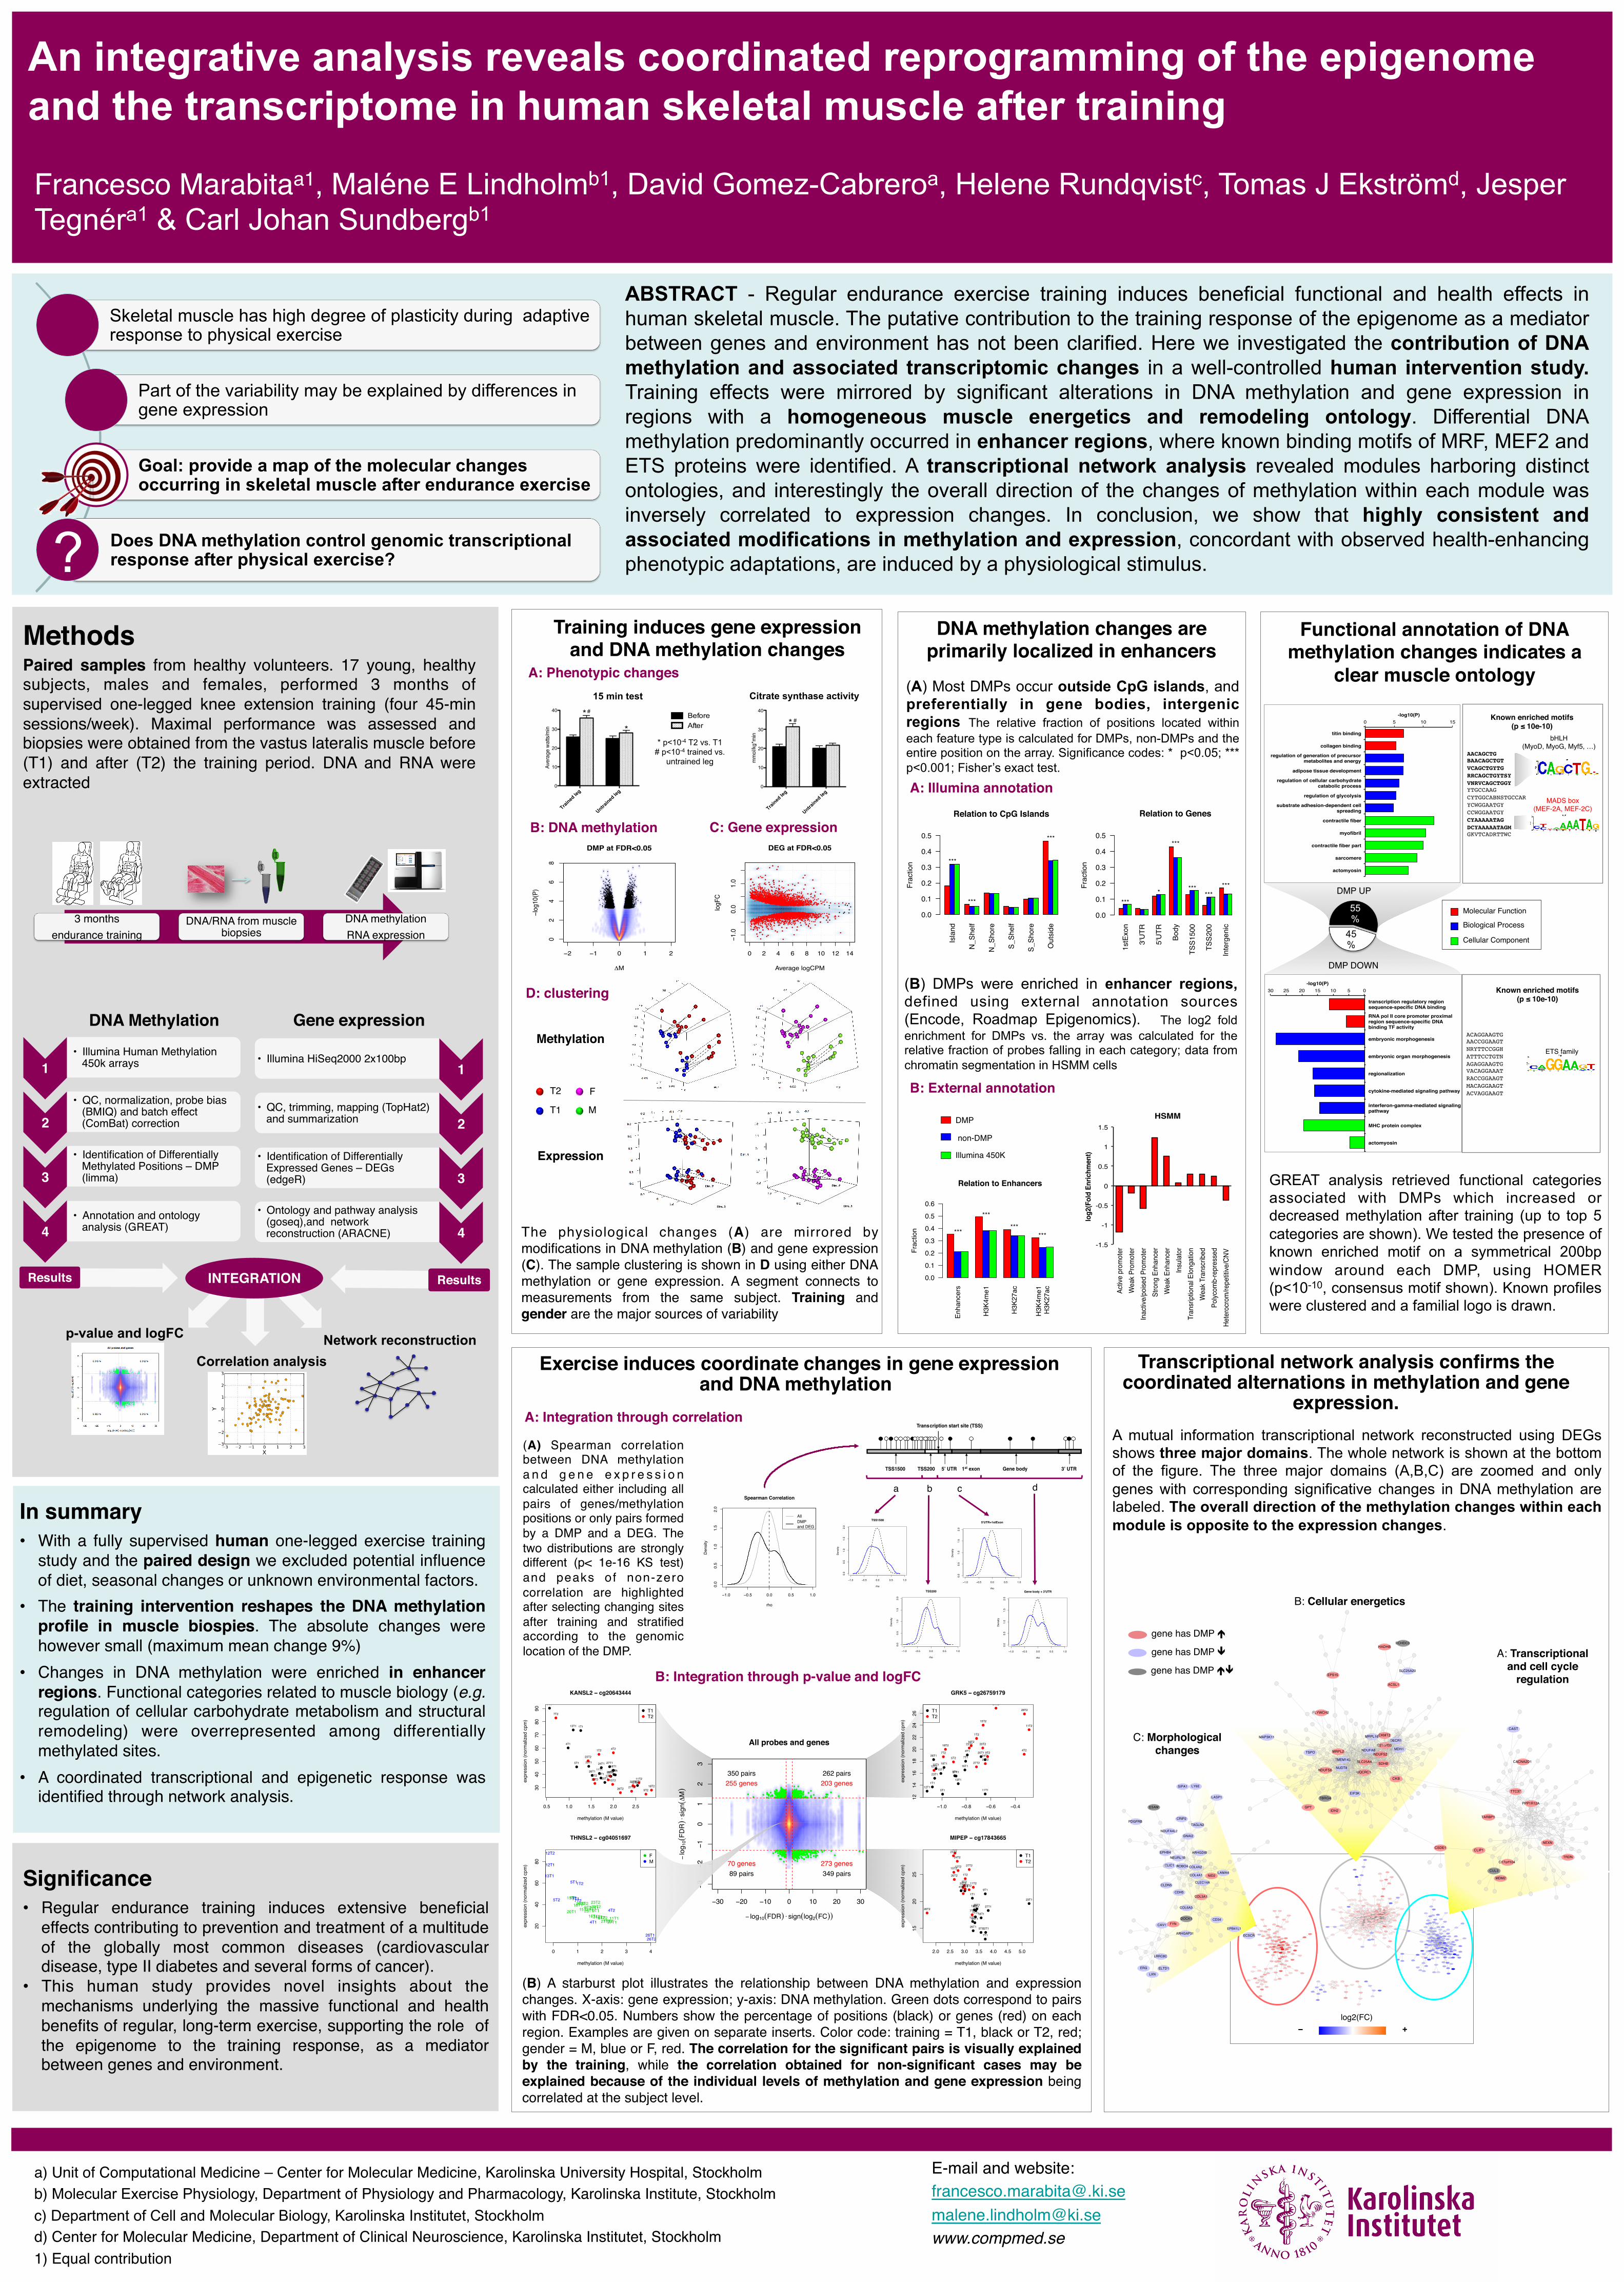
An integrative analysis reveals coordinated reprogramming of the epigenome and the transcriptome in human skeletal muscle after training
Francesco Marabitaa1, Maléne E Lindholmb1, David Gomez-Cabreroa, Helene Rundqvistc, Tomas J Ekströmd, Jesper Tegnéra1 & Carl Johan Sundbergb1
ABSTRACT - Regular endurance exercise training induces beneficial functional and health effects in human skeletal muscle. The putative contribution to the training response of the epigenome as a mediator between genes and environment has not been clarified. Here we investigated the contribution of DNA methylation and associated transcriptomic changes in a well-controlled human intervention study. Training effects were mirrored by significant alterations in DNA methylation and gene expression in regions with a homogeneous muscle energetics and remodeling ontology. Differential DNA methylation predominantly occurred in enhancer regions, where known binding motifs of MRF, MEF2 and ETS proteins were identified. A transcriptional network analysis revealed modules harboring distinct ontologies, and interestingly the overall direction of the changes of methylation within each module was inversely correlated to expression changes. In conclusion, we show that highly consistent and associated modifications in methylation and expression, concordant with observed health-enhancing phenotypic adaptations, are induced by a physiological stimulus.
a) Unit of Computational Medicine – Center for Molecular Medicine, Karolinska University Hospital, Stockholm!b) Molecular Exercise Physiology, Department of Physiology and Pharmacology, Karolinska Institute, Stockholm!c) Department of Cell and Molecular Biology, Karolinska Institutet, Stockholm!d) Center for Molecular Medicine, Department of Clinical Neuroscience, Karolinska Institutet, Stockholm!1) Equal contribution !
Methods!Paired samples from healthy volunteers. 17 young, healthy subjects, males and females, performed 3 months of supervised one-legged knee extension training (four 45-min sessions/week). Maximal performance was assessed and biopsies were obtained from the vastus lateralis muscle before (T1) and after (T2) the training period. DNA and RNA were extracted !
Training induces gene expression and DNA methylation changes!
E-mail and website:[email protected][email protected]!www.compmed.se!
Skeletal muscle has high degree of plasticity during adaptive response to physical exercise
Part of the variability may be explained by differences in gene expression
Goal: provide a map of the molecular changes occurring in skeletal muscle after endurance exercise
Does DNA methylation control genomic transcriptional response after physical exercise? ?
In summary!• With a fully supervised human one-legged exercise training
study and the paired design we excluded potential influence of diet, seasonal changes or unknown environmental factors. !
• The training intervention reshapes the DNA methylation profile in muscle biospies. The absolute changes were however small (maximum mean change 9%)!
• Changes in DNA methylation were enriched in enhancer regions. Functional categories related to muscle biology (e.g. regulation of cellular carbohydrate metabolism and structural remodeling) were overrepresented among differentially methylated sites.!
• A coordinated transcriptional and epigenetic response was identified through network analysis.!
Exercise induces coordinate changes in gene expression and DNA methylation !
GREAT analysis retrieved functional categories associated with DMPs which increased or decreased methylation after training (up to top 5 categories are shown). We tested the presence of known enriched motif on a symmetrical 200bp window around each DMP, using HOMER (p<10-10, consensus motif shown). Known profiles were clustered and a familial logo is drawn. !
(B) A starburst plot illustrates the relationship between DNA methylation and expression changes. X-axis: gene expression; y-axis: DNA methylation. Green dots correspond to pairs with FDR<0.05. Numbers show the percentage of positions (black) or genes (red) on each region. Examples are given on separate inserts. Color code: training = T1, black or T2, red; gender = M, blue or F, red. The correlation for the significant pairs is visually explained by the training, while the correlation obtained for non-significant cases may be explained because of the individual levels of methylation and gene expression being correlated at the subject level.!
A mutual information transcriptional network reconstructed using DEGs shows three major domains. The whole network is shown at the bottom of the figure. The three major domains (A,B,C) are zoomed and only genes with corresponding significative changes in DNA methylation are labeled. The overall direction of the methylation changes within each module is opposite to the expression changes.!
(A) Most DMPs occur outside CpG islands, and preferentially in gene bodies, intergenic regions The relative fraction of positions located within each feature type is calculated for DMPs, non-DMPs and the entire position on the array. Significance codes: * p<0.05; *** p<0.001; Fisher’s exact test. !
p-value and logFC
Correlation analysis Network reconstruction
1!• Illumina Human Methylation
450k arrays!
2!• QC, normalization, probe bias
(BMIQ) and batch effect (ComBat) correction!
3!• Identification of Differentially
Methylated Positions – DMP (limma)!
4!• Annotation and ontology
analysis (GREAT) !
DNA Methylation! Gene expression!
INTEGRATION!Results! Results!
1!• Illumina HiSeq2000 2x100bp!
2!• QC, trimming, mapping (TopHat2)
and summarization!
3!• Identification of Differentially
Expressed Genes – DEGs (edgeR)!
4!• Ontology and pathway analysis
(goseq),and network reconstruction (ARACNE)!
Trained
leg
Untrained
leg
0
10
20
30
40
mmol/kg*min
BeforeAfter
* #
Trained
leg
Untrained
leg
0
10
20
30
40
Aver
age
wat
ts/m
in BeforeAfter
* #
*
A: Phenotypic changes
Methylation!
Expression!
Trained
leg
Untrained
leg
0
10
20
30
40
Aver
age
wat
ts/m
in BeforeAfter
* #
*
0 2 4 6 8 10 12 14
−1.0
0.0
1.0
DEG at FDR<0.05
Average logCPM
logF
C
●
●
●
●
●
●
●
●
●
●
●
●
●
●
●
●
●●
●
●
●
●
●
●
●
●
●
●
●
●
●
●
●
●
●
●
●
●
●
●
●
●
●
●
●
●
●
●
●
●
●
●
●
●
●
●
●
●
●
●
●
●
●
●
●
●
●
●
●
●
●
●
●
●
●
●
●
●
●
●
●
●●
●
●
●
●
●
●
●
●●
●
●
●
●
●
●
●
●
●
● ●
●
●
●
●
●
●
●
●
●
●
●
●
●
●
●
●
●
●
●●
●
●
●
●
●
●
●
●
●
●
●
●
●
●
●
●
●
●
●
●
●
●
●
●
●
●
●
●
●●
●●
●
●
●
●●
●
●
●
●
●
●●
●
●
●
●
●
●
●●
●
●
●
●
●
●
●
●
●
●
●
●
●
●
●
●
●
●●
●
●●
●
●
●
●
●
●
●
●●
●
●
● ●
●
●
●
●
●
●
●
●
●
● ●
●●
●
●
●
●
●
●
●
●●
●
●
●
●
●
●
●
●
●
●
●
●
●
●
●
●
●
●
●
●
●
● ●
●●
●
●
●
●
●
●
● ●
●
●
●●
●
●
●
●
●
●
●●
●
●
●
●
●
●
●
●
●
●
●
●
●
●
●
●
●
●
●
●
●
●
●
●
●
●
●
●
●
●
●
●
●
●
●
●
●
●
●
●●
●
●
●
●
●
●
●
●
●
●
●
●
● ●●
●
●
●
●
●
●
●
●
●
●
●
●
● ●
●
●
●
●
●
●
●
●
●
●
●
●
●
●
●
●
●
●
●
●
●
●
●
●
●
●
●
●●
●
●
●
●
●
●
●
●
●
● ●
●
●
●
●●●
●
●
●●
●●
●
●
●
●
●
●
●
●
●
●
●
●
●
● ●
●
●
●
●
●
●
●
●
●
●
●
●
●
●
●
●
●
●
●
●
●
●
●
●
●
●
●
●
●
●
●
●
●
●●
●
●
●●
●
●
●
●●
●
●
●
●●
●
●
●
●
●
●
●
●
●
●
●
●
●
●
●
●
● ●
●
●
●
●
●
●
●
●
●
●
●
●
●
●
●
●
●
●
●
●
●
●
●
●
●
●
●
●
●
●
●
●
●
●
●
●
●
●
●
●
●
●
●
●
●
● ●
●
●
●
●
●●
●
●
●
●
●●
●
●
●
●●
●
●
●
●●
●
●
● ●
●
●
●●
●
●
●
●
●
●
●
●
●
●
●
●
●
●
●
●
●
●
●
●
●
●
●
●
●
●
●
●
●
●
●
●
●
●
●
●●
●●
●
●
●
●
●
●
●
●
●
●
●
●●
●
●
●
●●●
●
●
●
●
●
●
●
●
●
●
●
●
●
●
● ●
●
●
●
●
●
●
●
●
●●
●
●
●
●
●
●
●
●
●
●●
●
●
●
●
●
●
●
●
●
●
●
●
●
●
●
●●
●
●
●●
●●
●
●
●●
●
●
●
●
●●
●
●
●
●● ●
●
●
●
●
●
●
●
●
●
●●
●
●
●
●
●
●
●●
●
●
●
●
●
●
●
●
●
●
●
●
●
●
●
●
●
●
●
●
●
●
●
●
●
●
●
●
●
●
●
●
●
●
●
●
●
●
●
●●
●
●
●
●
●
●
●
●
●
●
●●
●
●
●
●
●
●
●
●
●
●
●
●
●
●
●
●
●
●
●
●
●
●
●
●
●
●
●
●
●
●
●
●
●
●●
●
●
●
●
●
●
●
●
●
●
●●●
●
●
●
●
●
●●
●
●
●
●
●●
●
●
●
●
●
●●
●
●●
●
●
●
●
●
●
●
●
●
●
●
●
●
●
●
●
●
●
●
●
●
●●
●
●
●
●
●
● ●
●
●
●
●
●
●
●
●
●
●
●
●
●
●
●
●
●
●
●
●●
●
●
●
●
●
●
●
●
●
●
●
●
●
●● ●
●
●●
●
●
●
●
●
●
●
●
●
● ●
●
●
●
●
●
●
●
●
●
●
●
●
●
●
●
●●
●
●
●
●
●
●
●●
●
●
●
●
●●
●
●●
●
●
●
●
●
●
●
●
●
●
●
●
●
●
●
●
●
●
●●●
●
●
●
●
●
● ●
●
●
●
●
●
●
●
●
●
●
●
●
●
●
●
●
●
●
●
●
●
●
●●
●
●
●
●
●
●●
●●
●
●
●
●
●
●
●
●
●
●
●
●
●
●
●
●●
●
●
●
●
●
●
●
●
●
●
●
●
●
●
●
●
●
●
●
●
●
●
●
●
●
●
●●
●
●
●
●
●
●
●
●
●●
●
●
●
●
●
●
●
●
●
●
●
●
●
●
●
●
●
●
●
●
●●
●
●
●
●
●●
●
●●
●
●
●
●
●
●●
●
●
●
●
●●
●
●
●
●
●
●
●
●
●
●
●
●
●
●
●
●
●
●
●
●
●
●
●
●
●
●
●
●
●
●
●
●
●
●
●
●
●
●●
●
●
●
●
●
●
●●
●
●
●
●
●
●
●
●
●
●
●
●●
●
●
●
●
●
●
●
●
●
●
●
●●
●
●
●
●●
●
●●
●
●
●
●
●
●
●
●
●
●
●
●●
●
●
●
●
●
●
● ●
●
●
●
●
●
●
●●
●
●●
●
●
●
●
●
●
●
●
●
●
●
●
●
●
●
●
●
●
●
●
●
●
●
●
●
●
●
●
●
●
●
●
●
●
●
●
●
●●
●
●
●
●
●
●
●
●
●
●
●
●
●●
●●
●
●
●
●
●
●
●●
●
●
●
●
●
●
●
●
●
●
●●
●
●
●
●
●
●
●
●
●
●
●
●
●
●
●
●
●
●●
●●
●
●
●
●
●●
●
●
●
●
●
●
●●
●
●
●
●
●
●
●
●
●
●
●
●
●
●
●
●
●
●
● ●
●
●
●
●
●
●
●
●
●●
●
●
●
●
●
●
●
● ●
●
●
●
●
●
●
●
●
●
●
●
●
●
●
●
●
●
●
●
●
●
●
●
●
●●
● ●
●
● ●
●
●
●
●
●
●
●●
●
●
●
●
●●
●
●
●
●
●
●
●
●
●
●
●●
●
●
●●
●
●
●
●
●●
●
●
●
●
●
●
●
●
●
●
●
●
●
●
●
●
●
●
●●
●
●
●
●
●
●
●
●
●
●
●
●●
●
●●
●
●
●
●
●
●
●
●
●
●
●
●
●
●
●
●
●
●
●
●
●
●
●
●
●
●
●●
●
●
●
●●
●
●
●
●
●
●
●
●
●
●
●
●
●
●
●
●
●
●
●
●
●
●
●
●●
●
●
●
●
●
●●
●
●
●
●
●
●
●
●
●
●
●
●
● ●
●
●
●
●
●●
●
●
●
●
●
●●
●
●
●
●
●
●
●
●
●
●●
●
● ●
●●
●
●
●
●
●
● ●
●
●
●
●
● ●
●
●●
●
●
●
●
●
●
●
●
●
●
●●
●
●
●
●
●
●
●
●●
●
●
●
●
●
●
●
●
●
●
●
●
●●
●
●
●
●
●
●
●●
●
●
●
●
●
●
●
●
●
● ●
●
●
●
●
●
●
●
●
● ●
●
●
●
●
●
●
●
●
●
●
●
●●
●●
●
●
●
●
●
●
●
●
●
●
●
●
●
●
●
●
●
●
●
●
●●
●
●
●
●
●
●
●
●
●
●
●
●
●
●
●
●
●●
●
●
●
● ●
●
●
●
●
●
●
●
●
●
●
●
●
●
●
●
●
●●
●
●
●
●
●
●● ●
●
●
●
●●
●
●
●
●
●
●
●
●
●
●
●
●
●
●
●
●
●
●
●
●
●
●
●●
●
●
●
●
●
●
●●
●●
●
●
●
●
●
●
●
●
●
●
●
●
●
●
●
●
●●●
●
●
●
●
●
●
●
●
●
●
●●
●●
●
●
●
●
●
●
●
●
●
●
●
●
●
●
●
●
●
●
●
●
●
● ●
●
●
●
●●
●
●
●
●
●
●●●
●
● ●
●
●
●
●
●
●
●
●
●
●
●
●●
●
●
●
●
●
●
●
●
●
●
●
●
●
●
●
●
●
● ●
● ●
●
●
●
●
●
●
●
●
●
●●
●
●
●
●
●
●
●
●
●
●
●●
●
●
●
●
●
●
●
●
●
●
●
●●●
●
●
●
●
●
●
●
●
●
●
●
●
● ●
●
●●●
●
●
●
●
●
●
●
●
●
●
●
●
●
●
●●
●
●
●
●
●
●
●●
●
●
●
●
●
● ●
●
●
●
●
●
●●
●
●
●●
●●
●
●
●
●
●
●
●
●
●
●
●
●●
●
●
●
●
●
●
● ●
●
●
●
●
●
●
●
●
●●
●
●
●
●
●●
●
●
●
●
●
●
●●
●
● ●●
●
●
●●
●
●
●
●
●
●
●●
●
●
●
●
●
●
●
●
●
●
●
●●
●
●
●
●
●
●
●
●
●
●
●●
●
●
●
●
●
●
●
●
●
●
●
●
●
●
●
●
●●
●
●
●
●
●
●
●
●
●
●
●
●
●
●
●
●
●
●
●
●
●
●
●
●●
●
●
●
●
●
●
●
●
●●
●
●
●
●
●
●
●●
●●
●
●
●
●
●●
●
●
●●
●
●
●
●
●
●●
●
●
●
●
●
●●
●
●
●
●
●
●
●
●
●
●
●
●
●
●
●
●
● ●
●
●
●
●
●
●
●
●
●
●●
●
●
●
●
●
●
●
●
●
●
●●
●
●
●
●
●
●
●●
●
●
●
●
●
●
●
●
●
●
●
●
●
●
●
●
●
●
●
●
●●
●
●
●
●
●
●
●
●●
●
●
●
●
●
●
●
●
●
●
●
●
●
●
●
●
●
●
●
●
●
●
●
●
●
●●
●●
●
●●
●
●
● ●
●
●
●
●
●
●
●
●
●
●
●
●
●
●
●
●●
●
●●
●
●
●
●
●
●
●
●
●
●
●
●
●
●
●
●
●
●
●
●
● ●
●
●
●
●
●
●
●
●
●
●
●
●
●
●
●
●
●
●
●
●
●
●
●
●
●
●●●
●
●●
●
●
●
●
●
●
●
●
●
●
●
●
●
●
●
●
●
●
● ●
●
●
●
●
●
●
●
●
●
●
●
●
●
●
●
●
●
●
●
●
●
●
●
●
●
●
●
●
●
●●
●
●
●
●
●
●
●
●
●
●
●
●
●
●
●
●
●
●
●●
●
● ●●
●
●
●
●
●
●
●
●
●
●●
●
●
●
●
●
●
●
●
●
●
●
●
●
●
●
●
●
●
●
●
●
●●
●
●
●●
●
●
●
●
●
●
●
●
●
●
●
●
●
●
●
●
●
●
●
●
●
●
●
●
●
●
●
●
●
●
●
●
●
●
●
●
●
● ●
●
●
●
●
●
●
●
●
●
●
●
●
●
●
●
●
●
●
●
●
●
●●
●
●
●
●
●
●
●
●
●●
●
● ●
●
●
●
●
●
●
●
●
●
●
●
●
●
●●
●
●
●
●
●
●
●
●
●
●
●
●
●
●
●
●
●
●
●
●
●
●●
●
●
●
●
●
●
●
●
●
●
●
●
●
●
●
●
●
●●
●
●
●
●
●
●
●
●
●
●
●
●
●
●●
●
●
●
●
●
●
●
●
●
●
●
●
●
●
●
●
●
●
●
●
●
●
● ●
●
●
●●
●
●
●
●
●
●
●
●
●●
●
●
●
●
●
●
●
●
●
● ●
●
●
●
●
●●●
●
●
●
●
●
●
●●
●
●
●
●
●
●
●
●
●
●
●
●
●
●
●
●
●
●
●
●
●
●
●●
●
●
●
●
●
●
●
●
●
●
●●
●
●
●●
●
●
●
●
●
●
●
●
●
●
●
●
●
●
●
●
●
●
●
●
●
●
●
●
●●
●
●●
●
●
●
●
●
●
●
●
●
●
●
●
●●
●
●●
●
●
●
●
●
●
●
●
●
●
●
●
●
●
●
●
●
●
●
●●
●
●
●
●
●
●
●
●
●
●
●
●
●
●
●
●
●
●
●
●
●
●
●
●
●
●
●
●
●
●
●
●
●
●
●
●
●
●
●
●
●
●
●
● ●
●
●
●●
●
●
●
●●
●
●
●
●
●
●
●
●
●
●
●
●
●●
●
●
●
●
●
●
●
●
●
●
●
●
●
●
●
●
●
●
●
●
●
●
●
●●
●
●
●
●
●
●
●
●
●
●
●
●
●●
●
●
●
●
●
●
●
●
●
●
●
●
●
●
●
●
●
●
●
●
●
●
●
●
●
●
●
●
●
●
●●
●
●●
●
●
●
●
●
●
●
●
●
● ●●
●●
● ●
●
●
●
●
●
●
●
●●
●
●
●●
●
●
●
●
●
●
●
●
●
●
●
●
●
●
●
●
●●
●
●
●
● ●
●
●
●
●
●
●
●
●
●
●
●
●
●
●
●●
●
●●●
●
● ●●
●
●
●
●
●
●
●
●
●
●
●●
●
●
●
●
●
●
●
●
●
●
●
●
●
●●
●
●
●
●
●
●
●
●
●
●
●●
●
●
●
●
●●
●
●
●
●
●
●
●
●
●●
●
● ●
●
●●
●
●
●
●
●
●
●
●
●
●
●
●
● ●
●●
●
●
●
●
●
●
●
●
●
●
●
●
●
●
●
●
●
●
●
●
●
●
●
●
●●
●
●
●
●
●●
●
●
●
●
●
●●
●
●
●
●●
●
●
●
●
●
●
●
●
●
●
●
●
●
●●
●
●
●
●
●
●
●●
●
●
●
●
●
●
●
●
●
●
●
●
●
●
●
●
●
●
●
●
●
●
●
●
●
●
●
●
●
●
●
●
●
●
●
●
●
●
●
●
●
●
●
●
●●
●
●
●
●
●
●●
●
●
●
●
●
●
●
●
●
●
●
●
●
●
●
●
●
●
●
●
●
●
●
●
●
●
●
●
●
●●
●
●
●
●
●
●
●
●
●
●
●
●
●
●
●
●
●
●
●
●
●
●
●
●
●
●
●
●
●
●
●
●
●
●
●
●
● ●
●
●
●
●
●
●
●
●
●
●
●●
●
●
●
● ●
●
●
●
●
●
●
●
●
●
●
●
●
●
●
●
●
●
●
●
●
●
●
●
●
●
●
● ●
●
●
●
●
●
●
●
●
●●
●
●
●
●●
●
● ●●
●
●
●
●
●
●
●
●
●
●
●●
●
●●
●●
●
●
●●
●●
●
●
●
●
●
●
●
●
●
●
●
●
●
●
●
●
●
●
●
●
●
●
●
●●
●
●
●
●
●
●
●
●
●
●
●
●
●●
●
●●
●
●
●
●●
●
●
●
●●
●
●
●
●
●
●
●
●
●
●
●
●
●
●
●●
●
●
●
●
●
●
●
●
●
●●
●
●
●
●
●
●
●
●
●
●
●
●
●
●
●
●
●
●
●
●
●
●
●●
●
●
●
●
●
●
● ●
●
●
●
●●
●
●
●
●
●
●
●
●
●
●
●
●
●
●
●
●
●
●
●
●●
●
●
●
●●
●●
●
●
●
●
●
●
●
●
●
●
●
●
●
●
●
●
●
●
●
●
●
●
●
●
●
●
●
●
●●
●
●
●
●
●
●
●
●
●
●
●
●
●
●
●
●●
●
●
●
●●
●
●
●
●
●
●
●
●
●
●
●
●
●
●
●
●
●
●
●
●●
●
●
●
●
●
●
●
●
●
●
●
●
●●
●●
●
●
●
●
●
●
●
●
●
●
●
●
●
●
●
●●
●
●●
●
●
●
●
●
●
●
●
●
●
●
●
●
●
●
●
●
●
●
●●
●
●
●●
● ●
●
●
●
●
●
●
●
●
●
●
●
●
●
●
●
●
●
●
●
●●
●
●
●
●
●
●
●
●
●
●
●
●
●
●
●
●
●
●
●
●
●
●
●
●
●
●
●
●
●●
●
●
●
●●
●
●
●
●
●●
●
●
●
●●●
●
●
●
●
●
●
●
●
●
●
●
●●
●
●
●●
●
●
●
●
●●
●
●
●
●
●
●
●
●
●
●
●
●
●
●
●
●
●●
●
●
●
●
●
●
●
●
●
●
●
●
●
●
●
●
●
●
●
●
●
●
●
●
●
●●
●●
●
●
●
●
●
●
●
●
●
● ●
●
●
●●
●
●
●
●
●
●
●
●
●
● ●●
●
●
●
●
●
●
●
●
●
●
●
●
●
●
●
●
●
●
●
●
●
●
●
●
●●
●
●
●●
●
●
●
●
●
●●
●
●
●
●
●
●
●
●
●
●
●
●
●
●●
●
●
●
●
●
●
●
●
●
●
●
●
●
●
●
●
●
●
●
●
●●
●
●
●
●
●
●
●
●
●
●
●
●
●
●
●
●●
●
●
●
●
●
●
●
●
●
●
●
● ●
●
●
● ●
●
●
●
●
●
●
●
●
●
●
●●
●
●
●
●●
●
●
●
●
●
●
●
●
●
●
●
● ●
●
●
●
●
●
●
●
●●
●
●
●
●●
●
●
●
●
●
●
●
●
●
● ●
●
●
●
●
●
●
●
●
●
●
●
●
●
●
●
●
●
●
●
●
●
●
●
●
●
●
●
●
●
●
●
●
●
●
●
●
●
●
●
● ●
●
●
●
●
●
●
●
●
●
●
●
●
●
●
●
●
●
●
●
●
●
●●
●
●
●
●
●
●
●
●
●
●
●
●
●
●
●
●
●
●
●●
●
●
●●
●
●
●
●
●
●
●●
●
●
●
●
●
●
●
●
●
●
●
●
●
● ●
●
●
●
●
●
●
●
●
●
●●
●
●
●
●
● ●
●
●
●
●
●
●
●
●
●
●
●
●
●
●
●
●
●
●
●
●
●
●
●
●
●
●
●
●
●
●
●
●
●
●
●
●
●
●
●
●
●●
●
●
●●
●
●
●
●
●
●
●
●
●
●●
●
●
●
●
●
●
●
●
●
●
●
●
●
● ●
● ●
●
●
●
●
●
●
●
●
●
−2 −1 0 1 2
02
46
8
DMP at FDR<0.05
∆M
−log10(P)
●
●
●●●
●
● ●
●●
●
●●
●● ●
●● ●●
●●
● ●● ●●
●
● ●●
● ●● ●● ●
●●
●●●● ● ●●●● ●● ●●● ●● ● ● ●●
● ●●● ●● ●● ● ●●● ● ●● ●● ●● ●● ●●●●●● ● ● ●●●● ● ●●● ● ●● ●●● ●●●● ● ●●● ●● ●● ●●●● ●●● ●●●● ● ●● ●●● ● ● ●●
● ●● ●● ●●●● ●● ● ●●● ●●● ● ●●● ●●●● ●●● ●● ●●●● ● ●● ● ●● ● ●● ●●● ● ●●●● ●● ●● ● ●● ● ●● ●●●● ● ● ●●● ● ●● ●●● ● ● ●●● ● ●●●● ●●●● ● ●● ●●● ● ●● ● ●● ●● ● ●●●● ● ●● ●●●● ●● ●● ● ●●●●●●●●●● ●●● ● ●● ● ●● ●● ●● ●●● ●● ●● ●●● ●● ●● ●● ● ● ●● ●●● ● ●●●● ● ● ●● ●● ●● ●●●● ● ●●● ●●● ●●● ●●●● ●●●●● ●● ● ●●● ●●●● ●●● ● ●● ● ● ●●●● ● ● ●●● ●●●● ●● ●● ●●● ●●●● ●●● ●●●● ●●● ● ●●● ●● ●● ● ●● ●●● ● ●●● ●●● ●● ●● ●●●● ●● ●● ●● ●● ●● ●● ● ●●● ●●●● ●●● ● ● ●●● ● ●● ●●● ●●● ● ●●●● ● ●●● ●● ● ●● ● ●●● ●●● ● ●●●● ●●●● ● ●●● ● ●● ●● ●● ●●● ●● ●●●● ●● ●● ●●●● ●● ● ●● ●●● ●● ● ●● ● ●●● ●●● ●● ●●● ● ● ●●● ●●● ●●● ● ●● ●●● ●●● ●● ●●● ●● ●●● ●●●●● ●● ●●● ●●● ● ●●● ●● ●● ● ● ●● ●● ●● ●●● ● ●● ●● ● ●●● ●● ● ● ●●● ●● ● ●● ●● ● ●●● ● ●● ●●● ●● ●● ●●●● ● ● ● ●●●● ● ●● ●●● ●●●●●● ●●● ●● ●●● ● ●●● ●● ●●● ●●● ●● ●● ●●●● ● ● ●● ●●● ● ●●● ●●● ●● ●● ●● ●● ●● ● ●●● ●● ● ●● ●● ●●● ●● ●● ●●● ●●●● ●● ● ●●● ●●●● ●●● ●● ● ●●● ●● ●● ●● ● ●●● ● ● ●●● ●●● ● ●● ● ●●● ●● ● ●● ●●● ●●● ●● ●● ● ●● ●● ●●● ●● ● ●● ●●● ●●●●● ● ●● ● ●● ●●● ●● ● ●●●●● ● ●●● ● ● ●● ●● ●● ●● ●● ●● ●●● ●● ●● ●● ●● ● ●●● ●● ● ●●● ● ●● ●● ●● ●●● ● ● ●● ●●● ● ●●● ●● ●● ● ●● ●● ●●●● ●● ●● ● ●●● ● ●●●● ● ●● ● ●●● ● ●●● ●●● ●●●● ●● ● ● ●●● ●●●● ●● ●● ●● ●●●● ●● ● ●● ●●●● ●●●● ● ●● ●●● ●● ● ●● ●●● ●● ●● ● ●●● ● ●● ●●● ● ●● ● ●● ● ●●●● ●● ●● ●●●●●● ●● ●●● ● ●● ●●● ●●●●● ●● ●● ●● ●● ●● ●● ●● ● ●●● ●● ● ●●● ● ●● ● ●●● ●●● ● ●● ● ● ●● ●●● ● ●● ●●● ●● ●●●● ●● ●● ●● ●●●●● ●● ●● ●● ●●● ● ●● ●●● ●● ●● ●●●●● ●● ● ●●● ●● ● ●● ●●● ●● ●●● ●● ●● ● ● ● ●●● ● ●● ●●● ●● ●●● ●● ●●● ●●●● ●● ●● ●● ● ●● ● ●●● ●● ● ●●●● ● ●● ●● ● ●● ●●● ●● ●●● ● ● ●● ●● ●● ●●●●● ●● ● ●● ●●● ● ●●●●● ● ● ●●● ●● ● ● ●● ● ●● ●● ●●●●● ●● ●●● ●● ●● ●●● ●● ●● ●● ●● ● ●● ●● ●● ●●●●● ● ●● ● ●●● ●●● ●●● ● ● ●●● ●●●● ●●● ● ● ●● ●● ● ●● ● ●● ●●●●● ●● ●●● ●● ●● ● ●● ●●● ● ●● ●●●● ● ● ●● ● ●● ●● ● ●●●● ● ●●● ●● ●● ● ● ● ●● ●●● ● ●● ●● ●● ● ●● ● ●● ●●● ● ●●● ● ● ●●●● ●● ●● ●●● ●●●● ●● ● ●●●● ● ●● ● ●●● ●●●● ● ●●●● ●● ●●● ●● ● ●●●● ●● ● ● ●● ● ● ●●● ● ●● ● ● ●● ● ●● ●●● ●●● ● ●●●●● ●●● ●● ●● ● ● ●●●●● ● ●●● ●● ●●● ● ● ● ●● ●● ●●●● ● ●● ●● ●●●● ●●● ●●● ●● ●● ● ●● ●●● ● ●●● ●● ●● ● ●● ●● ●● ●●●● ●● ●●●● ●●● ●●●● ● ●●●● ●●●● ●● ●● ●● ●● ●●● ●● ● ● ●● ●●● ● ●● ● ●●● ● ●●● ●●● ● ●●●●● ● ●● ●● ● ● ●● ●●● ● ●● ●● ●●● ● ●●●● ●●● ●●●● ●● ●● ●● ●● ●● ● ● ●● ● ●●● ●● ● ●●●● ●● ●● ●●●● ●●● ● ●●● ●● ● ●● ●●● ● ●● ● ●● ● ●● ●● ●● ● ●● ● ●●●● ● ●● ● ●● ● ●● ● ● ●● ● ●●● ●●●●● ●● ●● ● ● ●● ●● ●● ● ●●●● ●●● ● ●●●●●● ● ●● ●● ● ●● ●●● ●●● ●● ●●● ●● ●●● ●● ● ● ●●●●● ●● ●●● ● ●●● ● ●● ●● ●● ●● ●● ●● ●● ●● ●●● ● ●● ● ●● ● ●●● ●● ●● ●● ●● ●● ● ●● ●● ●● ● ●● ●●● ●●● ●● ● ●● ●● ●● ●● ●●● ●● ● ●●●● ●●●● ●●●● ●● ● ●● ● ●● ● ●● ●●●● ● ●● ●●● ●● ● ●● ●● ● ●● ●● ●● ●● ●●●● ●● ●●●● ●●●● ● ●●●● ● ●● ●● ●● ● ●● ● ●●●●● ● ●●● ●● ●● ●●● ●● ●● ●● ● ●●●● ●● ● ●● ●● ●●● ● ● ●● ● ●● ●● ●●●● ●● ●● ●●● ● ●● ●●●● ●● ●● ●● ●● ●● ● ● ● ●●●● ● ●● ●● ●● ●●● ● ●●● ●● ●●●●● ●● ●●● ●● ●●● ● ●● ●● ●● ●● ●● ●● ●●● ●● ● ●●● ●● ●●● ● ●● ● ●●● ●● ● ● ●● ●●●●● ●●● ● ●●● ●●●● ●●● ●●●●●● ● ●●● ●●●●● ● ●●● ●●● ●● ●● ●●●● ● ●● ● ●● ● ●●● ● ● ●●●●●● ●● ● ●● ●● ●● ●● ●●●● ● ●●● ●●●●● ●● ● ●●● ●●●● ● ● ● ●● ●● ●●●● ● ●● ●●●● ●●● ●● ●●●● ● ●●●●● ● ●●●● ●● ●● ●● ●● ●● ● ●●●●● ●●● ● ● ●● ●●● ● ●●●● ● ● ●●● ●● ●●● ● ●●●● ●● ●● ●● ● ●●● ●● ●●● ●● ● ●● ● ●● ●● ●●● ● ● ●● ● ●●● ●●● ●●● ● ●● ● ●● ● ●● ●● ● ●● ●● ● ●● ● ●●● ●●●● ● ●●● ●●● ●●● ●● ●● ● ●● ●● ● ●● ●● ●● ● ●●● ●●●●● ●●● ● ●● ● ● ●●● ●●● ●● ● ●● ●●●● ●● ●● ●● ●● ●● ●● ●●● ●● ● ●●●● ● ● ●●●● ●●● ●● ●● ●●● ● ●● ●● ●●● ●●● ●● ●● ●● ●●● ● ●● ● ● ●● ●●●●● ● ● ●● ● ●●● ●● ● ●● ●●●●● ● ●●● ●● ●● ●●●● ●● ●●● ● ●●● ●● ●● ● ● ●● ●●● ●●● ● ●●● ●● ●●● ● ●● ●●● ● ●●● ● ●● ●●● ●●● ●● ●● ●● ● ●●●● ●● ●●● ● ●●● ●●● ●● ● ●● ● ● ●●● ●●● ● ● ● ●●● ●● ●● ●● ● ●● ● ●● ●● ● ● ● ● ●● ●● ●● ● ●●● ●●● ● ● ●●● ●● ● ● ●●●● ●●●● ●● ●●● ● ● ●●●●● ●● ● ●●● ●● ●●●● ●●● ●● ●● ●● ●●● ●● ●●● ●● ●● ●● ●● ● ●● ● ●● ●● ●●● ● ●●● ●● ● ● ●● ●●● ●● ● ●● ● ●● ●● ●● ●● ●● ● ●● ●● ● ●●● ●● ● ● ●● ● ●● ●● ●● ●● ●● ● ●●● ●●● ● ●● ●● ●●●●● ●● ●● ●● ●●● ●● ●● ● ●●● ● ●● ● ●● ●● ● ●● ● ● ●● ●●● ● ●●●● ●● ●●●●● ●● ●●● ●● ● ●●● ●● ● ●●●● ●●●● ● ●● ● ●●● ●● ● ● ●● ●● ●●● ● ● ● ●● ●●● ●● ●● ●● ●●● ●●● ●●● ● ● ●● ●●● ●●● ● ●● ●● ● ●● ●●● ●●●● ● ●● ●●●● ● ●● ● ●● ● ●● ● ● ●● ● ●●● ●●● ●● ●● ●●● ●●● ●●● ●● ●●● ●● ●● ●●●● ●● ● ●●● ●●●● ●●●● ●● ● ●● ●● ●● ●●●● ● ● ● ●●●● ●● ●●●● ● ●● ●● ●● ●● ● ●● ●●● ● ●● ●● ●●● ●●●● ●●● ●● ●●● ●●● ● ● ● ●●● ●● ● ●● ●● ●● ●●● ●● ●● ● ●● ●● ●●●● ● ●● ●● ● ●●● ●● ●●● ● ●● ● ●●● ● ●● ● ● ●● ●●● ●● ●●● ●● ●● ●● ●●● ● ●●● ● ●●● ●●● ●●●● ●● ●● ●● ●● ●●● ● ● ●●● ● ● ●● ● ●●● ●● ● ●● ●● ●●●● ●● ●●●● ● ●●● ●● ●●● ●● ●● ●● ●● ● ● ●● ●●●● ● ●●● ●●● ●● ●● ●● ● ●●● ● ●●● ● ● ●●● ● ●●● ●● ●●● ●● ● ●● ●● ● ●●● ●● ● ● ● ●●● ●● ●● ● ●●●● ● ● ●●● ●● ●● ●● ●● ●●● ●● ●● ●● ●●● ●● ●●● ● ●●● ●● ●● ●●●● ●●● ● ●●●● ●●●● ●● ● ● ●● ● ●● ● ●● ●●● ●● ●● ● ● ●●●● ●● ●● ● ●● ●●● ● ●●● ●●●●●● ●● ● ●● ●● ● ● ●● ● ● ●● ●● ●● ● ● ●●● ●●● ●●● ●●● ● ● ●●● ● ● ●●● ●● ●●● ● ● ●● ●● ●● ● ●● ● ●● ● ●●●● ● ● ●●● ● ● ●●● ●● ●●● ●● ● ● ●● ●● ● ●● ●● ● ●●● ●●● ●● ●●● ● ● ●●● ●●●● ● ●●● ● ●● ●● ●● ●● ●●●● ●● ● ●● ●● ●● ● ●●● ●● ● ●● ● ● ●● ● ●● ●●● ● ●●● ● ●● ●●● ●●●● ●● ●●● ● ●●● ●●● ●●● ●● ●●●●● ● ●●●● ● ●●● ●●● ● ● ●● ●● ● ●● ●● ●● ● ●●● ●●● ●●● ●● ●● ● ● ●● ●● ●● ●● ●● ●● ●● ●● ● ● ●● ●● ● ●●●● ● ●● ●●●●● ●● ●● ●●● ● ●● ●● ● ●●● ● ●●● ●●● ●●● ●● ●●● ●● ●●●●●● ● ●●●● ●●● ●●●● ●● ●● ●●● ●● ●●● ●● ●●● ●●● ●● ● ● ●● ●● ●●●● ● ●●● ● ●●●●● ● ●● ●●● ●● ● ●● ●● ● ●●●● ●● ● ●●● ●● ●● ●● ●●● ● ●● ●●● ● ● ●● ●● ●●● ●● ●●● ●●● ● ●● ● ●●●● ●●● ●●● ●● ● ●●● ● ●● ● ●● ● ●●● ●● ● ●● ●● ● ● ●● ●● ●●●● ●●● ●● ●● ●● ● ● ●●● ●●●● ●● ●●● ●●● ●●●●● ● ● ●● ● ●● ● ●● ●●● ●●●● ●● ● ●● ●●●● ● ●●● ●●● ●● ●●● ●●● ●● ● ● ●●● ● ●● ●●● ●●● ●● ●● ● ● ●●●● ● ●● ● ● ●●●● ●●● ● ●● ● ●● ● ●● ● ●● ●●● ●●● ●●●● ●●● ●● ●●● ● ● ●● ●●● ●●●● ●● ● ●●●●● ●● ●● ●●● ●● ●● ●●● ●●●● ●● ●● ●● ●●● ●● ● ●● ●● ●● ●●● ●● ●●● ●●● ● ●●●● ●●● ●● ●●● ●● ●● ●●● ●●● ● ● ●●● ● ●● ●●● ● ● ●●●● ● ●● ●● ●●● ● ●● ●● ●● ●●● ●● ●●●● ●● ● ●● ● ●● ●● ●●● ● ● ●● ●●●● ● ●●●●●● ● ●● ●● ●●● ●● ●●●● ● ● ●● ●● ●● ●●● ● ●● ● ●●● ●●● ●● ●● ●●● ● ●● ●●●● ●●● ●● ● ●●● ● ●● ●● ●● ●● ● ●● ●● ●●● ●● ● ● ●● ●●● ●●● ● ● ●●● ●● ●● ●● ●●● ●●● ●● ●●● ● ● ●● ●● ●● ●● ●● ●● ●●● ●● ●● ●● ● ●●● ● ●● ●●●● ● ● ● ●● ● ●●● ● ●●●● ●● ●● ●●● ●● ●●●● ●● ●●● ● ●● ●●● ● ●● ● ●● ● ● ●●● ●● ●● ●● ●● ●● ●● ●●● ●● ●● ● ●● ●●● ●● ●● ● ●● ●● ●●●●● ●● ●● ●● ●● ●● ● ●● ●● ●●●●●●● ●●● ●●● ●● ●● ●●● ● ●● ●●●● ● ●●●●● ●●●● ●● ●●● ●● ●● ●● ● ●● ●●● ● ●● ●● ●● ●●● ●●● ●●● ●● ●●●● ●● ●● ● ●● ●●● ●● ●● ●● ●●● ● ● ● ●● ●● ● ●●● ●●● ●● ●● ●●●● ● ●● ● ●●● ● ●● ●●●●● ● ● ●● ● ●●● ●● ● ●● ●●●●●● ●● ●●● ●●● ● ●●● ●●●● ●●●● ●● ●● ●●●●● ● ●● ●●●● ●● ●●●● ●●●●● ● ● ●● ●●●●●● ●●● ●● ●● ● ● ●●● ●● ●●●● ● ●●● ●●● ●● ● ●●● ●●● ●●●● ● ● ●●● ●● ● ●● ●●● ●● ● ●●● ● ● ●● ●● ●●● ● ●● ●● ●● ●●●● ●● ● ●●● ●● ● ● ●● ●● ●● ●●● ●● ●● ●● ●● ●● ● ● ●● ●● ●●●●● ●●● ● ●●●● ●●● ●● ●●●● ● ●● ●●● ●●● ● ●● ●● ●●● ●● ● ●● ●●● ●● ● ●●●●● ● ●● ●● ● ●● ●● ●● ●●● ●● ● ●● ●●● ● ●●●● ●● ●● ● ●● ●●●● ● ● ● ●● ●●● ●●● ●●● ●● ● ● ●● ●● ●● ● ● ●● ● ●●● ● ●●● ●●● ● ●●●● ●● ●● ● ●● ●● ●● ● ●● ●● ●●● ●●●● ●●● ●●●● ●●● ●●● ●●● ●●●● ●●● ● ●
T2!
T1!
F!
M!
D: clustering
B: DNA methylation
DMP!
non-DMP!
Illumina 450K!
-1.5!
-1!
-0.5!
0!
0.5!
1!
1.5!Ac
tive
prom
oter!
Wea
k Pro
mot
er!
Inac
tive/
poise
d Pr
omot
er!
Stro
ng E
nhan
cer!
Wea
k Enh
ance
r!In
sulat
or!
Tran
sript
ional
Elon
gatio
n!W
eak T
rans
cribe
d!Po
lycom
b-re
pres
sed!
Hete
rocr
om/re
petiti
ve/C
NV!
log2
(Fol
d En
richm
ent)!
HSMM!
Island
N_Shelf
N_Shore
S_Shelf
S_Shore
Outsid
e
Relation to CpG Islands
Fraction
0.0
0.1
0.2
0.3
0.4
0.5
***!
***!
***!
1stExon
3'UTR
5'UTR
Body
TSS1500
TSS200
Intergenic
Relation to Genes
Fraction
0.0
0.1
0.2
0.3
0.4
0.5
***!
***!
*! ***!***!
***!
Enhancers
H3K4m
e1
H3K27ac
H3K4m
e1H3K27ac
Relation to Enhancers
Fraction
0.0
0.1
0.2
0.3
0.4
0.5
0.6
***!
***!***!
***!
DMP UP
Molecular Function!
Biological Process!
Cellular Component!
DMP DOWN
AACAGCTG!BAACAGCTGT!VCAGCTGYTG!RRCAGCTGYTSY!VNRVCAGCTGGY!YTGCCAAG!CYTGGCABNSTGCCAR!YCWGGAATGY!CCWGGAATGY!CYAAAAATAG!DCYAAAAATAGM!GKVTCADRTTWC!
ACAGGAAGTG!AACCGGAAGT!NRYTTCCGGH!ATTTCCTGTN!AGAGGAAGTG!VACAGGAAAT!RACCGGAAGT!MACAGGAAGT!ACVAGGAAGT!
MADS box!(MEF-2A, MEF-2C)!
ETS family!
bHLH!(MyoD, MyoG, Myf5, …)!
Known enriched motifs!(p ≤ 10e-10)!0! 5! 10! 15!
titin binding!
collagen binding!
regulation of generation of precursor metabolites and energy!
adipose tissue development!
regulation of cellular carbohydrate catabolic process!
regulation of glycolysis!
substrate adhesion-dependent cell spreading!
contractile fiber!
myofibril!
contractile fiber part!
sarcomere!
actomyosin!
-log10(P)!
0!5!10!15!20!25!30!
transcription regulatory region sequence-specific DNA binding!
RNA pol II core promoter proximal region sequence-specific DNA binding TF activity!
embryonic morphogenesis!
embryonic organ morphogenesis!
regionalization!
cytokine-mediated signaling pathway!
interferon-gamma-mediated signaling pathway!
MHC protein complex!
actomyosin!
-log10(P)!Known enriched motifs!
(p ≤ 10e-10)!
●
●
●
●
●
●
●●
●
●
●
●
●
●
●
●
●
●
●
●●
●
●
●●
●
●
●
●
●
●
●
●
0.5 1.0 1.5 2.0 2.5
3040
5060
7080
90
KANSL2 − cg20643444
methylation (M value)
expr
essi
on (n
orm
alize
d cp
m)
1T1
1T2
4T14T2
5T1
5T2
12T112T2
13T1
26T1
26T2
7T1
7T2
9T1
9T2
11T1
11T2
15T1
15T2
16T116T2
18T1
18T2
20T120T2
22T1
22T2
23T1
23T2
24T1
24T2
27T1
27T2
●
●
T1T2
●
●
●
●
●
●
●
●
●
●
●
●
●
●
●
●
●●
●
●
●
●
●
●
●
●
●
●
●
●
●
●
●
2.0 2.5 3.0 3.5 4.0 4.5 5.0
1520
25
MIPEP − cg17843665
methylation (M value)
expr
essi
on (n
orm
alize
d cp
m)
1T1
1T2
4T1
4T2
5T1
5T2
12T1
12T2
13T1
26T1
26T2
7T1
7T2
9T1
9T2
11T1
11T215T1
15T2
16T1
16T2
18T1
18T2
20T1
20T2
22T1
22T2
23T1
23T2
24T1
24T2
27T1
27T2
●
●
T1T2
●
●
● ●
●
●
●
●
●
●
●
●
●
●
●
●
●
●
●
●
●
●
●
●
●
●
●
●
●
●
●
●
●
−1.0 −0.8 −0.6 −0.4
1214
1618
2022
2426
GRK5 − cg26759179
methylation (M value)
expr
essi
on (n
orm
alize
d cp
m)
1T1
1T2
4T1 4T2
5T1
5T2
12T1
12T2
13T1
26T1
26T2
7T17T2
9T1
9T2
11T1
11T2
15T1
15T2
16T1
16T2
18T1
18T2
20T1
20T2
22T122T2
23T1
23T2
24T1
24T2
27T1
27T2
●
●
T1T2
−30 −20 −10 0 10 20 30
−3−2
−10
12
3
All probes and genes
− log10(FDR) ⋅ sign(log2(FC))
−lo
g 10(
FDR)⋅
sign(∆
M)
●●●
●● ●
●
●●
● ●●
●●
●●
●●
●
●
●●●
●
●
●
●
●●
●
●
●
●
●
●●
●
●
●
●
●
●● ●
●
●●
●
●●●●
●●●
●
●
●
●
●●
●●
●●
●
●
●
●
●
●
●
●
●
●
●
●
●● ●
●●
●
●
●
●
●●●
● ●●
●
●●
●●
●●
●
●
●
●
●
●
●
●
●
●●
●
●●
●
●
●
●
●
●
● ●
●
●●
●
●
●
●
●●
●●
●
● ●
●
●
●●●●
●●
●●
●
●
●●
●
●
●
●●
●●
●
●
●●
●
●●
●●
●
●
●
●
●
●●●●●
●
●●
●
●
● ●
●●● ●
●
●
●
●
●
●
●
●●●●
●●
●
●●
●
●
●
●
●
●
●●
●
●●●
●
●
●
●●
●
●
●
●
●
●
●
●
●
●
●●
●
●
●
●
●●
●
●
●
●●●
●
●●
●●
●
●
●
●
●
●
●●●
● ●
●
●
●
●●●●●●
●●
●
●
●
●●
●
●
●
●
●
●●
●
●●
●●
●●
●
●
●
●
●
●●
●
●
●
●● ●●●
●
●
●
●
●
●
●●
● ●
●
●
●●
●
●
●
●
●●
●
●
● ●
●●
●
●●
●
●
●
●
●
●
●
●
●
●
●
●
●
●
●
● ●●
●●●
●
●
●
●●●
●●
●
●
●
●●●●●
●
●● ●
●
●
●
●
●
●●
●
●
●
●●
●
●●
●●
●
●
●
●●
●
●
●
●
●●
●●
●
●
●
●
●●●
●
●
●
●
●
●●●
●
●●●●
●
●●
●
●
●
●
●●
●
●
●●
● ●●
●
●
●
●
●
●●●
●
●●
●
●
●●
●
●●●●
●
●
●
●
●
● ●
●●
●
●
●●
●
●
●
●
●
●●
●
●
●
●
●
●
●●
●●
●
●
●
●
●
● ●
●
●●
●●
●
● ●●
●
●●
●
●
●
●
●
●
●
●
●
●●●
●
●● ●●
●
●
●
● ●
●
●
●●
●
●
●●
●
●
●●
●●
●
●●
●●●
●
●
●●
●
●
●
●
●●
●
●
●●
●
●
●
●
●
●
●
●
●
●
●
●
●
●
●
●
●
●
●
●●
●
●●
●
●●
●
●
●●
●
●
●
●
●
●
●
●
●●
●
●●●
●●
●
●
●
●
●
●
●
●
●
●●●●
●●●
● ●
●
●
●
●●
●
●
●
●
●●
●●●
●
●
●●
●●
●
●
●
●
●
●
● ●●
●●
●●●
●
●
●
●
●
●
●
●●
●
●
●
●
●
●●
●
●●
●
●
●
●
●
●
●●
●
●
●
●●
●●
●
●
●
●
●
● ●
●●●
●
●
●
●
●
●
●
●
●●●●●
●
●
●
●●
●●●●
●
●●
●
●
●
●
●
●
●
●
● ●
●
●
●
●●
●●●
●
●
●
●●●
●
●●
●●●
●●●
●
●●
●
●
●
●●
●
●
●
●
●●
●
●
●
●
● ●
●
●
●
●
●●●
●
●
●
● ●
●●●
●
●●
●
●
● ●
●
●●
●
●
●
●●
●
●
●●
●
● ●
●
●
●
●●
●
●●
●●
●
●
●●
●
●
●
●●
●●
●●
●●●● ●●
●
●
●
●
●
●
●
●
●
●
●
●●●●
●●
● ●
●
●
●
●
● ●
●
●
●
● ●●
●
●
●
●●●
●●●
●
●
●
●
● ●
●
●
●
●
●
●
●
●●●
●
●●
●
●
● ●
●
●●●
●
●
●
●
●
●
●
●
●
●
●
●
●
●●
●●
● ●
●
●
●
●
●●
●
●
●
●
●
●
●
●
●
●
●
●●
●
●
●●
●●
●● ●●
● ● ●
●
●
●●
●
●●
●
●●●●
●
●
●
●●
●
●
●●
●
●
●
●
●
●
●
●
●
●●
●
●
●
●●
●
●●
●●
●●●
●
●
●
●
●
●
● ●
●●●
●
●
●
●●●
●●
●
●
●●
●
●
●
●
●
●●
●
●
●
●
●
350 pairs 262 pairs
349 pairs89 pairs
255 genes 203 genes
273 genes70 genes
0 1 2 3 4
2040
6080
THNSL2 − cg04051697
methylation (M value)
expr
essi
on (n
orm
alize
d cp
m)
1T1
1T2
4T1
4T2
5T1
5T2
12T1
12T2
13T1
26T126T2
7T17T2
9T19T2
11T111T2
15T1
15T216T116T2
18T118T2
20T1
20T222T122T2
23T1
23T2
24T124T227T127T2
●
●
FM
* p<10-4 T2 vs. T1 # p<10-4 trained vs.
untrained leg
The physiological changes (A) are mirrored by modifications in DNA methylation (B) and gene expression (C). The sample clustering is shown in D using either DNA methylation or gene expression. A segment connects to measurements from the same subject. Training and gender are the major sources of variability!
DNA methylation changes are primarily localized in enhancers !
Transcriptional network analysis confirms the coordinated alternations in methylation and gene
expression. !
TBRG4EIF3K
IDH2
VIM
TGFBI
NEXN
C17orf104 TRDN
CUL3
MDM2
CSDE1 CLIP1
CKB
TARBP1
SDHB
MDH1
DECR1C21orf33
CKMT2MRPL16
HADHB
SLC25A20
ECHDC3
ACSL1
NDUFS2 NDUFA8
MAP3K11
TSPO
GPT
BDH1NSUN5P1
UQCRC1
SLC25A4 NUDT8
TMEM143
NDUFS6
MRPL2
FLYWCH2
EPS15
TTC37
PPP1R12A
CACNA2D1
CAST
CLDN5CLEC14A
CD34
ECSCR
EPB41L1
CDH5COL3A1
COL6A3
ARHGAP31
CAV1 FYNDOCK1
LXN
LRRC8C
ERG ELTD1
NEURL1B ARHGDIB
LY6E
LASP1
SIPA1
CRIP2
TAGLN2
GNAI2
COL4A1 NID2
CLIC1
EPHB4
NDUFA4L2
PDGFRB
ESAM
ROBO4 COL4A2 LAMA4
B: Cellular energetics
C: Morphological!changes
A: Transcriptional and cell cycle
regulation
log2(FC)!+!−!
gene has DMP éê!
gene has DMP ê!
gene has DMP é!
−1.0 −0.5 0.0 0.5 1.0
0.0
0.5
1.0
1.5
2.0
Spearman Correlation
rho
Den
sity
AllDMPand DEG
(A) Spearman correlation between DNA methylation a n d g e n e e x p r e s s i o n calculated either including all pairs of genes/methylation positions or only pairs formed by a DMP and a DEG. The two distributions are strongly different (p< 1e-16 KS test) and peaks of non-zero correlation are highlighted after selecting changing sites after training and stratified according to the genomic location of the DMP.
C: Gene expression
15 min test Citrate synthase activity
A: Illumina annotation
(B) DMPs were enriched in enhancer regions, defined using external annotation sources (Encode, Roadmap Epigenomics). The log2 fold enrichment for DMPs vs. the array was calculated for the relative fraction of probes falling in each category; data from chromatin segmentation in HSMM cells !B: External annotation
Functional annotation of DNA methylation changes indicates a
clear muscle ontology!
A: Integration through correlation
B: Integration through p-value and logFC
3 months!endurance training!
DNA/RNA from muscle biopsies!
DNA methylation!RNA expression!
HumanMethylation450 loci covered with a minimum of 10 and max-imum of 121 aligned reads, resulting in a total of 189,821 and 167,996loci for comparison in the normal and tumor samples, respectively(Fig. 5A). The observed beta value correlations were 0.95 and 0.96 for
RTU’3RTU’5TSS1500 TSS200 1st exon Gene body
Transcription start site (TSS)
N Shelf (2kb) N Shore (2kb) S Shore (2kb) S Shelf (2kb) CpG Island
500 bp
1
Base Position 25,227,314 25,235,174 25,243,034 25,250,894 25,258,754 25,266,614 25,274,474 25,282,334 25,290,194
Cytogenetic Band p36.11Sequence (+) No sequence data file found for this chromosome.
CpG Islands
Methylation Prob…
RUNX3RUNX3RUNX3
RUNX3RUNX3
RUNX3AX747207 RUNX3
AML2
A
B
C
p31.1 q12 q41 q43
Fig. 2. InfiniumMethylation probe selection. 2A. Coverage of NM and NR transcripts from UCSC database. Each transcript was divided into “functional regions” — TSS200 is the regionfrom Transcription start site (TSS) to −200 nt upstream of TSS; TSS1500 covers −200 to −1500 nt upstream of TSS; 5′ UTR, 1st exon, gene body and 3″ UTR were also coveredseparately. 2B. Coverage of CpG islands and adjacent regions. CpG islands longer than 500 bp were divided into separate bins. The 2 kb regions immediately upstream anddownstream of the CpG island boundaries, or “CpG island shores”, and the 2 kb regions upstream and downstream of the CpG island shores, referred to here as “CpG island shelves,”were also targeted separately. 2C. Coverage of the RUNX3 gene by HumanMethylation450 array probes. Blue dots in the “Group methylation Profile”window represent methylationbeta values for CpG sites measured by the HumanMethylation450 array for NA17018 Coriell DNA sample. Individual assay probes are shown as black bars.
Table 2Coverage of genes and transcripts from UCSC database.
Feature type Genes mapped Percent genescovered
Number of locion array
NM_TSS200 15,957 84% 3.73NM_TS1500 18,099 96% 4.31NM_5′UTR 14,137 79% 4.68NM_1stExon 15,580 82% 2.54NM_3′UTR 13,071 72% 1.53NM_GeneBody 17,117 97% 9.92NR_TSS200 2140 71% 2.97NR_TSS1500 2723 90% 3.84NR_GeneBody 2382 79% 7.15
Table 3Coverage of CpG islands from UCSC database.
Featuretype
Featuresmapped
Percent featurescovered
Average numberof loci on array
Island 26,658 96% 5.63N_Shore 26,249 95% 2.93S_Shore 25,761 93% 2.81N_Shelf 23,965 86% 2.07S_Shelf 24,018 87% 2.03
291M. Bibikova et al. / Genomics 98 (2011) 288–295
a b c d
−1.0 −0.5 0.0 0.5 1.0
0.0
0.5
1.0
1.5
2.0
TSS200
rho
Density
−1.0 −0.5 0.0 0.5 1.0
0.0
0.5
1.0
1.5
2.0
TSS1500
rho
Density
−1.0 −0.5 0.0 0.5 1.0
0.0
0.5
1.0
1.5
2.0
5'UTR+1stExon
rho
Density
−1.0 −0.5 0.0 0.5 1.0
0.0
0.5
1.0
1.5
2.0
Gene body + 3'UTR
rho
Density
Significance!• Regular endurance training induces extensive beneficial
effects contributing to prevention and treatment of a multitude of the globally most common diseases (cardiovascular disease, type II diabetes and several forms of cancer).!
• This human study provides novel insights about the mechanisms underlying the massive functional and health benefits of regular, long-term exercise, supporting the role of the epigenome to the training response, as a mediator between genes and environment.!
!