an integrated undergraduate biomedical engineering ... · emg (electromyography) signals and relate...
TRANSCRIPT
AC 2009-670: AN INTEGRATED UNDERGRADUATE BIOMEDICALENGINEERING LABORATORY COURSE
Conrad Zapanta, Carnegie Mellon UniversityConrad M. Zapanta is the Associate Department Head and an Associate Teaching Professor in theDepartment of Biomedical Engineering at Carnegie Mellon University in Pittsburgh, PA. Dr.Zapanta received his Ph.D. in Bioengineering from the Pennsylvania State University inUniversity Park, PA, and his B.S. in Mechanical Engineering (with an option in BiomedicalEngineering) from Carnegie Mellon University. Dr. Zapanta has served as a Visiting AssistantProfessor of Engineering at Hope College in Holland, MI, an Adjunct Professor of Engineering atAustin Community College in Austin, TX, and an Assistant Professor of Surgery andBioengineering at The Pennsylvania State University in Hershey, PA. He also worked forCarboMedics Inc. in Austin, TX, in the research and development of prosthetic heart valves.
Dr. Zapanta’s primary teaching responsibility is to develop laboratory classes for undergraduatesin the Department of Biomedical Engineering. Additional teaching interests include medicaldevice design education, biomedical engineering design, and professional issues in biomedicalengineering. Dr. Zapanta’s responsibilities as Associate Department head include coordination ofundergraduate curriculum, undergraduate student advising, and class scheduling.
Dr. Zapanta’s research interests are in developing medical devices to treat cardiovascular disease,focusing on the areas of cardiac assist devices and prosthetic heart valves.
Dr. Zapanta is an active member in the American Society for Artificial Internal Organs, AmericanSociety of Mechanical Engineers, and the American Society for Engineering Education. He is areviewer for several biomedical engineering journals. Dr. Zapanta also serves as a reviewer forthe National Institute of Health (NIH), Cardiovascular Sciences Small Business Special EmphasisPanel.
Warren Ruder, Carnegie Mellon UniversityWarren Ruder is a graduate student researcher at Carnegie Mellon University in Pittsburgh, PA.Warren is completing a Ph.D. in Biomedical Engineering at Carnegie Mellon where he previouslyearned an M.S. in Mechanical Engineering. He received his S.B. in Civil Engineering from theMassachusetts Institute of Technology. Previously, Warren served as a Health Science Specialistin the VA Boston Healthcare System, affiliated with Harvard Medical School, studying cellphysiology and signaling processes. Warren’s research interests include cell mechanics, stem celltherapy, bio-MEMS/NEMS design, microfluidics, and mechanotransduction.
Justin Newberg, Carnegie Mellon UniversityJustin Y. Newberg is a doctoral candidate in Biomedical Engineering at Carnegie MellonUniversity in Pittsburgh, PA. He received his B.S. in Biomedical Engineering at Johns HopkinsUniversity in Baltimore, MD. At Carnegie Mellon, Justin was a recipient of the BiomedicalEngineering Department's teaching assistant award in 2007. Justin's research interests includeusing machine learning to automatically analyze subcellular protein patterns in various differentconditions.
Paul Glass, Carnegie Mellon UniversityPaul Glass received the B.Eng. degree in mechanical engineering (with a minor in arts) fromMcGill University, Montreal, QC, Canada, in 2005. He is currently working toward the Ph.D.degree in biomedical engineering at the NanoRobotics Laboratory, Carnegie Mellon University,Pittsburgh, PA. His current research interests include medical robots, biologically inspiredadhesives, and minimally invasive surgical technologies. Mr. Glass was awarded a Dowd-ICESFellowship at Carnegie Mellon University in 2006.
© American Society for Engineering Education, 2009
Page 14.200.1
Davneet Minhas, Carnegie Mellon UniversityDavneet Minhas is a Ph.D. candidate in Biomedical Engineering. He is developing a flexibleneedle steering system for percutaneous navigation within deep zones of the brain. He received aB.S. in Biomedical Engineering from Johns Hopkins University.
Elvira Garcia Osuna, Carnegie Mellon UniversityElvira Garcia Osuna is a Special Lecturer for the Ray and Stephanie Lane Center forComputational Biology and the Joint CMU-Pitt Ph.D. Program in Computational Biology. Dr.Garcia Osuna received her Ph.D. in Biomedical Engineering from Carnegie Mellon University inPittsburgh, PA. She received her B.E. degree in Engineering Science with a specialization inBiomedical Engineering from Hofstra University in Hempstead, NY. Dr. Garcia Osuna's researchinterests include Bioimage Processing, Machine Learning, Microscopy and Flow Cytometry.
Liang Tso Sun, Carnegie Mellon UniversityLiang Tso (Steve) Sun is a PhD candidate in Department of Biomedical Engineering at CarnegieMellon University in Pittsburgh, PA. Sun received his B.S. in Biochemistry from University ofWashington in Seattle, WA. Sun's research interests include bioactive materials and stem celldelivery for wound healing applications.
Alyssa Siefert, Carnegie Mellon UniversityAlyssa Siefert is a senior at Carnegie Mellon University who will graduate in May with a dualdegree in Chemical and Biomedical Engineering and a minor in Professional Writing. She will goon to pursue a Ph.D. in Biomedical Engineering at Yale University in the Fall of 2009.
Judy Shum, Carnegie Mellon UniversityJudy Shum is a doctoral candidate in Biomedical Engineering at Carnegie Mellon University inPittsburgh, PA. She received his B.S. in Electrical Engineering at Bucknell University and herM.E. at Worcester Polytechnic Institute. Judy's research interest include developing a diagnostictool to assess the rupture potential of abdominal aortic aneurysms through the use of imageprocessing techniques.
Portia Taylor, Carnegie Mellon UniversityPortia E. Taylor is a PhD student in the Biomedical Engineering Department at Carnegie MellonUniversity. Portia received her B.S. in Computer Science from Grambling State University in2007. Portia is a recipient of the NSF Graduate Research Fellowship as well as the GEMConsortium Graduate Fellowship. She serves as student leader and Recruitment Coordinator forthe NSF funded Quality of Life Technology Center. Portia's research interests includerehabilitation assistive devices, activity classification, and neural prothesis.
Arielle Drummond, Carnegie Mellon UniversityArielle Drummond is currently a Senior Scientist at Medtronic Cardiovascular in Danvers, MA inresearch and development of transcatheter therapies. Dr. Drummond received her Ph.D. inBiomedical Engineering from Carnegie Mellon University in Pittsburgh, PA and her B.S and M.Sfrom the University of North Carolina at Chapel Hill. Dr. Drummond’s research interest includecirculatory support devices, anatomic modeling and cardiovascular fluid dynamics.
Bur Chu, Carnegie Mellon UniversityBur Chu is a doctoral candidate in Biomedical Engineering at Carnegie Mellon University inPittsburgh, PA. She received her B.S. in Chemical Engineering with an additional degree inBiomedical Engineering. Her research interests include biomimetic tissue engineered materialsand muscoloskeletal tissue repair and regeneration.
© American Society for Engineering Education, 2009
Page 14.200.2

© American Society for Engineering Education, 2009
Page 14.200.3
An Integrated Undergraduate
Biomedical Engineering Laboratory Course
Abstract
Laboratory courses are an essential part of a successful undergraduate engineering curriculum.
An integrated laboratory course was developed to provide undergraduates in biomedical
engineering with the opportunity to make measurements on and interpret data from living
systems. Through a combination of lectures and laboratory experiences, the students were
exposed to five areas of biomedical engineering: cellular and molecular biotechnology,
bioinstrumentation, bioimaging, biomaterials, and biomechanics. These areas were selected
because they correspond to the biomedical engineering tracks at Carnegie Mellon University.
The cellular and molecular biotechnology module consists of two labs. The first is an
introductory lab that consists of a pipetting exercise and practice of sterile technique in handling
cells. The second lab involves transforming E. coli with a green fluorescent protein (GFP)
plasmid, a common procedure in biological laboratories. The bioinstrumentation module
incorporates data acquisition basics and the measurement and analysis of EKG
(electrocardiography) signals. In the bioimaging module, the students collect biological images
using an automated microscope. These images are then analyzed using both standard and
customized MATLAB functions. The biomaterials module involves the fabrication of
photopolymerizable monomers and adhesion peptides to make hydrogels of varying peptide
concentrations. Changes in cell adhesion and spreading of NIH-3T3 (mouse fibroblast) cells on
these hydrogels are then observed. In the biomechanics module, students measure and analyze
EMG (electromyography) signals and relate force generation and limb movement to these
signals.
This course also includes a research project. Students research how a technique presented in this
course is used to develop a medical device, clinical therapy, or to study a biological process.
Students present their projects as both a poster in a public setting, and in a written report.
This class has been taught to over 150 students to date over the last two years. This integrated
approach has consistently received favorable course evaluations from students and faculty and
meets several ABET criteria.
1. Introduction
The Department of Biomedical Engineering at Carnegie Mellon University uses a track system
to provide in-depth exposure to an area of biomedical engineering that complements the second
major (Chemical Engineering, Civil & Environmental Engineering, Electrical & Computer
Engineering, Materials Science & Engineering, and Mechanical Engineering). Four tracks are
offered:
Page 14.200.4
1. Cellular and Molecular Biotechnology: This track emphasizes fundamental
applications of biochemistry, biophysics, and cell biology. Special emphasis is placed on
processes and structures occurring on the nanometer to micrometer size scale range.
2. Bioimaging: This track involves the study of biomedical phenomena based on the
information acquired from digital biological and medical images. It draws upon
advances in signal processing optics, molecular biology, and machine learning.
3. Biomaterials and Tissue Engineering: This track involves the design and development
of materials for biological applications and addresses fundamental issues at the interface
of materials science, biology, and engineering.
4. Biomechanics: This track concentrates on the application of solid, fluid, and
continuum mechanics to the study of the structure, function, and behavior of biological
and medical systems under the influence of mechanical forces. It also draws on
advances in biology, continuum mechanics, imaging, applied mathematics, and scientific
computing.
The Biomedical Engineering Laboratory course described in this paper is designed to give the
undergraduate students hands-on experiences in each of these tracks. The course has been
offered every semester since its initial offering in the Fall of 2006. One instructor (Dr. Zapanta)
developed the course and has taught it every semester since its inception. The co-authors have
served as teaching assistants since the courses inception and have had a significant role in its
development. Over 150 students have completed this course to date.
The class was initially offered in the Fall of 2006 with the cellular and molecular biotechnology,
biomaterials, and bioimaging lab modules. The bioinstrumentation (EKG) and biomechanics lab
modules were added in the Spring of 2007. The laboratory course moved into a dedicated
undergraduate laboratory for biomedical engineering in the Fall of 2008.
The course is required for all Biomedical Engineering majors. Although the course is intended
to be taken during the sophomore year, several juniors and seniors also enroll in the course. The
course pre-requisites are Introduction to Biomedical Engineering and Modern Biology. Many
undeclared students taken this course to gauge their interest in biomedical engineering.
The course is limited to 18 students per section, with two to three sections per semester. The
same instructor (Dr. Zapanta) supervises each section with the assistance of a teaching assistant.
Each lab modules consists of a lecture and one to three lab periods (depending on the nature of
the lab and the availability of laboratory equipment). The students choose their own laboratory
groups, which are composed of two to three students. This small size permits active
participation for each group member while encouraging group interaction and cooperation. The
groups remain intact for the entire semester.
Page 14.200.5
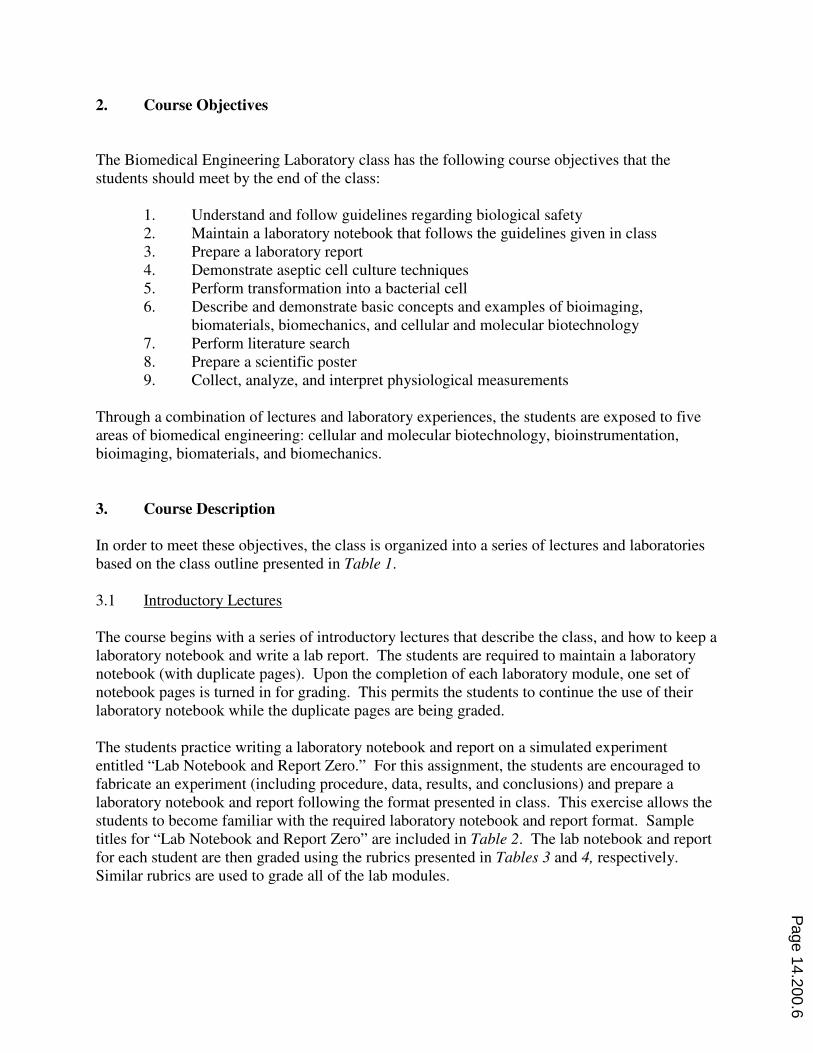
2. Course Objectives
The Biomedical Engineering Laboratory class has the following course objectives that the
students should meet by the end of the class:
1. Understand and follow guidelines regarding biological safety
2. Maintain a laboratory notebook that follows the guidelines given in class
3. Prepare a laboratory report
4. Demonstrate aseptic cell culture techniques
5. Perform transformation into a bacterial cell
6. Describe and demonstrate basic concepts and examples of bioimaging,
biomaterials, biomechanics, and cellular and molecular biotechnology
7. Perform literature search
8. Prepare a scientific poster
9. Collect, analyze, and interpret physiological measurements
Through a combination of lectures and laboratory experiences, the students are exposed to five
areas of biomedical engineering: cellular and molecular biotechnology, bioinstrumentation,
bioimaging, biomaterials, and biomechanics.
3. Course Description
In order to meet these objectives, the class is organized into a series of lectures and laboratories
based on the class outline presented in Table 1.
3.1 Introductory Lectures
The course begins with a series of introductory lectures that describe the class, and how to keep a
laboratory notebook and write a lab report. The students are required to maintain a laboratory
notebook (with duplicate pages). Upon the completion of each laboratory module, one set of
notebook pages is turned in for grading. This permits the students to continue the use of their
laboratory notebook while the duplicate pages are being graded.
The students practice writing a laboratory notebook and report on a simulated experiment
entitled “Lab Notebook and Report Zero.” For this assignment, the students are encouraged to
fabricate an experiment (including procedure, data, results, and conclusions) and prepare a
laboratory notebook and report following the format presented in class. This exercise allows the
students to become familiar with the required laboratory notebook and report format. Sample
titles for “Lab Notebook and Report Zero” are included in Table 2. The lab notebook and report
for each student are then graded using the rubrics presented in Tables 3 and 4, respectively.
Similar rubrics are used to grade all of the lab modules.
Page 14.200.6
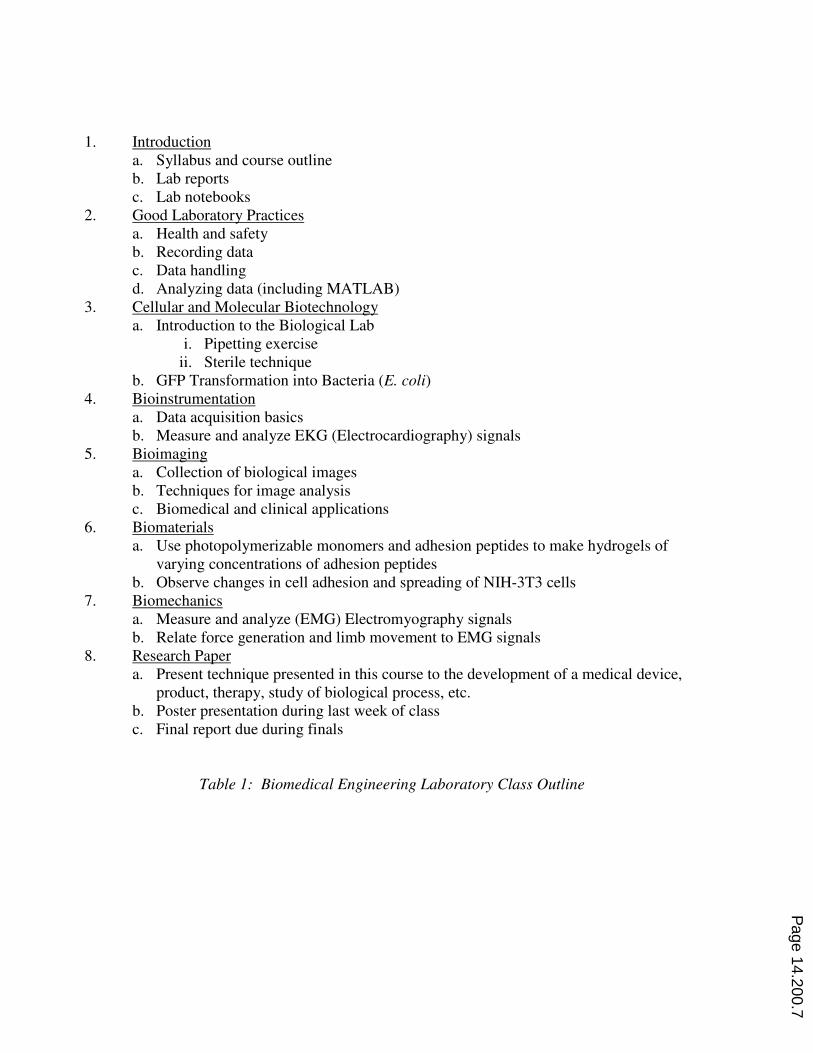
1. Introduction
a. Syllabus and course outline
b. Lab reports
c. Lab notebooks
2. Good Laboratory Practices
a. Health and safety
b. Recording data
c. Data handling
d. Analyzing data (including MATLAB)
3. Cellular and Molecular Biotechnology
a. Introduction to the Biological Lab
i. Pipetting exercise
ii. Sterile technique
b. GFP Transformation into Bacteria (E. coli)
4. Bioinstrumentation
a. Data acquisition basics
b. Measure and analyze EKG (Electrocardiography) signals
5. Bioimaging
a. Collection of biological images
b. Techniques for image analysis
c. Biomedical and clinical applications
6. Biomaterials
a. Use photopolymerizable monomers and adhesion peptides to make hydrogels of
varying concentrations of adhesion peptides
b. Observe changes in cell adhesion and spreading of NIH-3T3 cells
7. Biomechanics
a. Measure and analyze (EMG) Electromyography signals
b. Relate force generation and limb movement to EMG signals
8. Research Paper
a. Present technique presented in this course to the development of a medical device,
product, therapy, study of biological process, etc.
b. Poster presentation during last week of class
c. Final report due during finals
Table 1: Biomedical Engineering Laboratory Class Outline
Page 14.200.7
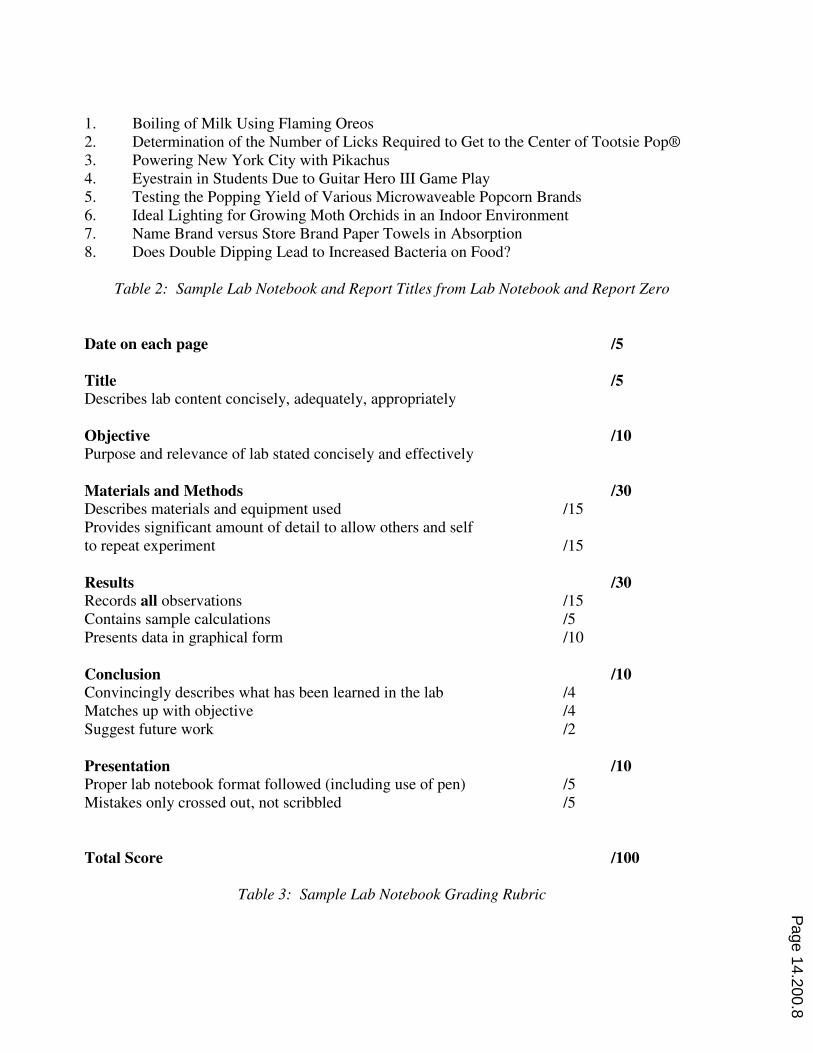
1. Boiling of Milk Using Flaming Oreos
2. Determination of the Number of Licks Required to Get to the Center of Tootsie Pop®
3. Powering New York City with Pikachus
4. Eyestrain in Students Due to Guitar Hero III Game Play
5. Testing the Popping Yield of Various Microwaveable Popcorn Brands
6. Ideal Lighting for Growing Moth Orchids in an Indoor Environment
7. Name Brand versus Store Brand Paper Towels in Absorption
8. Does Double Dipping Lead to Increased Bacteria on Food?
Table 2: Sample Lab Notebook and Report Titles from Lab Notebook and Report Zero
Date on each page /5
Title /5
Describes lab content concisely, adequately, appropriately
Objective /10
Purpose and relevance of lab stated concisely and effectively
Materials and Methods /30
Describes materials and equipment used /15
Provides significant amount of detail to allow others and self
to repeat experiment /15
Results /30
Records all observations /15
Contains sample calculations /5
Presents data in graphical form /10
Conclusion /10
Convincingly describes what has been learned in the lab /4
Matches up with objective /4
Suggest future work /2
Presentation /10
Proper lab notebook format followed (including use of pen) /5
Mistakes only crossed out, not scribbled /5
Total Score /100
Table 3: Sample Lab Notebook Grading Rubric
Page 14.200.8
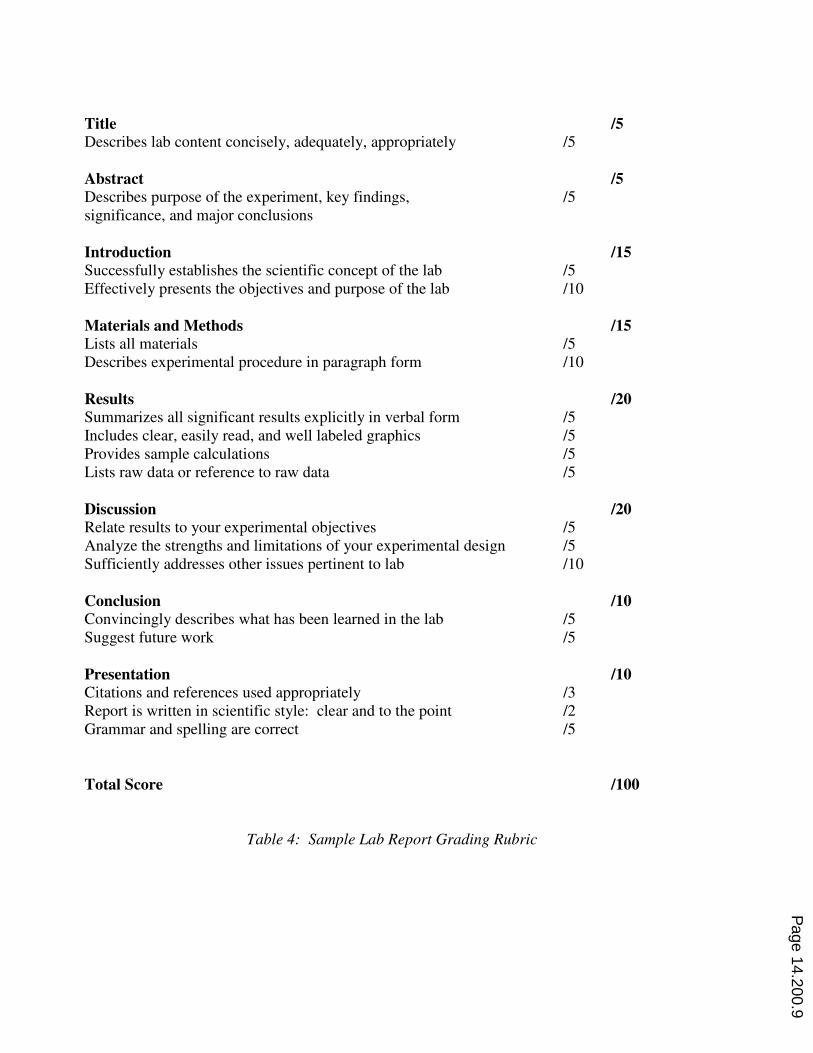
Title /5
Describes lab content concisely, adequately, appropriately /5
Abstract /5
Describes purpose of the experiment, key findings, /5
significance, and major conclusions
Introduction /15
Successfully establishes the scientific concept of the lab /5
Effectively presents the objectives and purpose of the lab /10
Materials and Methods /15
Lists all materials /5
Describes experimental procedure in paragraph form /10
Results /20
Summarizes all significant results explicitly in verbal form /5
Includes clear, easily read, and well labeled graphics /5
Provides sample calculations /5
Lists raw data or reference to raw data /5
Discussion /20
Relate results to your experimental objectives /5
Analyze the strengths and limitations of your experimental design /5
Sufficiently addresses other issues pertinent to lab /10
Conclusion /10
Convincingly describes what has been learned in the lab /5
Suggest future work /5
Presentation /10
Citations and references used appropriately /3
Report is written in scientific style: clear and to the point /2
Grammar and spelling are correct /5
Total Score /100
Table 4: Sample Lab Report Grading Rubric
Page 14.200.9
Additional introductory lectures cover Good Laboratory Practices, health and safety by the
University Biological Safety Officer, data recording and handling, and data analysis. The data
analysis lectures consist of a hands-on tutorial on MATLAB (, Natick, MA). These tutorials are
intended for those who have never used or have little experience with MATLAB. This
MATLAB tutorial consists of the online tutorials provided by The MathWorks (“Navigating the
MATLAB Desktop” and “MATLAB Fundamentals”) as well as using scripts that illustrate
functions and procedures that will be used in subsequent laboratory modules. These include
mathematical operators, trigonometric and exponential functions, how to use the HELP Menu,
assigning variables, manipulating vectors and matrices, plotting curves and surfaces, writing M-
files, and the use of the image processing and signal processing toolboxes.
3.2 Cellular and Molecular Biotechnology Module
The cellular and molecular biotechnology module is made up of two labs: Introduction to the
Biological Laboratory and GFP (Green Fluorescent Protein) Transformation of E. Coli using the
pGLO Plasmid.
3.2.1 Introduction to the Biological Laboratory: One of the keys to successfully culture
cells is the proper use of aseptic (sterile) techniques. Many of the tasks in this course (such as
cell transformation and cell plating) involve the sterile transfer of fluid from one container to
another. This typically involves the use of pipet aids and micropipettes. In this one-day
laboratory, the students practice the proper use of these instruments and other techniques
necessary in the biological laboratory environment.
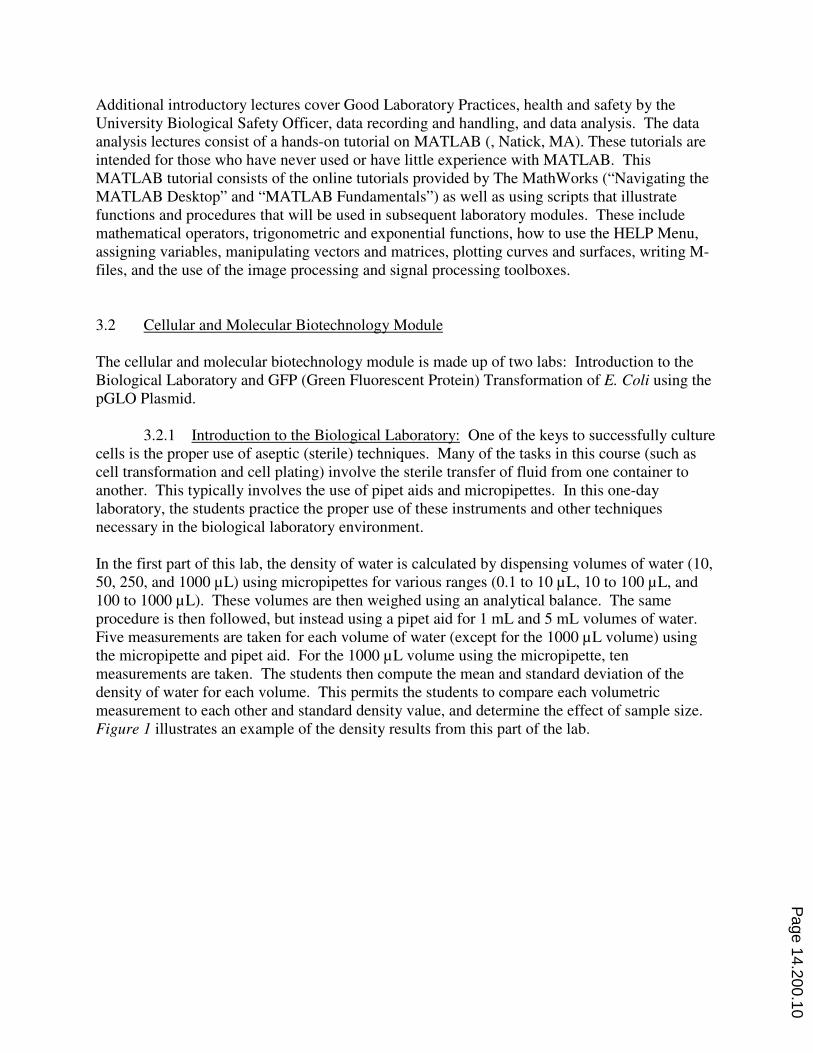
In the first part of this lab, the density of water is calculated by dispensing volumes of water (10,
50, 250, and 1000 µL) using micropipettes for various ranges (0.1 to 10 µL, 10 to 100 µL, and
100 to 1000 µL). These volumes are then weighed using an analytical balance. The same
procedure is then followed, but instead using a pipet aid for 1 mL and 5 mL volumes of water.
Five measurements are taken for each volume of water (except for the 1000 µL volume) using
the micropipette and pipet aid. For the 1000 µL volume using the micropipette, ten
measurements are taken. The students then compute the mean and standard deviation of the
density of water for each volume. This permits the students to compare each volumetric
measurement to each other and standard density value, and determine the effect of sample size.
Figure 1 illustrates an example of the density results from this part of the lab.
Page 14.200.10
The second part of the laboratory involves practicing techniques that involve the manipulation of
cells. These techniques include feeding cells, media aspiration, cell resuspension, and cell
plating. These exercises are conducted in a biological safety cabinet under sterile conditions.
The process of feeding cells is replicated by adding 5 mL of the green sample solution (green
food coloring and water) into a T-25 flask in 0.5 mL aliquots using a pipet aid. The students are
instructed not to dispense liquid on the angled portion of the T-25 flask and not to turn the flask
upside down or shake it around vigorously. Media aspiration is simulated by aspirating green
sample solution from a T-25 flask with a 1 mL pipette and a pipet aid. The students are
instructed to suction liquid from the flask while minimizing contact of the pipet with the flask.
Cell resuspension is simulated by first filling a 5 mL pipet (using a pipet aid) with 4 mL of green
sample solution. A 1 mL volume is then released from pipet into a T-25 flask. The solution is
sucked back into the pipet. A 1 to 2 mL volume is then released from the pipet. The solution is
then sucked back into the pipet. This process is repeated three to five times. Finally, all liquid is
released into the T-25 flask. The students are instructed to suck up from the bottom of the flask
and release liquid to the top and to minimize mixing with air and bubble formation.
Cell plating is simulated by transferring 200 µL of yellow sample solution (yellow food coloring
and water) using a micropipette into all 12 wells of a 12-well plate. The students are instructed
to release the liquid in the center of the well. The addition of cell media is simulated by the
addition of 200 µL of the blue sample solution (blue food coloring and water) into each of the
wells with yellow sample solution. The aspiration of cell media from well plates is simulated by
aspirating the solution from the wells using a 1000 µL micropipette. The students are instructed
to tilt the well plate slightly toward them to pool liquid when aspirating from each well of the
Figure 1: Example of Densities of Water using Micropipettes and Pipet Aids
Error bars represent one standard deviation
Page 14.200.11
well plate and to place the micropipette tip as close to the wall of well as possible to minimize
disturbance of the cells attached to the bottom of the well.
3.2.2 GFP Transformation of E. Coli using the pGLO Plasmid: The second lab in the
cellular and molecular biotechnology module involves transforming bacteria. In this two-day
lab, the students perform a procedure known as genetic transformation. Genetic transformation
literally means change caused by genes, and involves the insertion of a gene into an organism in
order to change the organism’s trait. The students use a procedure to transform bacteria (E. coli
(HB101:K12)) with a gene that codes for Green Fluorescent Protein (GFP). This is a common
procedure used in biological laboratories. The real-life source of this gene is the bioluminescent
jellyfish Aequorea victoria. Green Fluorescent Protein causes the jellyfish to fluoresce and glow
in the dark. Following the transformation procedure, the bacteria should express their newly
acquired jellyfish gene and produce the fluorescent protein, which causes them to glow a brilliant
green color under ultraviolet light.
On the first day of the lab, the students label one micro centrifuge tube “+pGLO” and the other
tube “–pGLO.” A volume of 250 µL of the transformation solution (calcium chloride) is then
added to each of the micro centrifuge tubes. The calcium chloride solution prepares cell walls to
become permeable to plasmid DNA. The two tubes are placed on ice. A sterile loop is then used
to transfer a single E. coli colony from a starter plate and into each of the two micro centrifuge
tubes.
A volume of 10 µL of the pGLO plasmid/DNA solution is then added to the tube labeled
+pGLO. It should be noted that the pGLO plasmid is not added to the tube “–pGLO.” The
pGLO plasmid is manufactured by BioRad (Hercules, CA). This plasmid encodes both the gene
for GFP and the gene for resistance to ampicillin. The pGLO plasmid also incorporates a special
gene regulation system, which can be used to control expression of the fluorescent protein in
transformed cells. The gene for GFP can be switched on in transformed cells by adding the
sugar arabinose to the cells’ nutrient medium. The +pGLO and -pGLO tubes are then incubated
on ice for 10 minutes.
A heat-shock treatment is used to force the pGLO plasmid into the E. coli cells. Both tubes are
transferred from ice to a water bath at 42°C for 50 seconds and then transferred back to ice for
two minutes. Both tubes are then removed from the ice and transferred to the lab bench at room
temperature. A volume of 250 µL of LB (Luria and Bertani) liquid nutrient solution is then
added to each tube.
After incubating at 10 minutes at room temperature, 100 µL of the +pGLO solution is added to
an agar plate containing LB solid nutrients and ampicillin (an antibiotic) and another agar plate
containing LB solid nutrients, ampicillin, and arabinose (a sugar). A volume of 100 µL of the –
pGLO solution is added to an agar plate containing LB solid nutrients and ampicillin and another
agar plate containing LB solid nutrients only. All four agar plates are then stacked and taped
together and then placed upside down in an incubator at 37°C for 24 hours. The plates are then
stored in a refrigerator until the second day of the lab.
Page 14.200.12
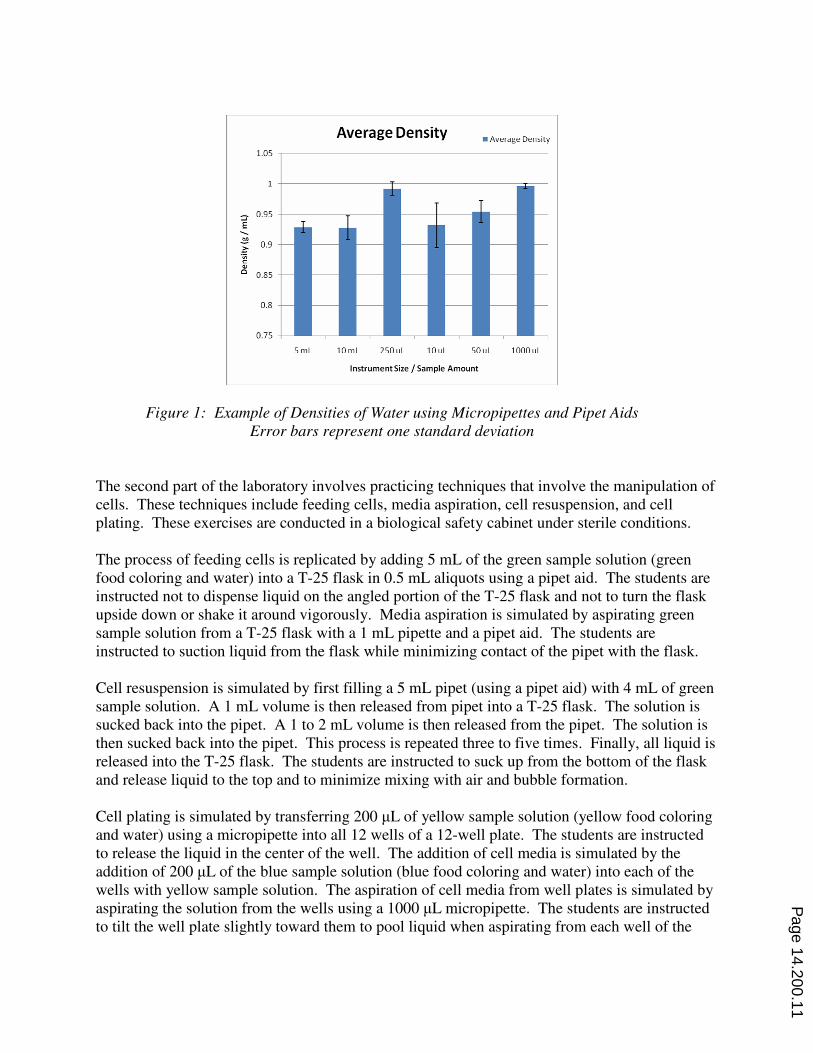
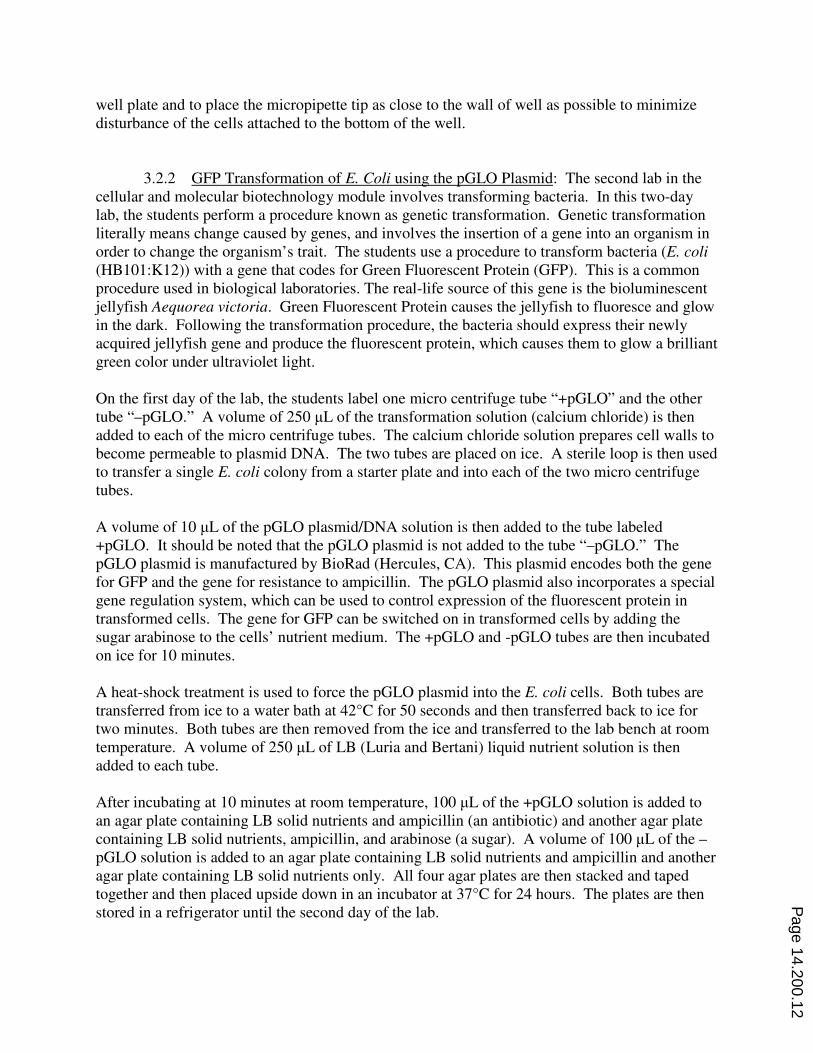
On the second day of the lab, the plates are removed from the refrigerator and examined. Figure
2 illustrates the results that are observed if the experiment is successful.
Material on Agar Plates
Diagram Observations
pGLO plasmid
LB/ampicillin
E. coli colonies are visible. The color of the colonies is yellowish white under normal lighting, and does not change under ultraviolet lighting. The pGLO plasmid expresses antibiotic resistance that permits bacterial growth despite the presence of ampicillin.
Tra
nsf
orm
ati
on
Pla
tes
pGLO plasmid
LB/ampicillin/arabinose
E. coli colonies are visible. The color of the colonies is yellowish white under normal lighting, but turns green under ultraviolet lighting due to the presence of arabinose. The pGLO plasmid expresses antibiotic resistance that permits bacterial growth despite the presence of ampicillin.
LB/ ampicillin This plate had no bacterial growth. The plate is clear under both normal light and ultraviolet lighting. There is no bacteria colony on the plate due to the ampicillin.
Con
tro
l p
late
s
LB
Bacterial growth is prevalent over the entire plate. The color of the colonies is yellowish white under normal lighting, and does not change under ultraviolet lighting.
Figure 2: Results from Successful GFP Transformation of E. Coli using the pGLO Plasmid
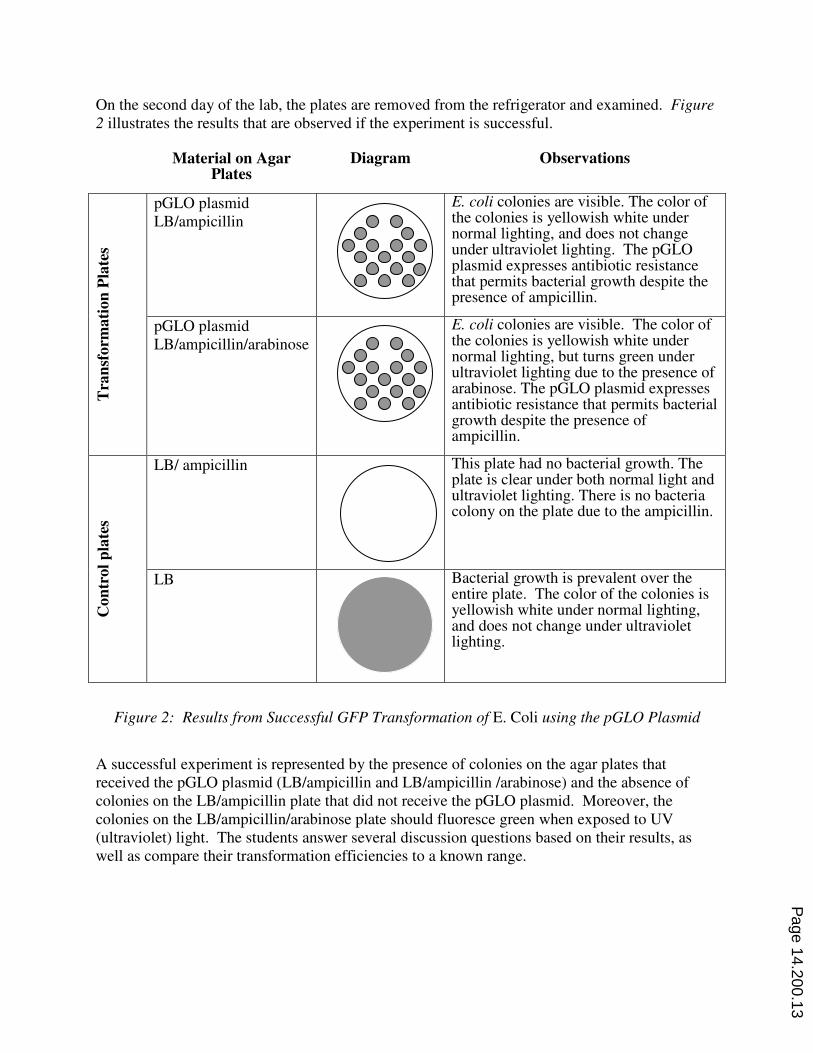
A successful experiment is represented by the presence of colonies on the agar plates that
received the pGLO plasmid (LB/ampicillin and LB/ampicillin /arabinose) and the absence of
colonies on the LB/ampicillin plate that did not receive the pGLO plasmid. Moreover, the
colonies on the LB/ampicillin/arabinose plate should fluoresce green when exposed to UV
(ultraviolet) light. The students answer several discussion questions based on their results, as
well as compare their transformation efficiencies to a known range.
Page 14.200.13
3.3 Bioinstrumentation Module
The bioinstrumentation module introduces the basics of data acquisition through the
measurement and analysis of EKG (electrocardiography) signals. This is through the use of the
CleveLabs (Cleveland, OH) Biomedical Engineering Course Kit. This kit consists of the
BioRadio 150, and the CleveLabs Laboratory Course Software package. The BioRadio is a
wireless 12-channel programmable monitor that records both physiological signals and
transducer inputs. The Laboratory Course Software provides an interface to acquire, view, and
analyze signals that are recorded by the BioRadio 150. This is a one-day lab due to a limited
number of CleveLabs workstations. As a result, two class days are required to ensure that all
students complete the lab.
Snap electrodes are placed on the test subject on the right arm, left arm, right leg, and left leg
after the skin surface is mildly abraded. The electrodes are then attached to the BioRadio 150 to
measure and record a standard three lead EKG. Lead I is measured between the right arm and
left arm. Lead II is measured between the right arm and left leg. Lead III is measured between
the right arm and left leg. The right leg serves as the ground.
For the first part of the lab, the subject is reclined in a chair with his/her feet elevated. The
subject is then instructed to relax while EKG data from lead are recorded for a 10 second
interval. Next, filter parameters are selected to remove the 60Hz noise from the signal. Usually,
a lowpass filter with a corner frequency of 20 Hz is selected. The subject is then requested to
stand with his/her arms are hung at his side without any movements. Again, the subject is
instructed to relax and remain quiet. Another 10 second segment is saved. In order to
investigate the effects of motion artifact on the EKG signal, the subject is instructed to wave
his/her left hand around in space while a 10-second EKG segment is recorded. The subject is
then instructed to wave his/her right hand around in space while another 10-second EKG
segment is recorded.
For the second part of the lab, a standard three lead ECG is used to examine different methods to
automatically compute heart rate. In the first part of this section of the lab module, the subject
sits while resting and has his/her EKG recorded for 30 seconds. The subject’s pulse is also
manually recorded (at his/her wrist) while the 30 second recording is made.
The Heart Rate Detector module (part of the CleveLabs system) is then used to computationally
determine the heart rate. The filter parameters are selected to remove 60 Hz noise using a low
pass filter at approximately 20 Hz. The students then manually vary the signal amplitude
threshold, the time that the signal remains above the amplitude threshold, and the recording time
interval. The students typically choose an amplitude threshold of approximately 700 mV for and
a time threshold of five milliseconds to isolate the QRS complex for Lead I or II. The students
discover that the heart rate detector becomes more accurate as the recording time interval
increases, as a longer interval permits more heartbeats to be used to determine heart rate
Next, the subject is requested to perform some sort of physical activity for a few minutes to
increase his/her heart rate. After the subject sits down and relaxes, the heart rate detector is run
again as an EKG file is saved as “HRexercise.” The wrist pulse is recorded manually as well.
Page 14.200.14
This is the first lab in which the students are strongly encouraged to use MATLAB to perform
data analysis. This involves filtering the EKG data and determining of the heart rate using Fast
Fourier Transforms (FFTs). Filtering is performed to remove the 60 Hz noise and isolate the
motion artifact from waving arms around. FFTs on the resting and exercising data sets reveal
that the dominant peaks that occur between 0.5 and 2.5 Hz correspond to the heart rate.
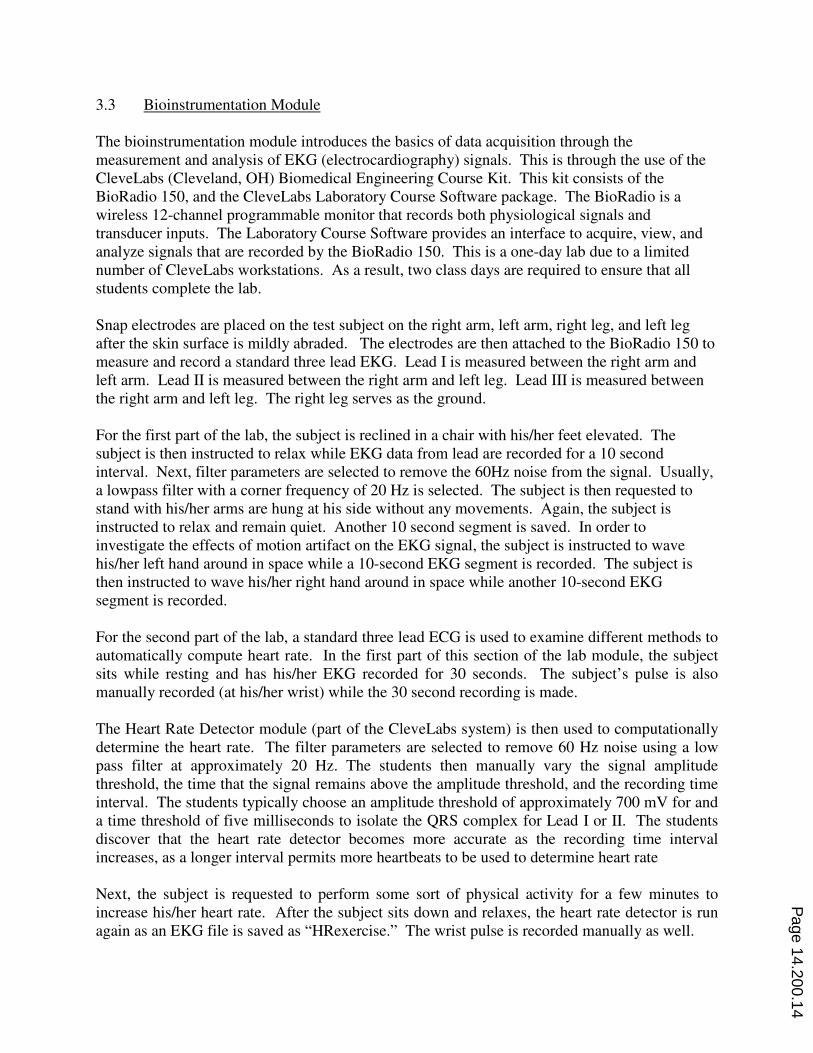
Finally, the cardiac vector is calculated using the waveforms from the sitting and standing EKG
files. The cardiac vector demonstrates how the heart position changes from sitting to standing.
This is shown in Figure 3. The blue vector is the sitting ECG and the red vector is the standing
ECG. The clinical applicability of the cardiac vector is that it is often used to detect heart
position shift due to an enlarged heart.
Figure 3: Sample Sitting (Blue) and Standing (Red) Cardiac Vectors
3.4 Bioimaging Module
In the bioimaging module, the students analyze biological images that are collected from a
fluorescent microscope. These images are from CD-tagged NIH-3T3 (mouse fibroblast) cell
lines that have been modified to produce GFP.1
This is a three-day lab module. On the first day, the students use an automated microscope to
acquire phase contrast and fluorescent images from CD-tagged NIH-3T3 cells that have been
tagged with GFP against various proteins. The images are then analyzed to determine the
number of proteins that are tagged. On the second day, the students use a confocal microscope
to acquire images from NIH-3T3 cells that have been CD-tagged with GFP against alpha-tubulin.
LysoTracker dye is also added. This dye localizes to the acidic portions of the cell, namely the
lysosomes. This dye fluoresces red when excited with green light. Therefore, the green signal
from the alpha-tubulin and red signal from the lysosomes is observed.
Page 14.200.15
The third day of the lab is used to analyze the images using MATLAB. This is done by first
adding pseudo-color to each image. A FFT of the image is then computed and used to determine
the average pixel intensity, amount of fluorescence that overlapped with the nucleus, and the
amount of fluorescence per nucleus.
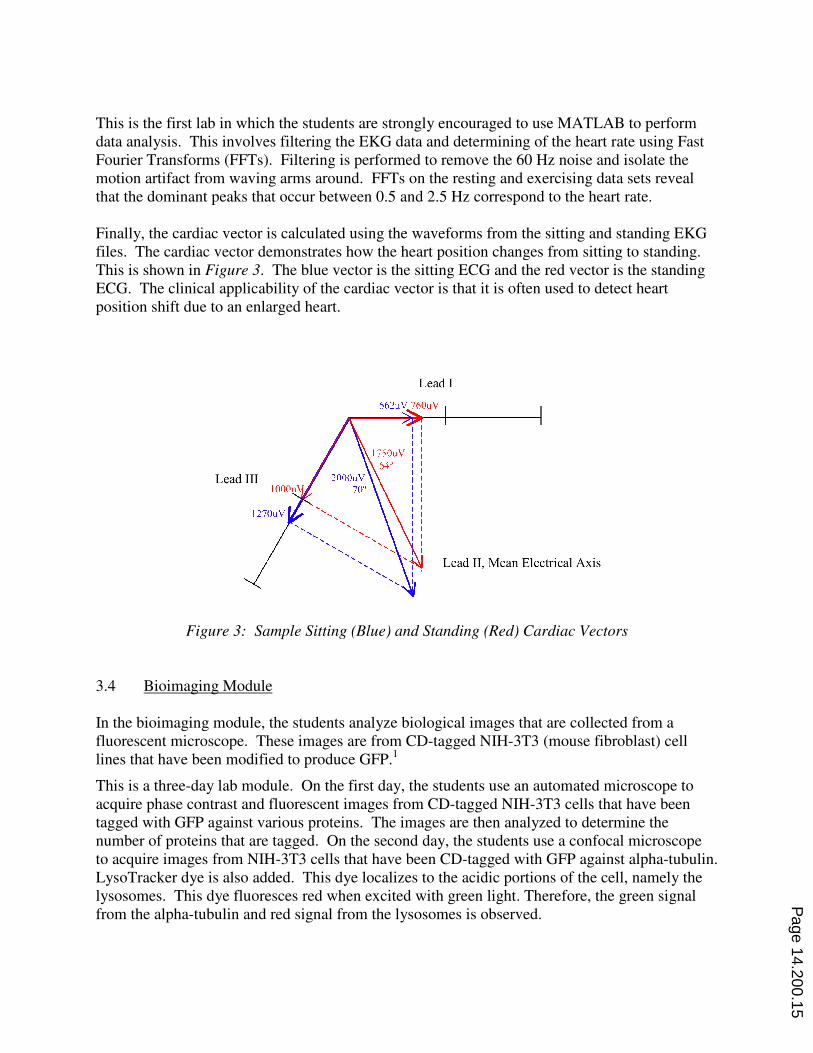
Sample images from the automated and confocoal microscopes follow.
Channel 0 Channel 1
Figure 4: Sample Images from the Automated Microscope
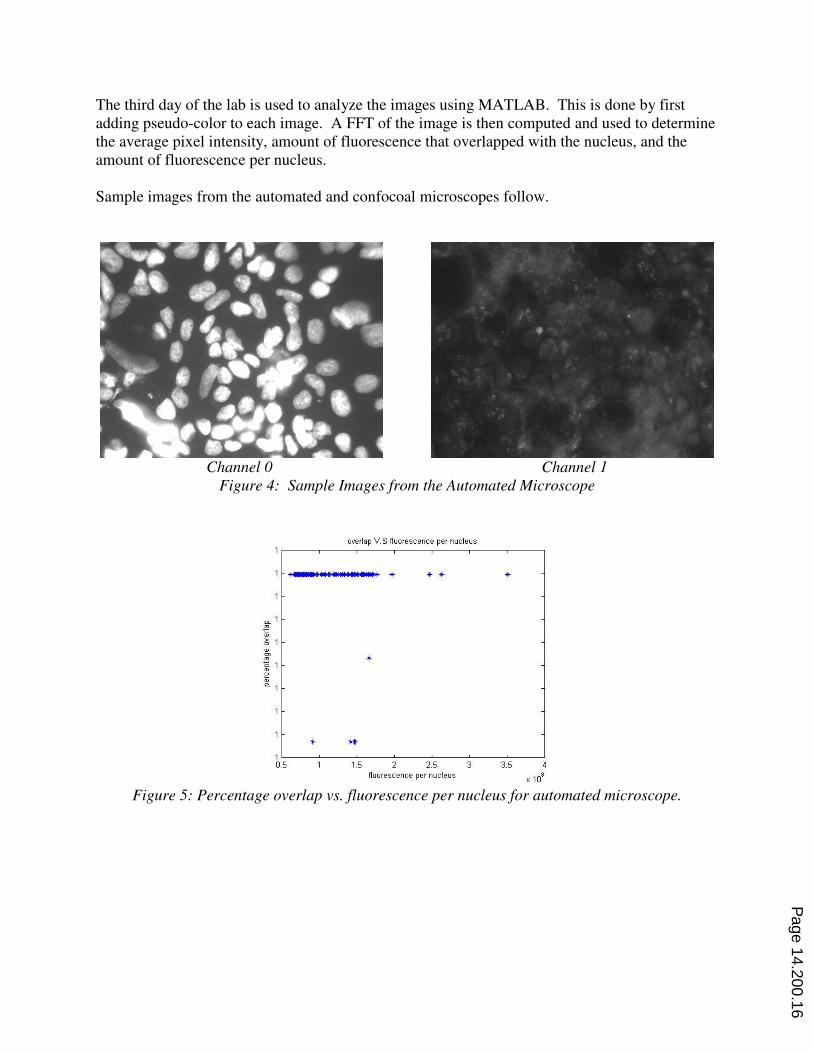
Figure 5: Percentage overlap vs. fluorescence per nucleus for automated microscope.
Page 14.200.16
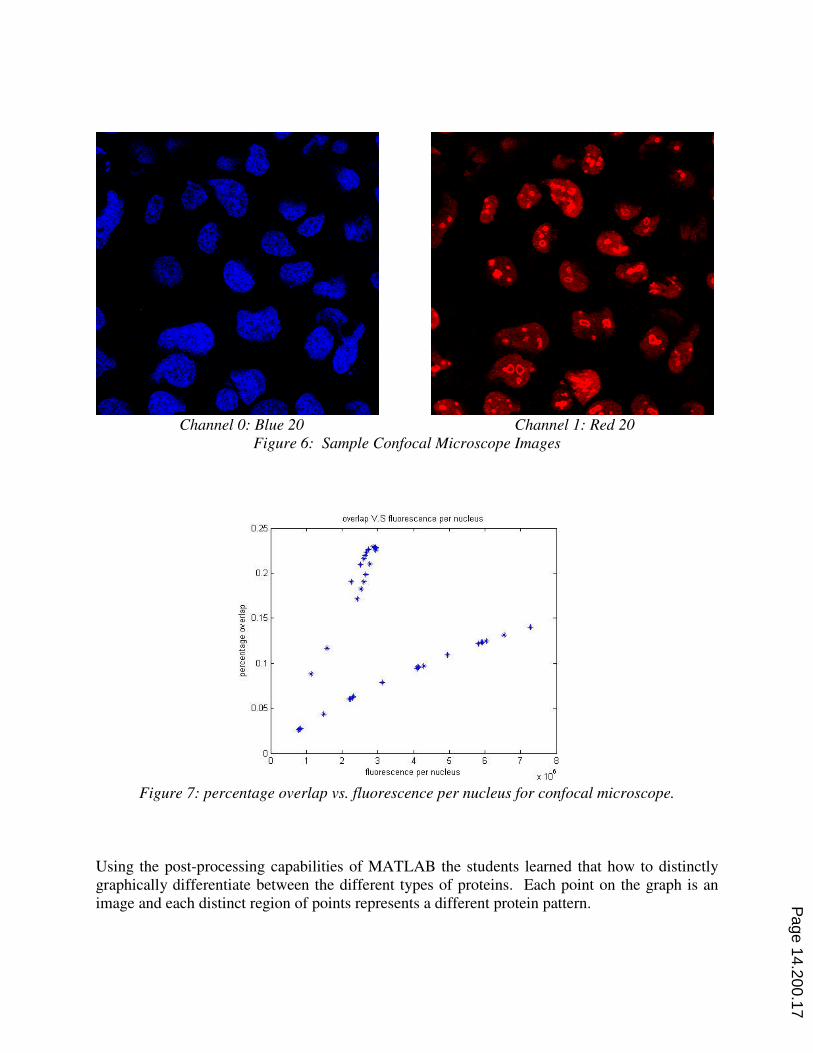
Channel 0: Blue 20 Channel 1: Red 20
Figure 6: Sample Confocal Microscope Images
Figure 7: percentage overlap vs. fluorescence per nucleus for confocal microscope.
Using the post-processing capabilities of MATLAB the students learned that how to distinctly
graphically differentiate between the different types of proteins. Each point on the graph is an
image and each distinct region of points represents a different protein pattern.
Page 14.200.17
3.5 Biomaterials Module
The biomaterials module involves the fabrication of photopolymerizable monomers and adhesion
peptides to make hydrogels of varying peptide concentrations.2 The hydrogels are composed of
PEGDM (polyethylene glycol dimethacrylates) that are prepared by a reaction of PEG and
methalacrylate (MA). ACRL-PEG-GRGDS is composed of ACRL-PEG (Acryloyl-PEG) and
GRGDS (synthetic peptide Gly-Arg-Gly-Asp-Ser). This solution mimics the cellular binding
site of many adhesive proteins in the extracellular matrix and causes spreading and attachment of
fibroblasts. Three concentrations of ACRL-PEG-GRGDS are used: 0, 0.4, and 4.0 mM. I2959
is added to the hydrogel solution serves as an ultraviolet light-sensitive photoinitiator that cross-
links the hydrogel when exposed to UV light. These solutions are prepared prior to the first day
of lab by the teaching assistants. T he biomaterials laboratory module takes three lab periods to
complete.
3.5.1. Hydrogel Preparation: During the first lab period, the students fabricate the
hydrogel samples (two hydrogels per concentration of ACRL-PEG-GRGDS for a total of six
sample) by placing the hydrogel solutions in a Delrin mold to create hydrogel disks
approximately 10 mm in diameter and 1 mm in depth. The Delrin mold with the hydrogel
solutions are exposed to UV light for approximately 15 minutes to cross-link the hydrogels.
While the hydrogels cured, six wells of an untreated 24-well plate are filled with 1 mL of PBS in
each well. After the hydrogels are cured, a spatula is used to carefully remove the hydrogels
from the mold and into a PBS filled well on the 24-well plate with the flat side facing up. After
allowing the hydrogels to soak in the PBS for 5 minutes, the PBS is carefully aspirated from the
wells while preventing damage to the hydrogels. A volume of 1 mL of 70% ethanol is then
added to each well and allowed to incubate at room temperature for 5 minutes. The ethanol is
then aspirated, and 1 mL of PBS was added to each well. The hydrogels is then incubated at
room temperature for 5 minutes. Finally, the PBS is aspirated, and a fresh 1 mL of PBS is added
to each well. This rinsing process in PBS and ethanol removes any uncured solution and
sterilizes the hydrogels prior to cell seeding on day two of the lab. The well plates are then
wrapped in Parafilm and placed in the refrigerator until the next lab session (typically 48 hours
later).
3.5.2. Cell Seeding: During the second lab period, the hydrogels are seeded with NIH-
3T3 cells using the cell culture techniques that were introduced in the Introduction to the
Biological Lab. First, the well-plate from the first day of lab is removed from the refrigerator
and placed in a biological safety cabinet. The PBS is removed from well containing a hydrogel.
A volume of 1 mL of cell media (composed of DMEM, 10% fetal bovine serum, and 1%
penicillin/streptomycin) is then placed in the wells with the hydrogels. The hydrogels are then
incubated in the cell media in an incubator at 37°C and 5% CO2.
While the hydrogels are incubating, a T-25 flask containing NIH-3T3 cells is removed from the
incubator and placed in a biological safety cabinet. The cell media from the flask is aspirated
and replaced with 1 mL of trypsin. The flask is tilted around to ensure that the trypsin covers the
bottom of the flask to loosen the cells from the bottom on the flask. The trypsin is aspirated
away and replaced with 1 mL of fresh trypsin. The flask is again tilted to ensure the bottom is
covered. The NIH-3T3 cells then sit in trypsin for three minutes. The flask is then brought out
Page 14.200.18
of the biological hood to an inverted light microscope. The cells are observed to make sure they
had begun detaching from the flask. Once most cells have detached from the flask, 5 mL of cell
medium is added to the flask. The cells are then resuspended by repeatedly sucking and
dispensing the cells and media into the pipet. Another 5 mL of cell medium is then added. A
100µL sample of the detached NIH-3T3 cells is removed from the flask and placed on
hemocytometer to determine the cell concentration in the flask. The appropriate amount of cell
media is then added to the flask to obtain a concentration of cells of approximately 1.5 x 10⁴
cells/mL.
The well plate with the hydrogels is removed from the incubator and placed into the biological
safety cabinet. A volume of 200 µL of the NIH-3T3 cells/cell medium solution is then placed
into of the wells containing hydrogels. Four wells without hydrogels are also filled with 200 µL
of the NIH-3T3 cells/cell medium solution to serve as controls. A volume of 1 mL of cell media
is then added to all wells with cells. Once the presence of cells in each well is verified with the
inverted light microscope, the well-plate is placed in the cell incubator for 48 hours.
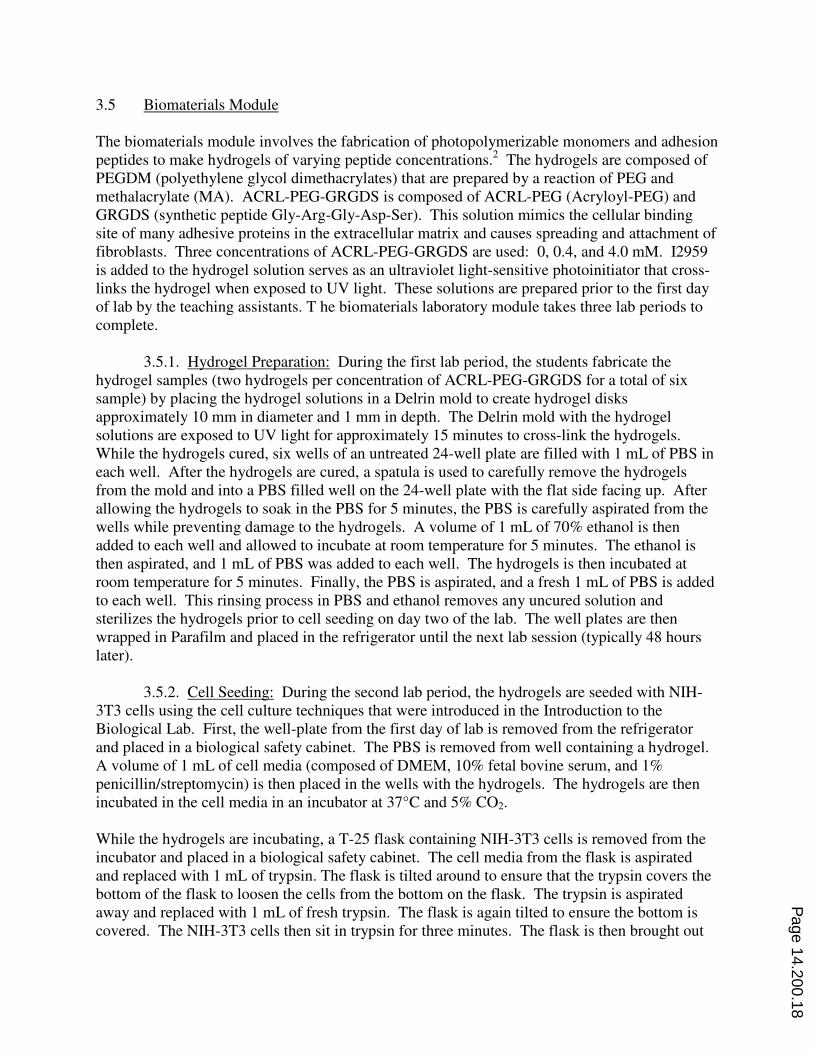
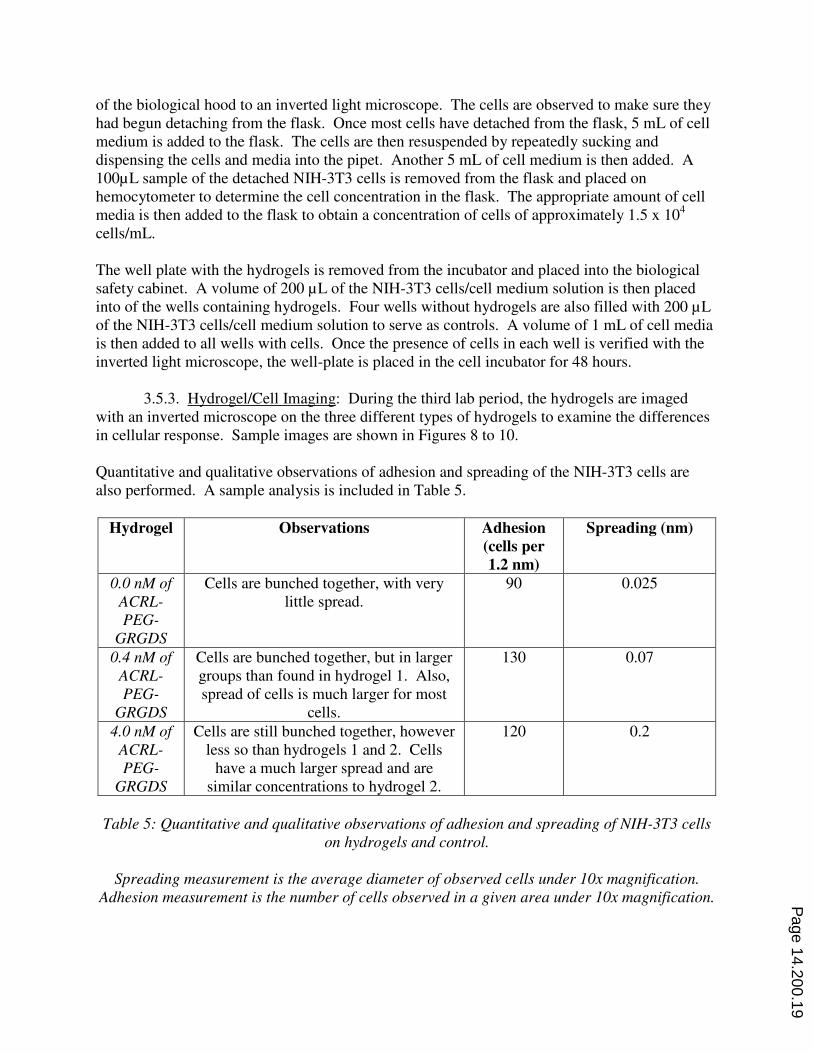
3.5.3. Hydrogel/Cell Imaging: During the third lab period, the hydrogels are imaged
with an inverted microscope on the three different types of hydrogels to examine the differences
in cellular response. Sample images are shown in Figures 8 to 10.
Quantitative and qualitative observations of adhesion and spreading of the NIH-3T3 cells are
also performed. A sample analysis is included in Table 5.
Hydrogel Observations Adhesion
(cells per
1.2 nm)
Spreading (nm)
0.0 nM of
ACRL-
PEG-
GRGDS
Cells are bunched together, with very
little spread.
90 0.025
0.4 nM of
ACRL-
PEG-
GRGDS
Cells are bunched together, but in larger
groups than found in hydrogel 1. Also,
spread of cells is much larger for most
cells.
130 0.07
4.0 nM of
ACRL-
PEG-
GRGDS
Cells are still bunched together, however
less so than hydrogels 1 and 2. Cells
have a much larger spread and are
similar concentrations to hydrogel 2.
120 0.2
Table 5: Quantitative and qualitative observations of adhesion and spreading of NIH-3T3 cells
on hydrogels and control.
Spreading measurement is the average diameter of observed cells under 10x magnification.
Adhesion measurement is the number of cells observed in a given area under 10x magnification.
Page 14.200.19
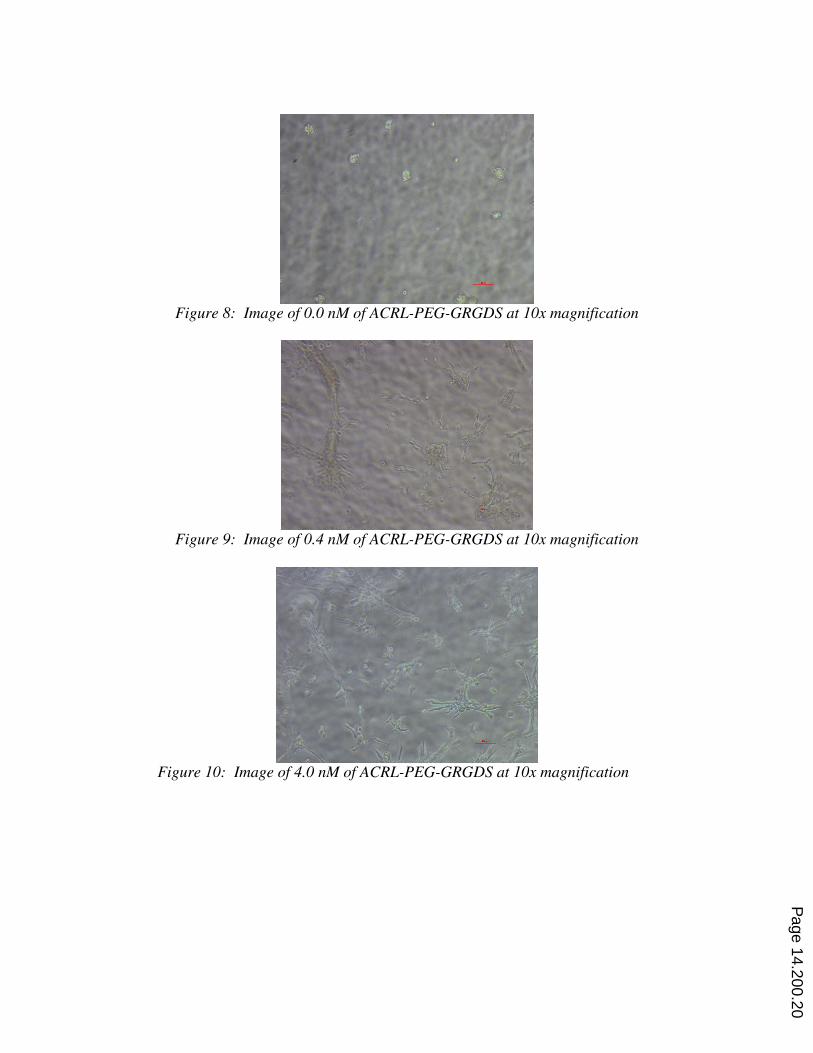
Figure 8: Image of 0.0 nM of ACRL-PEG-GRGDS at 10x magnification
Figure 9: Image of 0.4 nM of ACRL-PEG-GRGDS at 10x magnification
Figure 10: Image of 4.0 nM of ACRL-PEG-GRGDS at 10x magnification
Page 14.200.20
3.6 Biomechanics Module
In the biomechanics module, students measure and analyze EMG (electromyography) signals
and relate force generation and limb movement to these signals. This laboratory module again
utilizes the CleveLab Biomedical Engineering Course Kit to record the EMG signals. This is a
two-day lab: EMG Signal Processing and Force Generation. Each part is run on a different day.
3.6.1 EMG Signal Processing: On the first day of the lab module, EMG signals from
the wrist and bicep muscles are measured under isometric and dynamic loads. Electrodes are
placed on mildly abraded skin of the subject. Two electrodes are placed on the bicep about an
inch apart. Two electrodes are placed on the wrist extensor muscles about an inch apart, and one
electrode is placed directly on the elbow to serve as a ground. The CleveLab EMG program is
then started. An isometric contraction is first performed by the subject. To perform an isometric
contraction, the subject places his/her opposing hand on top of the experimental hand and then
pulls up with his/her bicep against the opposing hand’s resistive force. The end result is a
contracted muscle without motion. Five seconds of data is saved. This is then repeated using the
wrist extensor muscles to pull up against the resistive opposing hand. Five seconds of data is
saved. Motion artifacts of the wrist and arm are also examined and recorded. Five seconds of
data are recorded while the subject uses the bicep to change the angle of the elbow. Next, five
seconds of data is recorded while the subject dynamically contracts the wrist extensor muscles.
In order to examine the effects of increased loads on muscle activation, a student holds a series
of calibrated weights. Data recording is started under the file name “weights.” After recording
five seconds of data with the arm at rest, each of the calibrated weights (3, 5, 10, and 15 pounds)
is placed in the hand of the subject for five seconds, with five seconds of rest in between each
weight placement. For the duration of this data recording, the subject keeps the experimental
arm at a 90 degree angle.
In order to examine how the EMG relates to muscle force and fatigue, the students hold a five
pound weight (or less or more, if necessary!) for 60 seconds. During this time, the wrist and
bicep signals are recorded. The students then conduct a joint-time frequency analysis (JFTA) of
the resulting EMG signal to identify changes in the FFT and EMG during the onset of fatigue.
This is done by dividing the 60 second file into approximately five second “windows.” For each
window, the RMS (root-means-squared) is computed and an FFT performed (using MATLAB)
for both the biceps and wrist muscles.
3.6.2 Force Generation: For the second part of the lab module, EMG recordings of the
right and left calves and quadriceps are simultaneously recorded with the output of a force plate
transducer to determine which leg muscles are active during the different phases of jumping and
how the different properties of muscle impact the ability to perform a jump. The students also
explore any correlations between the magnitude of the EMG and the length of the jump over
time. The force plate measurement for each jump trial is used to calculate the acceleration,
velocity, and position of the subject for each of the trials. The students use MATLAB to
complete these analyses.
Page 14.200.21
Nine electrodes are placed on mildly abraded skin of the subject. Two electrodes are placed on
the right quad muscle about an inch apart, two electrodes are placed on the left quad about an
inch apart. Two electrodes are placed on the left calf about an inch apart. Two electrodes are
placed on the right calf about an inch apart. The final electrode is placed on the knee to serve as
a ground. The electrode leads is taped up to the legs of the subject to minimize motion artifact
from induction on the wires are attached to the BioRadio. In addition, the force plate is attached
to the BioRadio.
The CleveLabs Biomechanics module is then started. The subject is instructed to stand still on
the force plate and the EMG from the left and right quadriceps and calves are simultaneously
recorded with the force signal. The subject is then instructed to squat down while recording
EMG and force data which is saved under the file “squat.” The subject then performs three
horizontal jumps. The first jump is saved under “smalljump” and is a short, vertical jump. The
length of the jump is recorded. This process is repeated for a “mediumjump” and a “bigjump.”
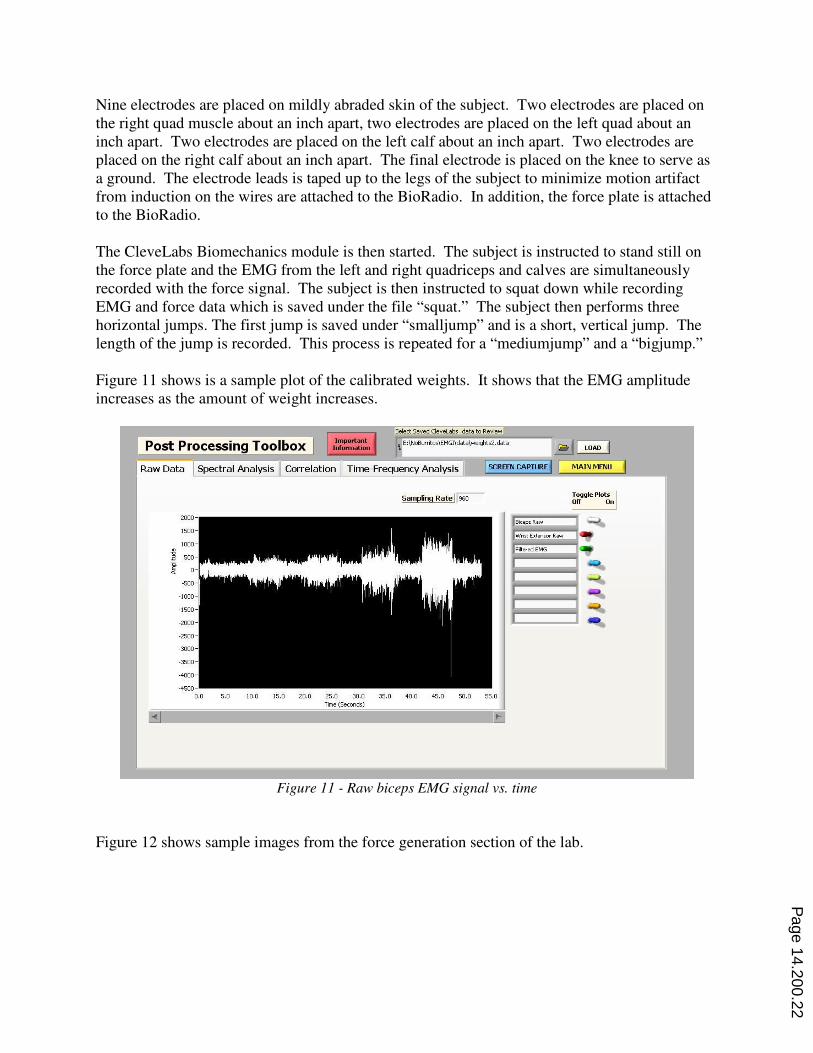
Figure 11 shows is a sample plot of the calibrated weights. It shows that the EMG amplitude
increases as the amount of weight increases.
Figure 11 - Raw biceps EMG signal vs. time
Figure 12 shows sample images from the force generation section of the lab.
Page 14.200.22
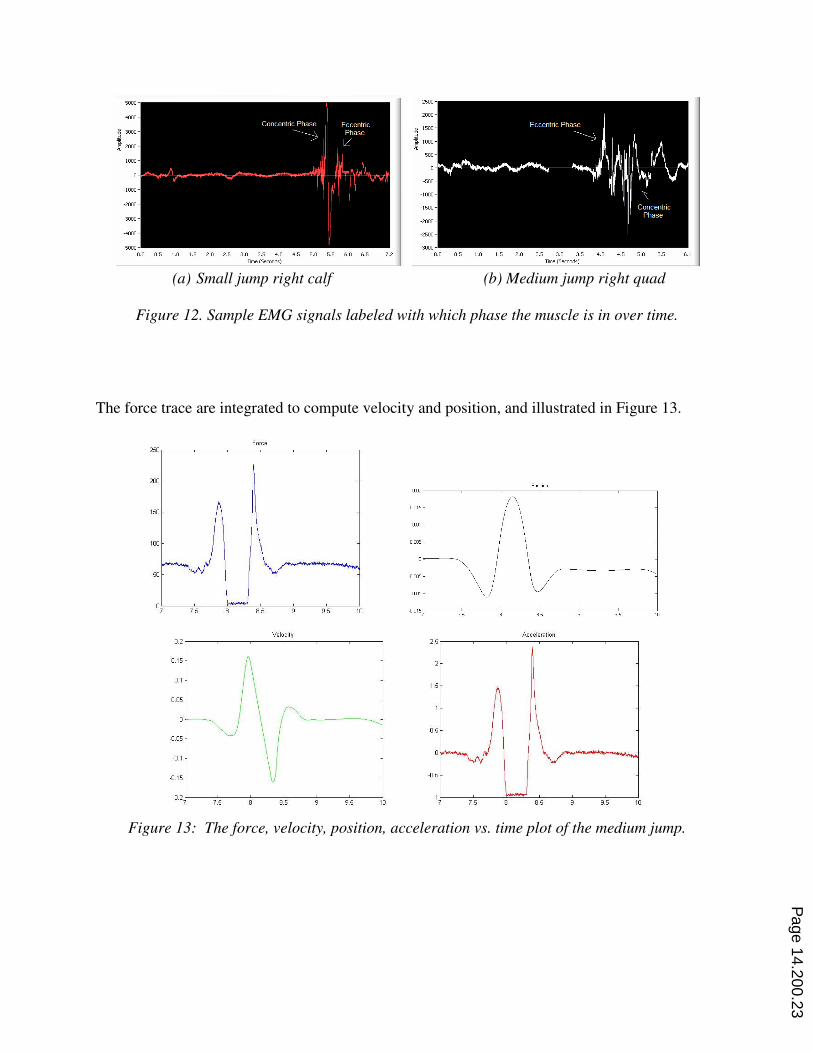
(a) Small jump right calf (b) Medium jump right quad
Figure 12. Sample EMG signals labeled with which phase the muscle is in over time.
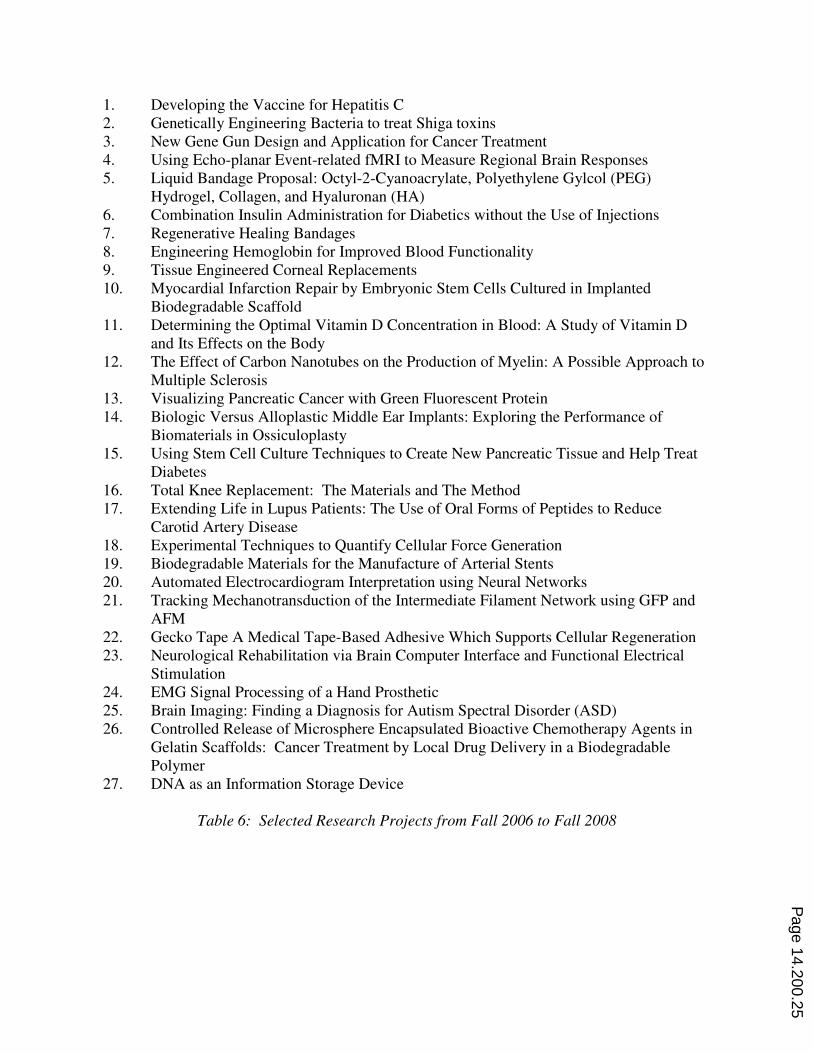
The force trace are integrated to compute velocity and position, and illustrated in Figure 13.
Figure 13: The force, velocity, position, acceleration vs. time plot of the medium jump.
Page 14.200.23

3.7 Research Paper
Each student is required to complete a research paper that summarizes or proposes the
application of a technique presented in this course to biomedical research. Examples of
biomedical research include the development of a medical device, treatment of a disease, or
study of a biological process. No experiments are performed due to the lack of facilities to
perform the wide range of proposed experiments.
The final project is presented in poster and written formats and must contain the following items:
1. Clear definition of medical or biological problem to be addressed
2. Detailed description of technique to be applied
3. Description of how technique relates to some aspect of the biomedical engineering
laboratory course
4. Detailed explanation of how the technique has been be applied to address the medical
or biological problem
5. Complete bibliography that includes references from “key” journals (indexed in
MEDLINE) and follows accepted format
The poster session is a public event at which other students, faculty, and family members are
invited. Each student is required to give a three-minute summary of their poster, as well as grade
each other’s poster.
4. Results
4.1 Research Project
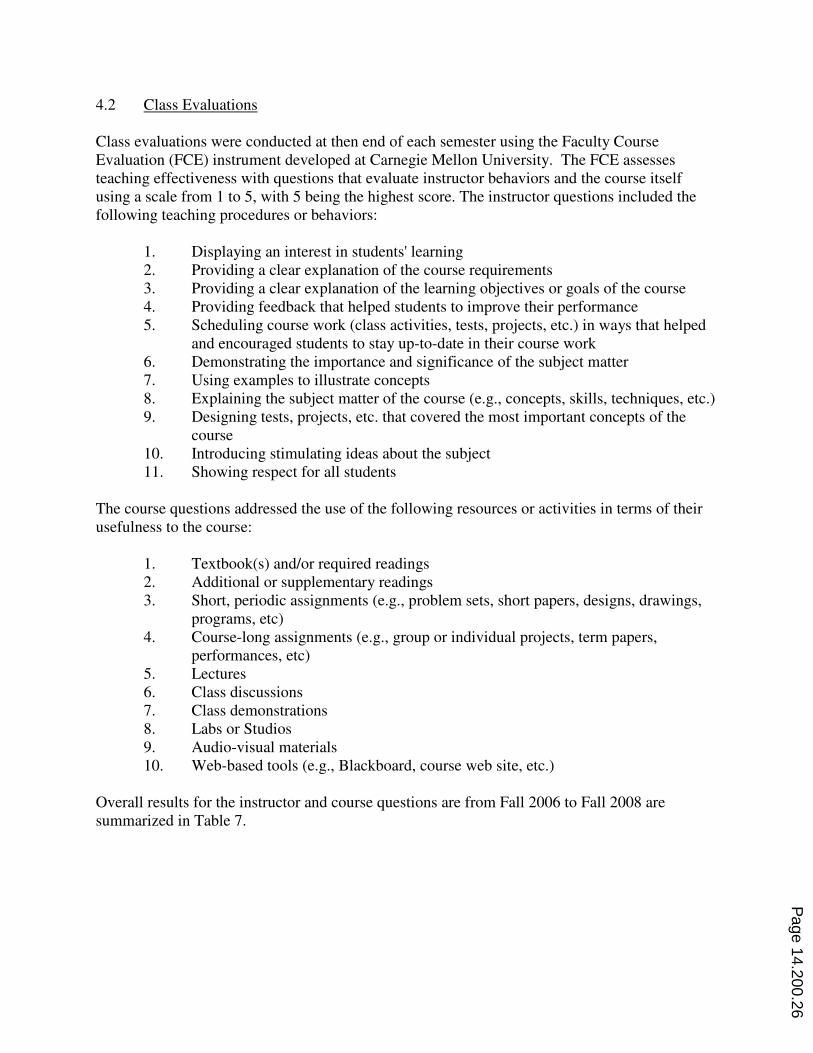
Selected research paper projects are listed in Table 6. Each research project is the result of
constant interaction between each student and the instructor. Each student is required to turn in
ideas for his/her research project early in the semester. After a project is selected, it is presented
to other students in a vetting session, and approved by the instructor. Several updates are turned
in over the course of the semester. This allows the students to receive constant feedback on their
project as well as identify any potential problems. The poster is due approximately two weeks
before the final report, allowing the poster to serve as a draft of the final project.
Page 14.200.24
1. Developing the Vaccine for Hepatitis C
2. Genetically Engineering Bacteria to treat Shiga toxins
3. New Gene Gun Design and Application for Cancer Treatment
4. Using Echo-planar Event-related fMRI to Measure Regional Brain Responses
5. Liquid Bandage Proposal: Octyl-2-Cyanoacrylate, Polyethylene Gylcol (PEG)
Hydrogel, Collagen, and Hyaluronan (HA)
6. Combination Insulin Administration for Diabetics without the Use of Injections
7. Regenerative Healing Bandages
8. Engineering Hemoglobin for Improved Blood Functionality
9. Tissue Engineered Corneal Replacements
10. Myocardial Infarction Repair by Embryonic Stem Cells Cultured in Implanted
Biodegradable Scaffold
11. Determining the Optimal Vitamin D Concentration in Blood: A Study of Vitamin D
and Its Effects on the Body
12. The Effect of Carbon Nanotubes on the Production of Myelin: A Possible Approach to
Multiple Sclerosis
13. Visualizing Pancreatic Cancer with Green Fluorescent Protein
14. Biologic Versus Alloplastic Middle Ear Implants: Exploring the Performance of
Biomaterials in Ossiculoplasty
15. Using Stem Cell Culture Techniques to Create New Pancreatic Tissue and Help Treat
Diabetes
16. Total Knee Replacement: The Materials and The Method
17. Extending Life in Lupus Patients: The Use of Oral Forms of Peptides to Reduce
Carotid Artery Disease
18. Experimental Techniques to Quantify Cellular Force Generation
19. Biodegradable Materials for the Manufacture of Arterial Stents
20. Automated Electrocardiogram Interpretation using Neural Networks
21. Tracking Mechanotransduction of the Intermediate Filament Network using GFP and
AFM
22. Gecko Tape A Medical Tape-Based Adhesive Which Supports Cellular Regeneration
23. Neurological Rehabilitation via Brain Computer Interface and Functional Electrical
Stimulation
24. EMG Signal Processing of a Hand Prosthetic
25. Brain Imaging: Finding a Diagnosis for Autism Spectral Disorder (ASD)
26. Controlled Release of Microsphere Encapsulated Bioactive Chemotherapy Agents in
Gelatin Scaffolds: Cancer Treatment by Local Drug Delivery in a Biodegradable
Polymer
27. DNA as an Information Storage Device
Table 6: Selected Research Projects from Fall 2006 to Fall 2008
Page 14.200.25
4.2 Class Evaluations
Class evaluations were conducted at then end of each semester using the Faculty Course
Evaluation (FCE) instrument developed at Carnegie Mellon University. The FCE assesses
teaching effectiveness with questions that evaluate instructor behaviors and the course itself
using a scale from 1 to 5, with 5 being the highest score. The instructor questions included the
following teaching procedures or behaviors:
1. Displaying an interest in students' learning
2. Providing a clear explanation of the course requirements
3. Providing a clear explanation of the learning objectives or goals of the course
4. Providing feedback that helped students to improve their performance
5. Scheduling course work (class activities, tests, projects, etc.) in ways that helped
and encouraged students to stay up-to-date in their course work
6. Demonstrating the importance and significance of the subject matter
7. Using examples to illustrate concepts
8. Explaining the subject matter of the course (e.g., concepts, skills, techniques, etc.)
9. Designing tests, projects, etc. that covered the most important concepts of the
course
10. Introducing stimulating ideas about the subject
11. Showing respect for all students
The course questions addressed the use of the following resources or activities in terms of their
usefulness to the course:
1. Textbook(s) and/or required readings
2. Additional or supplementary readings
3. Short, periodic assignments (e.g., problem sets, short papers, designs, drawings,
programs, etc)
4. Course-long assignments (e.g., group or individual projects, term papers,
performances, etc)
5. Lectures
6. Class discussions
7. Class demonstrations
8. Labs or Studios
9. Audio-visual materials
10. Web-based tools (e.g., Blackboard, course web site, etc.)
Overall results for the instructor and course questions are from Fall 2006 to Fall 2008 are
summarized in Table 7.
Page 14.200.26
Category Fall
2006
Spring
2007
Fall
2007
Spring
2008
Fall
2008
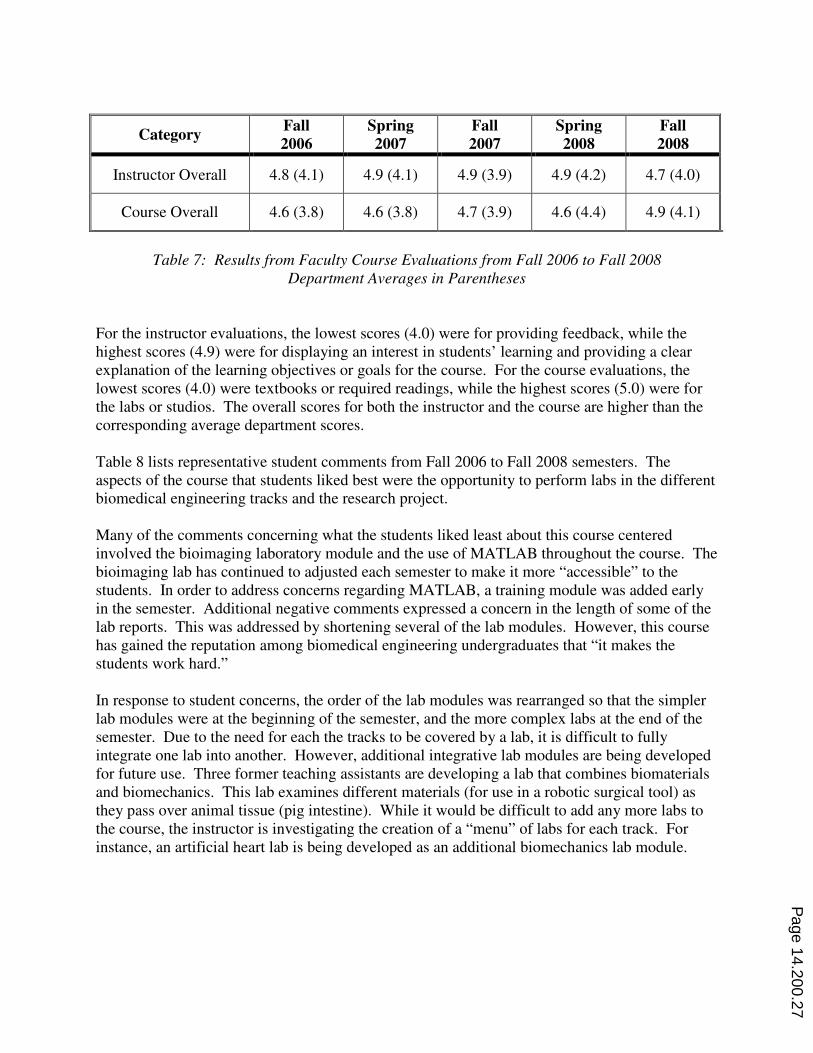
Instructor Overall 4.8 (4.1) 4.9 (4.1) 4.9 (3.9) 4.9 (4.2) 4.7 (4.0)
Course Overall 4.6 (3.8) 4.6 (3.8) 4.7 (3.9) 4.6 (4.4) 4.9 (4.1)
Table 7: Results from Faculty Course Evaluations from Fall 2006 to Fall 2008
Department Averages in Parentheses
For the instructor evaluations, the lowest scores (4.0) were for providing feedback, while the
highest scores (4.9) were for displaying an interest in students’ learning and providing a clear
explanation of the learning objectives or goals for the course. For the course evaluations, the
lowest scores (4.0) were textbooks or required readings, while the highest scores (5.0) were for
the labs or studios. The overall scores for both the instructor and the course are higher than the
corresponding average department scores.
Table 8 lists representative student comments from Fall 2006 to Fall 2008 semesters. The
aspects of the course that students liked best were the opportunity to perform labs in the different
biomedical engineering tracks and the research project.
Many of the comments concerning what the students liked least about this course centered
involved the bioimaging laboratory module and the use of MATLAB throughout the course. The
bioimaging lab has continued to adjusted each semester to make it more “accessible” to the
students. In order to address concerns regarding MATLAB, a training module was added early
in the semester. Additional negative comments expressed a concern in the length of some of the
lab reports. This was addressed by shortening several of the lab modules. However, this course
has gained the reputation among biomedical engineering undergraduates that “it makes the
students work hard.”
In response to student concerns, the order of the lab modules was rearranged so that the simpler
lab modules were at the beginning of the semester, and the more complex labs at the end of the
semester. Due to the need for each the tracks to be covered by a lab, it is difficult to fully
integrate one lab into another. However, additional integrative lab modules are being developed
for future use. Three former teaching assistants are developing a lab that combines biomaterials
and biomechanics. This lab examines different materials (for use in a robotic surgical tool) as
they pass over animal tissue (pig intestine). While it would be difficult to add any more labs to
the course, the instructor is investigating the creation of a “menu” of labs for each track. For
instance, an artificial heart lab is being developed as an additional biomechanics lab module.
Page 14.200.27
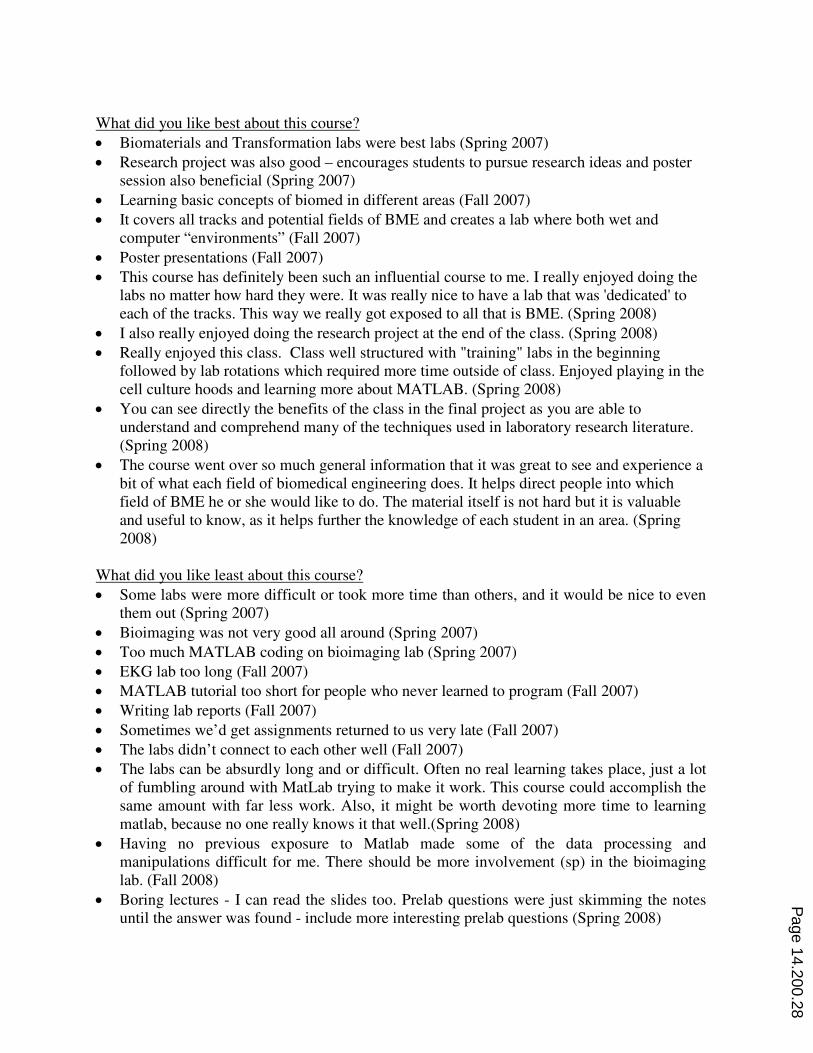
What did you like best about this course?
≠ Biomaterials and Transformation labs were best labs (Spring 2007)
≠ Research project was also good – encourages students to pursue research ideas and poster
session also beneficial (Spring 2007)
≠ Learning basic concepts of biomed in different areas (Fall 2007)
≠ It covers all tracks and potential fields of BME and creates a lab where both wet and
computer “environments” (Fall 2007)
≠ Poster presentations (Fall 2007)
≠ This course has definitely been such an influential course to me. I really enjoyed doing the
labs no matter how hard they were. It was really nice to have a lab that was 'dedicated' to
each of the tracks. This way we really got exposed to all that is BME. (Spring 2008)
≠ I also really enjoyed doing the research project at the end of the class. (Spring 2008)
≠ Really enjoyed this class. Class well structured with "training" labs in the beginning
followed by lab rotations which required more time outside of class. Enjoyed playing in the
cell culture hoods and learning more about MATLAB. (Spring 2008)
≠ You can see directly the benefits of the class in the final project as you are able to
understand and comprehend many of the techniques used in laboratory research literature.
(Spring 2008)
≠ The course went over so much general information that it was great to see and experience a
bit of what each field of biomedical engineering does. It helps direct people into which
field of BME he or she would like to do. The material itself is not hard but it is valuable
and useful to know, as it helps further the knowledge of each student in an area. (Spring
2008)
What did you like least about this course?
≠ Some labs were more difficult or took more time than others, and it would be nice to even
them out (Spring 2007)
≠ Bioimaging was not very good all around (Spring 2007)
≠ Too much MATLAB coding on bioimaging lab (Spring 2007)
≠ EKG lab too long (Fall 2007)
≠ MATLAB tutorial too short for people who never learned to program (Fall 2007)
≠ Writing lab reports (Fall 2007)
≠ Sometimes we’d get assignments returned to us very late (Fall 2007)
≠ The labs didn’t connect to each other well (Fall 2007)
≠ The labs can be absurdly long and or difficult. Often no real learning takes place, just a lot
of fumbling around with MatLab trying to make it work. This course could accomplish the
same amount with far less work. Also, it might be worth devoting more time to learning
matlab, because no one really knows it that well.(Spring 2008)
≠ Having no previous exposure to Matlab made some of the data processing and
manipulations difficult for me. There should be more involvement (sp) in the bioimaging
lab. (Fall 2008)
≠ Boring lectures - I can read the slides too. Prelab questions were just skimming the notes
until the answer was found - include more interesting prelab questions (Spring 2008)
Page 14.200.28
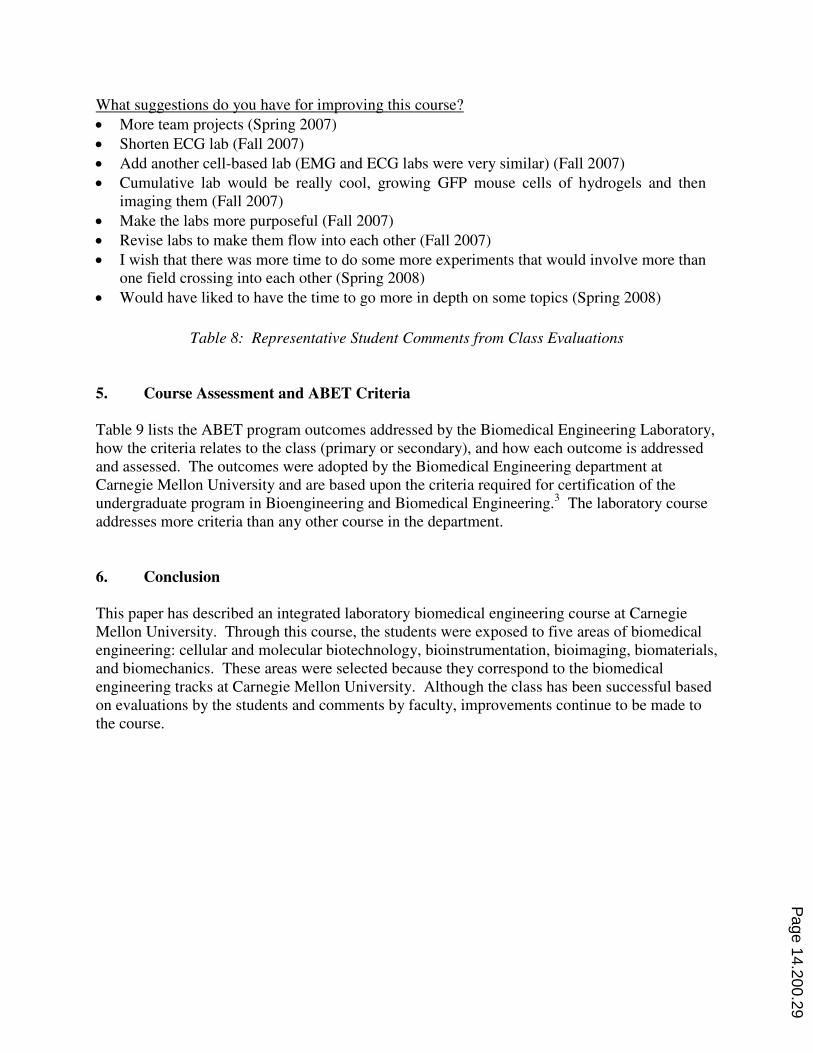
What suggestions do you have for improving this course?
≠ More team projects (Spring 2007)
≠ Shorten ECG lab (Fall 2007)
≠ Add another cell-based lab (EMG and ECG labs were very similar) (Fall 2007)
≠ Cumulative lab would be really cool, growing GFP mouse cells of hydrogels and then
imaging them (Fall 2007)
≠ Make the labs more purposeful (Fall 2007)
≠ Revise labs to make them flow into each other (Fall 2007)
≠ I wish that there was more time to do some more experiments that would involve more than
one field crossing into each other (Spring 2008)
≠ Would have liked to have the time to go more in depth on some topics (Spring 2008)
Table 8: Representative Student Comments from Class Evaluations
5. Course Assessment and ABET Criteria
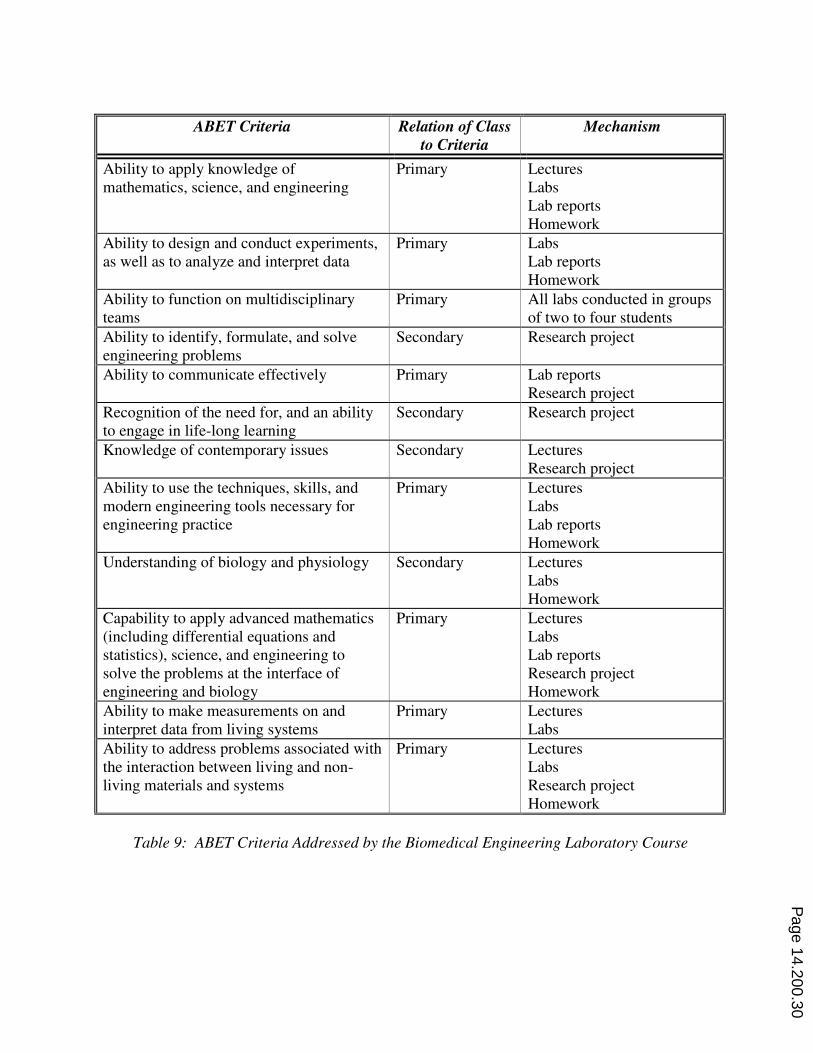
Table 9 lists the ABET program outcomes addressed by the Biomedical Engineering Laboratory,
how the criteria relates to the class (primary or secondary), and how each outcome is addressed
and assessed. The outcomes were adopted by the Biomedical Engineering department at
Carnegie Mellon University and are based upon the criteria required for certification of the
undergraduate program in Bioengineering and Biomedical Engineering.3 The laboratory course
addresses more criteria than any other course in the department.
6. Conclusion
This paper has described an integrated laboratory biomedical engineering course at Carnegie
Mellon University. Through this course, the students were exposed to five areas of biomedical
engineering: cellular and molecular biotechnology, bioinstrumentation, bioimaging, biomaterials,
and biomechanics. These areas were selected because they correspond to the biomedical
engineering tracks at Carnegie Mellon University. Although the class has been successful based
on evaluations by the students and comments by faculty, improvements continue to be made to
the course.
Page 14.200.29
ABET Criteria Relation of Class
to Criteria
Mechanism
Ability to apply knowledge of
mathematics, science, and engineering
Primary Lectures
Labs
Lab reports
Homework
Ability to design and conduct experiments,
as well as to analyze and interpret data
Primary Labs
Lab reports
Homework
Ability to function on multidisciplinary
teams
Primary All labs conducted in groups
of two to four students
Ability to identify, formulate, and solve
engineering problems
Secondary Research project
Ability to communicate effectively Primary Lab reports
Research project
Recognition of the need for, and an ability
to engage in life-long learning
Secondary Research project
Knowledge of contemporary issues Secondary Lectures
Research project
Ability to use the techniques, skills, and
modern engineering tools necessary for
engineering practice
Primary Lectures
Labs
Lab reports
Homework
Understanding of biology and physiology Secondary Lectures
Labs
Homework
Capability to apply advanced mathematics
(including differential equations and
statistics), science, and engineering to
solve the problems at the interface of
engineering and biology
Primary Lectures
Labs
Lab reports
Research project
Homework
Ability to make measurements on and
interpret data from living systems
Primary Lectures
Labs
Ability to address problems associated with
the interaction between living and non-
living materials and systems
Primary Lectures
Labs
Research project
Homework
Table 9: ABET Criteria Addressed by the Biomedical Engineering Laboratory Course
Page 14.200.30
Acknowledgements
The concept for “Lab Notebook and Report Zero” was based on the “toy lab” used in EBME 313
in the Department of Biomedical Engineering, Case Western Reserve University, Cleveland,
OH.
The Introduction to the Biological Laboratory module was based on similar labs used in
BIOE342 in the Department of Biomedical Engineering, Rice University, Houston, TX.
The GFP Transformation Laboratory protocol was adapted from the pGLO™ Bacterial
Transformation Kit, Catalog Number 166-0003EDU, Bio-Rad Laboratories Inc., Hercules, CA.
The Bioinstrumentation lab protocol was adapted from the “Electrocardiography I Laboratory”
and the “Heart Rate Detection Laboratory,” CleveLabs Laboratory Course System, Version 6.0,
2006, Cleveland, OH.
The Biomechanics lab protocol was adapted from the “Electromyography I Laboratory” and the
“Biomechanics Laboratory,” CleveLabs Laboratory Course System, Version 6.0, 2006,
Cleveland, OH.
The Biomaterials protocol was developed by Rowena Mittal, a PhD candidate in Biomedical
Engineering at Carnegie Mellon University. The hydrogel/peptide solutions and molds were
produced by Rowena Mittal, Steve Sun, a PhD candidate in Biomedical Engineering at Carnegie
Mellon University, and Sidi Bencherif, a PhD candidate in Chemistry at Carnegie Mellon
University.
The Bioimaging protocol was developed by Elvira Garcia Osuna, PhD, Special Lecturer, Lane
Center for Computational Biology, Carnegie Mellon University, Pittsburgh, PA.
Special thanks are given to the over 150 students from the 2006 to 2007, 2007 to 2008, and 2008
to 2009 academic years for their hard work, patience, comments, and suggestions. Additional
moral and scientific support was provided by the faculty and staff of the Department of
Biomedical Engineering at Carnegie Mellon University.
References:
1. Jarvik J. W., Adler, S. A., Telmer, C. A., Subramaniam, V., and Lopez, A. J. (1996) Cdtagging: A new
approach to gene and protein discovery and analysis. BioTechniques 20: 896-904.
2. Lin-Gibson S, Bencherif S, Cooper JA, Wetzel SJ, Antonucci JM, Vogel BM, Horkay F, Washburn NR.
Synthesis and characterization of PEG dimethacrylates and their hydrogels. Biomacromolecules. 2004 Jul-
Aug;5(4):1280-7.
Page 14.200.31

3. Accreditation Board for Engineering and Technolgy (ABET) Program Outcomes and Criteria for
Bioengineering and Biomedical Engineering Programs, www.abet.org, accessed February 5, 2009.
Page 14.200.32