an integrated dynamic financial analysis and decision support system ... · an integrated dynamic...
TRANSCRIPT

AN INTEGRATED DYNAMIC FINANCIAL ANALYSIS AND DECISION SUPPORT SYSTEM FOR A PROPERTY CATASTROPHE REINSURER t
By STEPHEN P. LOWE
Tillinghast- Towers Perrin
JAMES N. STANARD
RenaissanceRe Holdings, Ltd.
ABSTRACT
This paper describes the dynamic financial analysis model currently being used by a property catastrophe reinsurer to manage its business, The model is an integral part of the day-to-day operations at the Company, and is used as a decision making tool in the underwriting, investment, and capital management processes. The paper begins by describing the framework that the Company uses for risk management. This includes a classification of the risks facing the Company, which is used to define and prioritize their implementation in the model. Also included is a description of the conceptual approach the Cornpany takes to evaluate the tradeoff between risk and return. The paper then goes on to describe the structure and operation of the dynamic financial analysis model and provides examples of its use at the Company, along with illustrative examples of the various types of output it produces.
KEYWORDS
Asset/Liability management; Capital adequacy; Dynamic financial analysis; Expected policyholder deficit; Modern portfolio theory; Property catastrophe reinsurance; Risk management; Simulation models; Underwriting cycles.
I. INTRODUCTION
The Company that is the subject of this paper is a major property catastrophe reinsurer, writing excess of loss coverage on a world-wide basis. It was formed in Bermuda in 1993 to provide additional capacity to the market, capitalizing on the
I An earlier version of this paper was prepared for tile Casualty Actuarial Society's 1996 Call for Papers on Dynamic Financial Models of Property/Casualty Insurers. An updated version was presented at the XXVII ASTIN Colloquium in Copenhagen.
ASTIN BULLETIN, Vol. 27. No. 2. 1997. pp. 339-371

340 STEPHEN P. LOWE, JAMES N. STANARD
market dislocation following Hurricane Andrew. Since that time the Company has grown to be one of the largest specialist writers in the catastrophe reinsurance market.
Since its formation in 1993, a core strategic premise of the Company has been that an increased level of precision in the measurement and management of risk can be translated into a competitive advantage. • Improved measurement of underlying exposure and modeling of losses allows
underwriters to build a superior insurance portfolio, one that is less risky and/ or more profitable than that of peers.
• Improved measurement of financial risk allows management to make more efficient use of capital, leading to superior returns on that capital.
The Company has developed systems and processes to support and implement this premise. Taken as a whole, these are used to facilitate ongoing dynamic financial analysis (DFA) of the enterprise. Perhaps most importantly, dynamic financial analysis activities are not restricted to technical staff operating apart from management. DFA has been integrated directly into the ongoing underwriting and financial management processes of the Company. Every senior manager is trained on the use of the system: thus, it is a practical and immediate resource for decision making.
The development of these capabilities has been a collaborative effort between the Company and an actuarial consulting firm (hence this co-authored paper). In addition to the authors, who co-led the development effort, many other people in both organizations contributed to the conceptualization, design, programming, and testing of the system.
Development of the system and its modeling capabilities is an ongoing activity; its design continues to evolve as experience with its use develops. Initially, the model was relatively simple, and focused only on measuring the principal risks facing the Company. As confidence in the model has grown, new features and additional risk components have been added. While this paper generally describes the model as it exists today, a few features are described that are tinder active development at the time of this writing, with the full expectation that they will be on linc by the time of publication. A major goal of current development activity is to integrate the various components of the system more completely, strengthening the linkages between the risk elements in the process.
Finally, while the output exhibits presented in the paper are illustrative of those actually produced by the model, they are stylized versions of that output, and use figures that have been altered. The exhibits are included only to illustrate the varied uses of the model, and represent only a small sample of what has been produced. Many of the output exhibits, as well as the details of the systern's implementation, are considered proprietary by the Company (key parts of the system are copyrighted). In preparing this paper it has been necessary to balance those interests against the goal of providing readcrs of the paper with useful insight into the structure, capabilities, and uses of the system.

AN INTEGRATED DYNAMIC FINANCIAL ANALYSIS 341
The paper has four major sections: • Section I provides an introduction and overview. • Section 2 begins by describing the risk framework that was developed to guide
the development of the model. The various types of risks facing an insurer are outlined and defined. The approach taken to evaluate the tradeoff between risk and return is then described.
• In Section 3, the structure of the dynamic financial analysis model is presented. This includes a system schematic and a description of the various inputs, variables, and calculation steps.
• Finally, in Section 4 the uses of the model are described and the output is illustrated.
Two appendices are included. The first provides a discussion of currency risk, which is present on both the asset and the liability side of the multinational insurer's balance sheet. The second provides a brief description of the expected policyholder deficit, a concept that is particularly relevant to the measurement of insurer risk and to the management of capital.
2. CONCEPTUAL FRAMEWORK
A necessary first step in the development of a dynamic financial model is establishing a conceptual fi 'amework to serve as a guide. The structure of the risks to be modeled must be defined in general, and then prioritized on the basis of the business profile of the company. Appropriate measures of risk must also be defined, and threshold values for the risk measures must be chosen.
2.1. Classification of Risk
The risks faced by an insurance enterprise have been classified in a variety of ways in the published literature on the subject. For example, see HARTMAN, et. al. (1992). There are three basic elements of risk, each of which must be considered in a dynamic financial analysis model. The three basic elements are: I. Liability Risk: the risk that the cost of settling the insurance liabilities will be
greater than expected (also referred to as obligation risk). • Claims on coverage already provided cost more to settle than anticipated. • Cost of claims generated on future coverage is greater than anticipated.
2. Asset Risk: the risk that the realizable value of assets will be less than anticipated, • The market value of invested assets declines. • Invested assets become non-performing. • Receivables from outward reinsurers become uncollectable. • Receivables fi'om customers become uncollectable.
3. Business Risk: the general business risks faced by all enterprises. • Competitors will force market prices below costs to preserve their position/
share. • Competitors will gain a competitive advantage, taking customers away.

342 STEPHEN P. LOWE, JAMES N. STANARD
I Regulators or legislators will interfere in the market in a harmful way. • The company will be victimized by a crime. • Operations will be adversely affected by a disaster at company premises.
The bullet points above are intended to be illustrative of the types of risks included in each element; these lists are not necessarily exhaustive.
As will be seen, the Company 's dynamic financial analysis model is structured around this risk framework, explicitly incorporating each of these three major risk elements.
2.2. Liability Risk
Liability risk (or obligation risk) is viewed as the predominant risk element by most property/casualty insurers. As indicated, it includes existing claim obligations (whether known or not) on coverage provided in the past, as well as new claim obligations arising from future coverage provided on policies currently in force or written in the future. From the perspective of the actuary, liability risk includes what may loosely be referred to as reserving and pricing risk. It is the actuary's responsibility to estimate the cost of claims in each of the two contexts. Liability risk stems from the uncertainty of those estimates.
In the definition of liability risk, cost is expressed in terms of present value. Liability risk inclt, des the timing of the claim cash flows, as well as their nominal amounts. It also includes the expenses of settling the claims, as well as the claim payments themselves.
Uncertainty of liabilities includes both process risk, which arises from the random nature of claim events, and parameter risk, which arises from the inability to know the claim frequency and severity distributions from which the events are drawn. These distributions cannot be known in advance, because they are dependent on future social and economic conditions that cannot be predicted with certainty.
For most lines of insurance, a company can write sufficient volumes of business to diversify away process risk. In these cases parameter risk will be the dominant component of liability risk, with process risk considered de minimis. However, in property catastrophe reinsurance process risk is not diversifiable by volume. Even on a world-wide market basis the covered events are too few to achieve a stable annual result. (We will have to wait for the market to expand to include a few other worlds beyond earth to achieve diversification by volume.) For this line, both process and parameter risk must be accommodated in a dynamic financial analysis model.
Finally, a complicating factor for an international insurer is the issue of currency. Insurance contracts are typically issued with claims to be settled in a specific currency, typically the local currency of the contract. However, from the perspective of the owner, claim costs are ultimately measured by their impact on equity as measured in the owner's currency. Thus the cost of liabilities includes

AN INTEGRATED DYNAMIC FINANCIAL ANALYSIS 343
the cost of converting them from the local contract currency to the owner's currency, and liability risk includes movements in exchange rates that affect conversion costs.
2.3. Asset Risk
By definition, assets are capable of generating an expected positive cash flow. The positive cash flow may be contractual (e.g., a bond), or may stem from the potential sale value in the market (e.g., home office real estate). Asset risk deals with the uncertainty associated with the realization of the cash flow. This uncertainty stems from two fundamental sources. One is the risk of non- performance of the obligor, such as the default of a bond or the insolvency of a reinsurer. The other is a change in conditions that affects the value or performance of the asset. Examples of the latter would include a recession causing a decline in the stock market, or a rise in mortgage interest rates that lowers the rate of refinancing on a Collateralized Mortgage Obligation.
The inclusion of reinsurance recoverables with asset risk aligns the risk classification structure with contemporary GAAP thinking, and not with traditional U.S. statutory accounting where the financial presentation suggests that obligation risk be measured on a net basis.
As is the case with liabilities, much of the risk associated with individual assets is diversifiable. Thus the movement of individual stock prices or the default of individual bonds is not usually relevant to asset risk, unless the individual holding is material. Instead the primary focus is on the non-diversifiable components of risk associated with each asset class.
Asset risk also has a currency dimension. To the extent that assets are held in currencies different from that of the owner, changes in exchange rates contribute to asset risk. The influence of currency on asset and liability risks is discussed more fully in APPENDIX A.
2.4. Business Risk
General business risk has been given relatively little attention in the actuarial literature. This is unfortunate, because it is a significant source of risk in insurance. Business risk contributes significantly to underwriting risk in ways that cannot be described by simple random processes. Severe underwriting losses at the bottom of the U.S. property/casualty underwriting cycle are neither random nor unforeseen events. They aren't caused by claim costs being higher than expected (i.e., by liability risk), but rather by market price levels being set below the level of expected costs. During a down-cycle many companies are aware that their prices are too low and that underwriting results will be poor.
A variety of forces acts on price levels in the insurance marketplace, most notably the level of overall capacity in relation to demand. Prices will fall when capacity exceeds demand, and will rebound only when capacity is withdrawn. The

344 STEPHEN P. LOWE. JAMES N. STANARD
operation of these forces depends on the structure of the market and external conditions at the time. External economic conditions can play a reinforcing role, particularly such factors as the level of interest rates.
Competitive position is also important to the business risk of individual companies operating within the market. One example would be the cost of distribution. Companies with a high-cost distribution system should not expect to achieve adequate returns, unless that distribution system offers enough value to them or their customers to warrant its excess cost. In a competitive market, the companies with the lower distribution costs will simply set the market price at a level that produces sub-par returns for their high-cost competitors.
Competitive advantage is not only about distribution costs. It includes the effectiveness of the company 's marketing, underwriting, claim, and capital management functions. While the overall industry results over the last few years have generally been lackluster, many individual companies have produced attractive returns during this period by superior execution in one or more of the above areas. Conversely, the disappearance of several national multiline companies over the same period can be attributed to their inability to perform successfully in these areas. Competitive risks are both significant and real in this industry.
Business risks arising from market competition are not at all unique to insurance. One only has to look as far as the U.S. airline industry to witness the same risks playing themselves out in a non-insurance context. There, too, an excess of capacity in relation to demand has forced a blood-letting as competitors vied to retain market share. Airline managements knew that fares were inadequate, but market forces were beyond their control.
From a dynamic financial analysis perspective, the authors believe that underwriting risk must be broken down into business risk and liability risk components, with each component modeled separately. While the two types of risk are not entirely unrelated, the drivers of each are different. Modeling them as a single risk (i.e., modeling underwriting risk via loss ratios) is therefore an inherently weak approach.
2.5. Measuring Risk and Return
Application of dynamic financial analysis requires that financial constraints be delined. For example, while the results of an analysis might indicate that there is an x% probability of impairment, defined as the loss of y% or more of capital, those results alone do not tell management what actions to take. To translate analysis results into action, management (or the board of directors) must decide whether or not the indicated level of impairment probability is too high. Also, while impairment probability might be an appropriate constraint, it is probably not the only constraint relevant to the enterprise. In fact, a variety of constraints are relevant, depending on the question the analysis is designed to answer.

AN INTEGRATED DYNAMIC FINANCIAL ANALYSIS 345
Dynamic financial analysis also requires the definition of financial performance objectives. I f a reinsurance program were offered to the company that reduced its probability of impairment from xl% to x2%, management can only judge the benefit of that reduction in relation to the cost of the reinsurance. This issue becomes particularly relevant when there are several alternative reinsurance programs, each with different ruin reductions and different costs. The issue is further complicated when the cost of a particular program is variable, or when its effects are spread into several future accounting periods in a multi-year deal.
In developing its dynamic financial analysis model, the Company has adopted the Asset/Liability Efficient Frontier (ALEF TM) as a basic framework for resolving these issues in a logically consistent manner. ~ (Additional discussion of ALEF can be found in BUFF (1990) and DOLL, et. al. (1994).)
The efficient frontier concept is taken from modern portfolio theory, and is attributed to MARKOWITZ (1959). In its most basic formulation, the investor is presented with several alternative classes of assets in which he can invest. For each class of asset, the investor knows the expected return, the risk associated with that return (as measured by its standard deviation), and the correlation of returns with all other classes of asset. His problem is to choose a portfolio by specifying the mix of assets by class. Markowitz 's contribution was to recognize that not all asset mixes are optimal: alternative mixes can be found for which either a higher return can be achieved for the same level of risk, or the same return can be
UJ
B C
Current Portfolio
Risk = Standard Deviation of Return
FIGURE I: In the classical efficient frontier of Modern Portfolio Theory, asset mixes A, B, and C are efficient; the asset mix of the current portfolio is not,
ALEF is a registered service mark of Tillinghast - T o w e r s Perrin.

346 STEPHEN P. LOWE, JAMES N. STANARD
achieved for a lower risk. There is, however, a frontier to the set of possible asset mixes consisting of those portfolios that are efficient in the sense that one cannot improve upon them. Figure I illustrates these concepts.
The investment portfolios on the efficient frontier are all good choices; choosing among them is a matter of the investor's risk/return preferences.
ALEF is a generalization of the efficient frontier to the optimization of more general business strategies. The definition of both of the two axes in the chart above are generalized. In the ALEF approach the X-axis is labeled generically as "level of risk" and the Y-axis is labeled generically as "expected performance".
W
//__,... Level of Risk
FIGURE 2: Usil~g the Asset/Liability Ellicicl~t Frouuer, StrategLes ca~ be evaluated in a generalized risk/reward framework.
The user must define each of these terms. Similarly, the strategies to be analyzed are generalized from asset mix to any set of decision variables relevant to the enterprise. Once the problem is specified in these terms, the dynamic financial analysis rnodel call be used to find the efficient frontier from the available choices.
In contrast to the classical efficient frontier objective, in which performance is measured exclusively by single-period economic returns, the ALEF performance objective can be any financial or economic measure that management believes is most important, or any combination of such measures. Generally, the measure should be consistent with the maximization of shareholder value, but it can be reflective of any specific component (such as reported profits, change in statutory surplus, or revenue growth). In the case of multiple measures, management must specify the relative weight assigned to each so that they can be combined into a single index. (The function combining the measures need not be linear.) The

AN INTEGRATED DYNAMIC FINANCIAL ANALYSIS 347
measures can be based on economic or accounting values, since both are relevant to the operation of the enterprise. The measures can be expressed in terms of absolute dollars, returns in relation to capital employed, or relative performance when compared to peers. Finally, the measures can reflect any chosen time horizon.
The only overriding requirement of the performance measure used is that it must be consistent. Management must always want to choose the strategy that maximizes the measure's expected value, all other things being equal.
As a measure of risk, standard deviation has been the subject of ample criticism. Much of this criticism stems from the fact that standard deviation focuses only on the dispersion of the outcomes, without any special recognition of the greater disutility of the adverse outcomes. While most people equate risk with uncertainty of outcomes, they also equate risk with the likelihood and severity of adverse outcomes. In the ALEF framework, risk can be any measure of adverse outcomes that management feels is most relevant. Examples would include: • Probability of ruin over the next ten years • Probability of combined ratio above 110% next year • Expected policyholder deficit ~ on current business • Probability of suffering a net decline in surplus of 20% or more in three years • Probability of failing an RBC test at any point in the next five years • Probability of a ratings downgrade by A.M. Best • Probability of a combined ratio two points or more worse than the industry
average • Probability of revenues being 25% or more below plan.
As was the case with the measure of performance, several different measures of risk can be combined to produce an overall index of risk, with weights reflective of their relative importance. Figure 2 illustrates the generalized ALEF frame- work.
ALEF is a powerful and flexible tool for managing an insurance company. It can be customized to mirror the business philosophy of the company, both the financial objectives to be maximized and the risks to be controlled.
The Company uses the ALEF framework in conjunction with its dynamic financial analysis model to evaluate a variety of strategic issues. The Company has developed a vector of multiple risk constraints that collectively capture its appetite for risk. This vector is used consistently in each analysis. While the types of strategic issues analyzed are discussed in subsequent sections of the paper, the Company considers its risk constraint vector to be confidential.
3. DESCRIPTION OF THE MODEL
A conceptual schematic of the Company 's dynamic financial analysis model is presented in Figure 3. The model consists of the following basic components:
Appendix B provides a description of the expected policyholder deficit ,and discusses its `application in this context.

348 STEPHEN P. LOWE, JAMES N. STANARD
• A liability scenario generator, which produces distributions of aggregate underwriting results for the insurance portfolio.
• All asset scenario generator which, when combined with the liability generator, produces a distribution of operating results for the combined insurance/ investment portfolio.
• A multi-period financial model, which extends the distributions over a longer time horizon.
Each of these components produces dynamic output that is used to manage different aspects of the business.
As can be seen from the schematic, the model is not a single system, but a linked set of programs and databases that can be used in a variety of combinations to facilitate the needs of any given analysis. A key attribute of this structure is flexibility. While the core calculation engines are written in high- order programming languages to achieve efficiency, many of the inputs and outputs of each component are held in spreadsheets to facilitate their manipulation "on the fly" by the user. The spreadsheets also facilitate the creation of graphical output for analysis of results.
3.1. Liability Scenario Generator
Because the Company ' s core business is property catastrophe reinsurance, a heavy emphasis is placed on detailed modeling of the volatile claim experience inherent to that line. The models are used extensively in the underwriting of individual contracts. In the context of this paper, however, the focus of presentation is on their use as an input to the enterprise-level DFA model. Tile advantage of this tightly integrated approach is that the effect of any one underwriting decision on the key corporate DFA objective functions can be easily determined by the underwriter, and therefore taken into account at the point of decision in the underwriting process.
For each peril in each region of the world a set of catastrophic events has been developed. The events vary according to their location, size, and intensity as well as to tile ensuing insured damage they would generate. Relative probabilities are also assigned to each event in the set, based on the likelihood of that particular combination of event parameters occurring at once. The probabilities for each set of events sum to one. in conjunction with the insured losses associated with each event, they represent a sample severity distribution for the particular peril. Similarly, for each peril in each region a frequency distribution is specified, reflecting the likelihood of a given number ofevents happening within a year. For example, a frequency distribution is specified for the number of landfall hurricanes hitting the U.S. over the course of a season.
Within the system, the frequency and severity distributions for each peril are convoluted to produce annual aggregate catastrophe losses. In the current configuration, 40,000 scenarios of annual losses are created, which are deemed

AN INTEGRATED DYNAMIC FINANCIAL ANALYSIS 349
sufficient for analysis purposes. (The sampling process is stratified, not Monte Carlo, so that the tails of the resulting aggregate distribution are considerably more robust.)
Catastrophe II Peril Events Frequencies
I I
1 Annual
Catastrophe Loss Scenarios
Annual Non-Cat~trophe
Scenarios Contract Terms
I
Annual Underwriting
Result Distributions:
Primary Industry Reins. Industry
Company
Economic & Asset
Scenarios
1 Portfolio
Mix
Annual Operating
Result Distribution
Market Behavior
Rules
Company Response
Rules
Multi-Period Return
q Distribution
FIGURE 3: Conceptual Schematic of the Dynamic Financial Analysis Model

350 STEPHEN P. LOWE, JAMES N. STANARD
At this juncture in the system, the losses in each scenario are those of the primary ceding company. The primary losses are then run through the applicable reinsurance contract terms to obtain the corresponding losses to the reinsurance contract. A database containing the actual terms of all catastrophe reinsurance contracts in the portfolio is maintained, so that world-wide aggregate under- writing results for the entire portfolio for each scenario can be obtained and analyzed. The system is on-line, so that portfolio results can be obtained at any time. A complete portfolio run takes about two hours to process through the system on a Silicon Graphics workstation. Analysis of the marginal impact of adding a contract to the portfolio takes less than five minutes. In addition to ongoing ad hoc portfolio analysis, portfolio results are produced and analyzed in detail in a formal underwriting meeting each quarter, after the latest cycle of contracts have been written.
The Company writes small amounts of other types of reinsurance from time to time, which are incorporated into the system using a less formal modeling approach. A spreadsheet containing the estimated underwriting distributions applicable to this business is maintained, and is incorporated into the overall results as a "'last step" in the overall process. This assures that the complete underwriting portfolio is modeled within the system.
The principal output of this component of the system is a distribution of underwriting results for the Company. The distribution reflects all elements in the underwriting result that vary directly with losses: reinstatement premiums, losses, brokerage, and federal excise taxes/premium taxes.
These elements are calculated on a contract-by-contract basis, reflecting the actual applicable terms and conditions. Other elements such as operating expenses may be added as a last step in the process.
In addition to Company underwriting experience, supplemental industry-wide information is produced showing the corresponding losses for the primary industry and the estimated portion of those losses that would be ceded to the property catastrophe reinsurance industry.
Since the Company 's functional currency is the U.S. dollar, all transactions relating to contracts involving other currencies are converted to their U.S. equivalent. Within the system, exchange rates can be varied to test the impact of adverse movements on underwriting results.
Each of the underlying catastrophe events has an associated day of the year. Thus, each underwriting scenario generated by the model has a pattern of losses throughout the year. At the present time, the models do not consider the variability in the timing from event occurrence to claim payment. Such risk is considered fairly immaterial. Neither is there any consideration of "reserving risk", in the sense that actual payments might be greater than estimated in the financial statements.
Parameter risk is not explicitly included within the modeling process itself. Instead, the parameters are sensitivity-tested in a variety of ways and the results are used to introduce conservatism into the final parameter assumptions. These sensitivity tests take two forms:

AN INTEGRATED DYNAMIC FINANCIAL ANALYSIS 351
• First, output can be generated using event files created by different vendors. In addition to developing its own event files for various perils and regions, the Company has developed relationships with many of the primary catastrophe modeling consultants, including Applied Insurance Research, RMS, Dames & Moore, EQECAT, and Tillinghast - Towers Perrin. Event files have been constructed and incorporated into the system using the catastrophe models developed by these firms. Comparing the results generated by these different event files, reflecting the different approaches and assumptions of each firm, provides a measure of the impact of varying the underlying event parameters, and helps to assure that the results obtained are not dependent on the specific catastrophe model used.
• Second, sensitivity testing is performed by altering the underlying frequency and severity distributions. Results are routinely tested using higher peril frequencies. This is particularly relevant in light of the research being done by global climatologists (such as that published by GRAY (1990) and popularized in the media), and the record level of ht, rricane activity experienced in 1995. The generated peril severity distributions have also been adjusted to consider various factors such as the demand-driven inflation that occurred after hurricane Andrew.
Finally, results can be produced for the entire portfolio of reinsurance contracts or any defined subset. This facilitates analysis of sources of risk, and also can be used to analyze the value of potential retrocessions. Hypothetical portfolios can be run to test alternative underwriting strategies as well.
3.2. Asset Scenario Generator
The Company uses the Global CAP: Link system to obtain scenarios for various economic and investment variables for several different currencies. On request, a CAP:Link output file containing 1,000 scenarios is provided to the Company, with each scenario reflecting a future path of interest rates, inflation rates, currency exchange rates, and rates of return by asset class for each of five major currencies. Each scenario is a plausible path of the annual movement of the variables; taken together the scenarios describe the range of variation in each of the variables.
The CAP: Link system uses a stochastic diffusion model to generate economic and capital market scenarios on a global basis. Scenarios are generated on the basis of a cascading set of stochastic differential equations, structured so that the proper relationship between the modeled variables is maintained over time. These include serial correlation effects, reinvestment risks, and path volatility characteristics. The top of the cascade is a yield curve scenario generator, based on a variant of the two-factor yield model proposed by BrENNAN and SCHWARTZ (1982). These yield results are then passed down to generators for other variables such as inflation and stock returns, which are conditionally related in the cascade. The developers of the CAP:Link system believe that it is superior to other popular approaches such as Iognormal models, time series models based on ARIMA or

352 STEPHEN P. LOWE, JAMES N. STANARD
Box-Jenkens, or models based on Vector AutoRegression. A more detailed description of the stochastic diffusion model, and a discussion of its perforrnance relative to other models can be found in MULVEY and THORLACIUS (Forthcoming in 1997).
The asset scenarios from CAP:Link are convoluted with the liability scenarios. Each individual annual scenario consists of: • Economic conditions: annual inflation rates by currency and exchange rate
movements for the year • Capital market conditions: interest rates and annual rates of return by asset
class and currency • Catastrophic conditions: a set of catastrophic events and primary and
reinsurance industry losses ensuing from those events. The Company underwriting result distribution is combined with investment results reflecting the cash flows and investment returns for each scenario, so that an annual operating result distribution for the Company can be obtained. Note that both the liabilities and the assets are dynamically adjusted for changes in exchange rates. The operating result distribution can be produced either for the current mix of investments, or for any hypothetical alternative mix (as well as for different insurance portfolios). This facilitates the testing of alternative invest- ment portfolio strategies, including the mix of investments by currency.
At the time of writing, the catastrophe losses at the detailed scenario level are not dynamically linked directly to the economic scenarios (hence the dotted line in the schematic diagram). This is an enhancement that is currently under development. Once it is completed the losses will vary according to the inflation rates in each scenario.
3.3. Multi-Period Model
Up to this point, the description of the model has focused on the short-term, annual time horizon. The liability and asset legs of the model focus on annualized results in the context of the current business environment. The multi-period model extends the analysis to a longer-term horizon (currently five years) and introduces key elements of business risk into the analysis. Underwriting results in future periods will be influenced by loss experience (liability risk) and market price levels (business risk).
The first step in this process is to encapsulate the behavior of the market in a set of rules. The critical question is how market price levels will move over the five-year time horizon, and what factors will affect that movement. In this area the Company has an advantage over the large multiline insurers, for whom this would be a vast and daunting question. Such insurers would need to specify the market behavior and drivers for each product line they offer in each market, as well as the interrelationships across the different product lines and markets. In the Company 's case only one product line and market, property catastrophe reinsurance, must be addressed.

AN INTEGRATED DYNAMIC FINANCIAL ANALYSIS 353
The fundamental behavior of prices in the property catastrophe reinsurance market can be stated succinctly. • If results are good, prices will decline from their current level. • Prices will continue to decline until results are poor, at which point they will
rise. • The rate of decline is related to how good the results are; the rate of increase is
related to how poor results are. • Rises in prices include nominal increases in rates-on-line, and also implicit
increases through higher retentions and other coverage reductions.
Since the market has exhibited this general behavior over an extended period, it is reasonable to assume the behavior will continue. The difficult part of the problem is translating the qualitative behavior rules into quantitative terms. While the historical responsiveness of prices to results can serve as a guide, changes in the market's structure that influence its behavior must also be considered. For example, one could argue that the new capital provided to the reinsurers in Bermuda may be less forgiving, and will be withdrawn more rapidly, if and when results are bad. Similarly, the growing use of catastrophe models by the reinsurers in underwriting may inject a greater degree of discipline, reducing the rate of price decline in the face of favorable results.
The approach taken by the Company is to relate catastrophe reinsurance price levels in each subsequent year to the industry-wide catastrophe experience in several preceding years. A market price index has been constructed, the movement of which is dependent on emerging industry experience. The market price index is based on information from several sources: the actual price movements observed by the Company since its formation; historical price movements over a longer time period, derived from information from several sources; discussions with brokers and other experts in the market; and judgment.
The responsiveness of price levels to experience over several years involves significant parameter risk. The Company has performed in-depth sensitivity testing of this element of the model to gain insight into how alternative assumptions influence results.
The starting point in the multi-period simulation is the current distribution of annual underwriting results. Using a Monte Carlo approach, a first-year scenario with the associated underwriting result for the Company is chosen from that distribution. On the basis of the corresponding industry-wide result, the movement in the price level index for year two is determined. The annual underwriting result distribution is then modified to reflect the effect of the change in price level to obtain a distribution for the second year. A second-year result is then chosen from the modified underwriting result distribution. This stochastic process continues until five years of results have been generated.
In addition to the market behavior rules, company response rules reflecting the actions of Company management must also be defined. These actions fall in three areas. • Market share actions must be defined, reflecting the Company's willingness to
write business at the prevailing price level. Depending on the perceived

354 STEPHEN P. LOWE. JAMES N. STANARD
adequacy of prices, the Company will either seek to grow, hold steady, decrease, or severely reduce its market share. This decision feeds back into Company results as follows: the price level on the Company 's portfolio relative to the market price level improves/degrades as the Company 's market share declines/grows, due to more/less selective underwriting.
• Capitalization actions must be specified, reflecting the changing needs of the Company over time. For example, at some threshold level a portion of excess capital is returned to shareholders. Similarly, if actual capital falls below specified requirements, market share is forced down to the level allowed by the requirements. Both normal and extraordinary dividend policies must be defined.
• Debt/capital levels over the five-year period must be specified, and debt actions in relation to operating losses must be defined.
The multi-period model starts with an opening balance sheet, simulates the underwriting result for the first-year, translates that result into a first-year operating result, determines the market behavior for the next year, and implements the company responses. This process continues iteratively until the full five years have been generated. Typically, 20,000 trials are run to produce a distribution of five-year returns to shareholders, which is based on the stream of dividends and the final equity at the end of the fifth year. In addition to return measures, appropriate risk measures are also generated. The model can be run using different company response strategies; the risk and return associated with each strategy can be compared by placing it in an ALEF context.
The multi-period model successfully captures the liability and business risk elements which, taken together, comprise underwriting risk for a property catastrophe reinsurer. Other types of business risk, such as regulatory interference or fraud, are not directly incorporated into the model.
4. MODEL USES AND SAMPLE OUTPUT
One of the key advantages of a highly integrated system such as the one described is that many different types of decisions can be tested against a consistent risk/ return "yardstick", which is based on a common set of underlying probability distribution assumptions. These include: • Ongoing evaluation of the adequacy of capital to support the current risks
undertaken • Evaluation of the value of retrocessional coverage offerings • Analysis of alternative capital structures • Development of asset mix investment policy • Analysis of currency risk • Studies of alternative market and underwriting strategies • Individual underwriting decisions reflecting the marginal effect of a given
contract on risk and return constraints. Exhibit I is an example of output from the liability scenario generator. It shows graphically the right-hand tail of an underwriting result distribution for a

AN INTEGRATED DYNAMIC FINANCIAL ANALYSIS 355
98.93%
98.98%
99.03%
99.09%
99.15%
99.20%
99.26%
99.32%
99.37%
99.42%
99.47%
99.53%
99.59%
99.64%
99.70%
99.75%
99.80%
99.85%
99.90%
99.95%
100 O0%
i
. =
0
m
EXHIBIT I

356 S T E P H E N P. LOWE, J A M E S N. S T A N A R D
Worldwide Portfolio as of xx,xx,xxxx Based on Peril/Assumption Set 23
I I Return I ] Industry Portfolio Description Interval Peril Loss Gross Loss
(billion) (million)
] Slortheast/NY l/xxx H xxx xxx '",nheast/MA llxxx H xxx xxx
I / x x x H x x x x x x
~ . ~ I / x x x H xxx xxx
• 1 I/xxx H xxx xxx '-,~t H x x x x x x
- . -x x x x
]South CA I
Ir~o.h CA I I . . [South CA [ I/XXX North CA I/xxx E [New Madri~JTN I/xxx E x^.. New Madrid/MO I/xxx E xxx I Hawaii l/xxx H xxx [ xxx
JNorthwest/WA l/xxx E xxx xxx
N Europe/UK IN Europe/UK iN Europe/GER N Europe/GER Japan Wind lapan Wind lapan Quake lapan Quake Australia New Zealand Caribbean
Northrid~,e/CA Lama Priet,JCA Great NE Hurricane/NY Andrew/FL 'Hu~,c/SC
llxxx W xxx xxx I/xxx W xxx xxx l / x x x W x x x x x x
I/xxx W xxx xxx I/xxx H xxx xxx I/xxx H xxx xxx I/xxx E xxx xxx llxxx E xxx xxx I/xxx H xxx xxx I/xxx E xxx xxx I/xxx H xxx xxx
P0A - Daria/Europe ~0G - Vivian/Euro~ ~OD - Herta/Europe 87J - StormY[Europe 76B - Capella/E.urope Vl i r ie l le /Japan
~4ew Castle/Australia
llxxx E xxx xxx llxxx E xxx xxx llxxx H xxx xxx llxxx H xxx xxx ]/XXX H xxx xxx I/xxx W xxx xxx l/xxx W xxx xxx ]/XXX W XXX XXX []XXX W XXX XXX I/xxx W xxx xxx llxxx H xxx xxx I / x x x E xxx x x x
E X H I B I T 2

AN INTEGRATED DYNAMIC FINANCIAL ANALYSIS
US Primary and Retro Business Inforce Date - xx,xx,xxxx
O c c u r r e n c e D i s t r i bu t ion
357
O c c u r r e n c e
Z o n e o f Even! Problbl l l l le~
90.0% 95.0% 99.0% 99.6% 99.8% 99.9%
Eastern New England xxx xxx xxx xxx xxx xxx
Eastern LI & C T xxx xxx xxx xxx xxx xxx
----..........~h," m NJ xxx xxx xxx xxx xxx xxx
xxx xxx xxx xxx xxx xxx xxx xxx xxx xxx xxx xxx
• " xxx xxx xxx xxx xxx "'* xxx xxx xxx xxx
--~ xxx xxx xxx
• * xxx xxx
Hawaii x^..x^..
National Occurrence xxx
Wind Storms xxx xxx xxx xxx xxx ^~.. Em~hfluake xxx xxx xxx xxx xxx xxx /
National Aggnrgale xxx xxx x..,, .x xxx xxx xxx
Share o f M a r k e l Loss
P r / n m r y |ndu.slry Zone of Even! Markel Share
90.0% 95.0% 99.0% 99.6% 99.8% 99.9 c,
Eastern New England x.x% x.x% x.x% x.x% x.x% x.x ~, " " -~ LI & CT x .x% x .x% x .x% x .x% x x% x.x °,
x.x% x.x% x.x% x.x% x.x% x.x ~, x.x% x.x% x.x% x.x% x.x% x.x(; x.x% x.x% x.x% x.x% x.x% x x~ x.x% x.x% x.x% x.x% x.x% x.x ~,
x.x% x.x% x x% x.x% x.x c, x.x% x.x% x.x% x.x~
I ~ x.x% x.x% x.x~
Nonhero Plains & c.,,,~"----............__ Nonhwcsl Northern Calif(wnia Somhem California Hawaii x .x~ ~ L
National Occurrence x.x% x.x% x.x~,,
Hurricane x.x% x.x% x.x% x.x% x.~ ,, Wind Storms x x% x.x% x.x% x.x% x.x% x.^. Earthquake x.x% x.x% x.x% x.x% x.x% x.x c,
EXHIBIT3

358 STEPHEN P. LOWE. JAMES N. STANARD
Operating Profit Distribution Impact of Shifting to 10% Stock Asset Mix
0
2. £ ._ -- ~ : . . ~ . . . : . . J Asset Mix w/ Stocks . . . . . .
. . . . . . . . . . . . . . . . . . . . . . . . . . . . . . . . . . . I .
I
I . . . . . . . . . . . . . . . . . . . . . . . . . . . . . . .
I I
2 5 % 5 0 % 7 5 % 100%
P e r c e n t i l e
EXHn3rr 4
portfolio. As indicated previously, this information (along with accompanying risk and return statistics) can be generated for any vendor/peril scenario, and any segment of the portfolio of reinsurance contracts.
Exhibit 1 is a relatively simple graphic, but when it is coupled with the risk/ return measures it is a powerful management tool. For example, distributions can be generated with and without a retrocessional cover that is being considered. Comparison of the two allows management to evaluate the marginal impact of the cover on underwriting risk and return, and ultimately to assess the value of the cover. Alternatively, reinsurance accounts that have a particularly detrimental impact on the distribution can be isolated for potential re-underwriting at renewal.
Management can also track changes ill thc distribution over time, as a measure of underwriting performance.

AN INTEGRATED DYNAMIC FINANCIAL ANALYSIS 359
Expected Annual Return on Surplus Employed
(Worldwide Portfolio As of Date 400/0 . Shown)
35% • All figures 30% - m are illustrative
I m I l mmm | 1 5 % h ~ - m - m - ~ - -
0 % ' , ', . . . . ', [ l . . . . ,
C o m p a n y "XYZ"
EXHIBIT 5
A variety of routinely produced diagnostic exhibits allows management to gain insight into the sources of adverse underwriting scenarios: perils, regions, reinsurance layers, etc. Comparative information on primary and reinsurance industry losses is also included. Exhibits 2 and 3 are illustrative of these types of exhibits.
Exhibit 2 displays industry and portfolio experience on a standard defined- event set. The defined events reflect a range of different likelihoods for various perils and regions. (The "break" in the exhibit indicates that it is longer than actually shown; only the beginning and end of the exhibit is shown in the illustration.) Exhibit 3 displays percentiles of severity distributions for the portfolio by (illustrative) geographic zone, and the Company' s share of the industry loss at that percentile.
In addition to underwriting profit distributions, operating profit distributions reflecting investment as well as underwriting risk are produced by the model, such as those shown on Exhibit 4. These can be used to translate underwriting risk into operating profit terms, or to test the effect of introducing various levels of asset risk via changes to the mix of investments.

360 STEPHEN P. LOWE. JAMES N. STANARD
Multlperlod FTnanclal Planning Model Expected Operating Performance by Strategy Baseline Market Behavior Assumption
Operating DebtJCapltal Company Reslx~nse Leverage: 50% Ratio: 0% To Market: Modest
Year I Year 2 Year 3 Year 4 Year 5
Written Premium 191 207 209 210 170 Net Operating Profit 120 129 126 124 g8 Diwdonds 16 60 73 176
Surplus 381 486 555 608 556
Operating Oebt/Cap41al Company Response Leverage: 50% Ratio: 30% "To Market: Mzxiast
Year 1 Year 2 Year 3 Year 4 Year $ Written Premium 190 207 211 214 180
Net Operating Profit 110 114 110 107 84
Dividends 35 56 64 129
Surplus 381 489 572 638 608
Operating Oebt/Capztal Company Response Leverage' 65% Ratio: 30% TO Market: Modes1
Year 1 Year 2 Year 3 Year 4 Year 5
Wdtten Premium 267 290 295 302 270
Net Operating Profit 153 158 152 148 123 Dividends 70 94 87 131
Surplus 381 501 594 687 714
Op~mlLng Oebt,/C~pit e,I Gomp~.ny Re ~,o~,,~ Leverage: 80% Ratio' 30% To Markel' Modest
Year 1 Year 2 Year 3 Year 4 Your 5 Written Premium 305 332 332 333 270 Net Operating Profit 177 181 171 158 138 DIvldon ds 89 113 111 131
Surplus 381 509 607 708 743
EXI-IJI~II 6
Many of the risk measures suggested in Section 2 can be translated into boundary constraints, reflecting their maximum level o f acceptability. For example, one possible risk measure is the probability of suffering a surplus decline of 20% or more. If that were a chosen risk measure, management would presumably seek to minimize that probability for a given level o f return, and would only be willing to accept an increase in that probability in exchange for a higher return. Management might also impose a boundary constraint that in no event will management allow that probability to exceed 3%.
One can invert the boundary constraint relationship to obtain an implied surplus requirement. For example, if the current annual operating profit distribution for a hypothetical company indicates that there is a 3% chance of

AN INTEGRATED DYNAMIC FINANCIAL ANALYSIS 36[
Multiperiod Financial Planning Model Asset Liablflty Efficient Frontier Baseline Market Behavior
50%
40%
E 300/0
i 2 0 %
10%
L
• K • J •1 R H e, • e O • • C
t O D • Ge ~ e p e e E
• A M
F
0% i I i 0.00/0 0.5% 1.0% 1.5% 2.00/0
Level of Risk
Operating Debt/ Dividend Response Strategy Leverage Capital Policy to Market
A 85% 20% Standard Level B 100% 20% Standard Level C 115% 20% Standard Level D 85% 40% Standard Level E 100% 400/° Standard Level F 115% 40% Standard Level G 85% 20% Standard Modest H 100% 20% Standard Modest I 115% 20% Standard Modest J 85% 40% Standard Modest K 100% 40% Standard Modest L 115% 40% Standard Modest M 85% 20% Standard Aggressive N 100% 20% Standard Aggressive O 115% 20% Standard Aggressive P 85% 40% Standard Aggressive Q 100% 40% Standard Aggressive R 115% 40% Standard Aggressive
EXHIBIT 7
su f fe r ing an o p e r a t i n g loss o f $70 m i l l i o n o r g rea te r , t hen the m i n i m u m r e q u i r e d
su rp lus f o r the c o m p a n y is $350 m i l l i o n . A t t ha t leve l o f su rp lus , i t w i l l be j us t
ins ide the b o u n d a r y c o n s t r a i n t .

362 STEPHEN P LOWE, JAMES N. STANARD
C o n t o u r M a p S h o w i n g I m p a c t o f V a r y i n g
Cap i ta l S t r u c t u r e o n Ri sk a n d R e t u r n
,: - ~ / "-.\55% • ~ 130% - ~0~
~ ~ -0 85% 120%
= ~ 0.60% ~ " 5% " ,
110%
• ,, ~, 1 0 0 %
: \ - . .
~a ", 0.10%
70% " ', Dot.ted.Lines are Ris 'L Sohd Lines are Return ] ~ . , . . , . 1 . . . . . , . . . . . . . , . . ~ I
60% I I I
0% 10% 20% 30% 40% 50%
D e b t / C a p i t a l R a t i o
EXHIBIT
The Company has established several such boundary constraints, and uses them to measure surplus employed on an ongoing basis, on the basis of the operating profit distributions generated by the model each quarter. This approach is not only directly useful in the capital management of the company, but also facilitates the measurement of expected returns on surplus employed. Exhibit 5 illustrates this type of information. In addition to Company results, the model generates the results for an "index fund" of a cross-section of the entire excess property catastrophe market (for certain regions) labeled as 'XYZ' , so that comparative performance can also be measured.
A variety of exhibits can be generated from the multi-period model, since it can be used to test so many different strategy variables: operating leverage, debt/ capital ratios, dividend strategies, and responses to changing market conditions. Exhibits 6, 7 and 8 are illustrative of the types of output generated by this analytic tool. Exhibit 6 shows the Company 's expected results as generated by the model for four sample strategies. In actual practice, basic exhibits like these have been generated for hundreds of alternative strategies and assumptions sets.

AN INTEGRATED DYNAMIC FINANCIAL ANALYSIS 363
Exhibit 7 is an illustration of an asset/liability efficient frontier for 18 different strategies, which are listed on the lower half of the exhibit. In this example, the Company is considering raising or lowering its operating leverage by 15% from current levels, varying its debt/capital ratio from 20% to 40%, and altering its response to changes in market price levels from '~modest" to either '~flat'" or "aggressive". While the exhibit is a highly stylized version of such an analysis, it is indicative of the approach actually taken.
Finally, Exhibit 8 is a supporting exhibit to Exhibit 7, showing the trade-off between risk and return associated with the operating leverage and debt/capital variables. Risk and return measures from the multi-period planning model have been used to construct a contour map for a range of values of each variable. The contour map shows how risk and return rise and fall in each region of variable values. (The actual contour lines are more involved than shown, with multiple inflection points.) To find an efficient frontier point, one follows a particular return line, looking for the region where the line also achieves minimum risk. Exhibits such as these are used as diagnostics in the efficient frontier analysis.
In addition to using different decision variables, the model is run with va ry ing assumptions to test how the resulting frontiers and contour rnaps are affected.
5. CONCLUSION
To make the dynamic financial analysis system described in this paper useful in the decision making process, a significant continuing investment is required in: • Maintaining the underlying databases current and error-free • Including all types of business and perils to which the company is exposed • Training all professional staff in the details of the model • Designing the system so that the DFA results are produced quickly, with easily
understandable output reports • Selecting employees and establishing a culture where decision making in this
framework is considered natural and practical.
The substantial investment in building and maintaining the system has clearly been justified - but only because of its usefulness in many of the practical decisions facing the company.
A final challenge is for employees using this admittedly complex system to develop good judgment as to how much weight to give its results in their actual decision making. This requires a thorough understanding of the theory and the practical details of the system, and an appreciation of the limitations and assumptions underlying the results. A good sense of how to weigh system results with unmodeled factors is the essence of the amorphous term "'underwriting judgment".
A C K N O W L E D G M E N T S
The authors would like to acknowledge specifically the significant contributions made by Jayant Khadilkar, Richard Rafferty; William Riker, and Cary Sparrow

364 STEPHEN P. LOWE, JAMES N. S T A N A R D
towards the development of the Company 's DFA system. These individuals toiled many late night hours fighting the "devil in the details" of the system.
The authors also want to thank Dr. Hans Bfihlmann for pointing out the early references to expected policyholder deficit in the German actuarial literature, and to Mark Scully for assistance in translation.
APPENDIX A - CURRENCY RISK
The Company is an international reinsurer writing contracts covering exposures in many different countries. Since it operates in multiple currencies, the resulting revenues, assets, and liabilities are affected by currency movements. It is instructive to observe the interplay of currency movements on asset and liability risks.
The measurement of performance and risk in the ALEF framework must take the perspective of the owner. While assets and liabilities may be held in a variety of currencies, ultimate returns and settlement costs must be measured in terms of their impact on equity, as measured in the owner's currency. For this reason, the Company ' s DFA model expresses all results in terms of U.S. dollars, reflecting gains and losses at the time of conversion as part of the cost or benefit. Specifically: • The cost of future claim liabilities includes the cost/benefit of converting them
to U.S. dollars at future exchange rates. • The benefit of future reinstatement premiums includes the cost/benefit of
converting them to U.S. dollars at future exchange rates. • The total return on non-U.S, investments includes the gains/losses due to
currency movements during the period. Thus, currency risk is treated as an embedded element of asset and liability risks, and not as a separate risk element.
If potential investors have a principal currency other than U.S. dollars, they may be interested in measuring risks and relurns from the vantage point of another currency. Since the Company 's stock is traded only on a U.S. exchange, the U.S. dollar perspective to risk and return in the model appears reasonable. Investors from outside the U.S. must overlay the risk/return associated with holding a U.S.-denominated asset to the risk/return as measured by the model.
International reinsurance contracts can pose particularly complex currency risk issues, for the following reasons. • The underlying exposures may be in one or several currencies. The primary
insurer will be paying claims in the local currency. It is even possible that the primary insurer could be paying claims from a single event in more than one currency (for example, French francs and Danish kroner).
• The reinsurance contract terms (i.e., retentions, Ihnits, e tc . ) may be in one or more currencies, poss ibly different f r o m the currency o f the underlying claims. In such an instance the contract may specify that underlying claims be converted, using a specified currency exchange rate or the rate prevailing at the time of the event.
AN INTEGRATED DYNAMIC FINANCIAL ANALYSIS 365
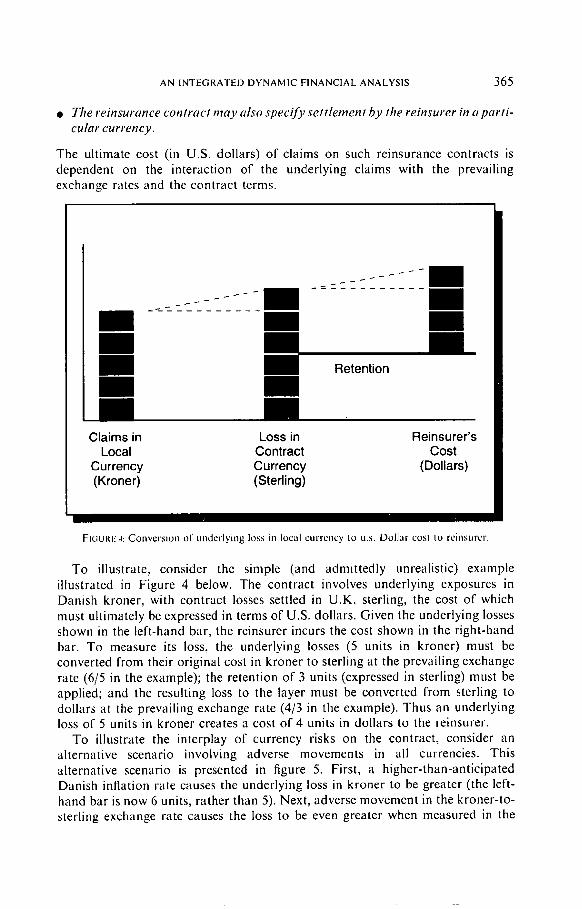
• The reinsurance contract may also spec i fy se t t l ement by the reinsurer in a p a r t # cular currency.
The ultimate cost (in U.S. dollars) of claims on such reinsurance contracts is dependent on the interaction of the underlying claims with the prevailing exchange rates and the contract terms.
l Claims in Loss in Reinsurer's
Local Contract Cost Currency Currency (Dollars) (Kroner) (Sterling)
FIGUI,U£ 4: C o n v e r s i o n ol" unde r ly ing loss in local c u r r e n c y IO u.s. Do l l a r cost to re insurer .
To illustrate, consider the simple (and admittedly unrealistic) example illustrated in Figure 4 below. The contract involves underlying exposures in Danish kroner, with contract losses settled in U.K. sterling, the cost of which must ultimately be expressed in terms of U.S. dollars. Given the underlying losses shown in the left-hand bar, the reinsurer incurs the cost shown in the right-hand bar. To measure its loss, the underlying losses (5 units in kroner) must be converted from their original cost in kroner to sterling at the prevailing exchange rate (6/5 in the example); the retention of 3 units (expressed in sterling) must be applied; and the resulting loss to the layer must be converted from sterling to dollars at the prevailing exchange rate (4/3 in the example). Thus an underlying loss of 5 units in kroner creates a cost of 4 units in dollars to the reinsurer.
To illustrate the interplay of currency risks on the contract, consider an alternative scenario involving adverse movements in all currencies. This alternative scenario is presented in figure 5. First, a higher-than-anticipated Danish inflation rate causes the underlying loss in kroner to be greater (the left- hand bar is now 6 units, rather than 5). Next, adverse movement in the kroner-to- sterling exchange rate causes the loss to be even greater when measured in the

366 STEPHEN P LOWE. JAMES N. STANARD
contract currency (the exchange rate has moved from 6/5 to 8/6). The increase is leveraged by the fixed retention (3 units of sterling in either scenario). Finally, adverse movement in the sterling-to-dollar exchange rate causes the U.S. dollar loss to the layer to be greater still (the exchange rate has moved from 4/3 to 7/5).
As a result of adverse movemnents in inflation and exchange, the reinsurer's cost has grown fromn 4 units of dollars to 7 units of dollars.
I"I
PII
Retention
I I
Claims in Loss in Reinsurer's Local Contract Cost
Currency Currency (Dollars) (Kroner) (Sterling)
FIGURE 5 Alternative scenario showing the impact of currency movements.
The example neatly divides the currency portion of liability risk into three components: inflation risk, which affects the magnitude of the underlying losses in their original currency; contract exchange rate risk, which affects the conversion of losses from original to contract currency; and settlement exchange rate risk, which affects the conversion of losses from contract currency to dollar terms. All three components need to be incorporated in the pricing and underwriting of reinsurance contracts.
The example is contrived and also unrealistic in its assumed exchange rates. In addition, the adverse scenario is particularly unrealistic in that purchase power parity would imply that an increase in kroner inflation would generally be expected to be associated with a favorable movement in the kroner-to-sterling exchange rate (the kroners would have less purchasing power, so it would take relatively fewer pounds sterling to buy them). Of course, the direction of movements in the illustration could certainly happen in the short run.
AN I N T E G R A T E D D Y N A M I C F I N A N C I A L A N A L Y S I S 367
A particularly strong feature of Global CAP:Link is its ability to model inflation and exchange rates between multiple currencies in a logical and consistent manner, so that unreasonable purchase power parity relationships are not created. Each scenario generated by the system is plausible, with variability in parity occurring over short intervals and a greater tendency towards parity over longer intervals. By integrating the CAP:Link scenarios into the generation of both the liability scenarios and the asset return scenarios, the overall risks posed by operations in multiple currencies can be managed.
While the illustration above describes the risks as working from left to right on the chart, in reality they work in the opposite direction. The Company must exchange U.S. assets for sterling to settle the claim. Some readers may question whether settlement exchange risk is real, and not created by currency mismatch. In other words, if the Company is holding some of its assets in sterling, it can settle the claims on sterling-based contracts without suffering any gains or losses due to exchange rate fluctuations by simply paying the claims out of its sterling funds. Thus, it might be argued that settlement exchange risk only exists to the extent that insufficient sterling assets to pay the claims are available.
However, the above line of reasoning confuses the existence of risk with its immunization. For liabilities that are fixed and certain, the Company can immunize itself against overall currency risk by holding a matched set of assets equal to the liabilities in the same currency. In such a case, any change in the exchange rate will cause the decline in asset value to be offset by an equal decline in liability value (both measured relative to U.S. dollars); conversely, an increase in asset value will be offset by an equal increase in liability value. Thus, although settlement exchange risk and asset currency risk are both present, they are negatively correlated, facilitating the immunization.
If liabilities in each currency were fixed, known anaounts, the minimum risk position would appear to be to hold funds in each currency sufficient to settle the liabilities. (This pre-supposes that no arbitrage opportunities exist and that the investment risks and expected returns are the same in each currency.) But when liabilities are uncertain as to anaount, timing, and currency, it is not quite so clear how to minimize currency risk. This is where effective modeling can be an invaluable tool.
APPENDIX B - RISK MEASURES AND THE EXPECTED POLICYHOLDER DEFICrF
In the ALEF framework risk can be any measure of adverse outcomes that management believes is most relevant to the enterprise. One such measure is the expected policyholder deficit (EPD), a term developed as part of the U.S. risk- based capital initiative and attributed to BUTSlC (1994). Since some readers may not have been exposed to the concept, a brief description is included herein.
All insurers face the possibility that, at some point in the future, their obligations may exceed their assets. The magnitude of this risk is a function of the asset, liability, and business risks faced by the insurer, and the level of capital held to support those risks. Insolvency risk has traditionally been measured in terms of

368 STEPHEN P. LOWE. JAMES N. STANARD
the probability of ruin. However, from the perspective of the policyholder this measure is insufficient because it fails to take into account the severity of the insolvency.
TABLE 1, taken from 8UTSJC, illustrates this point. In this simple example, two insurers have identical balance sheets. Each insurer has assets of $13,000, liabilities of $10,000, and capital of $3,000. Although the assets of each company are certain, the liabilities (unpaid claims) are uncertain, subject to the probability distributions shown.
TABLE I
CALCULATING THE EXPECTED POLICYHOLDER DEFICIT
Asset Probability of Liability Capital Claim Deficit
Amount Outcome Amount Amount Payment
Insurer A
Scenario I 13,000 0.2 6.900 6,900
Scenario 2 13,000 0.6 10,000 10,000
Scenario 3 13,000 0.2 13,100 13,000
Expectation 13,000 I 0,000 3,000 9,980
I00
20
Insu re r B
Scenario I 13,000 0.2 2,000 2.000
Scenario 2 13.000 0.6 I 0,000 I 0,000
Scenario 3 13,000 0.2 18,000 13,000 5,000
Expectation 13,000 10,000 3,000 9,000 1,000
In this simplest of examples, there are no expenses or taxes, no time value to money, and no other business transactions to consider. For each company, the ultimate outcome will be one of the three scenarios shown. Due to the corporate form of the enterprise (assumed to be a non-assessable stock corporation), the payments to policyholders are limited to the available assets. Each insurer is subject to an equal probability of ruin, with a 20% chance that obligations will exceed resources, claim payments will be limited, and the insurer will be forced to go out of business. Both insurers exhibit the same bahmce sheet leverage.
However, the claim payment column in the chart clearly indicates that the policyholders of Insurer B are significantly worse off than those of Insurer A. While policyholders of Insurer A receive only a minor reduction in claim payments in one of the three possible scenarios for their liabilities, policyholders of Insurer B may suffer a substantial underpayment, receiving only 13/18 of their indicated claim payment. Overall, policyholders of Insurer A expect apriori to recover all but $20 of the expected claim payments, while policyholders of Insurer B expect to recover only $9,000 of the expected $10,000 liability.

AN INTEGRATED DYNAMIC FINANCIAL ANALYSIS 369
The expected policyholder deficit is defined as the expected value of the difference between the amount of the claim obligation and the actual clairn payment. For Insurer A, the EPD is $20, or 0.2% of expected obligations. For Insurer B, the EPD is $1,000, or 10.0% of expected obligations.
While the ruin probabilities and reported financial leverage ratios of Insurer A and Insurer B are the same, the value of coverage afforded by each is clearly different. Insurer A offers considerably greater real value, from the perspective of the policyholder; expected recoveries are a substantially greater proportion of expected losses than is the case with Insurer B. In comparing the security offered, Insurer A's EPDratio of 0.2% is stronger than Insurer B's 10.0%. To offer the same level of security, Insurer B would need to increase its capitalratio frorn the current 30% of expected losses to 79% of expected losses (i.e., raise its assets to 17,900, so that it could pay all but $100 of the losses in Scenario 3).
The expected policyholder deficit concept can easily be adapted to consider asset risks as well as liability risks, by expanding the scenarios to include changes in asset values as well as liability values. For each scenario, the realized value of the assets is compared to the settlement value of the liabilities to determine whether or not there is a deficit.
From a financial standpoint, the EPD is the value of the put option held by the shareholders of a corporated enterprise. In the event that aggregate obligations exceed total assets, the shareholders can put the obligations to the regulators in exchange for the assets. When customers purchase insurance from a particular company, they implicitly give this option to the company.
O
f ~ ©
<
Capital
Cumulative Probability
FIGURE ~,: The distribution of annual aggregate operating losses for the enterprise, and the level of capital, determine the expected policyhokter deficit

370 STEPHEN P. I.OWE, JAMES N. STANARD
BUTSIC and others have argued that capital requirements for different lines of business should be set by equating EPD ratios (as opposed to ruin probabilities or leverage ratios). For each line of business the capital requirements should be set so that the expected deficit is the same percentage of expected losses. This approach is most relevant in a pricing context, when the cost of employed capital is being considered. Since all policyholders give up the same option, setting returns on capital that is apportioned in this manner assures equity alnong policyholders.
The expected policyholder deficit concept can be extended to consider all types of risks, to the extent that they call be incorporated into the dynamic finaucial model. The key model output is the distribution of aggregate operating losses for the enterprise. Different strategies can then be evaluated in terms of their impact on the EPD ratio. Alternatively, for a given target EPD ratio, different strategies can be evaluated in terms of their impact on the capital required to achieve that ratio.
It tutus out that the concept of expected policyholder deficit is not at all new. Ill a paper published in 1868, HATTENDOkF refers to "mittleres Risiko", the mean risk, as defined by WITTSTEIN and KANr, JER (1867). HA'rTENDORF discusses the concept in the context of mortality risk in life insurance; excerpts of that discussion are loosely translated below.
Because it is not possible to calculate an absolutely correct mortality table for an infinite number of observations, and because ill reality the number of insureds with the same age is always finite, an insurer must accept that results will deviate from the expected level. Such a deviation can be favorable for the insurer, but it can also require greater payments than expected. And so, the company takes a risk in that it promises the payment of all insured sums under any conditions, bnt its remuneration from the insured is based on the expected c a s e .
If one defines risk as the financial loss which one accepts, then it is clear that a narrower definition of the concept is required. One call speak of the largest and the smallest risk. The smallest is clearly equal to zero. The largest is the entire insured sum on all policies, less the available funds in reserves and premiums. Far more inaportant is the mean risk. By this onemeans thesum ofallpossible operating losses, each multiplied by its probability. This definition is well- defined, permits no uncertainty, and with it one can cornpute the mean risk for a given insurance portfolio.
Tile HATTENDORF paper develops a methodology for estimating WITTSTEIN and KANNER'S mean risk for a portfolio of life insurance contracts. While WITTSTEIN and KANNER had proposed the concept, they had not developed a practical means of manually calculating rnean risk ttbl" large numbers of contracts.

AN INTEGRATED DYNAMIC FINANCIAL ANALYSIS 371
REFE.RENCES
BUFF, J. (1990) Extending the Efficient Frontier. Imphasis 199014. Tillinghast - Towers Perrin, New York.
BUTS[C. R. (1994) Solvency Measurement for Property-Liability Risk-Based Capital Applications. The JournalofRisk and Insuranee Volume 61, Number 4, 656-690.
BRENNAN, M. and SClIWARTZ, E. (1982) An Equilibrium Model of Bond Pricing and a Test of Market Efficiency. Journal of Financial and Quantitative A nalysis 17, 75-100.
DAYKIN, C.D. ct. al. (1987) Assessing the Solvency and Financial Strength of a General Insurance Company. Journalofthe InstituteofActuaries September, 114, 227-325
DAYKIN, C.D. and HEY, G.B. 0990) Managing Uncertainty in a General Insurance Company. Jour- nalofthe Institute ofA ctuaries September, 117, 173-277.
DOLL, D. and SONLIN, S. (1994) Optimizing ALEF Studies. Emphasis 199414, Tillinghast - Towers Perrin, New York.
GRAY, W.M. (1990) Strong association between West African rainfall anti U.S. landfall of intense hurricanes. Science 249, 1251-1256.
HAR'rM,XN, D.G. el. al. (1992) Property-Casuahy Risk-Based Capital Requirement - A Conceptual Framework. The Forum Spring 1992, Casualty Actuarial Society, New York, 211-280.
HA'Iq'ENDORF, K. (1868) Ueber die Berechnung der Rcscrven und des Risico bei der Lcbensversiche- rung. In Rundschauder Versicherungen Volume XVIII, Leipzig
HODES, D.M. et. al. (1996) The Financial Modeling of Properly/Casualty Insurance Companies. The Forum Spring 1996, Casualty Actuarial Society, New York, 3-88.
MAP, KOWlTZ, H. (1959) Portfolio Selection: Efficient Diversilication of Investments. John Wiley & Sons. New York.
MULVEV, J.M. and THORLACIOS, A.E. (Forthcoming in 1997) The Towers Perrin Global Capital Market Scenario Generation System: CAP:Link. In Worldwide Asset and Liahility Modelhlg (ed. W.T. Ziembarand and J.M. M ulvey), Cambridge University Press.
WB'rTSTEBN and KANNER (1867) Determination of the Mean Risk in Life [nsur:mce. Deutsche Versi- cherunge-Zeitung.
STEPHEN P. LOWE
Chief A ctuary Tillinghast - Towers Perrin 175 Powder Forest Drive Weatogue, Connecticut 06089-9658, USA Io we.t" @ I o wers. corn
JAMES N. STANARD
Chairman, PresMent and Chic:f Executive Officer RenaissanceRe Holdings, Ltd. Renaissance House, East Broadway P.O. Box HM 2527 Hamihon HMGX, Bermuda [email protected]
