an integrated approach to blood-based cancer …
TRANSCRIPT

AN INTEGRATED APPROACH TO BLOOD-BASED CANCER DIAGNOSISAND BIOMARKER DISCOVERY
Martin Renqiang Minad∗, Salim Chowdhurybd, Yanjun Qia, Alex Stewartc, and Rachel Ostroffc
aNEC Labs America, Princeton, NJ 08540, USA, bLane Center for Computational Biology, Carnegie MellonUniversity, Pittsburgh, PA 15213, USA, cSomaLogic, Inc., Boulder, CO 80301, USA
E-mail: [email protected], [email protected], [email protected], {astewart, rostroff}@somalogic.comdThese authors contributed equally to this work
Disrupted or abnormal biological processes responsible for cancers often quantitatively manifestas disrupted additive and multiplicative interactions of gene/protein expressions correlating withcancer progression. However, the examination of all possible combinatorial interactions between genefeatures in most case-control studies with limited training data is computationally infeasible. In thispaper, we propose a practically feasible data integration approach, QUIRE (QUadratic Interactionsamong infoRmative fEatures), to identify discriminative complex interactions among informativegene features for cancer diagnosis and biomarker discovery directly based on patient blood samples.QUIRE works in two stages, where it first identifies functionally relevant gene groups for the diseasewith the help of gene functional annotations and available physical protein interactions, then itexplores the combinatorial relationships among the genes from the selected informative groups. Basedon our private experimentally generated data from patient blood samples using a novel SOMAmer(Slow Off-rate Modified Aptamer) technology, we apply QUIRE to cancer diagnosis and biomarkerdiscovery for Renal Cell Carcinoma (RCC) and Ovarian Cancer (OVC). To further demonstrate thegeneral applicability of our approach, we also apply QUIRE to a publicly available Colorectal Cancer(CRC) dataset that can be used to prioritize our SOMAmer design. Our experimental results showthat QUIRE identifies gene-gene interactions that can better identify the different cancer stages ofsamples, as compared to other state-of-the-art feature selection methods. A literature survey showsthat many of the interactions identified by QUIRE play important roles in the development of cancer.
Keywords: Blood-based Cancer Diagnosis; Biomarker Discovery; Feature Interactions; Sparse Learn-ing; Aptamer; SOMAmer Prioritization.
1. Introduction
In this paper, we focus on the task of biomarker discovery and cancer diagnosis directly basedon patient blood samples in the setting of limited training data. Although cancer diagnosisbased on microarray datasets has been extensively studied, blood-based cancer status predic-tion is still a challenging problem, because complex diseases like cancers are the results ofmultiple genetic and epigenetic factors and their manifestation in blood samples is even morecomplicated than in tumor samples. It is very difficult to identify these complicated factorssolely based on limited information provided by training data. Previous studies on single genemarkers can provide valuable information about disease status prediction, but they offer lim-ited insight into the complex interplay among the molecular factors responsible for progressionof complicated diseases such as cancers. So, recently, research in complex diseases shifts to-wards the identification of multiple genes that interact directly or indirectly in contributingtheir association to the target disease. Several complex interactive partners from previous
∗To whom correspondence should be addressed.

studies have been shown to give important insight into the mechanism of breast cancer1 andcolorectal cancer,2 but none of these approaches addressed the problem of disease diagnosisbased on blood samples or considered the multiplicative effect of gene/protein expressions.
The identification of groups of genes that show differential behavior in the manifestation ofcomplex diseases is computationally infeasible due to the combinatorial nature of the problem.Several recent methods propose to reduce the search space using orthogonal prior knowledgeabout connections amongst the genes, such as interactions collected from protein-protein in-teraction (PPI) network3 or grouping information from functional annotations of proteins.One notable computational method named Group Lasso4 incorporates such prior interactionor grouping among the genes to detect gene groups that contribute to human disease, byenforcing sparsity at the group level in a supervised regression framework. Group Lasso is ex-tended by Jacob et al.5 to a more general setting that incorporates groups whose overlaps arenonempty. Such overlaps in groups is biologically significant, because many genes participatein multiple pathways and manifest themselves in several biological processes. Although (Over-lapping) Group Lasso is very useful in identifying biologically relevant groups of genes andproteins, it cannot capture complex combinatorial relationships among the features within andacross the groups, and it often outputs too many features as biomarkers. Also, current PPInetwork data is inherently noisy due to experimental constraints.6 Algorithmic approachesbased solely on these noisy prior information can result in many false positive interactionswhich are absent in the real genome space.
Our goal in this paper is to identify the complex combinations of single genes and multi-plicative pairwise interactions among genes that help us (1) better perform cancer diagnosisbased on blood samples, and (2) gain novel insights into the mechanistic basis of the diseases.Since the total number of possible pairwise human gene interactions is huge, it is computa-tionally infeasible to examine all possible combinatorial combinations of them when tryingto understand their relevance to the diseases under consideration. We propose a two-stageapproach in a sparse learning framework, named as QUIRE, i.e. to detect QUadratic Inter-actions among infoRmative fEatures which show differential behavior for diagnosing a targetdisease using protein or mRNA expressions. Based on our own experimentally generated datafrom patient blood samples using a novel SOMAmer technology,7 we apply QUIRE to blood-based cancer diagnosis for RCC and OVC, and we also apply QUIRE to a publicly availableCRC dataset that can be used to prioritize our SOMAmer design. QUIRE can discover com-plementary sets of markers and pairwise interactions that can better classify samples fromdifferent stages of cancer and predict post-cancerous events, like cancer recurrence and deathfrom cancer with higher accuracy than other state-of-the-art feature selection methods. To thebest of our knowledge, QUIRE is the first proposed method to identify combinatorial patternsamong the pairs of informative genes for studying complex diseases like cancers. Subsequentfunctional analysis of the interactions identified by QUIRE reveals that it can indeed identifygenes relevant to the progression of diseases under study.
2. Problem and Method
The identification of single gene markers in a genome-wide case-control study is an ill-posedproblem, because the number of genes in human cells is much larger than that of availablesamples. For such problems, Lasso, proposed by Tibshirani et al.8 is very popular for selectinga small number of features relevant to the problem under study. When a set of features arehighly correlated to each other, Lasso selects one from that set, ignoring others. So there is apossibility that Lasso leaves out biologically relevant genes from its set of selected informativefeatures.
Suppose we have a data set S containing n samples and p gene features (xi, yi) with responsevariable y ∈ R and feature vector x ∈ Rp, where i ∈ {1, . . . , n}, and we assume that the featurevalues and the ys are centered in S. The Lasso approach optimizes the following objectivefunction,
`(w) =
n∑i=1
(yi −p∑
j=1
wjxij)
2,
`lasso(w) = `(w) + λ
p∑j=1
|wj |, (1)
where `(w) is the loss function of linear regression, and w is the weight parameter. The `1 normpenalty in lasso induces sparsity in the weight space for selecting features. It is obvious thatthe sum of the least squared errors and the `1 norm are convex functions with respect to theweights w. Lasso has a global optimum, which can be identified by any convex optimizationtechnique.
In spite of the computational efficiency and the popularity of Lasso for feature selection,its formulation prevents it from capturing any prior information on possible group structuresamong the features. Group Lasso4 proposed using `2,1 penalty to select groups of input featureswhich are partitioned into non-overlapping groups. The group penalty is the sum of the `2norm on the features belonging to the same group. Overlapping Group Lasso5 extends GroupLasso to handle groups of features with overlapping group members by duplicating inputfeatures belonging to multiple groups in the design matrix. Because a lot of real applicationsinvolve overlapping feature groupings, Overlapping Group Lasso is a more natural choice thanGroup Lasso for biomarker discovery. Suppose that we partition p features in data set S intoq overlapping groups G = {g1, g2, . . . , gq}, the following objective function is minimized,5
`oglasso = `(w) + λ∑g∈G||wg||, (2)
where λ is the regularization parameter, wg denotes the vector of weights associated with fea-tures in group g, and || · || is the Euclidean norm. The above optimization problem is separable,so we can use block coordinate descent to optimize the weights associated with each group g
separately. Although considering grouping structure among input features is very importantfor feature selection, Overlapping Group Lasso only encourages sparsity at the feature grouplevel and there is no sparsity penalty within feature groups. Therefore, Overlapping GroupLasso often outputs a much larger number of selected features than Lasso. Furthermore, Lasso
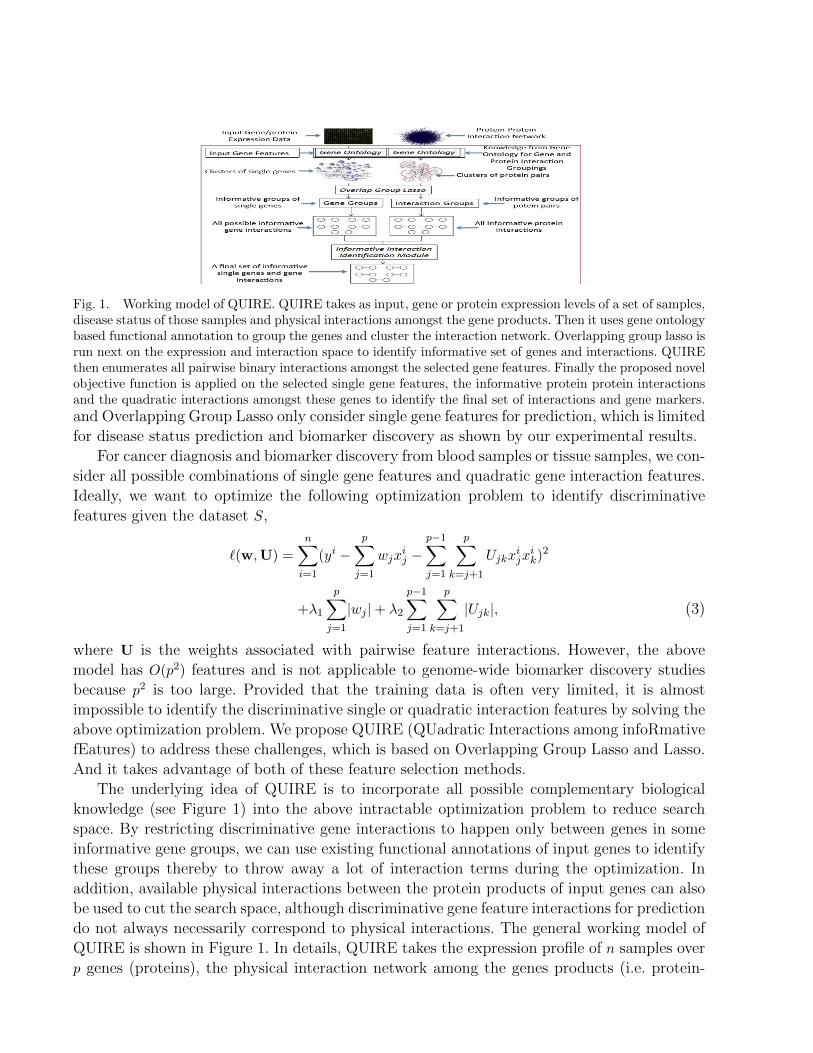
Fig. 1. Working model of QUIRE. QUIRE takes as input, gene or protein expression levels of a set of samples,disease status of those samples and physical interactions amongst the gene products. Then it uses gene ontologybased functional annotation to group the genes and cluster the interaction network. Overlapping group lasso isrun next on the expression and interaction space to identify informative set of genes and interactions. QUIREthen enumerates all pairwise binary interactions amongst the selected gene features. Finally the proposed novelobjective function is applied on the selected single gene features, the informative protein protein interactionsand the quadratic interactions amongst these genes to identify the final set of interactions and gene markers.
and Overlapping Group Lasso only consider single gene features for prediction, which is limitedfor disease status prediction and biomarker discovery as shown by our experimental results.
For cancer diagnosis and biomarker discovery from blood samples or tissue samples, we con-sider all possible combinations of single gene features and quadratic gene interaction features.Ideally, we want to optimize the following optimization problem to identify discriminativefeatures given the dataset S,
`(w,U) =
n∑i=1
(yi −p∑
j=1
wjxij −
p−1∑j=1
p∑k=j+1
Ujkxijx
ik)2
+λ1
p∑j=1
|wj |+ λ2
p−1∑j=1
p∑k=j+1
|Ujk|, (3)
where U is the weights associated with pairwise feature interactions. However, the abovemodel has O(p2) features and is not applicable to genome-wide biomarker discovery studiesbecause p2 is too large. Provided that the training data is often very limited, it is almostimpossible to identify the discriminative single or quadratic interaction features by solving theabove optimization problem. We propose QUIRE (QUadratic Interactions among infoRmativefEatures) to address these challenges, which is based on Overlapping Group Lasso and Lasso.And it takes advantage of both of these feature selection methods.
The underlying idea of QUIRE is to incorporate all possible complementary biologicalknowledge (see Figure 1) into the above intractable optimization problem to reduce searchspace. By restricting discriminative gene interactions to happen only between genes in someinformative gene groups, we can use existing functional annotations of input genes to identifythese groups thereby to throw away a lot of interaction terms during the optimization. Inaddition, available physical interactions between the protein products of input genes can alsobe used to cut the search space, although discriminative gene feature interactions for predictiondo not always necessarily correspond to physical interactions. The general working model ofQUIRE is shown in Figure 1. In details, QUIRE takes the expression profile of n samples overp genes (proteins), the physical interaction network among the genes products (i.e. protein-
protein interaction network) and the disease status of these samples as input, and it outputsa (small) set of discriminative genes and gene interactions with corresponding learned weightsfor predicting the disease status of any incoming test sample. The step-by-step working modelof QUIRE is given below:
(1) Functional group generation:
(a) QUIRE groups the p input gene features into q overlapping functional categories accord-ing to the existing Gene Ontology (GO) based functional annotations such as CellularColocalization (CC).
(b) QUIRE clusters the given interaction network (i.e. PPI) into subsets of overlappinggene products based on CC.b
(2) Informative genes and functional interactions selection:
(a) Given the GO functional grouping of input gene features, Overlapping Group Lassois run to select m top discriminative genes for disease status prediction according tothe absolute values of the learned weights of gene features.c
(b) Overlapping group lasso is run on the clustered interaction network to select informa-tive groups of protein-protein interactions. In this case, each cluster is considered as agroup and the products of pairwise gene/protein feature values among the interactingproteins in a group are used as interaction feature values.
(3) Selection of most informative interactions and genes: QUIRE first enumerates all possiblequadratic feature interactions among the informative genes selected at step 2(a). Then ittakes these quadratic interactions, single informative gene features and the informativefunctional interactions identified at step 2(b) as input and it outputs the final selectedgene interactions and single genes as biomarkers.
In order to identify the discriminative combinations of single gene features and quadraticinteractions among pairwise informative genes, we define our proposed objective function forLasso as follows,
`(w,U,R) =
n∑i=1
(yi −m∑j=1
wjxij −
m−1∑j=1
m∑k=j+1
Ujkxijx
ik −
r∑l=1
RlIl)2
+λ1
m∑j=1
|wj |+ λ2
m−1∑j=1
m∑k=j+1
|Ujk|+ λ3
r∑l=1
|Rl|, (4)
where j and k index the m seed informative genes and l indexes the r informative protein-protein interactions selected by the Overlapping Group Lasso in the previous step, U and R areweights associated with feature interactions, and λ1, λ2, and λ3 are regularization parametersd.The objective function contains `1 penalties at single gene level, pairwise gene interactionlevel, and protein interaction level. The intuition behind this formulation is that it captures
bWe chose CC as final functional grouping of gene/protein features because it produces groups with reasonablesize (see experiment section for details) and it is the most relevant annotation to blood-based diagnosis.cm is selected by 5-fold cross validation.dIn our experiments, we make λ1 = λ2 = λ3 and set it by 5-fold cross validation.

the interactions that are complementary to the individual informative genes. Because it iscomputationally infeasible to consider every pair of interaction in a genome-wide case-controlstudy, QUIRE reduces the search space by using the features that are selected by OverlappingGroup Lasso as the informative ones, and then it relies on Lasso with `1 penalties to identifythe discriminative combination of informative individual gene features and gene interactionfeatures, which provides an approximation to the problem of searching an exponential number(O(2p+p2
)) of all possible combinations of single features and pairwise interaction features. Ourcurrent implementation of QUIRE is based on the standard Lasso package from glmnet9 andthe Overlapping Group Lasso programs from Jacob et al., 2009.5
3. Experimental Results and Discussion
In this section, we present experimental results of QUIRE on three different cancer datasets:blood-based cancer diagnosis and biomarker discovery for (1) Renal Cell Carcinoma (RCC)and (2) Ovarian Cancer (OVC) based on our private datasets, and cancer recurrence anddeath prediction for (3) Colorectal Cancer (CRC) based on a public microarray dataset, inwhich the identified markers can be used to prioritize our SOMAmer design. We compare theperformance of QUIRE to the state-of-the-art feature selection techniques, Lasso, OverlappingGroup Lasso and SVM. We then perform a literature survey and enrichment analysis of theinformative interactions selected by QUIRE and show that they are relevant to the progressionof the disease.
3.1. Our Blood-based Datasets Generated by the SOMAmer Technology
To predict cancer progression status directly from blood samples, we generated our owndatasetse. All samples and clinical information were collected under Health Insurance Porta-bility and Accountability Act compliance from study participants after obtaining written in-formed consent under clinical research protocols approved by the institutional review boardsfor each site. Demographic data was collected by self-report and clinical data by chart review.Blood was processed within 2 hours of collection according to established standard operatingprocedures. To predict RCC status, serum samples were collected at a single study site frompatients diagnosed with RCC or benign renal mass prior to treatment. Definitive pathologydiagnosis of RCC and cancer stage was made after resection. Outcome data was obtainedthrough follow-up from 3 months to 5 years after initial treatment. To predict OVC status,plasma samples were collected from women with a suspicious pelvic mass prior to treatment.Definitive pathology diagnosis of ovarian cancer stage or benign mass was made after resection.CA-125 (Carbohydrate Antigen 125 also known as MUC16) was measured by a routine clin-ical laboratory assay. To generate RCC and OVC datasets, the SOMAmer based proteomictechnology7 is used to measure the concentration of a selected set of about 1000 proteinsin Relative Fluorescence Unit. The CRC samples belong to a publicly available microarraydataset collected from gene expression omnibus (GEO), and referenced by accession number
eDue to conflict of interest, the datasets are not publicly available. Data requests should be sent to the lastauthor of this paper.

GSE17536 (http://www.ncbi.nlm.nih.gov/geo/query/acc.cgi?acc=GSE17536).10
Our RCC dataset contains 212 RCC samples from benign and 4 different stages of tumor.Expression levels of 1092 proteins are collected. The number of Benign, Stage 1, Stage 2, Stage 3
and Stage 4 tumor samples are 40, 101, 17, 24 and 31 respectively. Our OVC dataset contains 845
proteins’ expressions for 248 samples across Benign and 3 different stages of ovarian cancer.The number of Benign, Stage 1, Stage 2 and Stage 3 tumor samples are 134, 45, 8 and 61
respectively. The public CRC microarray dataset (GSE17536) contains 177 samples from 4
different stages (Stage 1 to Stage 4) of CRC. Expression levels of 20125 genes are collected.Besides stage information, this dataset also has records for each patient, the binary valuedinformation of “Cancer Recurrence” and “Death from Cancer”. Out of 177 patients, 55 hadrecurrence of cancer and 68 died from cancer.
In order to group the genes using gene ontology terms, we use the web basedtool “Database for Annotation, Visualization, and Integrated Discovery” (DAVID,http://david.abcc.ncifcrf.gov/).11 There are a set of parameters that can be adjustedin DAVID based on which the functional classification is done. This whole set of parametersis controlled by a higher level parameter “Classification Stringency”, which determines howtight the resulting groups are in terms of association of the genes in each group. In general, a“High” stringency setting generates less number of functional groups with the member genestightly associated and more genes will be treated as irrelevant ones into an unclustered group.We set the stringency level to “Medium” which results in balanced functional groups wherethe association of the genes are moderately tight. The total number of groups based on CCannotations for RCC and OVC datasets are 56 and 23 respectively, and the number of groupsfor the CRC dataset is 520.
Besides using it for selecting informative single gene features, we use Overlapping GroupLasso to select the informative protein protein interactions. We download the binary proteinprotein interactions (PPI) data from HPRD (http://www.hprd.org/). For each feature groupGi, we identify the pairs of member genes of Gi whose products interact directly with each otherin the PPI network. The set of all such pairs where both interacting partners are members ofGi forms a group. For a pair of interacting genes xj and xk in a group, we use their quadraticinteraction term xjxk as their expression level. Usage of the quadratic interaction formulationin Overlapping Group Lasso helps us to integrate the resulting informative protein proteininteractions into the formulation of QUIRE directly without any transformation. Thus thetotal number of groups are same in the case of interactions and single gene features. But thecardinality of each group and the expression levels of the members are different.
3.2. Experimental Design
We perform three stage-wise binary classification experiments using RCC samples: Classifica-tion of Benign samples from Stage 1−4 samples, Classification of Benign and Stage 1 samplesfrom Stage 2 − 4 samples, and Classification of Benign, Stage 1, 2 samples from Stage 3, 4
samples. In the OVC dataset, CA125 is a well-known marker in ovarian cancer.12 Concentra-tion of CA125 is used to measure the progression of the disease. The suspicious cutoff levelof CA125 is 40 U/mL, meaning that concentration level above 40 of this marker might be

indicative of OVC. But CA125 is not a good indicator of early detection of the disease onset,especially when the concentration of this biomarker is between 40 and 100.13 So we use sampleswith CA125 concentration level between 40 and 100 as our test set in this experiment. Theremaining samples, with concentration of CA125 below 40 and above 100 are used as trainingset. We perform the following experiments: Classification of Benign samples from Stage 1− 3
samples, Classification of Benign, Stage 1 samples from Stage 2, 3 samples, and Classificationof Benign, Stage 1, 2 samples from Stage 3 samples. On the CRC dataset, we perform binaryclassifications to predict whether there is disease-free survival in the follow-up time or notfor cancer recurrence prediction and whether there is death from CRC across all pathologicalstages of the disease for death from colorectal cancer prediction.
3.3. Classification performance of QUIRE
In this section, we report systematic experimental results on classifying samples from differentstages of RCC and OVC and in predicting CRC recurrence and death from CRC. In the firststage of QUIRE, we use Overlapping Group Lasso to identify the biologically relevant groupsof features and pairwise protein interactions, which in turn, is used in the subsequent stageto explore the set of informative markers and quadratic interactions. However, for the RCCand OVC datasets, we do not use protein protein interactions for prediction purpose. This isbecause, these datasets include only selected marker proteins distributed sparsely across theprotein interaction network and thus most of them do not interact with each other directly.
After we run Overlapping Group Lasso on the gene groups, we sort the genes based on theweight value assigned to it by the algorithm. We used cross validation to select the optionalparameter m in QUIRE from {100, 200, 300, 400, 500}, and m = 200 was selected for all ourexperiments. For classification of CRC samples, Overlapping Group Lasso on average selects1000 PPIs as informative ones. We use this whole set of selected protein interactions as inputto QUIRE to be considered besides the paired quadratic interactions.
The predictive performance of the markers and pairwise interactions selected by QUIREis compared against the markers selected by Lasso, linear Support Vector Machine (SVM)and Overlapping Group Lasso. We use glmnet9 and LiblineaR14 packages for implementationof Lasso and SVM respectively. We use the Group Lasso implementation (with overlappinggroups) from.5 The overall performance of the algorithms are shown in Figure 2. In thisfigure, we report average AUC (Area Under the Curve) score for ten runs of five-fold crossvalidation experiments for cancer stage prediction in RCC (Figure 2(A)) and for predictingcancer recurrence and death from cancer in CRC(Figure 2(C)). In five fold cross validationexperiments, we divide the samples equally into five disjoint sets or folds. We keep one foldfor testing. On the remaining four folds, we use Overlapping Group Lasso to identify theinformative set of markers and protein protein interactions (for CRC). We train QUIRE onthese four folds using these markers to identify the pairwise interactions and markers anduse the set-aside test set for prediction purpose. For each run, this procedure is repeatedfor each of the five folds and average AUC score is reported for ten such runs. For OVC,we report average AUC score (Figure 2(B)) for predicting the cancer stage of the sampleswith intermediate levels of CA125 (concentration of CA125 is between 40 and 100) using the

remaining samples for training and informative feature selection. In cancer stage prediction
Fig. 2. Comparison of the classification performances of different feature selection approaches with QUIREin identifying the different stages of (A)RCC , (B) OVC and (C) in predicting CRC recurrence and deathfrom CRC. In (A) and (C), five fold cross validation is repeated ten times and average AUC score is reported.For (B), samples with CA125 marker’s expression level between 40 and 100 are used as test cases, while theremaining samples are used for training. This experiment is also repeated ten times and average AUC score isreported.
experiments for RCC and OVC, we see from Figure 2 that the combination of informativemarkers and pairwise interactions identified by QUIRE show better classification performancein every case, as compared to the markers selected by Lasso, SVM and Overlapping GroupLasso. For early detection of the diseases (classification of Benign, Stage 1 vs. rest of thesamples), QUIRE achieves average AUC scores of 0.88 and 0.82 for RCC and OVC respectively.Overlapping group lasso shows next best performance with average AUC scores of 0.83 and0.80 respectively. Lasso and SVM, which do not use any grouping or interaction informationamongst the features, show the worst performance in all of the classification tasks apartfrom one. As QUIRE markers show consistently better performance across all the stages ofRCC and OVC, they can be used for improved diagnosis and prognosis of these two differenttypes of cancers. Also QUIRE helps better prediction of OVC progression for samples withintermediate levels of CA125 ; so it can be used by the physicians for early detection of thisdisease.
From Figure 2(C), we can see that gene-gene interactions help us better predict both CRCrecurrence and death from CRC, as compared to the other feature selection mechanisms. Inthe events of cancer recurrence and death from cancer, the average AUC values achievedby features selected with QUIRE are 0.79 and 0.81 respectively, while markers identified byOverlapping Group Lasso show the next best performance with average AUC value of 0.71 in

both of these categories. Markers identified by Lasso show the worst performance in predictionof both of these events. The performance gap between QUIRE and the other three popularfeature selection techniques hint to the fact that QUIRE can identify interactions that mighthelp us better understand the mechanistic basis of CRC.
These experimental results show that QUIRE identifies markers and interactions thatcomplement each other in such a way that they not only help better diagnosis and prognosisof cancer, but also can predict the advanced events of recurrence of cancer and survival aftercancer with higher accuracy than other state-of-the-art algorithms. For each of these datasets,identification of informative pairwise interactions using brute-force enumerative technique iscomputationally impractical due to the huge dimensionality of the search space. QUIRE helpsreducing this space by a large margin. The total running time of QUIRE is dominated by theOverlapping Group Lasso stage which takes around one hour to identify biologically relevantgroups of genes and protein interactions in traditional desktop computers for the types ofproblems we study. After the dimensionality is reduced, QUIRE exhaustively enumerates allthe pairwise interactions and use the protein interactions identified in the previous stageon this low dimensional space in a couple of minutes. QUIRE is computationally very fastconsidering that it identifies discriminative pairwise gene interactions at a genome-wide scale.
3.4. Informative QUIRE markers and interactions associated with cancerCancer is a genetic disease, which originates and develops through a process of mutations.Mutations in individual gene not only disrupts its own function, but also affects its interactionpatterns with other genes. As complex diseases like cancer is a result of dysregulation in theinteractions among the genes, researchers focus on identifying those relevant interactions togain more insight into the molecular basis of the disease. On the CRC dataset, QUIRE selectsabout 120 quadratic interactions and single features in total on average as informative onesfor both CRC recurrence and death from CRC. On the other hand, the average number ofmarkers selected by Overlapping Group Lasso and Lasso on the same prediction tasks areabout 1100 and 150 respectively. Therefore, Overlapping Group Lasso itself is unsuitable forbiomarker discovery although it produced the second best performance.
An investigation of the pairwise interactions identified by QUIRE on CRC dataset re-veals that many of these interactions are indeed relevant to the progression of cancer ingeneral. Some of such interactions identified for prediction of CRC recurrence include JAK2- LYN ,15 Transforming growth factor beta (TGFβ) - SMAD ,16 Epidermal growth factor re-ceptor (EGFR) - Caveolin (CAV ),17 TP53 - TATA binding protein (TBP),18 Connectivetissue growth factor (CTGF ) - Vascular endothelial growth factor (VEGF ),19 Edoglin (ENG)- Transforming growth factor beta receptor (TGFβR).20 Further investigations of the interac-tions identified by QUIRE might reveal novel gene partners associated with cancer and thuslead to testable hypothesis.
Disturbance in pairwise interactions among the genes affects the pathways inwhich they are located in. Cancer pathways are a set of pathways dysregulationsin which have been shown to be associated with initiation and progression of thedisease. A pictorial view of the well-known cancer pathways can be found in theKEGG database(http://www.genome.jp/kegg/pathway/hsa/hsa05200.html).21 We per-

form a pathway enrichment analysis where we test if the set of the markers and interactionsidentified by QUIRE on the CRC dataset reside in the cancer pathways. As part of thisexperiment, we first use the partner genes identified by QUIRE as part of the informativeinteractions while predicting CRC recurrence. We use DAVID to identify the statistically sig-nificant pathways that are enriched in these genes. An investigation of the enriched pathwaysreturned by DAVID indicates that many of them are indeed responsible for cancer or relatedto functions dysregulation in which results in cancer. Some of such KEGG pathways includeApoptosis (p-value 4.7x10⁻⁴), Focal adhesion (p-value 3x10⁻³), Cell adhesion molecules (p-value 9.2x10⁻⁴), p53 signaling pathway (p-value 1.3x10⁻²), Gap junction (p-value 1.3x10⁻²),MAPK signaling pathway (p-value 4.5x10⁻²), ErbB signaling pathway (p-value 5.8x10⁻²), Cellcycle (p-value 6.6x10⁻²), Pathways in Cancer (p-value 7.2x10⁻⁴), Colorectal cancer (p-value10−3). Repeating the same analysis on the interacting partners identified by QUIRE whilepredicting “Death from CRC” result in identification of similar pathways (data not shown).
3.5. Significance of feature interactions in QUIRE
We also perform classification experiments to observe the performance of PPIs and informativesingle features on predicting CRC recurrence and death from CRC without quadratic featureinteractions. For this experiment, we use the single gene markers and the PPIs selected byOverlapping Group Lasso as input to QUIRE and enumeration of the pairwise interactionsamong the marker genes is avoided. For ten runs of five fold cross validation experiment onthis modified feature set, we observe average AUC score of 0.71 for both classification tasks. Ifwe only use informative single features with the same experimental setting, the average AUCscore we got is 0.70. These results show that besides physical interactions and single features,indirect higher level interactions among the informative genes must be taken into account tounderstand the basic mechanism of complex diseases.
4. Conclusion
In this paper, we propose a computational approach, QUIRE, to identify combinatorial in-teractions among the informative genes in complex diseases, like cancer. Our algorithm usesOverlapping Group Lasso to identify functionally relevant gene markers and protein interac-tions associated with cancer. It then explores the pairwise interactions among these relevantgenes within this reduced space exhaustively and the selected pairwise physical protein in-teractions to discover the combination of individual markers and gene-gene interactions thatare informative for prediction of the disease status of interest. The application of QUIRE onthree different types of cancer samples collected using two different techniques shows that ourapproach performs significantly better than the state-of-the-art feature selection methods suchas Lasso and SVM for biomarker discovery while selecting a smaller number of features, andit also shows that our approach can capture discriminative interactions with high relevance tocancer progression. Further investigations show that QUIRE can identify markers and inter-actions that have been associated previously with pathways associated with cancer. Moreover,the good performance of QUIRE on the CRC dataset suggests that applications of QUIRE ongenome-wide microarray experimental data can be used to help prioritize SOMAmer design
for blood-based cancer diagnosis. And QUIRE applied to blood-based experimental data hasthe great potential to impact the field of practical medical diagnosis.
Acknowledgement
We thank Hans Peter Graf for valuable comments and discussions.
References
1. H. Y. Chuang, E. Lee, Y. T. Liu, D. Lee and T. Ideker, Mol. Syst. Biol. 3, p. 140 (2007).2. S. A. Chowdhury, R. K. Nibbe, M. R. Chance and M. Koyuturk, J. Comput. Biol. 18, 263 (Mar
2011).3. S. Lee and E. P. Xing, Bioinformatics 28, i137 (June 2012).4. M. Yuan and Y. Lin, Journal of the Royal Statistical Society: Series B (Statistical Methodology)
68, 49 (2006).5. L. Jacob, G. Obozinski and J.-P. Vert, Group lasso with overlap and graph lasso, in Proceedings
of the 26th Annual International Conference on Machine Learning , ICML ’09 (ACM, New York,NY, USA, 2009).
6. H. Yu, P. Braun, M. Yıldırım, I. Lemmens, K. Venkatesan, J. Sahalie, T. Hirozane-Kishikawa,F. Gebreab, N. Li, N. Simonis et al., Science 322, 104 (2008).
7. L. Gold, D. Ayers, J. Bertino, C. Bock, A. Bock, E. N. Brody, J. Carter, A. B. Dalby, B. E.Eaton and T. Fitzwater et al., PLoS ONE 5, p. e15004 (12 2010).
8. R. Tibshirani, Journal of the Royal Statistical Society. Series B (Methodological) 58, pp. 267(1996).
9. J. H. Friedman, T. Hastie and R. Tibshirani, Journal of Statistical Software 33, 1 (2 2010).10. J. J. Smith, N. G. Deane, F. Wu, N. B. Merchant, B. Zhang, A. Jiang, P. Lu, J. C. Johnson,
C. Schmidt, C. E. Bailey, S. Eschrich, C. Kis, S. Levy, M. K. Washington, M. J. Heslin, R. J.Coffey, T. J. Yeatman, Y. Shyr and R. D. Beauchamp, Gastroenterology 138, 958 (Mar 2010).
11. G. Dennis Jr, B. Sherman, D. Hosack, J. Yang, W. Gao, H. Lane and R. Lempicki, Genome Biol4, p. P3 (2003).
12. K. S. Suh, S. W. Park, A. Castro, H. Patel, P. Blake, M. Liang and A. Goy, Expert Rev. Mol.Diagn. 10, 1069 (Nov 2010).
13. E. L. Moss, J. Hollingworth and T. M. Reynolds, Journal of clinical pathology 58, 308 (March2005).
14. R. E. Fan, K. W. Chang, C. J. Hsieh, X. R. Wang and C. J. Lin, Journal of Machine LearningResearch 9, 1871 (2008).
15. A. Samanta, S. Chakraborty, Y. Wang, H. Kantarjian, X. Sun, J. Hood, D. Perrotti and R. Ar-linghaus, Oncogene 28, 1669 (2009).
16. W. Grady, Clinical cancer research 11, 3151 (2005).17. K. Dittmann, C. Mayer, R. Kehlbach, H. Rodemann et al., Mol Cancer 7, 17 (2008).18. D. Crighton, A. Woiwode, C. Zhang, N. Mandavia, J. Morton, L. Warnock, J. Milner, R. White
and D. Johnson, The EMBO journal 22, 2810 (2003).19. I. Inoki, T. Shiomi, G. Hashimoto, H. Enomoto, H. Nakamura, K. Makino, E. Ikeda, S. Takata,
K. Kobayashi and Y. Okada, The FASEB Journal 16, 219 (2002).20. E. Fonsatti, M. Altomonte, P. Arslan and M. Maio, Current drug targets 4, 291 (2003).21. M. Kanehisa, S. Goto, Y. Sato, M. Furumichi and M. Tanabe, Nucleic acids research 40, D109
(2012).