an integrated approach of kano’s model and importance ... et al.pdfimportance-performance analysis...
TRANSCRIPT

African Journal of Business Management Vol. 4(15), pp. 3238-3250, 4 November, 2010 Available online at http://www.academicjournals.org/AJBM ISSN 1993-8233 ©2010 Academic Journals Full Length Research Paper
An integrated approach of Kano’s model and Importance-Performance Analysis in identifying key
success factors
Hsin-Hung Wu1*, Yung-Tai Tang2 and Jyh-Wei Shyu3
1Department of Business Administration, National Changhua University of Education No. 2 Shida Road, Changhua City, Taiwan 500.
2Department of International Business, Providence University, Taichung Hsien, Taiwan. 3Graduate Institute of Marketing and Logistics Management, National Changhua University of Education,
Changhue City, Taiwan.
Accepted 17 February, 2010
This study proposes perceived ‘Importance-Performance Analysis’ by simultaneously integrating ‘importance-performance analysis’ and Kano’s model in identifying key success factors. Kano’s model, which provides a two-dimensional view of quality, is a very useful tool to identify which customer requirements of a particular product or service might be more than the proportional satisfaction to customers. Importance-Performance Analysis can be applied to identify the strengths and weaknesses quality attributes from customers’ viewpoints by simultaneously evaluating importance and performance. The proposed perceived Importance-Performance Analysis provides much more useful information that allows the decision maker to classify the quality attributes into different categories and prioritize the importance of these quality attributes for improvement. A case study of a 3C retailer is provided by applying the proposed perceived Importance-Performance Analysis, and as such, the findings based on this proposed method are discussed. Key words: Kano’s model, Kano’s questionnaire, Importance-Performance Analysis, perceived importance, performance.
INTRODUCTION E-Life Mall Corporation is one of the leading and largest 3C (computer, communication and consumer electronics) retailers with more than 290 stores in Taiwan market. In addition to E-Life Mall Corporation, Tsann Kuen Enterprise Company Limited is the largest retailer in terms of sales with more than 260 stores Island-wide. Tatung Company has about 270 stores, while Sunfar Computer Company Limited has about 70 stores. The retailing market in Taiwan is very competitive because each company has been aggressively conducting promotional campaigns to stimulate domestic demand.
The promotional campaigns include a wide variety of payment plans, discounts, home delivery services and other bargains to attract more customers, such as zero- interest loan service and installment payment project, *Corresponding author. E-mail: [email protected].
lowest prices on particular home appliances and so on. Due to the fact that the Taiwan’s market in 3C products has reached saturation, one company’s gain would result in others’ losses. Besides, the external environment has changed such as the changes of consumption patterns, shorter product life cycle and the popularization of marketing channels. Moreover, the limitations of internal conditions of firms such as limited resources, lack of sufficient market information and the limitation of technologies upgrade might force firms to identify critical success factors by deploying internal business resources and integrating technologies both effectively and efficiently to create corporate profits and sustainable development. Under such circumstances, it would be of interest to identify the key success factors (KSFs) of E-Life Mall Corporation with the most chain stores in Taiwan, because these key success factors might enable the management to develop and execute policies effectively and efficiently (de Waal and Gerritsen-Medema,

2006).
This study proposes an integrated approach of Importance-Performance Analysis (IPA) and Kano’s model to evaluate, identify and then classify the major strengths and weaknesses of the key success factors of E-Life Mall Corporation. By incorporating Kano’s model, the identified major strengths and weaknesses can be further classified into different types of categories. In doing so, the management is able to prioritize the major strengths psychologically as well as determine the improvement on importance of major weaknesses. This paper is organized as follows: It summarizes key success factors and reviews the Importance-Performance Analysis briefly. Also, Kano’s model is discussed in this paper. An integrated approach of IPA and Kano’s model is proposed and summarized as a case study of applying this proposed model in evaluating the key success factors of E-Life Mall Corporation. Finally, discussions and conclusions were summarized at end of the paper. KEY SUCCESS FACTORS According to Leidecker and Bruno (1987), key success factors are “those characteristics, conditions or variables that, when properly sustained, maintained or managed, can have a significant impact on the success of a firm competing in a particular industry.” Grunert and Ellegaard (1993) argued that the key success factors are “the few key areas where things must go right for the business to flourish and for the managers’ goals to be attained.” Rockart (1979) developed the key success factors concept as a way of identifying the general managers’ information needs, and he defined KSFs as “those few critical areas where things must go right for the business to flourish.” In addition, Grunert and Ellegaard (1993) also believed that the concept of KSFs is the core of business strategy. Aaker (2001) pointed out that KSFs are a competitive skill or asset that is needed to compete successfully. Moreover, strategy development needs to be based on difficult judgments about what the KSFs will be in the future (Aaker, 2001). Key success factors therefore have an important role in disciplining the competitive analysis process, for the direct attention to high leverage competences (Day and Wensley, 1988). IMPORTANCE-PERFORMANCE ANALYSIS REVIEW Importance-performance analysis, originally proposed by Martilla and James (1977), was to provide insights to management in order to identify the strengths and weaknesses of a company. Importance-Performance Analysis is typically viewed as a part of marketing re-search techniques that involve the analyses of customer attitudes toward salient product or service attributes and helps practitioners prioritize the improvement oppor-tunities for product or service attributes and direct quality-
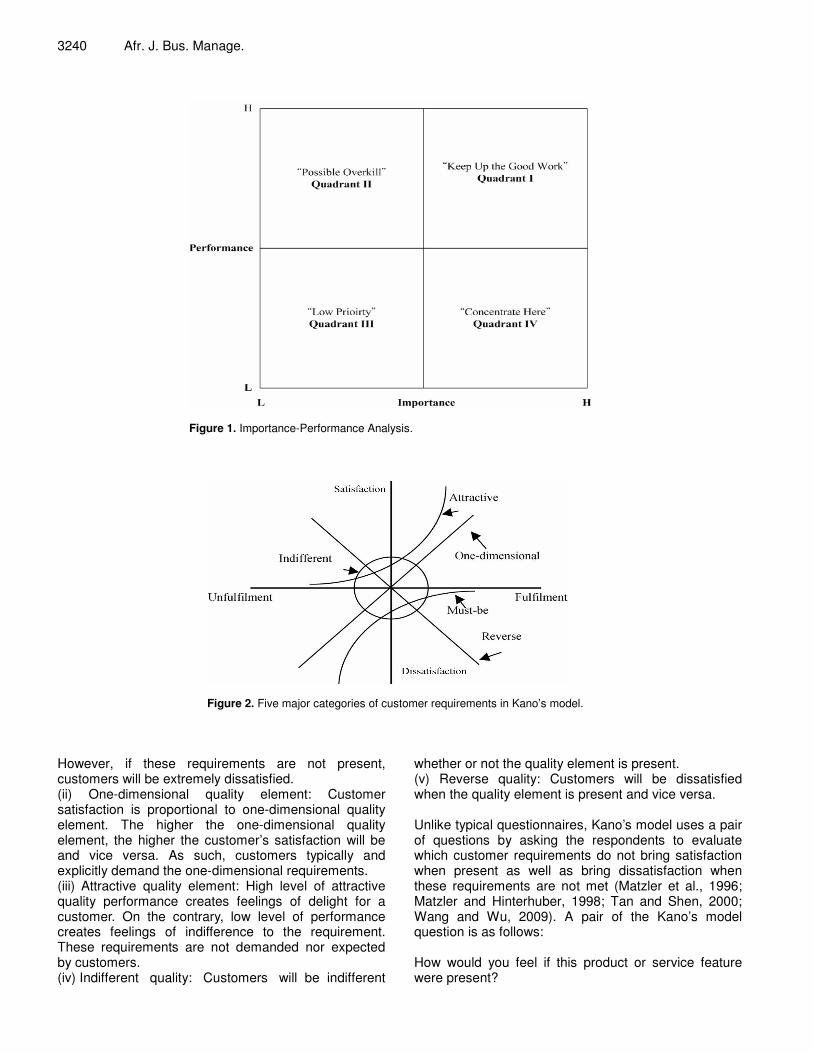
Wu et al. 3239 based marketing strategies (Joppe et al., 2001; Eskildsen and Kristensen, 2006; Shieh and Wu, 2009). More importantly, IPA is able to identify the most important attributes to the customer with the highest impact on customer satisfaction and, simultaneously, the low perfor-mance attributes required to be improved immediately (Matzler et al., 2003; Deng et al., 2008). Importance-performance analysis, constructed by a two-dimensional matrix, uses importance as an x-axis and performance as a y-axis to form four quadrants as shown in Figure 1.
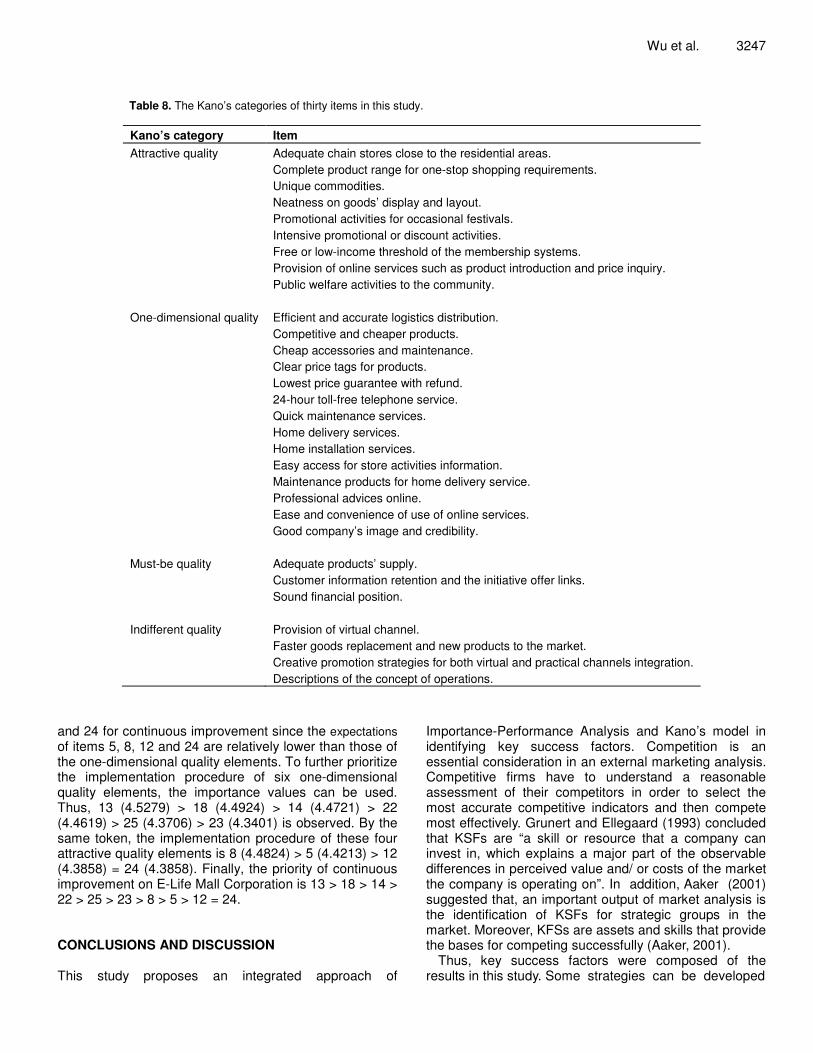
These four quadrants consist of “keep up the good work” (Quadrant I), “possible overkill” (Quadrant II), “low priority” (Quadrant III) and “concentrate here” (Quadrant IV) (Daniels and Marion, 2006; Deng et al., 2008; Wu and Shieh, 2009). Specifically, attributes located in Quadrant I have both high performance and high importance and are viewed as the opportunities to achieve or maintain competitiveness for organizations. Quadrant II has high performance but low importance, which indicates that the resources committed to these attributes are excessive and should be deployed elsewhere. Quadrant III has the characteristics of both low performance and low importance, and these attributes do not require additional efforts. Finally, attributes in Quadrant IV with low performance but high importance are considered as major weaknesses for an organization. As a conse-quence, immediate attention for improvement is required. The focal point is that the inability to identify the attributes in Quadrant IV might result in low customer satisfaction. In fact, immediate improvement efforts should be placed in the highest priority when major weaknesses are iden-tified, while attributes in Quadrant I regarded as major strengths should be maintained, leveraged and heavily promoted (Daniels and Marion, 2006; Deng et al., 2008; Wu et al., 2008). KANO’S MODEL Kano’s model based on the two-factor theory of job satisfaction by Herzberg is a very useful diagram to identify which customer requirements of a particular product or service might bring more proportional satisfaction to customers (Tan and Shen, 2000; Kuo, 2004; Tontini, 2007). That is, the one-dimensional (linear) view of quality for a particular product or service cannot be always explained (Wang and Wu, 2009). In fact, a product or service might induce a variety of distinct types of satisfaction or dissatisfaction depending upon whether customer needs are fulfilled completely, met partially, or unserved (Martensen and Gronholdt, 2001). Based on Kano’s model, customer requirements can be classified into five categories (Figure 2) (Gitlow, 1998; Kuo, 2004; Busacca and Padula, 2005): (i) Must-be quality element: The must-be requirements fulfill the basic functions of a product. Customers consider these requirements as prerequisites if present.
3240 Afr. J. Bus. Manage.
Figure 1. Importance-Performance Analysis.
Figure 2. Five major categories of customer requirements in Kano’s model.
However, if these requirements are not present, customers will be extremely dissatisfied. (ii) One-dimensional quality element: Customer satisfaction is proportional to one-dimensional quality element. The higher the one-dimensional quality element, the higher the customer’s satisfaction will be and vice versa. As such, customers typically and explicitly demand the one-dimensional requirements. (iii) Attractive quality element: High level of attractive quality performance creates feelings of delight for a customer. On the contrary, low level of performance creates feelings of indifference to the requirement. These requirements are not demanded nor expected by customers. (iv) Indifferent quality: Customers will be indifferent
whether or not the quality element is present. (v) Reverse quality: Customers will be dissatisfied when the quality element is present and vice versa. Unlike typical questionnaires, Kano’s model uses a pair of questions by asking the respondents to evaluate which customer requirements do not bring satisfaction when present as well as bring dissatisfaction when these requirements are not met (Matzler et al., 1996; Matzler and Hinterhuber, 1998; Tan and Shen, 2000; Wang and Wu, 2009). A pair of the Kano’s model question is as follows: How would you feel if this product or service feature were present?

Wu et al. 3241 Table 1. Kano’s interpretation table. Absent question response
Present question response
Delighted Expect it and like it No feeling Live with it Do not like it Delighted Questionable Attractive Attractive Attractive One-dimensional Expect it and like it Reverse Indifference Indifference Indifference Must-be No feeling Reverse Indifference Indifference Indifference Must-be Live with it Reverse Indifference Indifference Indifference Must-be Do not like it Reverse Reverse Reverse Reverse Questionable
Table 2. A hybrid Kano-questionnaire. Select only one option
in each row Do not like it Live with it No feeling Expect it
and like it Delight
Product feature
With it 1 2 3 4 5 Without it 1 2 3 4 5
How would you feel if this product or service feature were not present? For each question, there are five answers to choose from, namely: (1) delight, (2) expect it and like it, (3) no feeling, (4) live with it and (5) do not like it (Gitlow, 1998; Wang and Wu, 2009). When the data have been collected, Table 1 is used to classify the present/not present data from each respondent into a Kano’s category. To determine a product or service feature in an appropriate Kano’s category from a group of respondents, a formula is depicted as follows (Gitlow, 1998): Kano’s category = maximum (A, O, M) if A + O + M > I + Q + R or = maximum (I, Q, R) if A + O + M ≤ I + Q + R Where, A, O, M, I, Q and R represent attractive, one-dimensional, must-be, indifferent, questionable and reverse quality elements, respectively. Chen and Su (2006) have proposed a Kano-CKM model to discover the customer knowledge by developing a hybrid Kano-questionnaire which integrates a five-level Likert scale and Kano’s classification questionnaire as shown in Table 2. For instance, “delight” corresponds to “extremely important” with the weight of five, while “do not like it” corresponds to “unimportant” with the weight of one. This hybrid Kano-questionnaire enables the management to concurrently collect both the numerical data with five levels and classification information on the same survey. The major advantage of applying this hybrid Kano-questionnaire is that a product or service feature can be classified into an appropriate Kano’s category and be
analyzed by some statistical methods to identify some significant factors if some demographic information is provided. An integrated approach of Kano’s model and IPA Vavra (1997) used self-stated or explicit importance and implicitly derived importance from IPA to form a two-dimensional importance grid to identify three satisfaction factors. The self-stated importance is to ask each respondent to evaluate the importance of a particular item based on a Likert scale, while the derived importance is to derive the importance value for each item such as multiple regression, structural equation modeling, or partial correlation (Deng et al., 2008). Three satisfaction factors as shown in Figure 3 include basic attributes (expected or must-be), one-dimensional performance attributes with either high importance or low importance and exciting attributes (unexpected or delightful) (Matzler and Sauerwein, 2002; Busacca and Padula, 2005). Two grids are required in order to classify each item into one of the three satisfaction factors and one of the four quadrants. Importance-Performance Analysis is to identify the strength or weakness of a particular item, while explicit and implicit importance grids are to further analyze the satisfaction of this particular item statistically.
In this study, an integrated approach of Kano’s model and IPA is proposed to identify the strength or weakness and the satisfaction factor simultaneously for a particular item by the same questionnaire. In fact, a hybrid Kano-questionnaire proposed by Chen and Su (2005) can be implemented in an IPA to replace the self-stated importance. Since the importance of this hybrid Kano- questionnaire is determined and perceived by the respondents, the importance-axis is then renamed as

3242 Afr. J. Bus. Manage.
Figure 3. Three satisfaction factors by explicit and implicit importance.
Figure 4. The perceived Importance-Performance Analysis.
perceived importance-axis shown in Figure 4. The survey of gathering the needed information was shown in Table 3. Each service feature can be plotted in one of the four quadrants by using “how do you feel if a particular service feature of E-Life Mall Corporation were present” and “how do you evaluate the performance of this particular service feature of E-Life Mall Corporation.” Moreover, when a service feature has been classified into one of the four quadrants, the appropriate Kano’s category can be evaluated by using “how do you feel if a particular service feature of E-Life Mall Corporation was present” and “how do you feel if a particular service feature of E-Life Mall
Corporation was not present.” A CASE STUDY A case study of applying the proposed approach model in identifying key success factors of E-Life Mall Corporation is illustrated here. A questionnaire was developed based on the related references including Onkvisit and Shaw (1981), Chen (2004), Chang (2005) and Kotler (2006). There are seven constructs with thirty items, shown in Table 4, in this questionnaire including channel strategy,

Wu et al. 3243
Table 3. A typical questionnaire used to perceive the importance-performance analysis.
How do you feel if this particular service feature of E-life Mall Corporation was present?
How do you feel if this particular service feature of E-life Mall Corporation was not present?
How do you evaluate the performance of this particular service feature of E-life Mall Corporation?
Quick maintenance service
Delight Expect it and like it No feeling Live with it Do not like it
Delight Expect it and like it No feeling Live with it Do not like it
Very satisfactory Satisfactory Neutral Dissatisfactory Very dissatisfactory
commodity strategy, promotion strategy, price competitiveness, after-sale service quality, information systems service and corporate image. Table 3 is a typical questionnaire used in this study. For each item, a pair of questions was asked if this particular item was present and if this particular item was not present. The information of the perceived importance for each item is from the question “if this particular item was present”. The selections of “delight”, “expect it and like it”, “no feeling”, “live with it” and “do not like it” can be transformed into numerical figures of 5, 4, 3, 2 and 1, respectively, based on the hybrid Kano-questionnaire. In addition, the performance for each item was evaluated by a Likert-type five-point scale, where 1 and 5 represent ‘very dissatisfactory’ and ‘very satisfactory’, respectively.
The survey was conducted from July 22 - August 4 in 2007 in Taichung City, Taiwan. A total of 197 valid questionnaires were received and the valid return rate was 93.8%. The reliability of the survey was measured by Cronbach’s α and the numerical figures of the seven constructs and overall reliabilities in perceived importance and performance of E-Life Mall Corporation were provided in Table 5. The construct validity was supported by factor loading, while the structure in factor analysis went well with the structure of the questionnaire by the Kaiser-Meyer-Olkin statistic of 0.873 and Bartlett’s test of
sphericity with 2χ = 3593.246 (P-value = 0.000). In the
survey, some demographic information such as gender, age, occupation, income and visit frequency per week are depicted in Table 6. The mean values of perceived importance and performance of E-Life Mall Corporation are summarized in Table 7.
The major strengths and weaknesses of E-Life Mall Corporation in critical success factors are depicted in Figure 5. Items 1, 3, 11, 15, 19, 20, 21, 27 and 29 are located in Quadrant I, and these nine critical success factors are the major strengths possessed by E-Life Mall Corporation. In contrast to the major strengths, items 5, 8, 12, 13, 14, 18, 22, 23, 24 and 25 are placed in Quadrant IV, which indicate that E-Life Mall Corporation does not perform well in these ten critical success factors from the customers’ viewpoints. In order to penetrate the marketplace, E-Life Mall Corporation needs to invest
more resources to improve these ten critical success factors in higher priority. By further taking into account the Kano’s category for each item, Table 8 summarizes the specific information and Figure 6 provides the integrated information of IPA and the type of quality based on Kano’s category. As such, both Quadrants I and II are viewed as strengths. In order to gain competitiveness, items belonging to attractive quality should be placed in the highest priority, while one-dimensional quality items and must-be quality items should be placed in second and third priority, respectively. If many items are classified into the same Kano’s category, the perceived importance can become the “weight” to differentiate the items. In contrast to the strengths, Quadrants III and IV are considered as the weaknesses. Under such circumstances, must-be quality items are the most important items to be improved. The sequence is M > O > A. By observing Figure 6 and Table 8, items 1, 3, 11, 15, 19, 20, 21, 27 and 29 are viewed as the major strengths of E-Life Mall Corporation. In addition, items 1, 11 and 29 are attractive quality elements, whereas the others are one-dimensional quality elements. In this case, items 1, 11 and 29 are the three highest elements to be implemented. To further rank the priority, the importance values of these three items can be used, that is, 11 (4.4772) > 29 (4.4619) > 1 (4.4264). When these three attractive quality elements are implemented, the next step is to implement one-dimensional quality elements. For the fact that items 3, 15, 19, 20, 21 and 27 belong to one-dimensional quality element, the sequence can be determined by the importance values. Thus, 20 (4.5990) > 19 (4.4619) > 27 (4.4365) > 15 (4.4315) > 3 (4.3959) > 21 (4.3452) is obtained. Therefore, the priority of excelling operational excellence of E-Life Mall Corporation is 11 > 29 > 1 > 20 > 19 > 27 > 15 > 3 > 21.
The items falling in Quadrant II belong to possible overkill with low importance but high performance. For the fact that these items are considered as the next competitive advantages, the firm should avoid committing excessive resources on these items. In this quadrant, item 10 is the attractive quality element, while item 28 belongs to the must-be quality element and items

3244 Afr. J. Bus. Manage.
Table 4. Thirty items in the questionnaire based on seven constructs. Construct Item Store management strategy Adequate chain stores close to the residential areas.
Adequate products supply. Efficient and accurate logistics distribution. Provision of virtual channel.
Commodity strategy Complete product range for one-stop shopping requirements.
Faster goods replacement and new products to the market. Unique commodities. Neatness on goods’ display and layout.
Promotion strategy Creative promotion strategies for both virtual and practical channels integration.
Promotional activities for occasional festivals. Intensive promotional or discount activities. Free or low-income threshold of the membership systems.
Price competitiveness Competitive and cheaper products.
Cheap accessories and maintenance. Clear price tags for products. Lowest price guarantee with refund.
After-sale service quality 24-hour toll-free telephone service.
Quick maintenance services. Home delivery services. Home installation services. Easy access for store activities information. Maintenance products for home delivery service.
Information systems service Professional advices online.
Provision of online services such as product introduction and price inquiry. Ease and convenience of use of online services. Customer information retention and the initiative offers’ links.
Corporate image Good company’s image and credibility.
Sound financial position. Public welfare activities to the community. Descriptions of the concept of operations.
Table 5. The reliabilities measured by Cronbach’s α. Construct Perceived importance Performance Store management strategy 0.705 0.789 Commodity strategy 0.738 0.772 Promotion strategy 0.775 0.722 Price competitiveness 0.764 0.832 After-sale service quality 0.810 0.792 Information systems service 0.833 0.903 Corporate image 0.756 0.839 Overall reliability 0.940 0.941

Wu et al. 3245
Table 6. The demographic information from the survey.
Item Classification Number of times Percentage (%) Gender Male 100 50.8
Female 97 49.2 Age group 20 and below 9 4.6
21 - 30 106 53.8 31 - 40 58 29.4 41 - 50 8 4.1 51 - 60 13 6.6 61 and above 3 1.5
Occupation
Manufacturing
53
26.9
IT industry 8 4.1 Finance and insurance 30 15.2 Service industry 30 15.2 Industry, commerce and trade 14 7.1 Student 30 15.2 Public servant 14 7.1 Liberal industry 2 1.0 Other 16 8.1
Income
20,000 and below
41
20.8
20,001 – 40,000 98 49.7 40,001 – 60,000 32 16.2 60,001 – 80,000 25 12.7 80,001 – 100,000 1 0.5
Visit frequency per week
Zero or one
173
87.8
Two or three 22 11.2 Six and above 2 1.0
Table 7. The mean values of perceived importance and performance of E-Life Mall Corporation.
Service item Perceived importance Performance 1 4.4264 3.5787 2 4.3299 3.2538 3 4.3959 3.2944 4 3.9949 3.0863 5 4.4213 3.1371 6 4.0457 3.1066 7 4.1371 3.1066 8 4.4822 3.2589 9 4.1421 3.3096 10 4.1320 3.4619 11 4.4772 3.4061 12 4.3858 3.2335 13 4.5279 3.0761 14 4.4721 3.1168 15 4.4315 3.3655 16 4.2487 3.0863

3246 Afr. J. Bus. Manage.
Table 7. Cont’d
17 4.2690 3.1320 18 4.4924 3.0660 19 4.4619 3.4061 20 4.5990 3.6193 21 4.3452 3.2792 22 4.4619 3.2132 23 4.3401 3.0355 24 4.3858 3.1168 25 4.3706 3.0863 26 4.1523 3.1218 27 4.4365 3.7665 28 4.2792 3.5076 29 4.4619 3.4569 30 4.0660 3.6193
Grand mean 4.3391 3.2768
Figure 5. The perceived Importance-Performance Analysis of E-Life Mall Corporation. 9 and 30 are indifferent quality elements. Therefore, the priority of the next competitive advantages for E-Life Mall Corporation is 10 (4.1320) > 28 (4.2792) > 9 (4.1421) > 30 (4.0660). The items classified into Quadrant III are in low priority with both low importance and performance. These items belong to the minor weaknesses which should be improved after the major weaknesses identified in Quadrant IV. In this quadrant, items 2 and 26 are must-be quality elements, items 16 and 17 belong to one-dimensional quality elements, item 7 is attractive quality element and items 4 and 6 are indifferent quality elements. Therefore, the sequence of improving minor
weaknesses for E-Life Mall Corporation is 2 (4.3299) > 26 (4.1523) > 17 (4.2690) > 16 (4.2487) > 7 (4.1371) > 6 (4.0457) > 4 (3.9949). Items 5, 8, 12, 13, 14, 18, 22, 23, 24 and 25 are located in Quadrant IV and they belong to the major weaknesses of E-Life Mall Corporation. By further observing the Kano’s classification in Table 8, items 5, 8, 12 and 24 are attractive quality elements, and items 13, 14, 18, 22, 23 and 25 are one-dimensional quality elements. In this case, there is no any must-be quality element. Thus, the focus begins with one-dimensional quality elements. That is, items 13, 14, 18, 22, 23 and 25 have higher priorities than items 5, 8, 12,
Wu et al. 3247
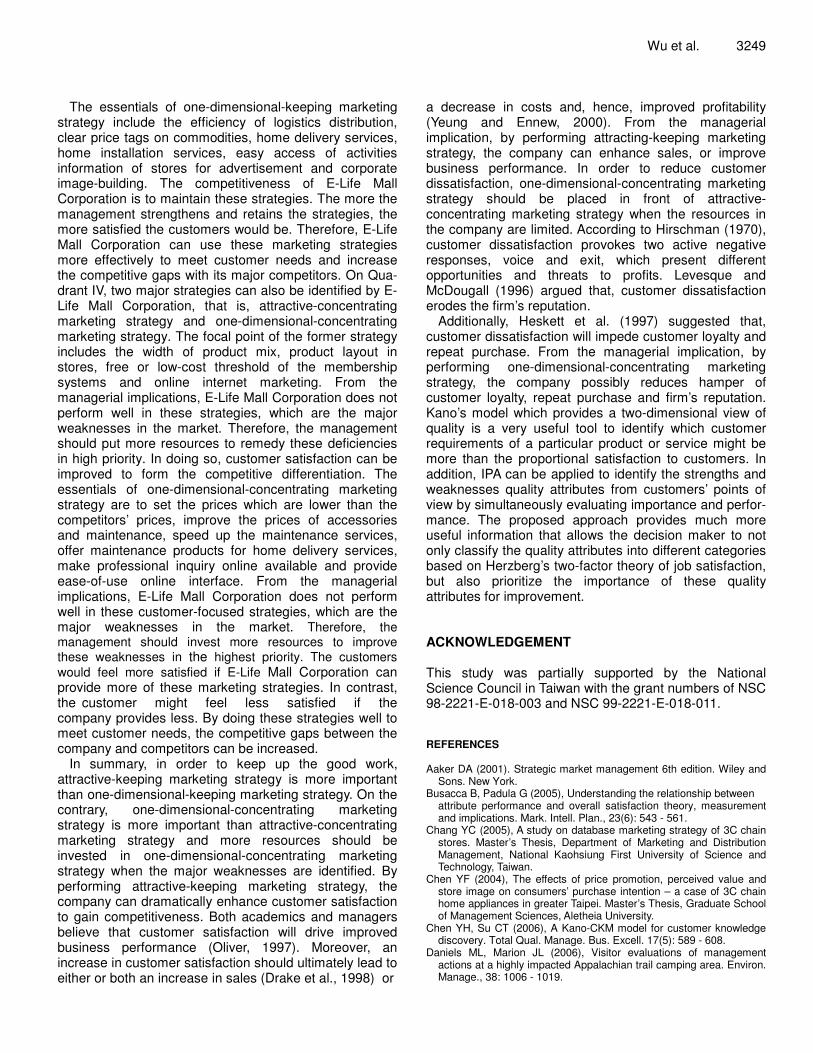
Table 8. The Kano’s categories of thirty items in this study. Kano’s category Item Attractive quality Adequate chain stores close to the residential areas.
Complete product range for one-stop shopping requirements. Unique commodities. Neatness on goods’ display and layout. Promotional activities for occasional festivals. Intensive promotional or discount activities. Free or low-income threshold of the membership systems. Provision of online services such as product introduction and price inquiry. Public welfare activities to the community.
One-dimensional quality
Efficient and accurate logistics distribution. Competitive and cheaper products. Cheap accessories and maintenance. Clear price tags for products. Lowest price guarantee with refund. 24-hour toll-free telephone service. Quick maintenance services. Home delivery services. Home installation services. Easy access for store activities information. Maintenance products for home delivery service. Professional advices online. Ease and convenience of use of online services. Good company’s image and credibility.
Must-be quality
Adequate products’ supply. Customer information retention and the initiative offer links. Sound financial position.
Indifferent quality
Provision of virtual channel. Faster goods replacement and new products to the market. Creative promotion strategies for both virtual and practical channels integration. Descriptions of the concept of operations.
and 24 for continuous improvement since the expectations of items 5, 8, 12 and 24 are relatively lower than those of the one-dimensional quality elements. To further prioritize the implementation procedure of six one-dimensional quality elements, the importance values can be used. Thus, 13 (4.5279) > 18 (4.4924) > 14 (4.4721) > 22 (4.4619) > 25 (4.3706) > 23 (4.3401) is observed. By the same token, the implementation procedure of these four attractive quality elements is 8 (4.4824) > 5 (4.4213) > 12 (4.3858) = 24 (4.3858). Finally, the priority of continuous improvement on E-Life Mall Corporation is 13 > 18 > 14 > 22 > 25 > 23 > 8 > 5 > 12 = 24. CONCLUSIONS AND DISCUSSION This study proposes an integrated approach of
Importance-Performance Analysis and Kano’s model in identifying key success factors. Competition is an essential consideration in an external marketing analysis. Competitive firms have to understand a reasonable assessment of their competitors in order to select the most accurate competitive indicators and then compete most effectively. Grunert and Ellegaard (1993) concluded that KSFs are “a skill or resource that a company can invest in, which explains a major part of the observable differences in perceived value and/ or costs of the market the company is operating on”. In addition, Aaker (2001) suggested that, an important output of market analysis is the identification of KSFs for strategic groups in the market. Moreover, KFSs are assets and skills that provide the bases for competing successfully (Aaker, 2001).
Thus, key success factors were composed of the results in this study. Some strategies can be developed

3248 Afr. J. Bus. Manage.
Figure 6. The information of Kano’s category for each item under perceived Importance-Performance Analysis.
based on Figure 6, in that Quadrant I kept up the good work. As such, two major strategies can be identified by E-Life Mall Corporation, namely attractive-keeping mar-keting strategy and one-dimensional-keeping marketing strategy. The focal point of the former strategy is to keep the intensity of distribution of stores, the number of activi-ties or discount schemes for promotion and the public welfare activities to the community. From the managerial
implications, the competitiveness of E-Life Mall Corporation comes from maintaining these strategies in the highest priority. Therefore, the management of E-Life Mall Corporation should pay much attention to strengthen and retain these strategies to solidify the competitive advantages. Moreover, by maintaining these strategies, customer satisfaction would be improved drastically to become the competitive differentiation.
The essentials of one-dimensional-keeping marketing strategy include the efficiency of logistics distribution, clear price tags on commodities, home delivery services, home installation services, easy access of activities information of stores for advertisement and corporate image-building. The competitiveness of E-Life Mall Corporation is to maintain these strategies. The more the management strengthens and retains the strategies, the more satisfied the customers would be. Therefore, E-Life Mall Corporation can use these marketing strategies more effectively to meet customer needs and increase the competitive gaps with its major competitors. On Qua-drant IV, two major strategies can also be identified by E-Life Mall Corporation, that is, attractive-concentrating marketing strategy and one-dimensional-concentrating marketing strategy. The focal point of the former strategy includes the width of product mix, product layout in stores, free or low-cost threshold of the membership systems and online internet marketing. From the managerial implications, E-Life Mall Corporation does not perform well in these strategies, which are the major weaknesses in the market. Therefore, the management should put more resources to remedy these deficiencies in high priority. In doing so, customer satisfaction can be improved to form the competitive differentiation. The essentials of one-dimensional-concentrating marketing strategy are to set the prices which are lower than the competitors’ prices, improve the prices of accessories and maintenance, speed up the maintenance services, offer maintenance products for home delivery services, make professional inquiry online available and provide ease-of-use online interface. From the managerial implications, E-Life Mall Corporation does not perform well in these customer-focused strategies, which are the major weaknesses in the market. Therefore, the management should invest more resources to improve these weaknesses in the highest priority. The customers would feel more satisfied if E-Life Mall Corporation can provide more of these marketing strategies. In contrast, the customer might feel less satisfied if the company provides less. By doing these strategies well to meet customer needs, the competitive gaps between the company and competitors can be increased.
In summary, in order to keep up the good work, attractive-keeping marketing strategy is more important than one-dimensional-keeping marketing strategy. On the contrary, one-dimensional-concentrating marketing strategy is more important than attractive-concentrating marketing strategy and more resources should be invested in one-dimensional-concentrating marketing strategy when the major weaknesses are identified. By performing attractive-keeping marketing strategy, the company can dramatically enhance customer satisfaction to gain competitiveness. Both academics and managers believe that customer satisfaction will drive improved business performance (Oliver, 1997). Moreover, an increase in customer satisfaction should ultimately lead to either or both an increase in sales (Drake et al., 1998) or
Wu et al. 3249 a decrease in costs and, hence, improved profitability (Yeung and Ennew, 2000). From the managerial implication, by performing attracting-keeping marketing strategy, the company can enhance sales, or improve business performance. In order to reduce customer dissatisfaction, one-dimensional-concentrating marketing strategy should be placed in front of attractive-concentrating marketing strategy when the resources in the company are limited. According to Hirschman (1970), customer dissatisfaction provokes two active negative responses, voice and exit, which present different opportunities and threats to profits. Levesque and McDougall (1996) argued that, customer dissatisfaction erodes the firm’s reputation.
Additionally, Heskett et al. (1997) suggested that, customer dissatisfaction will impede customer loyalty and repeat purchase. From the managerial implication, by performing one-dimensional-concentrating marketing strategy, the company possibly reduces hamper of customer loyalty, repeat purchase and firm’s reputation. Kano’s model which provides a two-dimensional view of quality is a very useful tool to identify which customer requirements of a particular product or service might be more than the proportional satisfaction to customers. In addition, IPA can be applied to identify the strengths and weaknesses quality attributes from customers’ points of view by simultaneously evaluating importance and perfor-mance. The proposed approach provides much more useful information that allows the decision maker to not only classify the quality attributes into different categories based on Herzberg’s two-factor theory of job satisfaction, but also prioritize the importance of these quality attributes for improvement. ACKNOWLEDGEMENT This study was partially supported by the National Science Council in Taiwan with the grant numbers of NSC 98-2221-E-018-003 and NSC 99-2221-E-018-011. REFERENCES Aaker DA (2001). Strategic market management 6th edition. Wiley and
Sons. New York. Busacca B, Padula G (2005), Understanding the relationship between
attribute performance and overall satisfaction theory, measurement and implications. Mark. Intell. Plan., 23(6): 543 - 561.
Chang YC (2005), A study on database marketing strategy of 3C chain stores. Master’s Thesis, Department of Marketing and Distribution Management, National Kaohsiung First University of Science and Technology, Taiwan.
Chen YF (2004), The effects of price promotion, perceived value and store image on consumers’ purchase intention – a case of 3C chain home appliances in greater Taipei. Master’s Thesis, Graduate School of Management Sciences, Aletheia University.
Chen YH, Su CT (2006), A Kano-CKM model for customer knowledge discovery. Total Qual. Manage. Bus. Excell. 17(5): 589 - 608.
Daniels ML, Marion JL (2006), Visitor evaluations of management actions at a highly impacted Appalachian trail camping area. Environ. Manage., 38: 1006 - 1019.

3250 Afr. J. Bus. Manage. Day GS, Wensley R (1988). Assessing advantage: a framework for
diagnosing competitive superiority. J. Mark., 52: 1 - 20. Deng WJ, Kuo YF, Chen WC (2008). Revised Importance-Performance
Analysis: three-factor theory and benchmarking. Serv. Ind. J., 28(1): 37 - 51.
de Waal AA, Gerritsen-Medema G (2006). Performance management analysis: a case study at a Dutch municipality. Int. J. Productivity Perform. Manage., 55(1): 26 - 39.
Drake C, Gwynne A, Waite N (1998). Barclays life customer satisfaction and loyalty tracking survey: a demonstration of customer loyalty research in practice. Int. J. Bank Mark., 16: 287 - 292.
Eskildsen JK, Kristensen K (2006). Enhancing Importance-Performance Analysis. Int. J. Productivity Perform. Manage., 55(1): 40 - 60.
Gitlow HS (1998). Innovation on demand. Qual. Eng. 11(1): 79 - 89. Grunert KG, Ellegaard C (1993). The concept of key success factors:
theory and method, in Baker M. (ed.) Perspectives on Marketing Management. Vol 3. John Wiley. Chichester.
Heskett JL, Sasser WE, Schlesinger Jr LA (1997). The service profit chain. The Free Press. New York.
Hirschman AO (1970). Exit, voice, and loyalty. Harvard Business University Press. Cambridge, MA.
Joppe M, Martin DW, Waalen J (2001). Toronto’s image as a destination: a comparative importance and satisfaction analysis by origin of visitor. J. Travel Res., 39(3): 252 - 260.
Kotler P (2006). Marketing Management, 11th ed., Prentice Hall, New York.
Kuo Y-F (2004). Integrating Kano’s model into web-community service quality. Total Qual. Manage., 15(7): 925 - 939.
Leidecker JK, Bruno AV (1987). CSF analysis and the strategy development process, in Taylor B. (ed.), Strategic planning and management handbook, 333-351. Van Nostrand: Rheinhold.
Levesque TJ, McDougall (1996). Customer dissatisfaction: the relationship between types of problems and customer response. Can. J. Adm. Sci., 13(3): 264 - 276.
Martensen A, Grønholdt L (2001). Using employee satisfaction measurement to improve people management: an adaptation of Kano's quality types. Total Qual. Manage. Bus. Excell., 12(7,8): 949 - 957.
Martilla JA, James JC (1977). Importance-Performance Analysis. J. Mark. 41(1): 77 - 79.
Matzler K, Hinterhuber HH, Bailom F, Sauerwein E (1996). How to
delight your customers. J. Prod. Band Manage., 5(2): 6 - 18. Matzler K, Hinterhuber HH (1998). How to make product development
projects more successful by integrating Kano’s model of customer satisfaction into quality function deployment. Technovation, 18(1): 25 - 38.
Matzler K, Sauerwein E (2002). The factor structure of customer satisfaction: an empirical test of the importance grid and the penalty-reward-contrast analysis. Int. J. Serv. Ind. Manage., 13(4): 314 - 332.
Matzler K, Sauerwein E, Heischmidt KA (2003). Importance-Performance Analysis revisited: the role of the factor structure of customer satisfaction. Serv. Ind. J., 23(2): 112 - 129.
Oliver RL (1997), Satisfaction: a behavioral perspective of the consumer. McGraw Hill. New York.
Onkvisit S, Shaw JJ (1981). Modifying the retail classification system for more timely marketing strategies. J. Acad. Mark. Sci., 9(4): 436 - 453.
Rochart JF (1979), Chief executives define their own data needs. Harv. Bus. Rev., 57(2): 81 - 93.
Shieh JI, Wu HH (2009). Applying Importance-Performance Analysis to compare the changes of a convenient store. Qual. Quant., 43(3): 391 - 400.
Tan KC, Shen XX (2000). Integrating Kano’s model in the planning matrix of quality function deployment. Total Qual. Manage., 11(8): 1141 - 1151.
Tontini G (2007). Integrating the Kano model and QFD for designing new products. Total Qual. Manage. Bus. Excell., 18(6): 599 - 612.
Vavra TG (1997), Improving Your Measurement of Customer Satisfaction, ASQ Quality Progress, Milwaukee, WI.
Wang PC, Wu HH (2009). An integrated framework of ISO 10015 and quality function deployment on quality of human capital management. J. Statistics Manage. Syst., 12(2): 255 - 271.
Wu HH, Shieh JI, Pan WR (2008). Applying Importance-Performance Analysis to analyze service quality: a case of two coach companies. J. Inf. Optim. Sci., 29(6): 1203 - 1214.
Wu HH, Shieh JI (2009). The development of a confidence interval-based Importance-Performance Analysis by considering variability in analyzing service quality. Expert Syst. Appl., 36: 7040 - 7044.
Yeung MCH, Ennew CT (2000). From customer satisfaction to profitability. J. Strateg. Mark., 8: 313 – 326.