an innovative beneficial reclamation of flue gas
TRANSCRIPT

Int. J. Electrochem. Sci., 13 (2018) 5382 – 5395, doi: 10.20964/2018.06.04
International Journal of
ELECTROCHEMICAL SCIENCE
www.electrochemsci.org
An Innovative Beneficial Reclamation of Flue Gas
Desulfurization Brine Using Bipolar Membrane Electrodialysis
Technique
Min Xia, Chunsong Ye
*, Rong Cao, Haoyu Huang, Jianwei Huang
School of Power and Mechanical Engineering, Wuhan University, Wuhan 430072, Hubei, China *E-mail: [email protected]
Received: 9 August 2017 / Accepted: 21 March 2018 / Published: 10 May 2018
Flue gas desulfurization (FGD) brine containing high salinity poses a significant challenge to the
implementation of environmental policy in china. In this work, an innovative alternative approach of
bipolar membrane electrodialysis (BMED) technique has been proposed to effectively reuse this brine
by the acid and base production on the premise of zero emission requirements. The experimental
results demonstrate that the high acid and base concentrations in excess of 1.0 mol/L can be obtained
with the satisfactory desalination. Higher initial salt concentration shows nearly no significant change
on current efficiency, acid/base concentration and acid volume. Nevertheless, appropriate
concentration for ×2 of FGD brine is necessary and beneficial for acid/base production by the decrease
of energy consumption from 2.34 to 2.14 Kwh/kgNaOH. Additionally, the ions migration between Cl-
and SO42-
indicates high purity HCl with little H2SO4 contamination can be obtained if the initial salt
concentration of FGD brine is improved in the earlier acid production. In conclusion, BMED presents
a high potential for FGD brine treatment in view of environmentally friendly as well as attractive
economic benefit.
Keywords: flue gas desulfurization brine; bipolar membrane electrodialysis; acid/base production;
desalination
1. INTRODUCTION
Recently, environmental concerns for natural waters contamination by industrial brine are more
highly focused in industrialized nations [1]. With the issue of stricter environmental regulations,
guidelines and policies, especially the zero emission requirement (i.e. that no liquid may be discharged
to the environment) in China [2], effluent reclamation and reuse have received more and more
attention. Appropriate management of the stream is necessary and is identified as an opportunity to

Int. J. Electrochem. Sci., Vol. 13, 2018
5383
develop circular concepts to convert the waste into a resource for materials production. For example,
the reverse osmosis (RO) brine abundant in sodium chloride has been reported to reuse in chlorine
alkali industry as the production of chlorine and sodium hydroxide [3].
In thermal power plants, the hypersaline brine comes from the flue gas desulfurization (FGD)
process employing limestone-gypsum method [4] after the hydrocyclone separation of gypsum. The
brine has complex composition with high total dissolved solids (TDS) [5] containing primary elements
of Ca, Mg, S, Cl. Its composition distributions are strong depending on the type of coal burned and
limestone slurry cycled in desulfurizer [6].
The zero emission requirements for FGD brine disposal were mainly terminated by thermal
evaporation technique [7] with the purpose of crystallization for solid salt and fresh water recovery.
Although thermal treatment is technical available, it presents several limitations regarding economic
feasibility such as unacceptable investment and operation costs [8]. For that reason, electrically driven
membrane separation process using electrodialysis in combination of bipolar membranes (BMED)
would be a promising technology in terms of not only brine minimization but also increase of
reusability and recyclability of waste through chemical production alternative [9-10]. Once the reverse
voltage is imposed between the electrodes of BMED stack, the polarization process of the bipolar
membrane (BPM) will take place rapidly to split the water molecules into H+ and OH
- and this water
dissociation process is accelerated up to 50 million times compared to the rate in aqueous solution.
Therefore, the produced H+ and OH
- ions can be used to generate corresponding acid (HX) and base
(MOH) from salts (MX) [11] with the perfect separation by ion exchange membrane (i.e. anion across
the anion exchange membrane (AEM) impeded by the cation exchange membrane (CEM), cation
across CEM hindered by AEM). In comparison with traditional electrolytic electrodialysis (EED)
process for acid/base production through electrode reaction, the theoretical energy consumption for
BPM is much lower than that for electrode reaction. Furthermore, the BMED stack structure is more
compact with the high repeating unit number rather than only one from EED stack, which is beneficial
to improve acid/base productivity.
Currently, the BMED has various potential applications, mainly situated in chemical process
industry as well as in biotechnology [12]. In industrial brine treatment aspect, much applications of
BMED concentrate on RO brine reclamation [10-11, 13-15]. Ibáñez et al [14] applied the BMED to
produce the acid and base from RO brine and demonstrated it was technically feasible for the
production of 1.0 mol/L or higher concentrated acid/base with the current efficiency above 60%. Reig
et al [11] discussed the influence of initial salt and acid/base concentration to the energy consumption
and acid/base concentration. And further study has also been investigated [15] through integration of
nanofiltration for hardness removal and BMED for acid/base production. Approximately 1 mol/L
NaOH/HCl could be obtained using the constant voltage of 9 V with the energy consumption 2.66
Kwh/kgNaOH and current efficiency 77%. Other industrial brines such as glyphosate neutralization
liquor, spent caustic and textile wastewater [16-18] have also been reported using BMED for acid/base
production. However, regarding the FGD brine with high salt concentration, few works have been
involved in technical and economic feasibility so far.
In a perfect BMED process, water transport and co-ion leakage could be neglected with the salt
ions completely shifting into corresponding acid and base compartment, which means so long as the
Int. J. Electrochem. Sci., Vol. 13, 2018
5384
initial salt content in the salt compartment (the product of salt concentration and salt volume) and
initial acid/base volume in the acid/base compartment are fixed, we can deservedly infer the final acid
and base concentration in the solutions. In fact water transport and co-ion leakage always seriously
affect the acid/base production efficiency and the degree of desalination. In this work, the investigation
focused specifically on simulated brine from power plant FGD process for resourceful utilization. The
concentration times for simulated FGD brine was primarily evaluated with respect to the influence of
acid/base production, co-ion leakage, acid/base volume, anion migration, current efficiency and energy
consumption through maintaining the constant salt content.
2. EXPERIMENTAL
2.1. Materials and chemicals
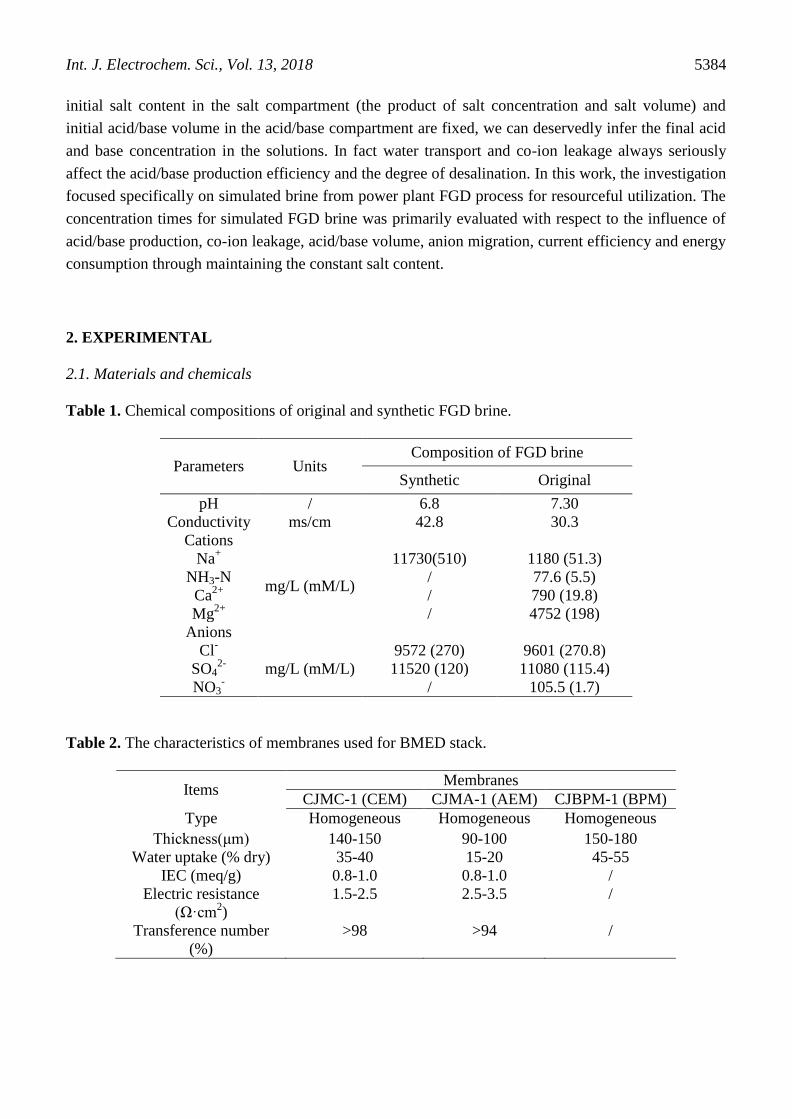
Table 1. Chemical compositions of original and synthetic FGD brine.
Parameters Units Composition of FGD brine
Synthetic Original
pH / 6.8 7.30
Conductivity ms/cm 42.8 30.3
Cations
Na+
mg/L (mM/L)
11730(510) 1180 (51.3)
NH3-N / 77.6 (5.5)
Ca2+
/ 790 (19.8)
Mg2+
/ 4752 (198)
Anions
Cl-
mg/L (mM/L)
9572 (270) 9601 (270.8)
SO42-
11520 (120) 11080 (115.4)
NO3- / 105.5 (1.7)
Table 2. The characteristics of membranes used for BMED stack.
Items Membranes
CJMC-1 (CEM) CJMA-1 (AEM) CJBPM-1 (BPM)
Type Homogeneous Homogeneous Homogeneous
Thickness(μm) 140-150 90-100 150-180
Water uptake (% dry) 35-40 15-20 45-55
IEC (meq/g) 0.8-1.0 0.8-1.0 /
Electric resistance
(Ω·cm2)
1.5-2.5 2.5-3.5 /
Transference number
(%)
>98 >94 /

Int. J. Electrochem. Sci., Vol. 13, 2018
5385
FGD brine was supplied by a power plant located in Guangdong province, China. Its chemical
compositions were summarized in Table 1. Considering Mg and Ca were predominance over cation
ions, these ions therefore should be removed first prior to BMED operation in order to avoid
membrane fouling and scaling [19]. For practical purposes and taking into account that the Ca and Mg
purification process was evaluated previously, the eliminated hardness ions could be replacement of
sodium [20]. Hence, the mixture of NaCl and Na2SO4 brines (shown in Table 1) simulating the
composition of original FGD brine to be used in the valorization as HCl, H2SO4 and NaOH by BMED
was prepared in the present work. The membranes used for the experiments were purchased from
Kejia Polymer Materials Co., Ltd, Hefei, China. And their characteristics were tabulated in Table 2.
Other reagents were all of analytical grade manufactured by Sinopharm Chemical Reagent Co., Ltd,
Shanghai, China.
2.2. Experimental description on BMED setup
Table 3. Experimental conditions for BMED running.
Run
Salt
concentrationa
Salt content Current
density
Acid
(base)
electrode
rinse
Flow
velocity
Batch 1 ×1 0.918 mol Na
+
0.486 mol Cl-
0.216 mol
SO42-
30 mA/cm2
600
mL
600 mL
0.3mol/L
Na2SO4
30 L/h
Batch 2 ×1.2
Batch 3 ×1.5
Batch 4 ×2
Batch 5 ×3 a represents the salt concentration relative to synthetic FGD brine.
A.T
EDBM stack—+
E.T
T,F
T,F
B.T
S.T
A
V
T,F,C,pH
Acid loop
Electrode
rinse loop
T,FSalt loop
Base loop
CEM AEM BPM CEM
SO42-
H2O
H+OH-
Cl-
Na+
SO42-
Cl-
Na+
Power
supply
Figure 1. Scheme diagram of the BMED setup and one cell trio configuration (T: temperature sensor,
F: flowmeter, pH: pH meter, C: conductivity sensor, A: ammeter, V: voltmeter, S.T: salt tank,
A.T: acid tank, B.T: base tank, E.T: electrode rinse tank, CEM: cation exchange membrane,
AEM, anion exchange membrane, BPM: bipolar membrane).

Int. J. Electrochem. Sci., Vol. 13, 2018
5386
Scheme diagram of the BMED setup with the closed loop model is presented in Fig 1. The
setup provided by Kejia Polymer Materials Co., Ltd, Hefei, China was composed of 16 pieces of
membranes in total alternated with CEM, AEM, BPM and CEM as one cell trio configuration. Both of
CEM ends were terminated by two electrodes made of titanium coated with ruthenium. The effective
area of each membrane was 189 cm2 with the dimension of 21 cm×9 cm. The compartments for
electrode rinse, acid, base and salt solution were separated by silicone partition net pacers with
thickness of 0.80 mm, and connected to four diaphragm pumps (0-50 L/h) to provide circulating power
of feed solution. A regulated CV/CC power supply with the specification of maximum permissible
voltage 60 V input and current 10 A output was applied to drive water dissociation. The specific
experiment conditions in this work were given in Table 3 with the constant salt content by changing
the initial salt concentration. Ideally, the concentration of both acidity and basicity would reach 1.53
mol/L. Prior to applying electric field for the BMED stack, each compartment should be cycled enough
time to eliminate visible bubbles existing in feed solution [21]. All the experiments were carried out in
the batch mode, upon the conductivity in the salt compartment decreased to 5 ms/cm, the experiment
was immediately interrupted as one batch.
2.3. Data analysis
In order to efficiently evaluate the economic feasibility of BMED for FGD brine reclamation,
current efficiency and energy consumption for acid/base production should be investigated in this
work. The current efficiency (η) means the proportion of theoretical charges that required for H+ or
OH- formation to the practical consumption, value of which is calculated by the following equation.
( )(%) 100t t 0 0zF C V C V
NIt
(1)
The energy consumption for yielded sodium hydroxide (E, kWh/kg) is calculated using the
integral formula, expressed in Eq. (2) t
0t t b
UItE
C V M (2)
where C0 and Ct are the concentration of OH- in the base compartment at time 0 and t (mol/L),
respectively, z is the absolute valence, Vt is the circulated base volume at time t (L), F is the Faraday
constant (96,500 C mol-1
), I is the current (A), N is the repeating unit numbers, U is the voltage drop
across the BMED stack (V) and Mb is the molecular weight of NaOH (40 g/mol).
Additionally, anion exchange membrane selectivity for chlorine and sulfate is also discussed in
this work according to the method introduced by Van der Bruggen et al[22]. The separation efficiency
between chlorine and sulfate could be obtained as follows
2 224 44
2 24 4
( ( ) / ( )) ( ( ) / ( ))( )
(1 ( ) / ( )) (1 ( ) / ( ))
SO SO Cl ClSO
Cl
SO SO Cl Cl
c t c o c t c oS t
c t c o c t c o
(3)
The value of 24SO
ClS
is in the range of -1 to 1. If the value was above 0 the current is primarily
loaded byCl , implying the migration is faster than 2
4SO , and vice versa.

Int. J. Electrochem. Sci., Vol. 13, 2018
5387
2.4. Analytical methods
The concentration of chloride in acid and salt compartments was determined by precipitation
titration method using silver nitrate solution. Sulfate was measured using ion chromatography (IC)
(DIONEX, ICS-2100). The corresponding acidity and basicity produced by BPM were obtained
through acid-base titration with phenolphthalein and methyl orange as indicator. The variation of pH
and conductivity of FGD brine in salt compartment were continuously monitored by pH meter
(Thermo Orion, 230A+) and conductivity meter (LEICI, PXSJ-216F), respectively. And the voltage
across the stack was directly recorded displayed on the screen supplied by the regulated CV/CC power
supply.
3. RESULTS AND DISCUSSION
3.1. Acid and base generation
Fig 2 shows the concentration variations of acid and base as the time elapses. It can be found
on increasing the operation time, both acid and base concentration are increased due to the continuous
water splitting on the intermediate catalyst layer of BPM.
10 20 30 40 50 60 70 800.2
0.4
0.6
0.8
1.0
1.2
Opearation time (min)
Co
nce
ntr
atio
n o
f ac
id o
r b
ase
(mo
l/L
)
Figure 2. The concentration variation of acid (solid) and base (half up) as a function of operation time.
The five batches results indicate there is an insignificant difference in acid or base
concentration with the statistical error bellow 3%. However, it can be seen the acidity is obviously
higher than that of base compartment at the time above 60 min, which presents the different trend
reported by previous works that acid concentration is lower due to the easy leakage of free H+ in
comparison to OH- from acid compartment to salt compartment [16]. This phenomenon could be
highly ascribed to the serious leakage of free H+ in acid compartment resulting in the competition of
free H+ and Na
+ in salt compartment across the cation exchange membrane (discussed in Section 3.2)
and the electroosmosis of water (discussed in Section 3.3). The final practical acidity and basicity

Int. J. Electrochem. Sci., Vol. 13, 2018
5388
yielded are much less than the theoretical value of 1.53 mol/L and commercial product, but are suitable
for resin regeneration [23], Ca and Mg removal and the pH adjustment instead of commercial purpose.
This reuse process can decrease the expense of acid-base outsourcing so as to create extra economic
benefit to offset the high cost of BMP.
3.2. Co-ions leakage of free H+ and OH
-
Co-ions leakage of free H+ and OH
- from AEM and CEM has historically been the problem for
getting high concentrated acid and base products since the intrinsic mobility of both ions are
considerably high. The transport number of both ions through ion exchange membrane increase with
the produced acid and base concentration which also lead to their low concentration in the acid and
base compartment [24], in particular for proton, the transport process could be easily implemented
among water molecules due to the so-called “tunnel transport mechanism” [14]. Fig 3 displays the
evolution of pH in the salt compartment with the different five batches. As seen from Fig 3, on
increasing the salt concentration (in the order of batch 1 to batch 5), the pH becomes more acidic. This
can be explained by the small initial salt volume to maintain the salt content giving rise to the high
proton concentration. Additionally, all the five experimental tests show the increasing trend on the pH
when the operation time above the region of 50-60 min. This phenomenon can be explained by the H+
transfer from salt compartment to base compartment. At the early stage of BMED running, the H+
concentration in the salt compartment from acid leakage is low in contrasted to Na+, the current is
mainly loaded by Na+, which induces to the accumulation of H
+ resulting in the decline of pH. With
the continuous decrease of Na+ due to desalination, the H
+ concentration becomes comparable to Na
+
and gradually dominates the transport process leading to the increase of pH.
In addition, the difference between free H+ in the acid compartment and OH
- in the base
compartment is further discussed. It should be noted the total acidity measured mainly consists of free
H+ and the proton from HSO4
-, nevertheless, the HSO4
- would not participate in the leakage process.
Fig 3(b) shows the fraction of SO42-
and HSO4- as a function of different total sulfate (ST) in the acid
compartment with the varied pH ranges.
0 10 20 30 40 50 60 70 801.0
1.5
2.0
2.5
3.0
3.5
4.0
Minimum area
Operation time (min)
pH
batch 1
batch 2
batch 3
batch 4
batch 5
(a)

Int. J. Electrochem. Sci., Vol. 13, 2018
5389
0.0
0.2
0.4
0.6
0.8
1.0
0.0 0.5 1.0 1.5 2.0 2.5 3.0 3.5pH
effective area
Fra
ctio
n o
f io
n s
pec
ies
ST0.04mol/L
ST0.1mol/L
ST0.2mol/L
ST0.3mol/L
HSO4
-
SO4
2-
(b)
0 10 20 30 40 50 60 70 800.00
0.05
0.10
0.15
0.20
Maximum area
Dif
fere
nce
bet
wee
nO
H- an
d f
ree
H+
Operation time (min)
batch 1
batch 2
batch 3
batch 4
batch 5
(c)
Figure 3. (a) The evolution of pH in the salt compartment at different operation conditions. (b) The
distribution of SO42-
and HSO4- in the acid compartment with the pH varied. (c) The trend of
concentration difference between OH- and free H
+ during BMED process.
The effective area means the running time of BMED setup in the range of 10 to 80 min. It
could be found the proportion of HSO4- in this area is in excess of 90% of the total ST in the acid
solution. Hence, free H+ participated in leakage in the acid compartment can be approximatively
expressed as the difference value between total acidity and ST.
It can be seen in Fig 3(c) the concentration gap between OH- and free H
+ during the all BMED
processes presents the parabola shape, where the maximum area is occurred at 50-60 min as well,
highly confirmed to the minimum area appeared at 50-60 min in Fig 3(a), suggesting the H+ transport
from salt to base compartment
3.3 Electroosmosis and forward osmosis
Water transport between salt and acid/base compartment is another important factor that limit
the increase of acid and base concentration. Water molecules in the solution can be migration together
Int. J. Electrochem. Sci., Vol. 13, 2018
5390
with SO42-
, Cl- and Na
+ ions as the hydrated ion form, this phenomenon can be called “electroosmosis
effect” [25]. On the other hand, the forward osmosis effect driven by the osmotic pressure resulted
from concentration gradient between acid/base and salt solution is also related to the volume change.
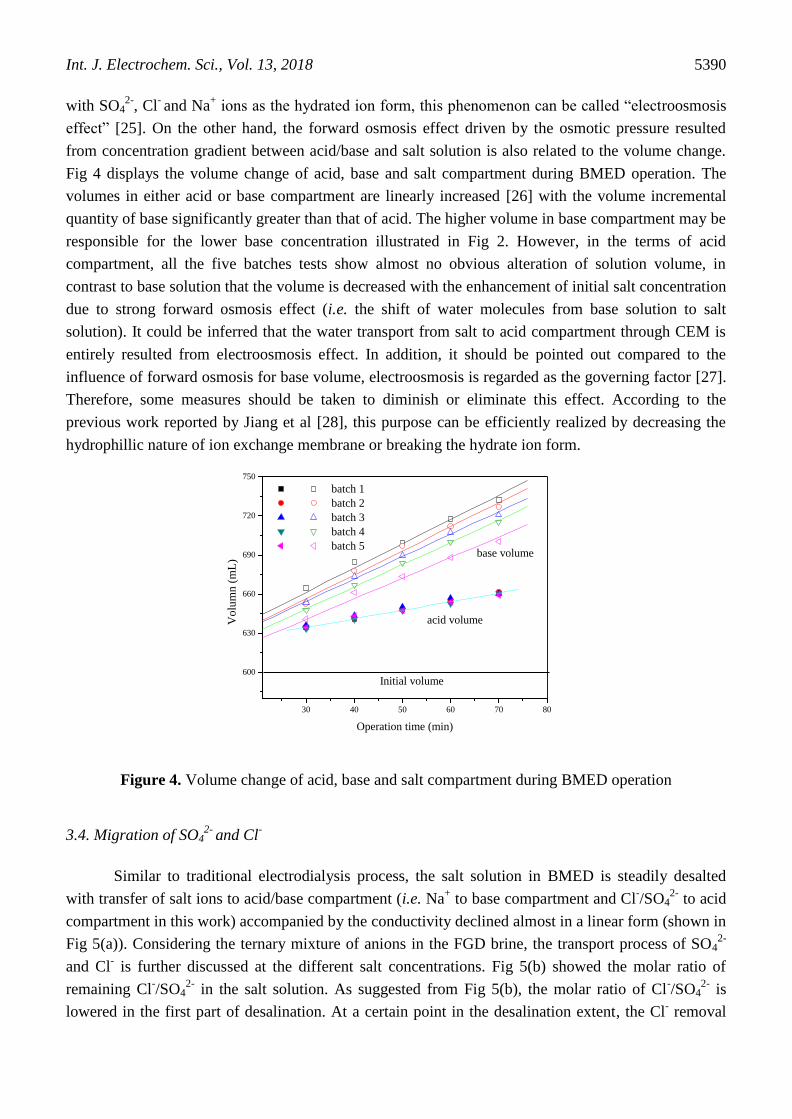
Fig 4 displays the volume change of acid, base and salt compartment during BMED operation. The
volumes in either acid or base compartment are linearly increased [26] with the volume incremental
quantity of base significantly greater than that of acid. The higher volume in base compartment may be
responsible for the lower base concentration illustrated in Fig 2. However, in the terms of acid
compartment, all the five batches tests show almost no obvious alteration of solution volume, in
contrast to base solution that the volume is decreased with the enhancement of initial salt concentration
due to strong forward osmosis effect (i.e. the shift of water molecules from base solution to salt
solution). It could be inferred that the water transport from salt to acid compartment through CEM is
entirely resulted from electroosmosis effect. In addition, it should be pointed out compared to the
influence of forward osmosis for base volume, electroosmosis is regarded as the governing factor [27].
Therefore, some measures should be taken to diminish or eliminate this effect. According to the
previous work reported by Jiang et al [28], this purpose can be efficiently realized by decreasing the
hydrophillic nature of ion exchange membrane or breaking the hydrate ion form.
30 40 50 60 70 80
600
630
660
690
720
750
base volume
batch 1
batch 2
batch 3
batch 4
batch 5
Vo
lum
n (
mL
)
Operation time (min)
Initial volume
acid volume
Figure 4. Volume change of acid, base and salt compartment during BMED operation
3.4. Migration of SO42-
and Cl-
Similar to traditional electrodialysis process, the salt solution in BMED is steadily desalted
with transfer of salt ions to acid/base compartment (i.e. Na+ to base compartment and Cl
-/SO4
2- to acid
compartment in this work) accompanied by the conductivity declined almost in a linear form (shown in
Fig 5(a)). Considering the ternary mixture of anions in the FGD brine, the transport process of SO42-
and Cl- is further discussed at the different salt concentrations. Fig 5(b) showed the molar ratio of
remaining Cl-/SO4
2- in the salt solution. As suggested from Fig 5(b), the molar ratio of Cl
-/SO4
2- is
lowered in the first part of desalination. At a certain point in the desalination extent, the Cl- removal

Int. J. Electrochem. Sci., Vol. 13, 2018
5391
rate starts to decrease and a relative bigger part of the current is loaded by SO42-
, resulting in an
increase in the remaining Cl-/SO4
2- ratio in the salt solution and such variations are reinforced at higher
initial salt concentration. With respect to the lower Cl-/SO4
2- ratio in earlier stage for acid production, it
should be attributed to the higher diffusion coefficients of Cl- in comparison with SO4
2- and the higher
concentration of Cl- in the initial solution, therefore, concentration polarization becomes less
pronounced for Cl-
[29]. In order to effectively evaluate the separation efficiency between Cl- and
SO42-
, the selectivity coefficient is applied (Fig 5(c)). In batch 5, the selectivity coefficient24SO
ClS
is up to
0.6 at first 30 min far away from the batch 1. As the BMED operation proceeded, the selectivity
coefficient gradually decreases. It can be inferred the HCl in the acid compartment can be first
produced when the initial salt concentration is enhanced, suggesting the high purity HCl with little
H2SO4 contamination in the earlier acid production.
0 10 20 30 40 50 60 70 800
15
30
45
60
75
90
Co
nd
uct
ivit
y (
ms/
cm)
Operation time (min)
batch 1
batch 2
batch 3
batch 4
batch 5
(a)
0 15 30 45 60 75 900.5
1.0
1.5
2.0
2.5
3.0
3.5
4.0
Conductivity (ms/cm)
Rat
io o
f C
l- an
d S
O2-
4
batch 1
batch 2
batch 3
batch 4
batch 5
Fin
ial ratio
Initial ratio
(b)

Int. J. Electrochem. Sci., Vol. 13, 2018
5392
0 10 20 30 40 50 60 70 80 900.00
0.15
0.30
0.45
0.60
0.75
0.90
Operation time (min)
Sel
ecti
vit
y c
oef
fici
ent
batch 1
batch 2
batch 3
batch 4
batch 5
(c)
Figure 5. (a) The variation of conductivity, (b) molar ratio of remaining Cl-/SO4
2- and (c) separation
efficiency of Cl- and SO4
2- in the salt compartment at different operation time.
3.5. Current efficiency and energy consumption
Current efficiency and energy consumption are the two important parameters which determine
the feasibility of any electrochemical process for higher process efficiency. Any system having higher
current efficiency with lower energy consumption is considered to be the most favorable [30]. The
current efficiency of OH- and energy consumption of NaOH production at the five batch experiments
are shown in Fig 6. It is observed the all current efficiency of BMED stack decreases near-
unanimously along with the increase of operation time without significant difference (the difference of
the five batches at time 10 min is caused by measuring error of volume). Once the operation time
surpass the critical threshold (i.e. 40 min), the current efficiency drops sharply. This can be explained
by the accentuated OH- leakage and the migration of H+ from salt compartment neutralizing base
product.
In the case of energy consumption, low initial salt concentration such as batch 1 shows the
higher energy consumption than the other batches. The increase in the energy consumption was mainly
used to overcome the electrical resistance to generate joule heat [31]. When the salt concentration is
increased to ×2 of original compositions (batch 4), the energy consumption for generating 1.05 mol/L
base is 2.14 Kwh/kg, significantly lower than the 2.34 Kwh/kg from the original FGD brine (batch 1)
and 2.66 Kwh/kg reported by Reig et al [15] in the treatment of seawater desalination brines. Further
enhancing the salt concentration shows only 0.07 Kwh/kg reduction (batch 5). In a word, appropriate
concentration for ×2 of FGD brine is beneficial for acid/base production. Just like current efficiency,
the critical threshold at 40 min has also been found in Fig 6(b). The higher energy consumption in the
subsequent acid/base production can be mainly owed to the co-ion leakage since the influence of
solution electrical resistance can be neglected due to the high conductivity (Fig 5(a)). Therefore,
developing a new ion exchange membrane that can effectively impede H+/OH
- leakage is the key point
to further decrease the energy consumption.

Int. J. Electrochem. Sci., Vol. 13, 2018
5393
10 20 30 40 50 60 7060
65
70
75
80
85
90
batch 1
batch 2
batch 3
batch 4
batch 5
Cu
rren
t ef
fici
ency
of
OH
- (%
)
Operation time (min)
(a)
10 20 30 40 50 60 701.6
1.8
2.0
2.2
2.4
2.6
batch 1
batch 2
batch 3
batch 4
batch 5
En
erg
y c
on
sum
pti
om
(K
wh
/kg
(NaO
H))
Operation time (min)
(b)
Figure 6. (a) Time dependency of (a) current efficiency and (b) energy consumption at different
operation conditions (arrows represent the trend)
4. CONCLUSION
The flue gas desulfurization (FGD) brine in the thermal power plant has a high salinity mainly
composed of NaCl and Na2SO4 after softening operation. In order to response environmental policy of
zero discharge and take full advantage of this waste salt, an novel-innovative bipolar membrane
electrodialysis (BMED) technique is selected and the application feasibility of simulated FGD brine
treated by a lab-scale BMED system in terms of technical and economical parameters was evaluated in
the work. The results indicate the BMED can be considered a technically feasible option for producing
greater than 1 mol/L acid/base that can be potentially used for resin regeneration. Under the fixed salt
content, initial FGD concentration shows different influence for the parameters such as acid/base
production, co-ion leakage, water transfer, ion migration, current efficiency and energy consumption.

Int. J. Electrochem. Sci., Vol. 13, 2018
5394
Suitable concentration for ×2 of FGD brine can be responsible for the decrease of production cost from
2.34 to 2.14 Kwh/kgNaOH. And the energy consumption in the later acid/base production is strongly
resulted from co-ion leakage. The results of this study have crucial implications in the case of resource
utilization of FGD brine. Further study regarding real FGD brine is desired to prove in the next work.
ACKNOWLEDGEMENTS
The authors are thankful for the support of Wuhan University, China for supply of equipment and
chemicals needed to complete this work. This research has been supported by National Natural Science
Foundation of China (51602228).
Reference
1. K. Ghyselbrecht, A. Silva, B. Van Der Bruggen, K. Boussu, B. Meesschaert, L. Pinoy, J. Environ.
Manage., 140 (2014) 69.
2. S.C. Ma, J. Chai, G. D. Chen, W. J. Yu, Renew. Sust. Energ. Rev., 58 (2016) 1143.
3. S. Casas, C. Aladjem, J. L. Cortina, E. Larrotcha, L. V. Cremades, Solvent Extra. Ion Exc., 30
(2012) 322.
4. V. G. Gude, Renew. Sust. Energ. Rev., 45 (2015) 52.
5. G. D. Enoch, W. F. Van Den Broeke, W. Spiering, J. Membrane. Sci., 87 (1994) 191.
6. Y. H. Huang, P. K. Peddi, C. Tang, H. Zeng, X. Teng, Sep. Purif. Technol., 118 (2013) 690.
7. R. L. Mcginnis, N. T. Hancock, M. S. Nowosielski-slepowron, G. D. Mcgurgan, Desalination, 312
( 2013) 67.
8. J. Morillo, J. Usero, D. Rosado, H. E. Bakouri, A. Riaza, F. Bemaola, Desalination, 336 (2014) 32.
9. J. R. Davis, Y. Chen, J. C. Baygents, J, Farrell, Acs Sustain. Chem. Eng., 3 (2015) 2337.
10. C. Fernandez-gonzalez, A. Dominguez-ramos, R. Ibanez, Y. Chen, A. Irabien, Desalination, 406 (
2017) 16.
11. M. Reig, S. Casas, C. Valderrama, O. Gibert, J. L. Cortina, Desalination, 398 (2016) 87.
12. K. Ghyselbrecht, M. Huygebaert, B Van Der Bruggen, R. Ballet, B. Meesschaert, L. Pinoy,
Desalination, 318 (2013) 9.
13. M. Badruzzaman, J. Oppenheimer, S. Adham, M. Kumar, J. Membrane Sci., 326 (2009) 392.
14. R. Ibanez, A. Perez-gonzalez, P. Gomez, A. M. Urtiaga, I. Ortiz, Desalination, 309 (2013) 165.
15. M. Reig, S. Casas, O. Gibert, C. Valderrama, J. L. Cortina, Desalination, 382 (2016) 13.
16. J. Shen, J. Huang, L. Liu, W. Ye, J. Lin, B. Van Der Bruggen, J. Hazard. Mater., 260 (2013) 660.
17. Y. Wei, C. Li, Y. Wang, X. Zhang, Q. Li, T. Xu, Sep. Purif. Technol., 86 ( 2012) 49.
18. J. LIN, W. YE, J. HUANG, B. Ricard, B. Van Der Bruggen, Acs Sustain. Chem. Eng., 3 (2015)
1993.
19. A. T. K. Tran, P. Mondal, J. Y. Lin, B. Meesschaert, L. Pinoy, B. Van Der Bruggen, J. Membrane.
Sci., 473 (2015) 118.
20. S. Casas, C. Aladjem, E. Larrotcha, G. Oriol, C. Valderrama, J. L. Cortina, J. Chem. Technol. Biot.,
89 (2014) 872.
21. C. Li, G. Wang, H. Feng, T. He, Y. Wang, T. Xu, Sep. Purif. Technol., 156 (2015) 391.
22. B. Van Der Bruggen, A. Koninckx, C. Vandecasteele, Water Res., 38 (2004) 1347.
23. V. Mavrov, H. Chmiel, B. Heitele, F. Rogener, Desalination, 124 (1999) 205.
24. X. Wang, Y. Wang, X. Zhang, T. Xu. Bioresource technol., 125 (2012) 165.
25. J. S. Jaime-ferrer, E. Couallier, P. Viers, G. Durand, M. Rakib, J. Membrane Sci., 325 (2008) 528.
26. M. Mier, R. Ibaez, I. Ortiz, Sep. Purif. Technol., 59 (2008) 197.
27. C. Jiang, Y. Wang, Z. Zhang, T. Xu, J. Membrane. Sci., 450 (2014) 323.
28. C. Jiang, Q. Wang, Y. Li, T. Xu, Desalination, 365 (2015) 204.

Int. J. Electrochem. Sci., Vol. 13, 2018
5395
29. A. Galama, G. Daubaras, O. Burheim, H. H. M. Rijnaarts, J. W. Post, J. Membrane Sci., 452
(2014) 219.
30. L. Bazinet, D. Ippersiel, C. Gendron, J. Beaudry, B. Mahdavi, J. Amiot, F. Lamarche, J. Membrane
Sci., 173 (2000) 201.
31. K. Venugopal, S. Dharmalingam. Desalination, 344 (2014) 189.
© 2018 The Authors. Published by ESG (www.electrochemsci.org). This article is an open access
article distributed under the terms and conditions of the Creative Commons Attribution license
(http://creativecommons.org/licenses/by/4.0/).